Design Library
New Merch Designs
T-Shirts
Vectors
Trending Merch Designs
PNGs & SVGs
Mockups
T-Shirt PSD Templates
Explore Designs
KDP Designs
Posters
Mugs
Phone Cases
Tote Bags
Pillows
Design Tools
Merch Designer
New!
Mockup Generator
AI Design Generator
Image Vectorizer
Quote Generator
T-Shirt Maker (Old)
Resources
Merch Digest
Blog
Help Center
Learn About Merch
Feedback
Corporate Solutions
Enterprise
API Access
Pricing
Loading...
Sign Up
Login
Merch Vectors
grafico
Design Library
New Merch Designs
T-Shirts
Vectors
Trending Merch Designs
PNGs & SVGs
Mockups
T-Shirt PSD Templates
Explore Designs
KDP Designs
Posters
Mugs
Phone Cases
Tote Bags
Pillows
Design Tools
Merch Designer
New!
Mockup Generator
AI Design Generator
Image Vectorizer
Quote Generator
T-Shirt Maker (Old)
Resources
Merch Digest
Blog
Help Center
Learn About Merch
Feedback
Corporate Solutions
Enterprise
API Access
PLANS
Merch Vectors
grafico
35988 grafico Vector Designs for T-Shirts and merch
Download & buy editable grafico AI Vector Graphics Designs for T shirts, Phone Cases, Book Covers and other Merch
Sort by
Most relevant
Sponsored results by
Get 15% off with code: VEXELS15
Show more
Print ready
for Merch
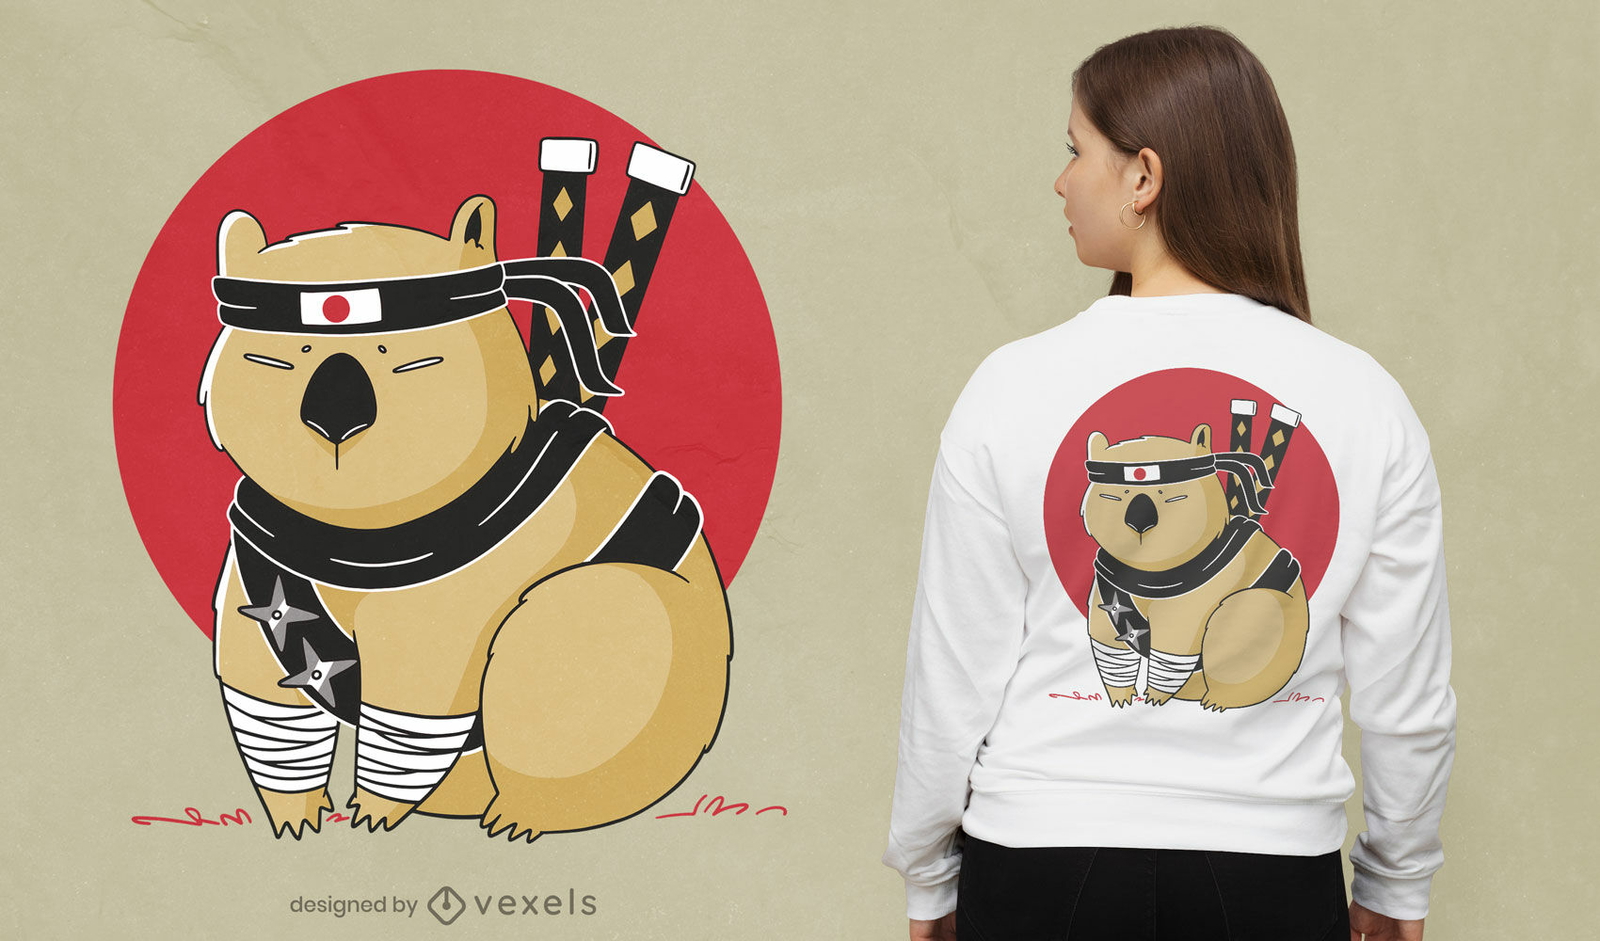
Ninja wombat cartoon t-shirt design
Choose a folder
All favorites
Create new
Save
Ninja wombat cartoon t-shirt design
Print ready
for Merch
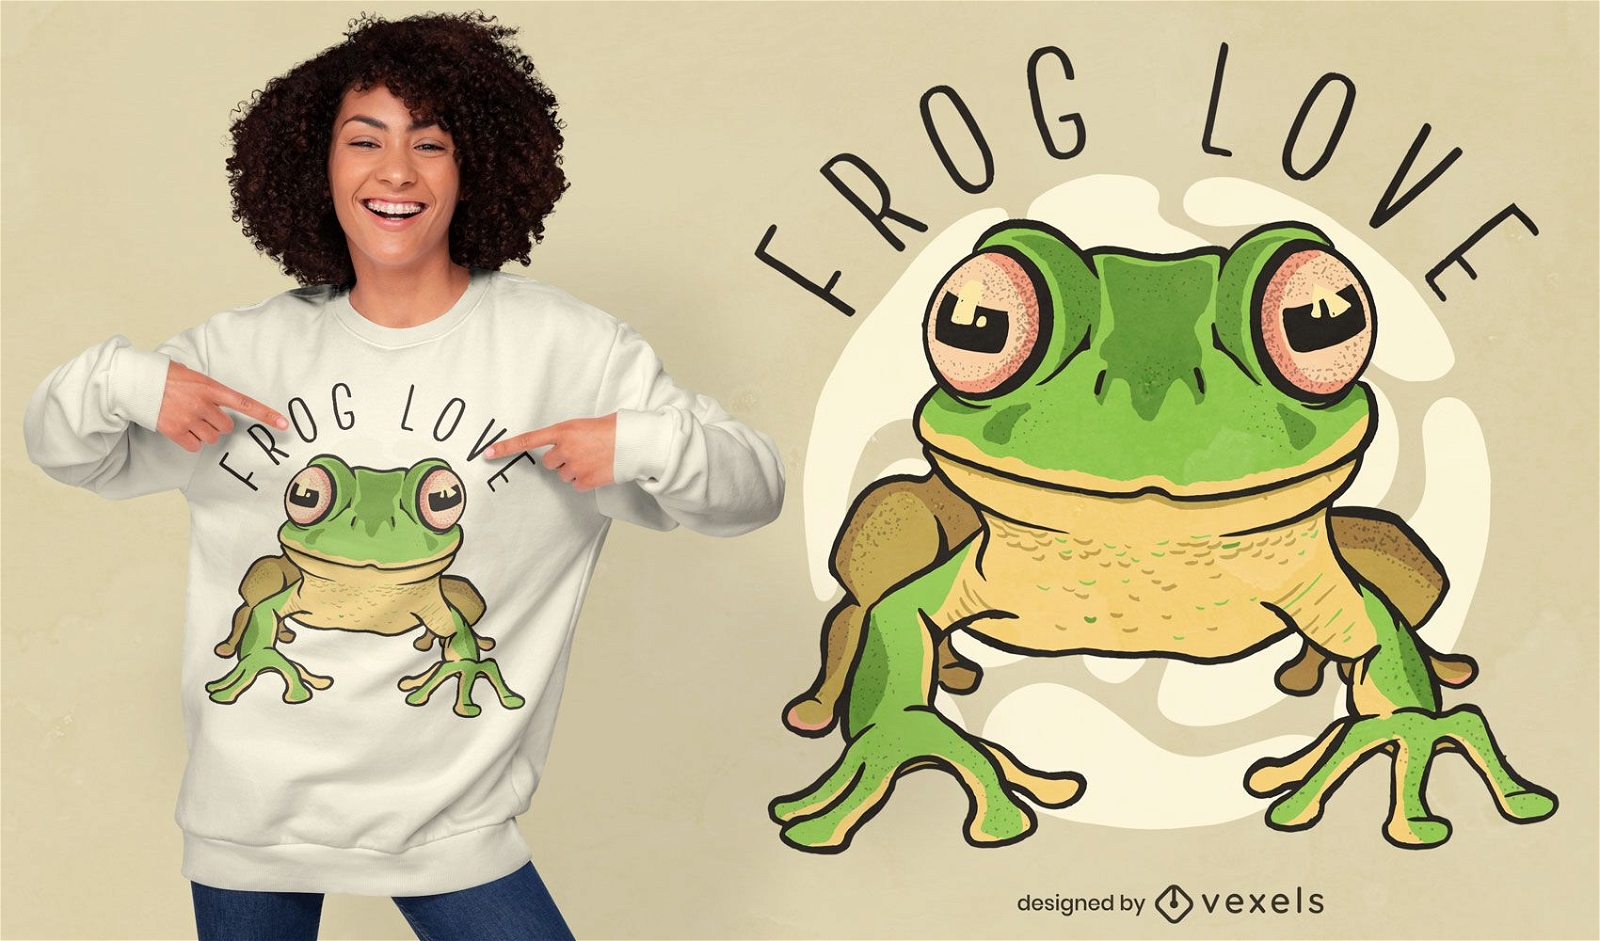
Love frogs t-shirt design
Choose a folder
All favorites
Create new
Save
Love frogs t-shirt design
Print ready
for Merch
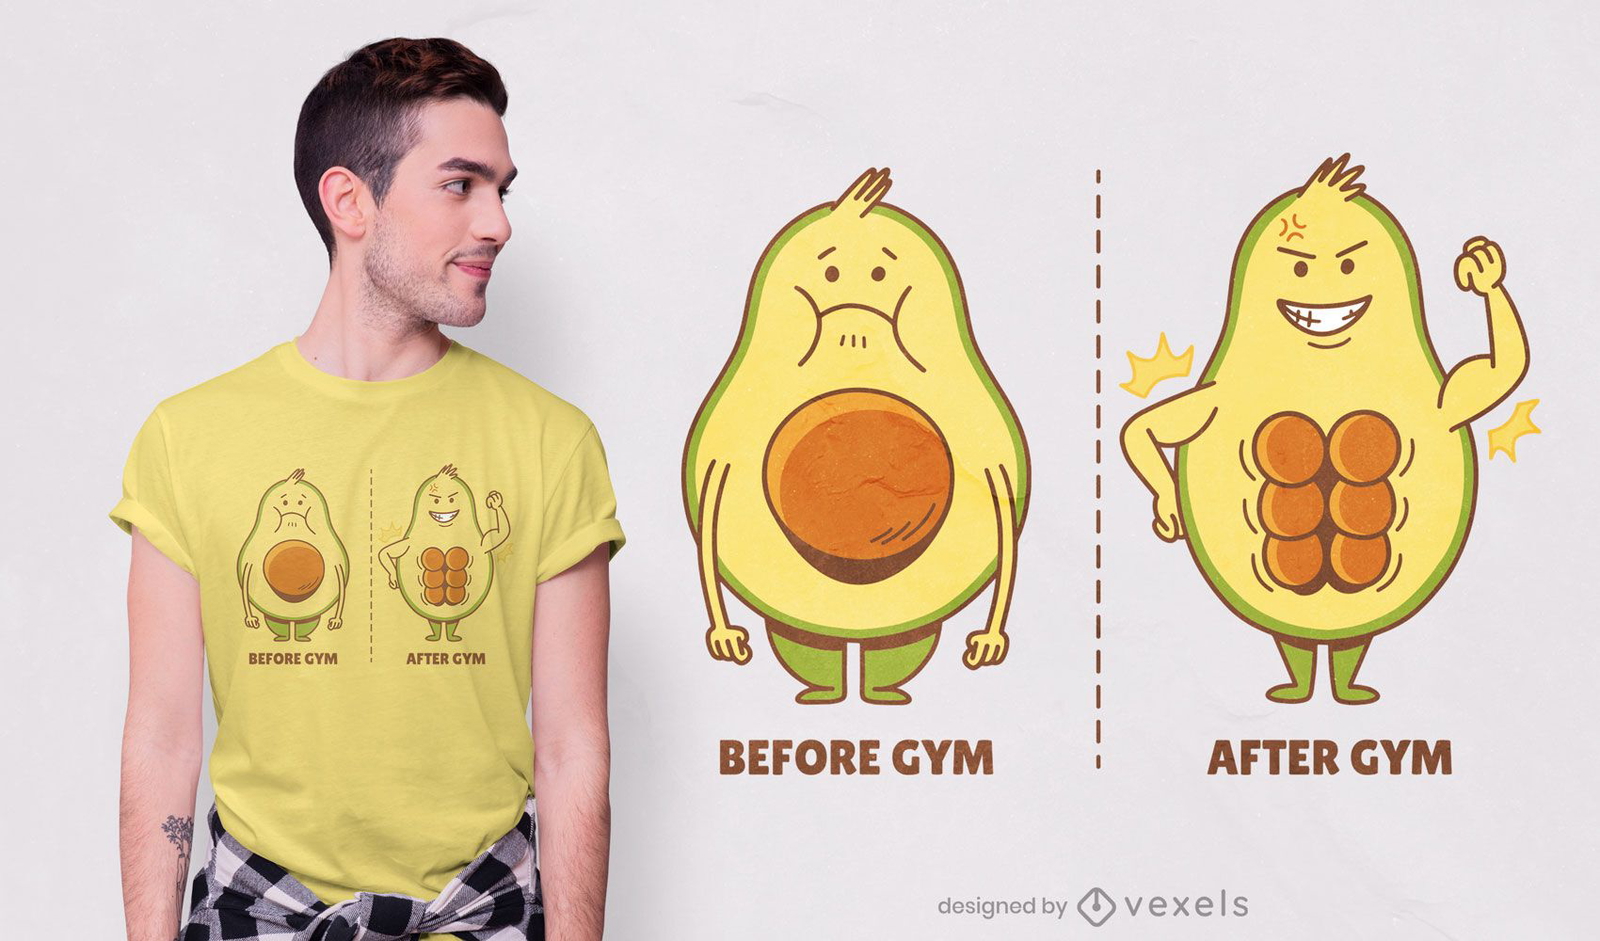
Avocado gym t-shirt design
Choose a folder
All favorites
Create new
Save
Avocado gym t-shirt design
Print ready
for Merch
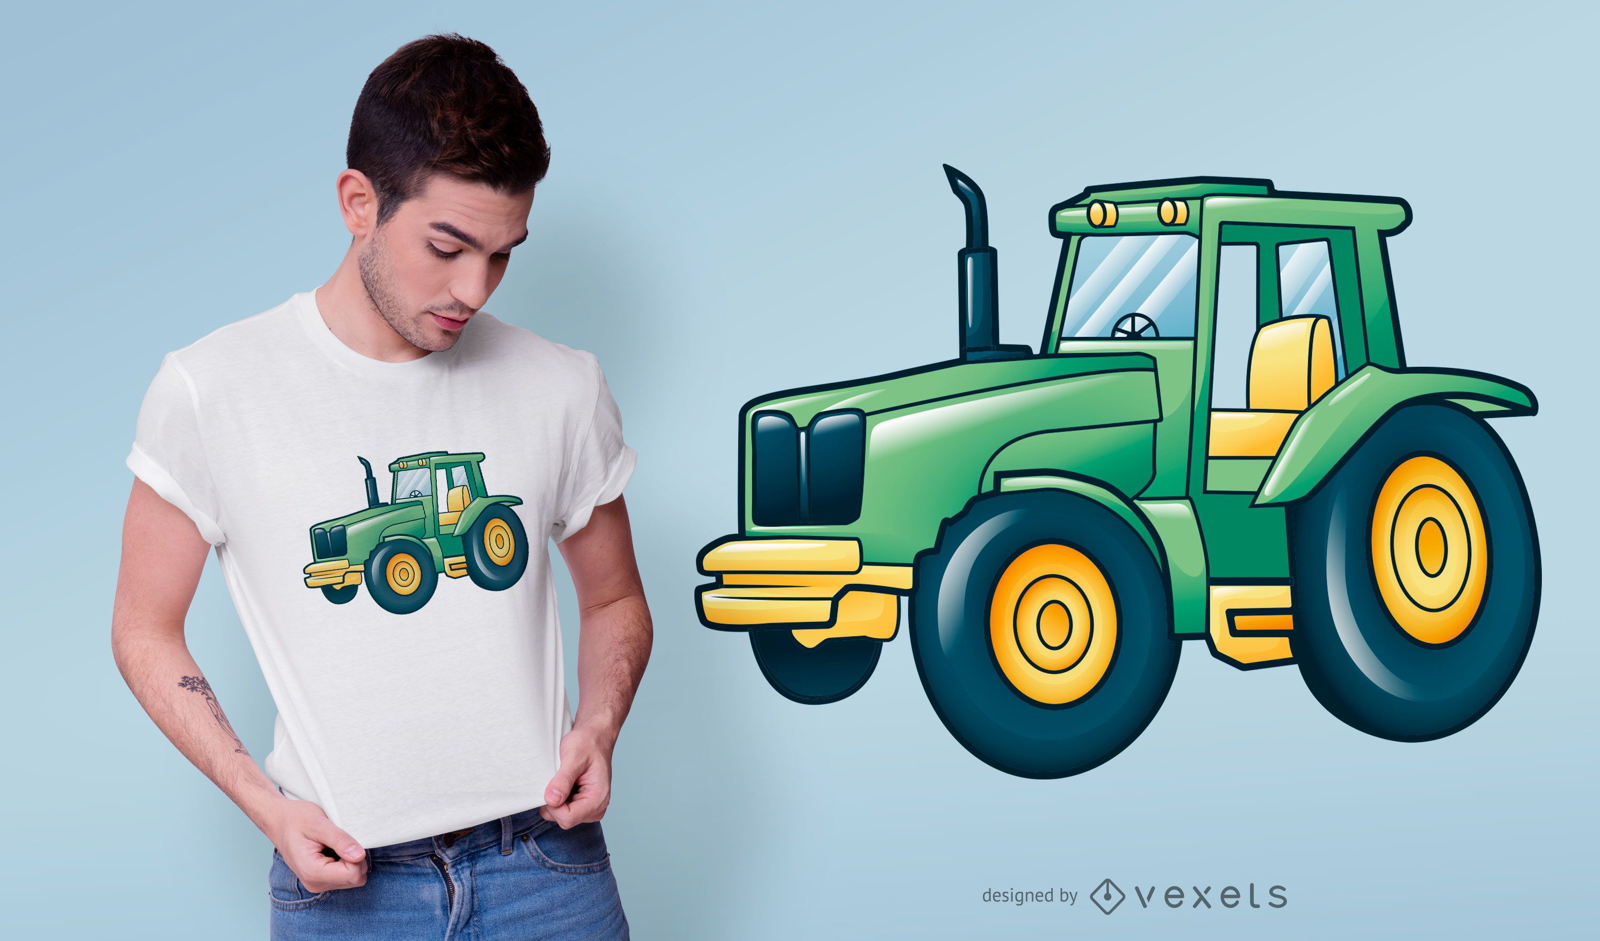
Tractor t-shirt design
Choose a folder
All favorites
Create new
Save
Tractor t-shirt design
Print ready
for Merch
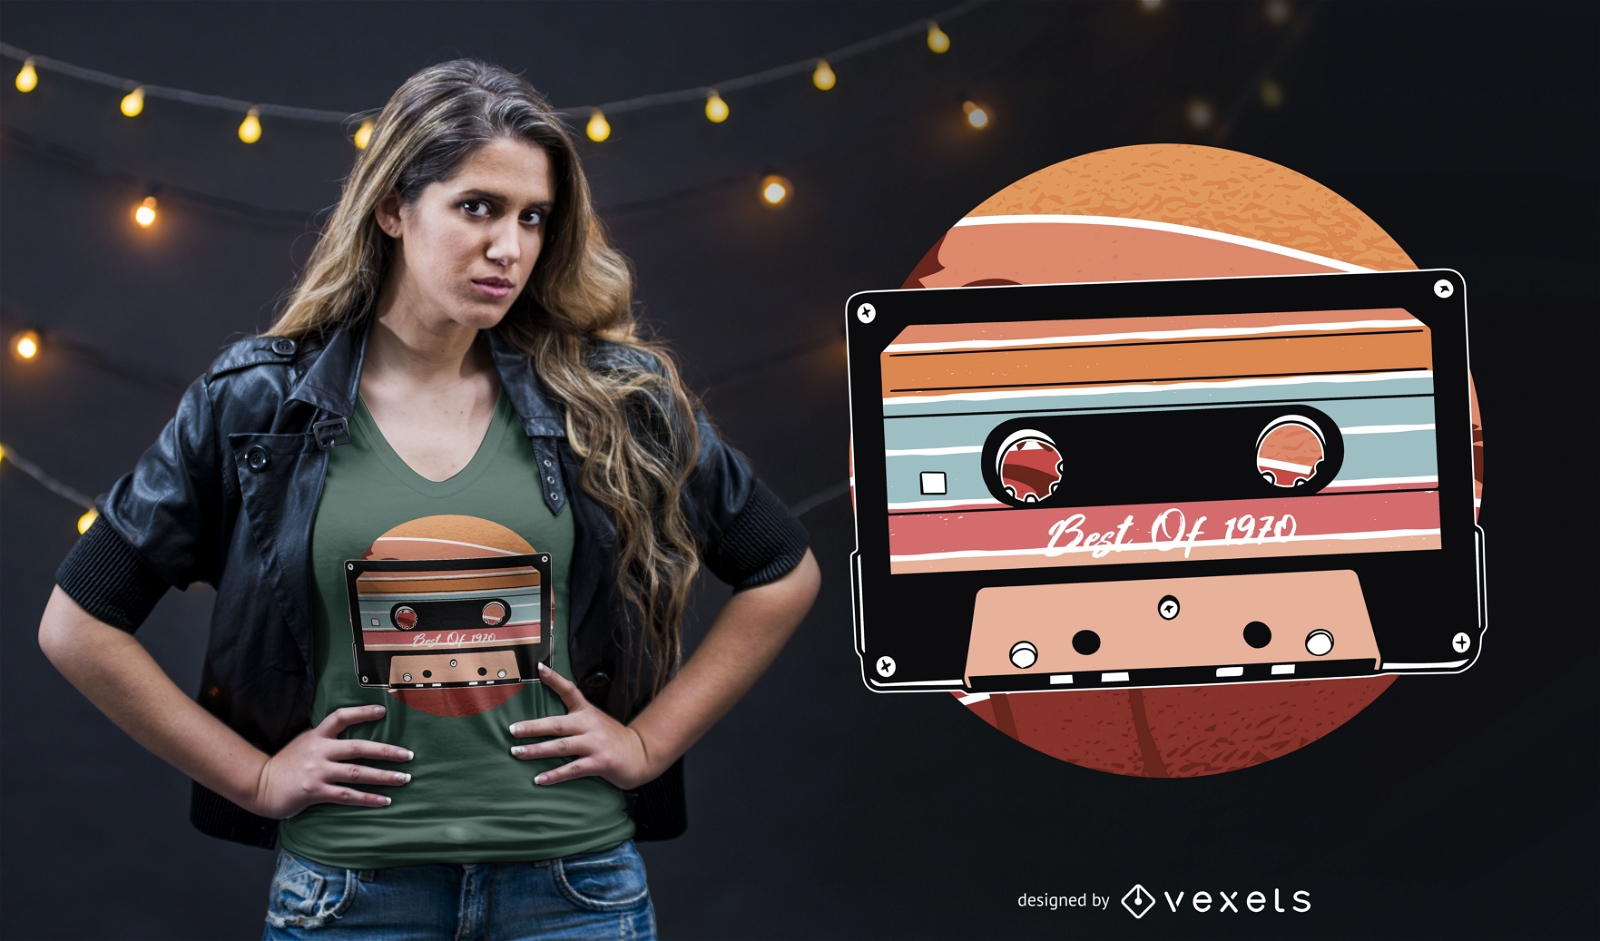
Vintage cassette t-shirt design
Choose a folder
All favorites
Create new
Save
Vintage cassette t-shirt design
Print ready
for Merch
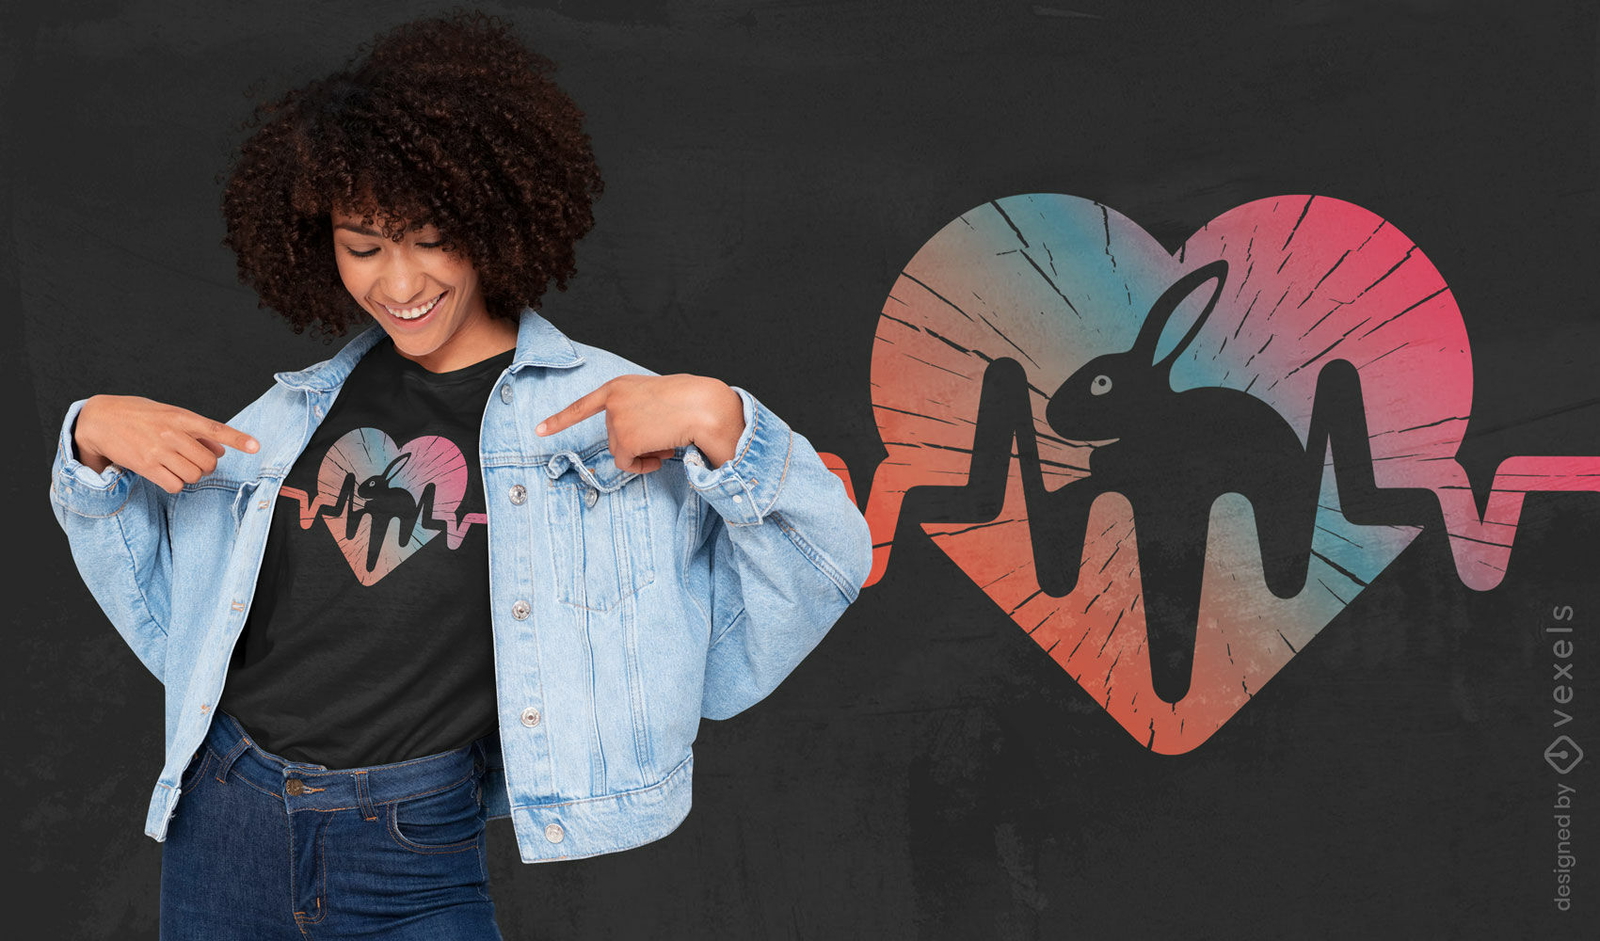
Bunny heartbeat t-shirt design
Choose a folder
All favorites
Create new
Save
Bunny heartbeat t-shirt design
Editable text
Print ready
for Merch
Mechanical heart anatomy t-shirt design
Choose a folder
All favorites
Create new
Save
Mechanical heart anatomy t-shirt design
Editable text
Print ready
for Merch
No ammo required t-shirt design
Choose a folder
All favorites
Create new
Save
No ammo required t-shirt design
Print ready
for Merch
Unicorn cat kawaii t-shirt design
Choose a folder
All favorites
Create new
Save
Unicorn cat kawaii t-shirt design
Print ready
for Merch
Razor blade barbed wire t-shirt design
Choose a folder
All favorites
Create new
Save
Razor blade barbed wire t-shirt design
Editable text
Print ready
for Merch
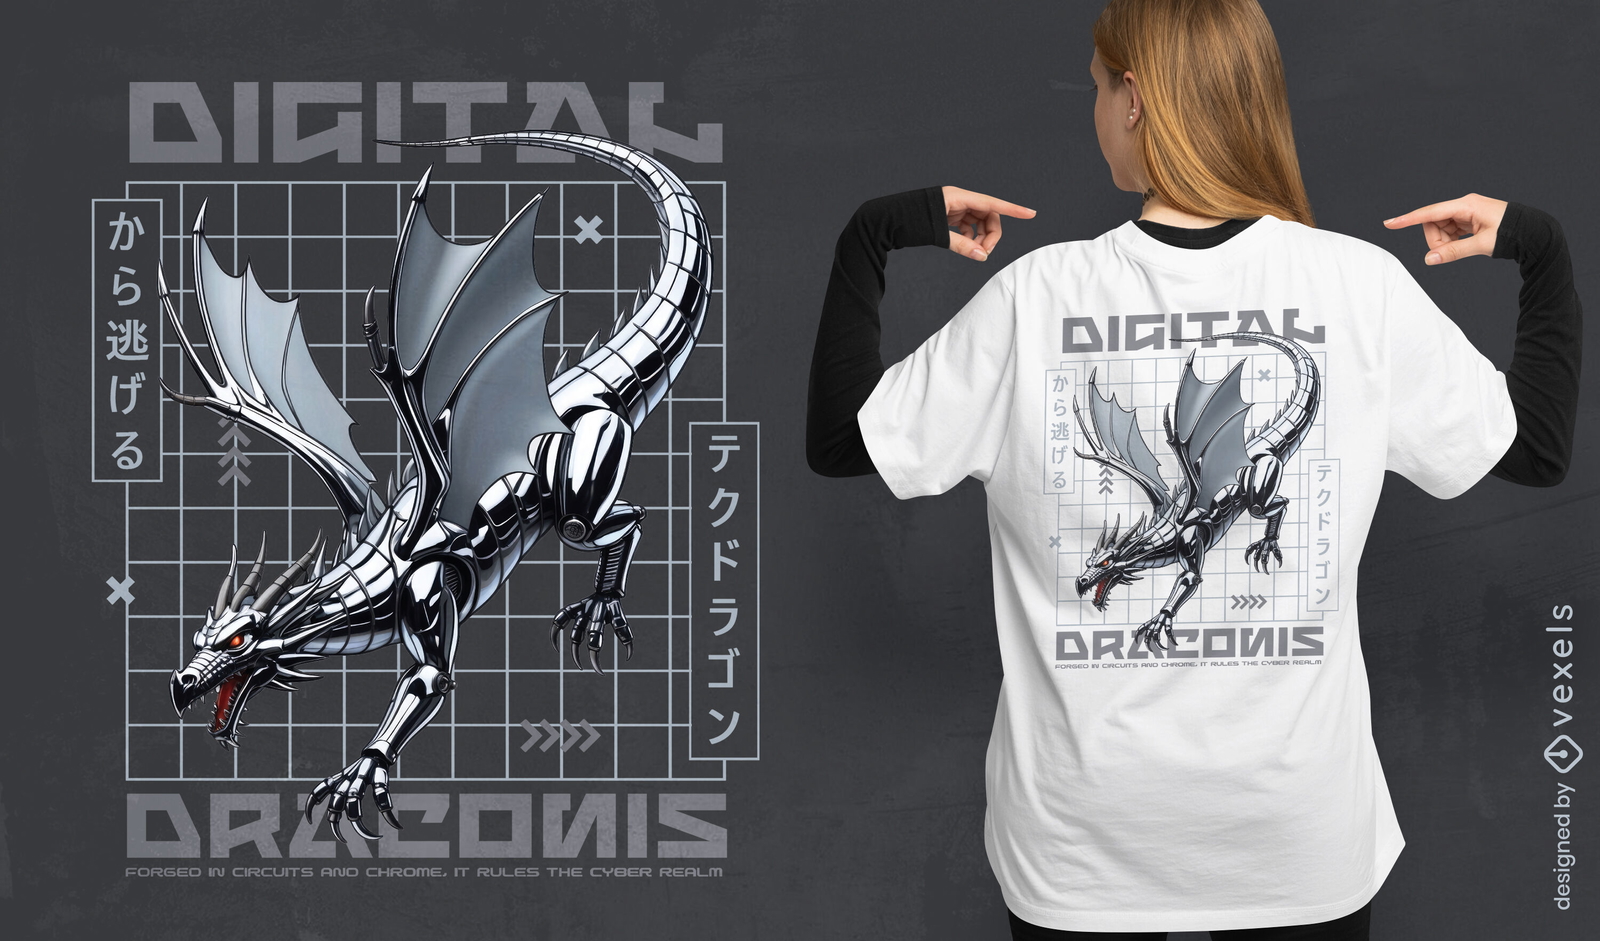
Digital dragon t-shirt design
Choose a folder
All favorites
Create new
Save
Digital dragon t-shirt design
Editable text
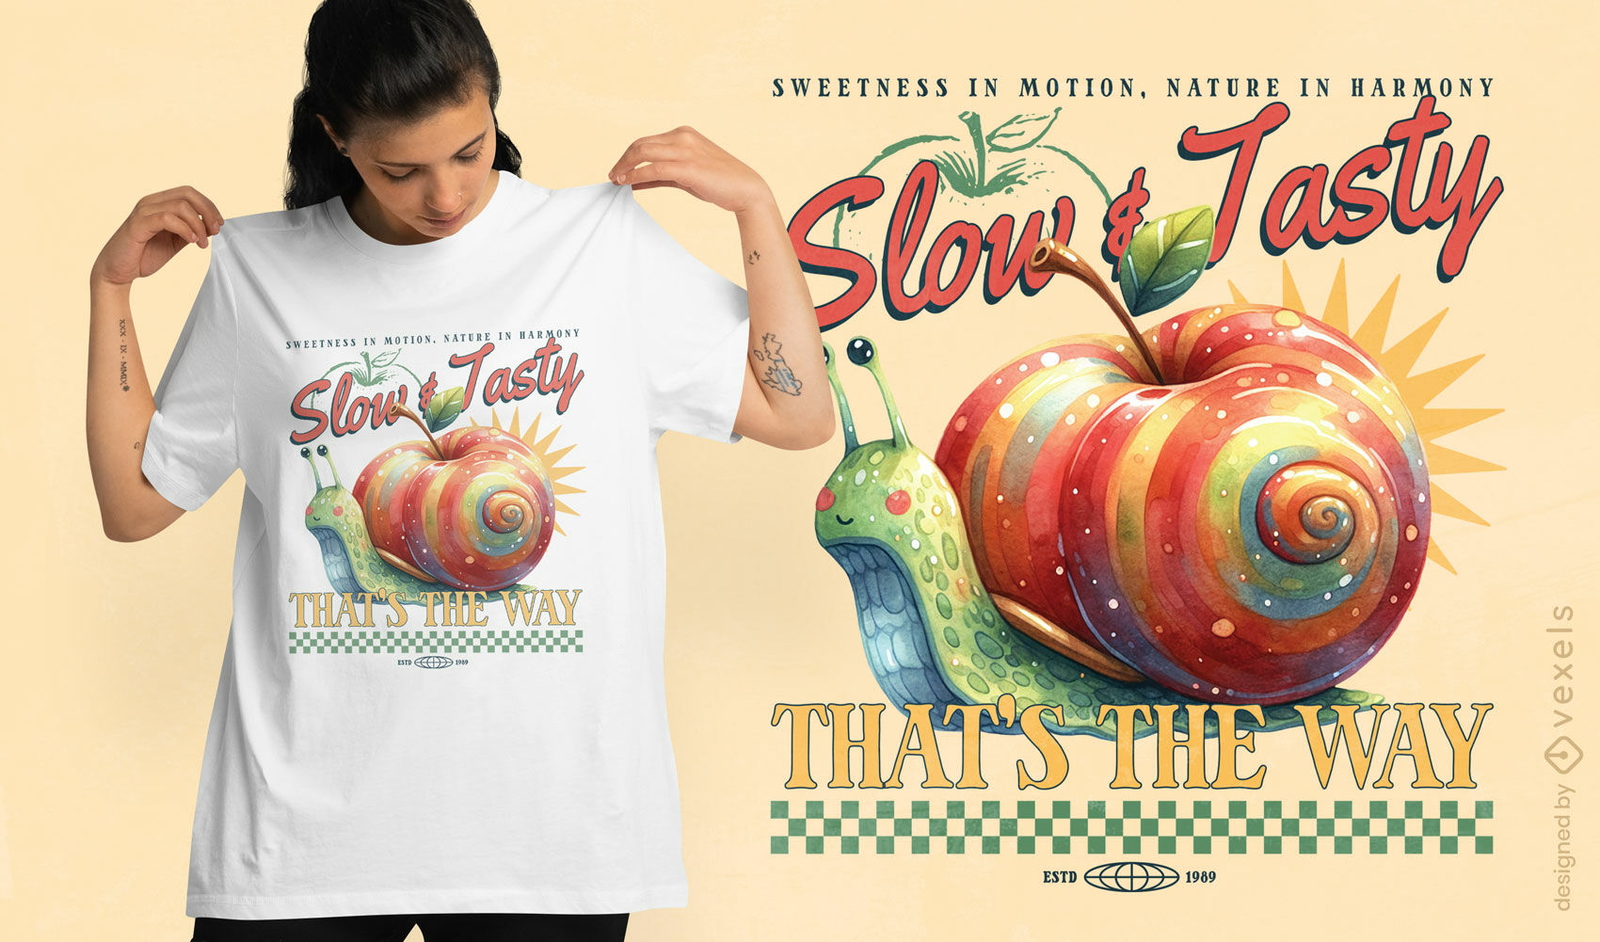
Print ready
for Merch
Slow and tasty snail t-shirt design
Choose a folder
All favorites
Create new
Save
Slow and tasty snail t-shirt design
Editable text
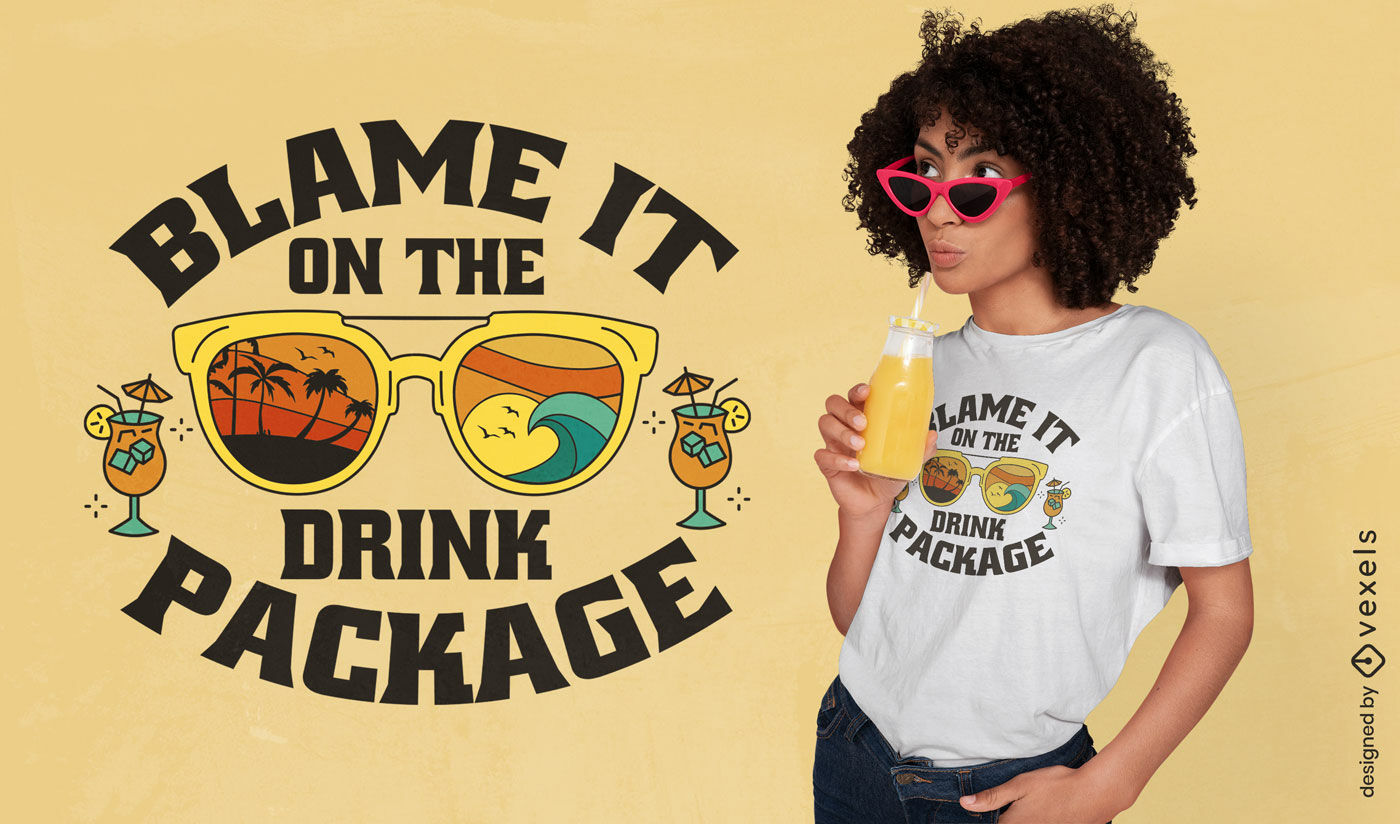
Print ready
for Merch
Drink package quote t-shirt design
Choose a folder
All favorites
Create new
Save
Drink package quote t-shirt design
Editable text
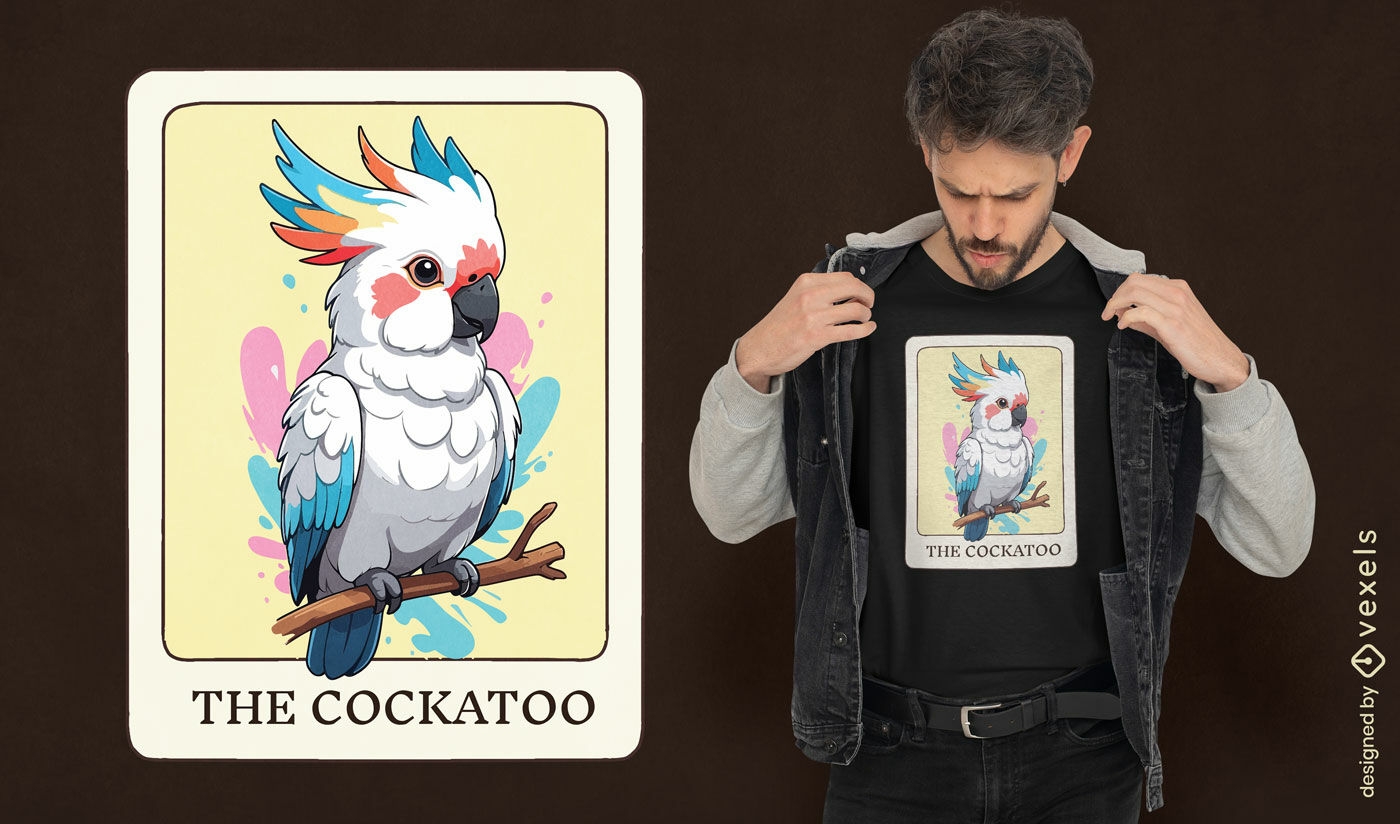
Print ready
for Merch
Cockatoo card t-shirt design
Choose a folder
All favorites
Create new
Save
Cockatoo card t-shirt design
Editable text
Print ready
for Merch
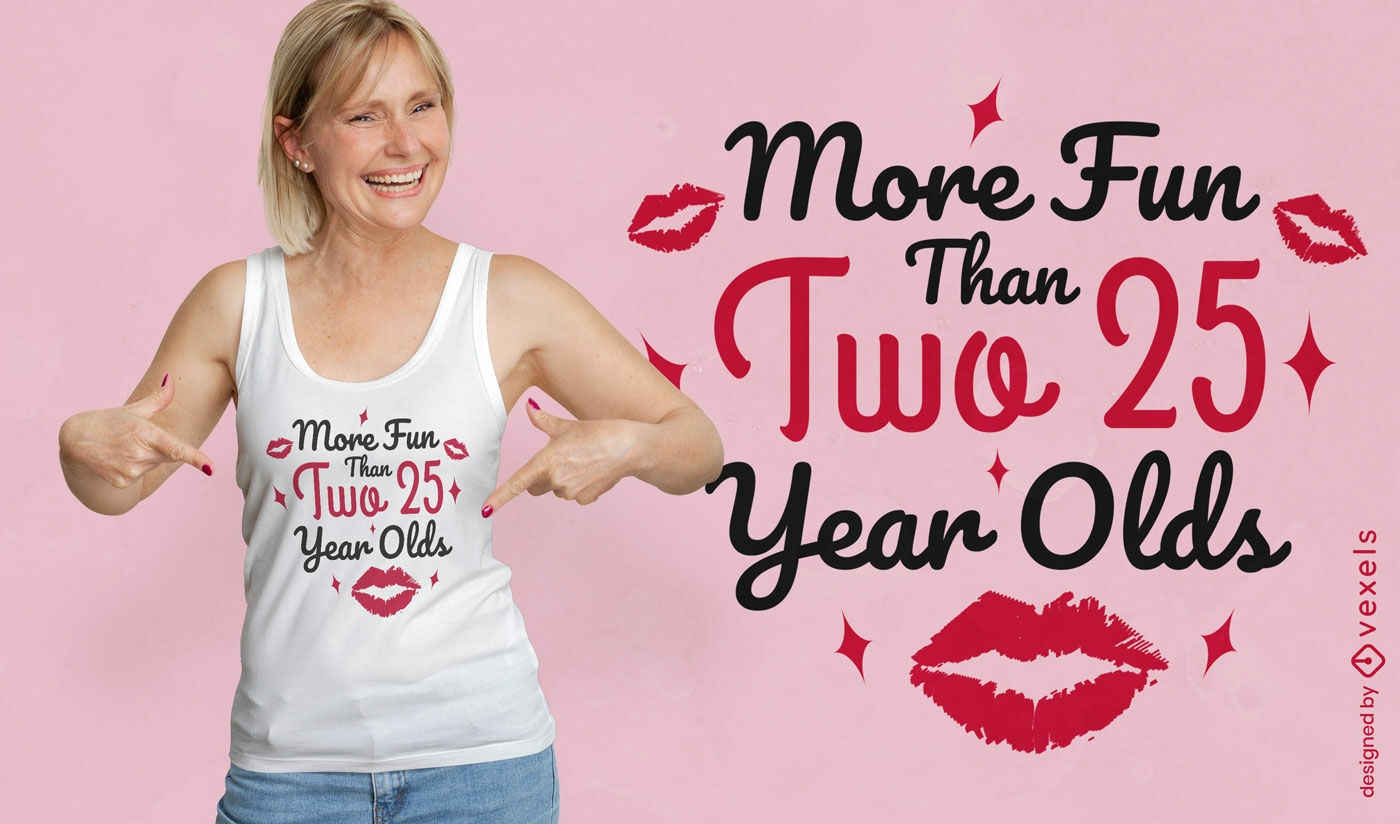
Birthday humor quote t-shirt design
Choose a folder
All favorites
Create new
Save
Birthday humor quote t-shirt design
Print ready
for Merch
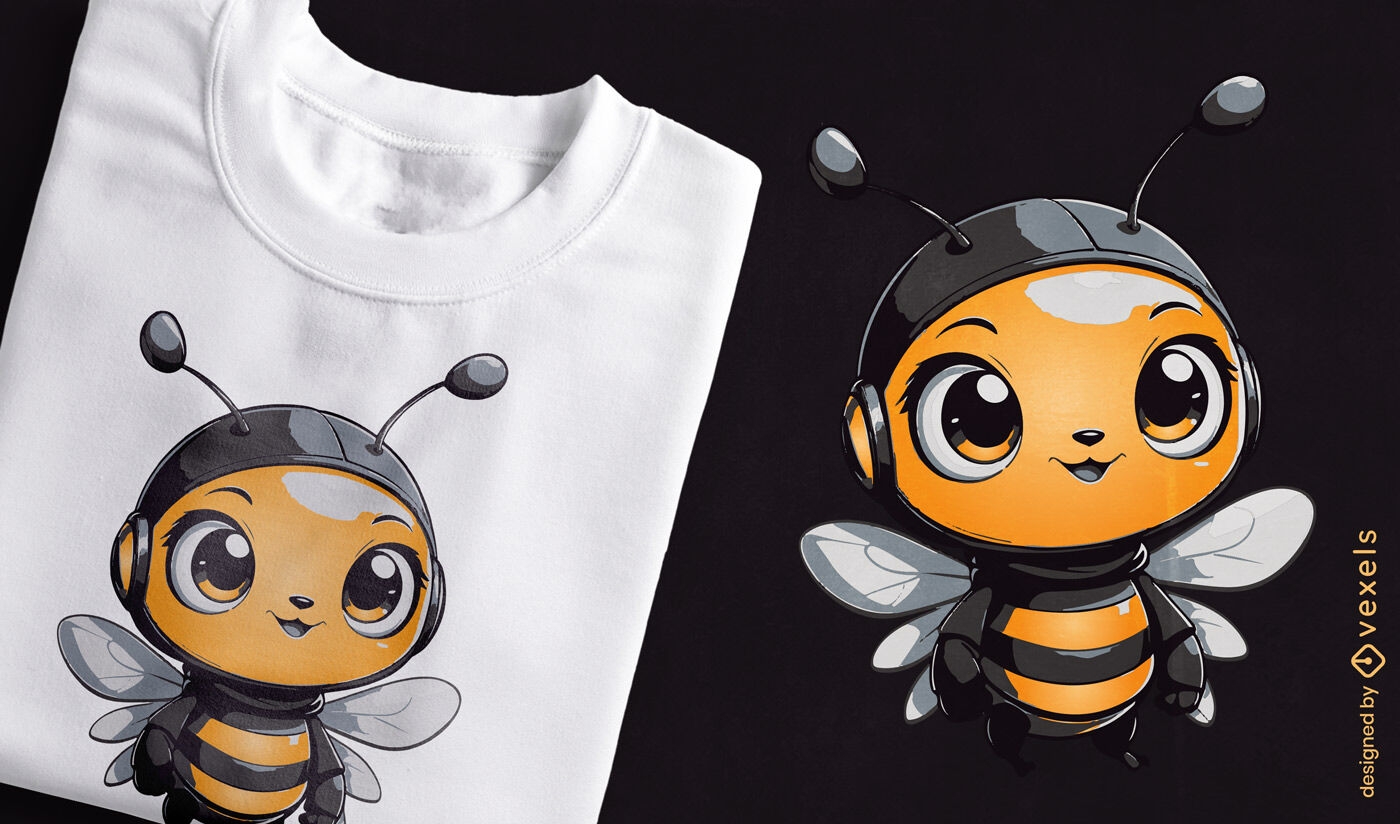
Cute bumblebee character t-shirt design
Choose a folder
All favorites
Create new
Save
Cute bumblebee character t-shirt design
Editable text
Print ready
for Merch
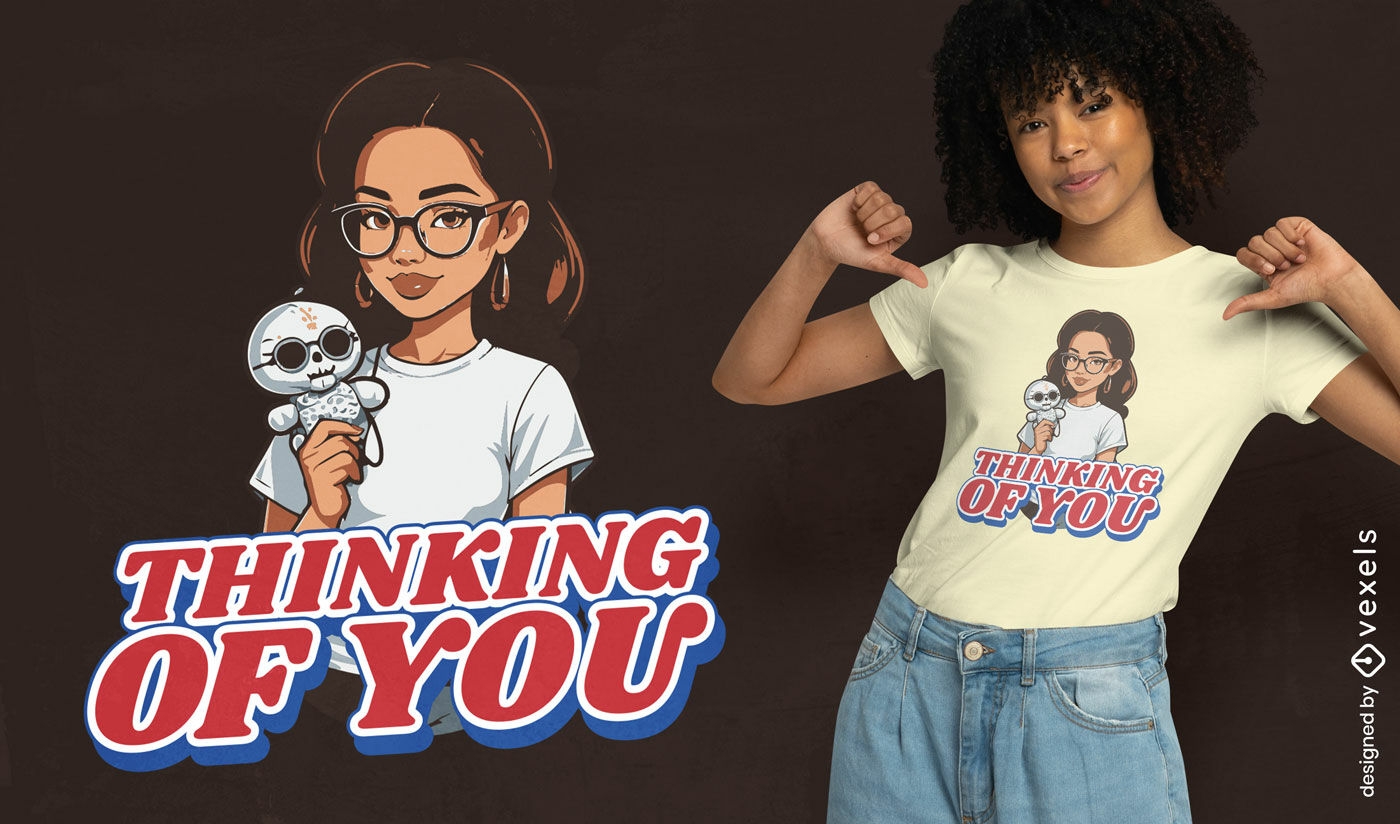
Humorous voodoo doll declaration t-shirt design
Choose a folder
All favorites
Create new
Save
Humorous voodoo doll declaration t-shirt design
Print ready
for Merch
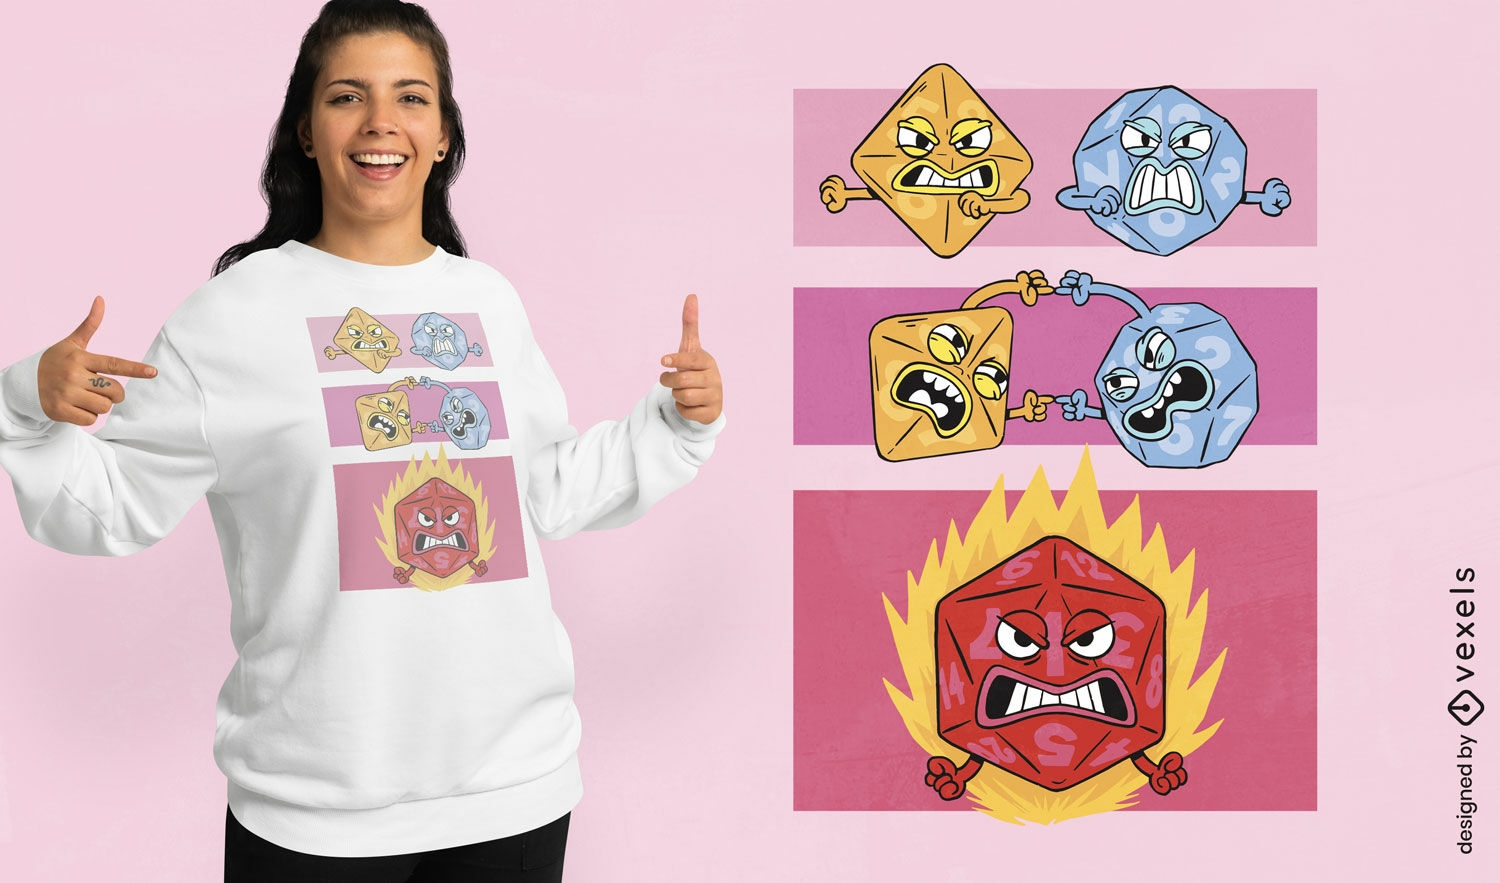
Fantasy gaming D20 dice t-shirt design
Choose a folder
All favorites
Create new
Save
Fantasy gaming D20 dice t-shirt design
Print ready
for Merch
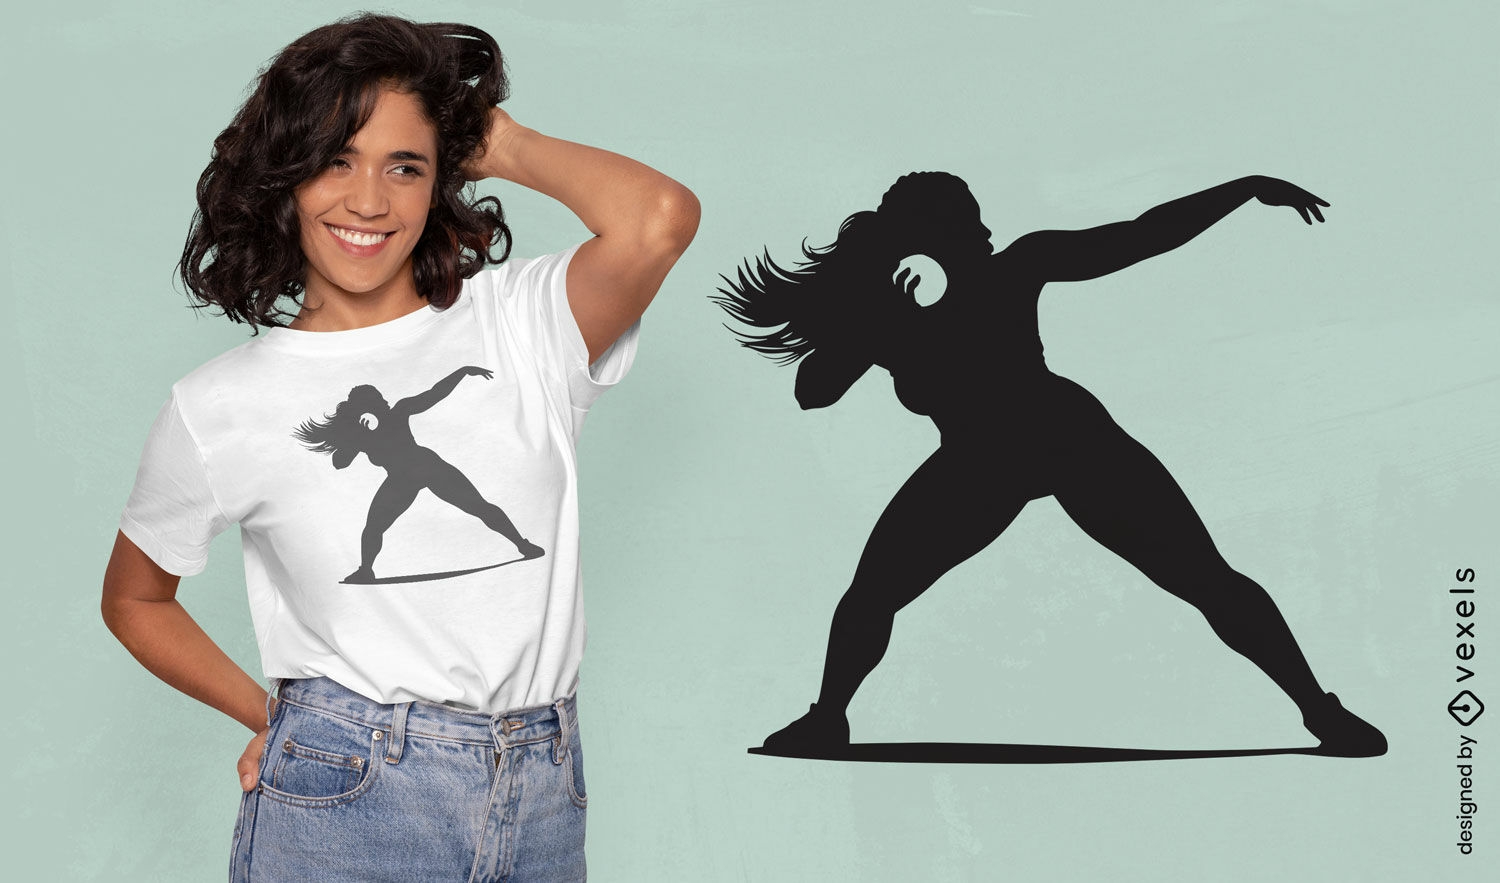
Athletic shot-putter woman t-shirt design
Choose a folder
All favorites
Create new
Save
Athletic shot-putter woman t-shirt design
Print ready
for Merch
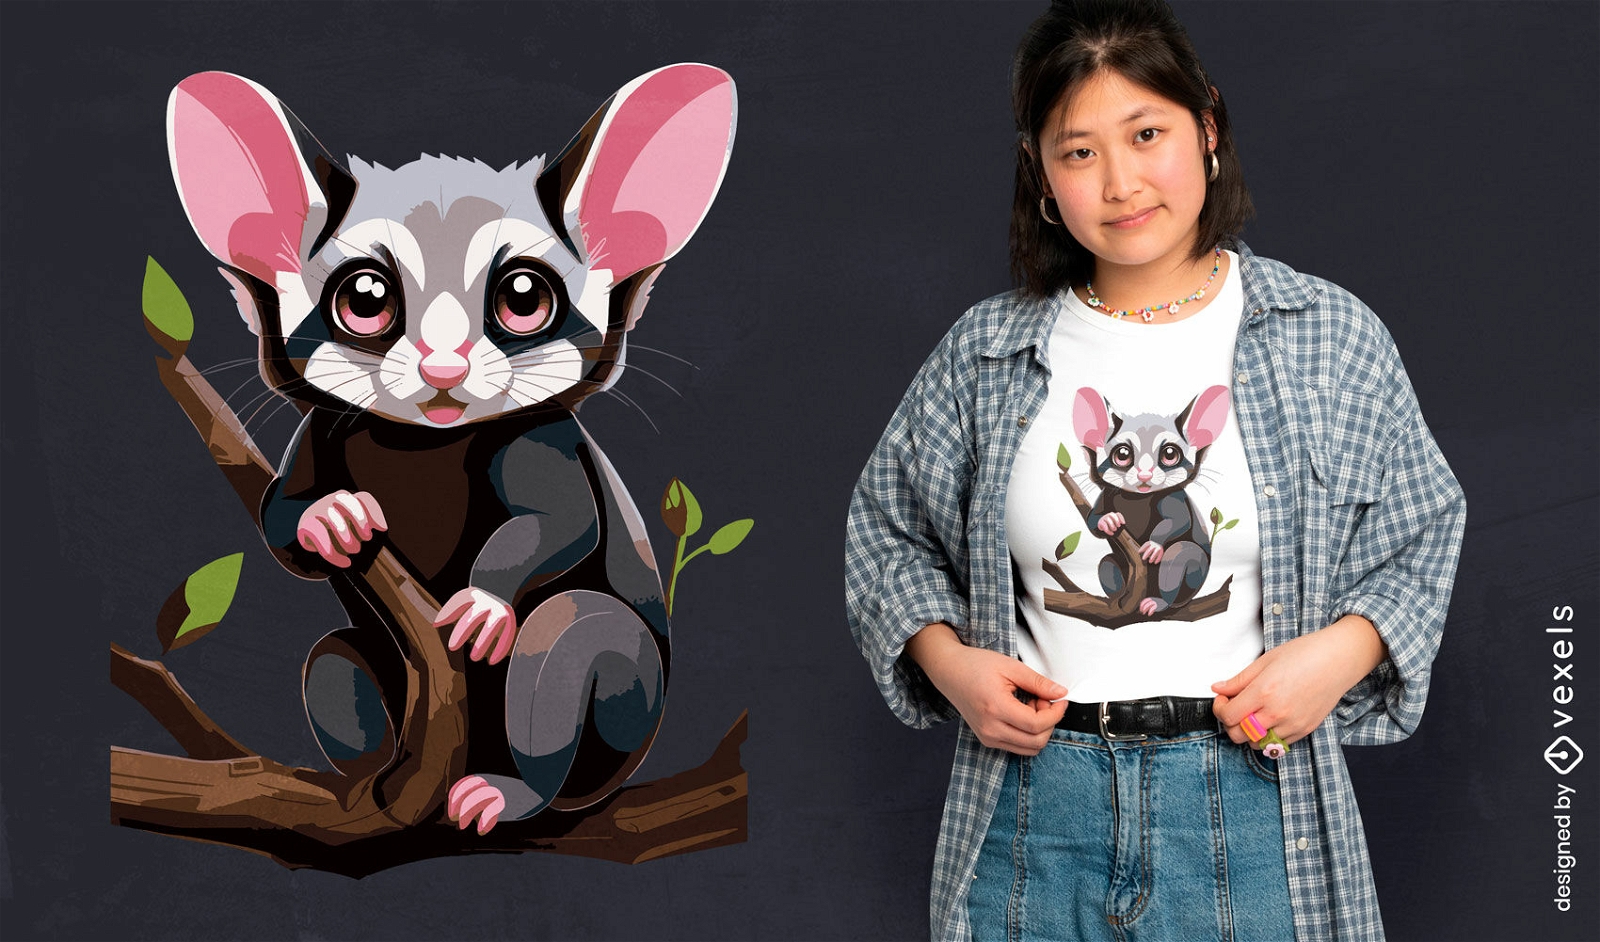
Sugar Glider adorable t-shirt design
Choose a folder
All favorites
Create new
Save
Sugar Glider adorable t-shirt design
Print ready
for Merch
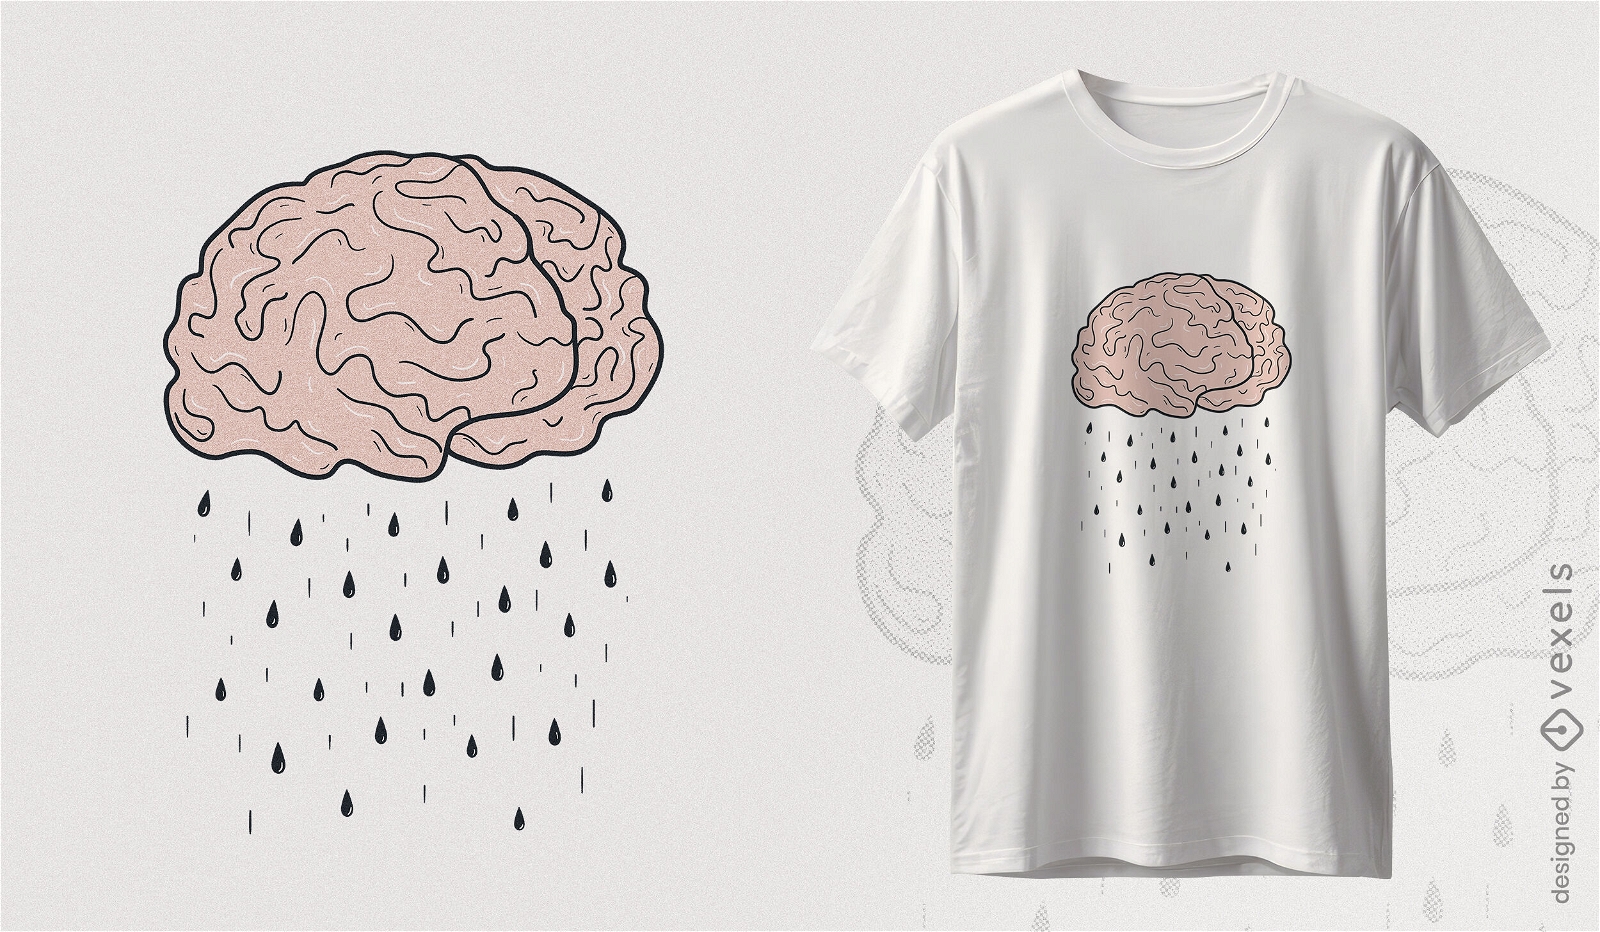
Brainstorming rain t-shirt design
Choose a folder
All favorites
Create new
Save
Brainstorming rain t-shirt design
Editable text
Print ready
for Merch
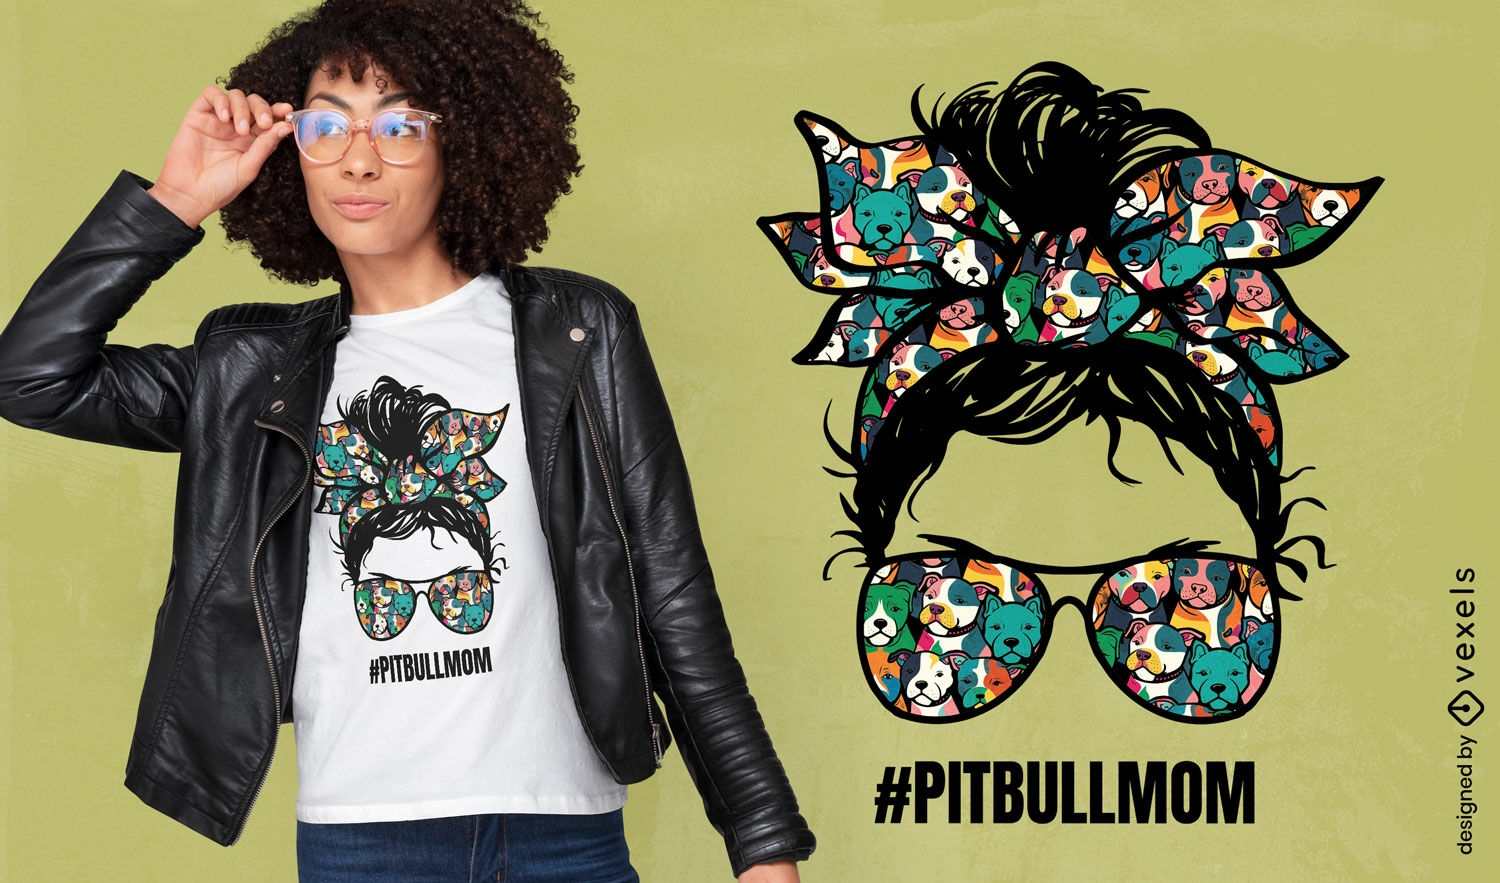
Pitbull mom t-shirt design
Choose a folder
All favorites
Create new
Save
Pitbull mom t-shirt design
Editable text
Print ready
for Merch
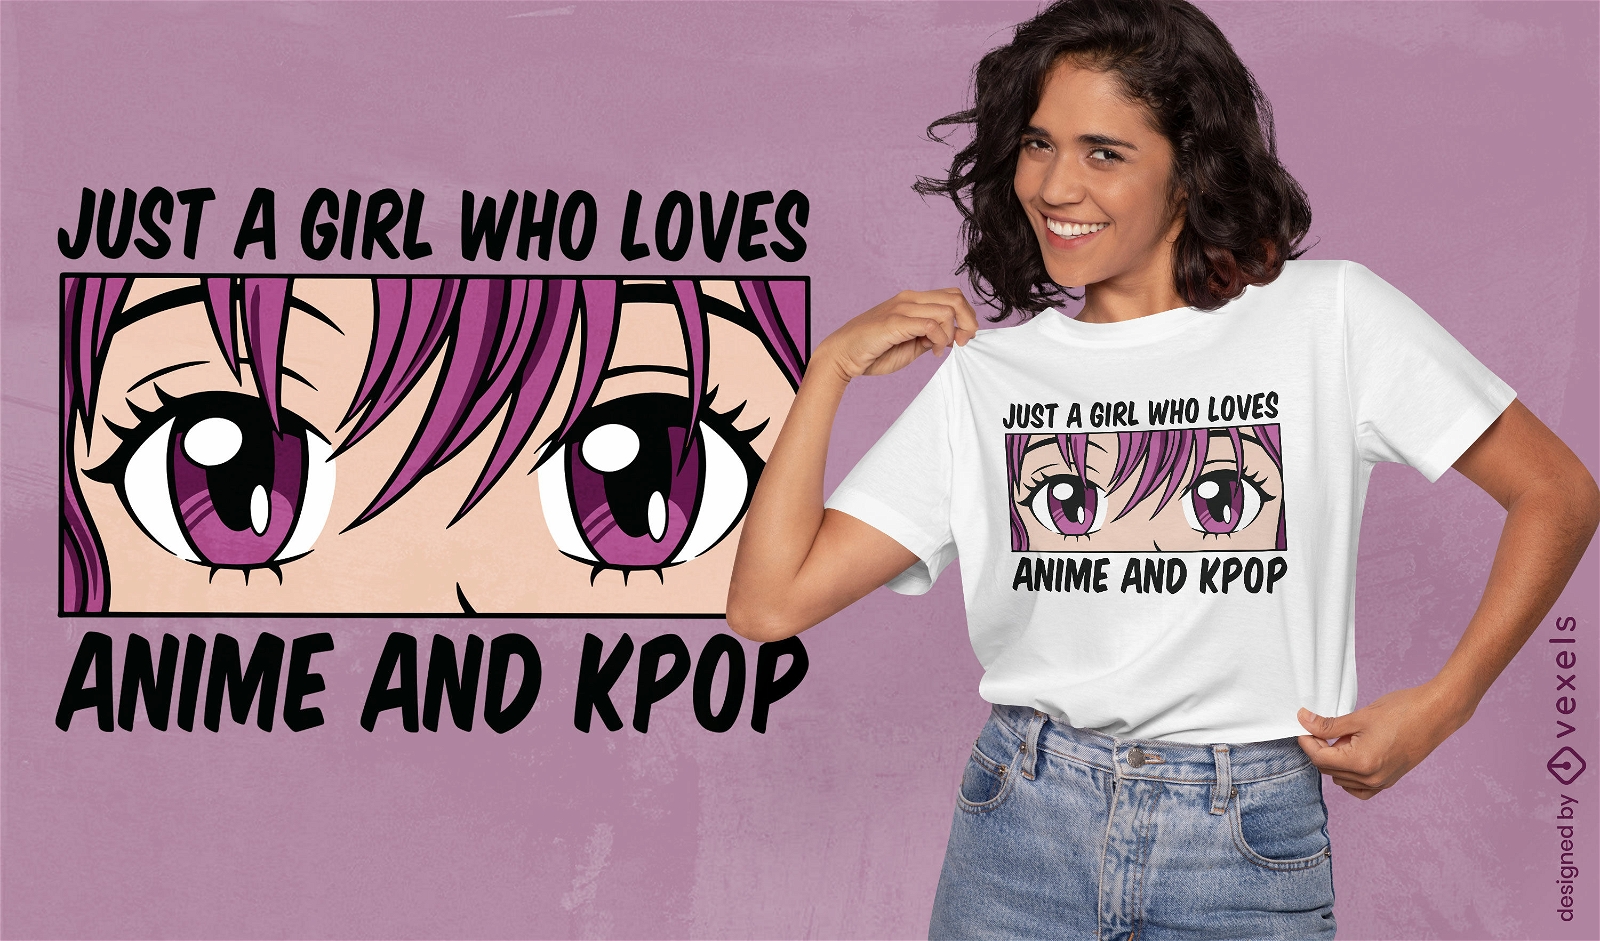
Kpop anime fan t-shirt design
Choose a folder
All favorites
Create new
Save
Kpop anime fan t-shirt design
Editable text
Print ready
for Merch
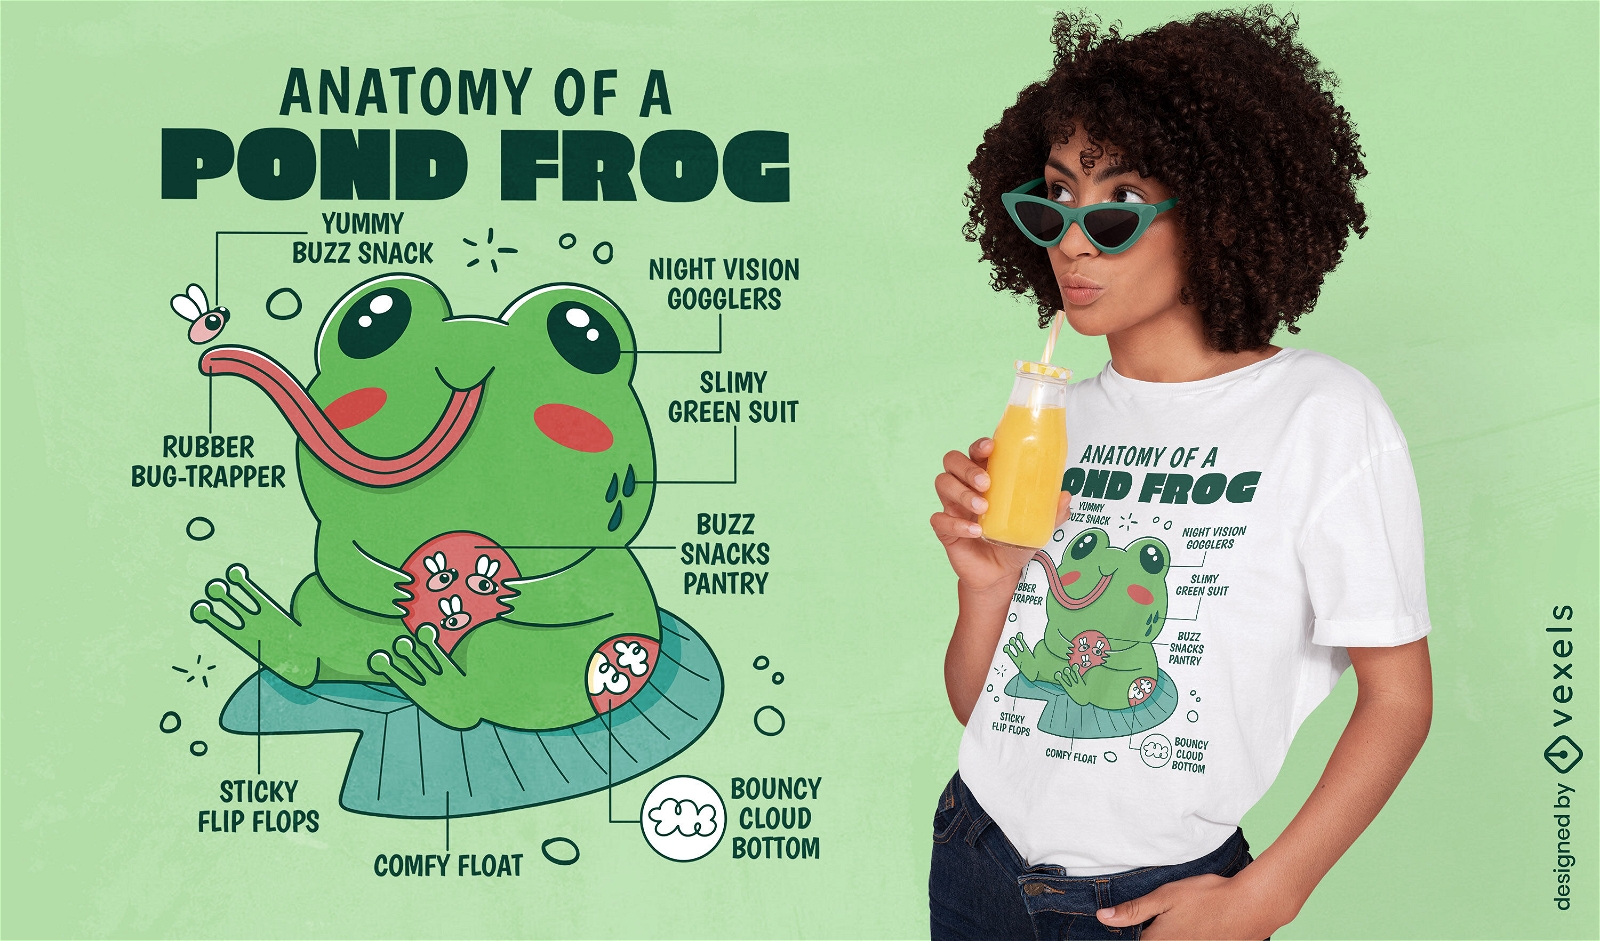
Frog cute animal anatomy t-shirt design
Choose a folder
All favorites
Create new
Save
Frog cute animal anatomy t-shirt design
Print ready
for Merch
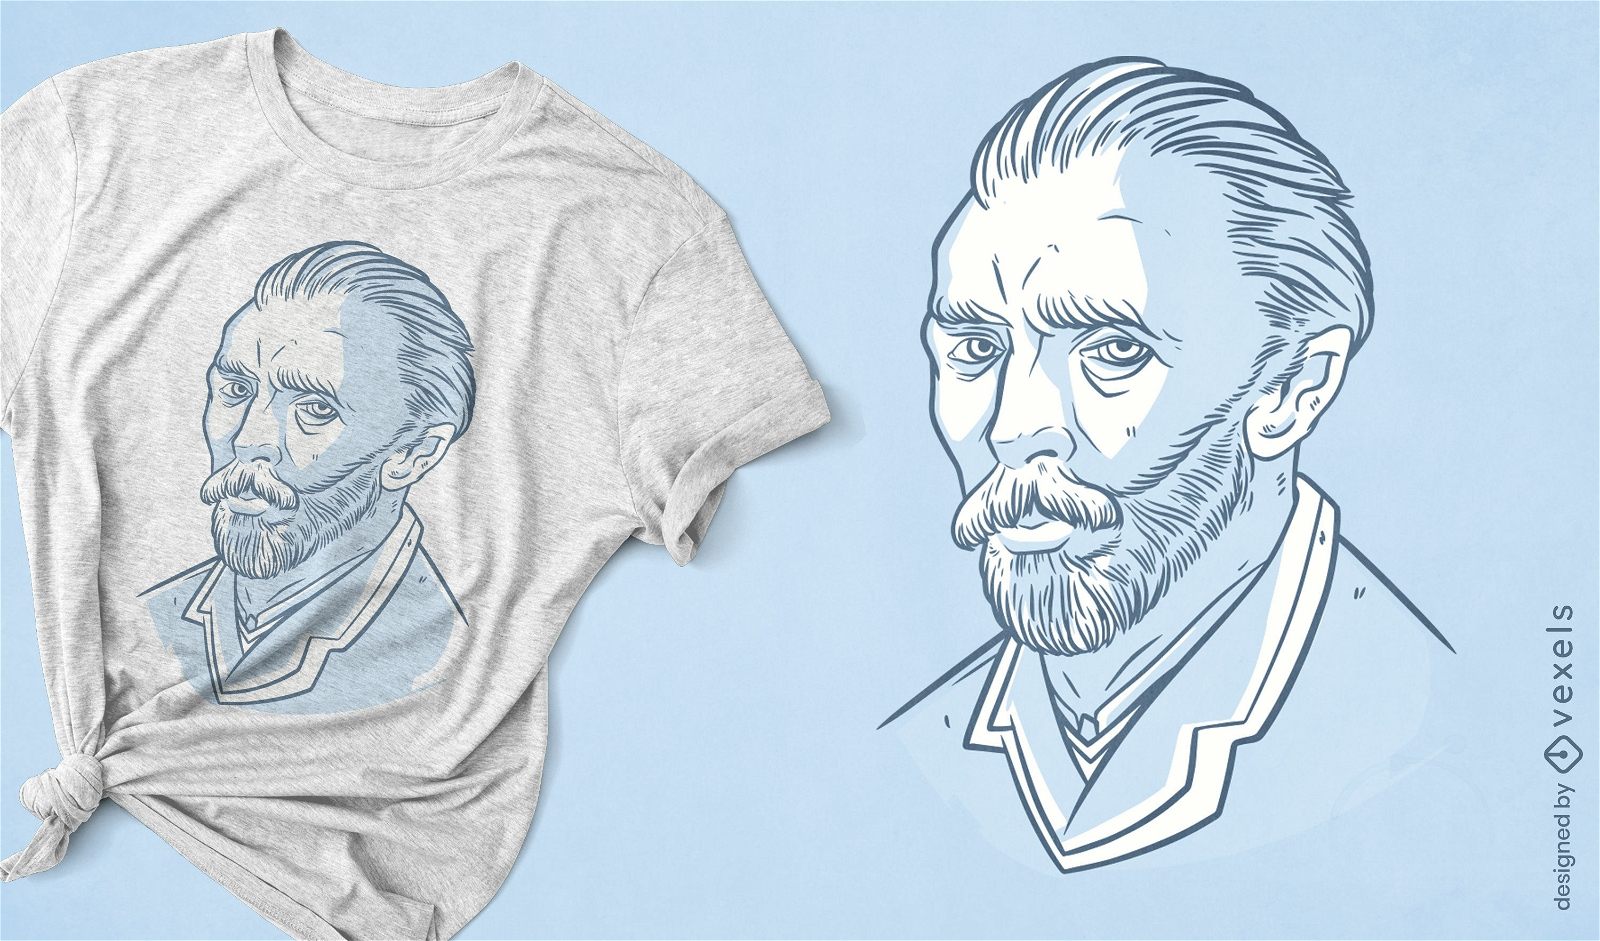
Van Gogh portrait t-shirt design
Choose a folder
All favorites
Create new
Save
Van Gogh portrait t-shirt design
Print ready
for Merch
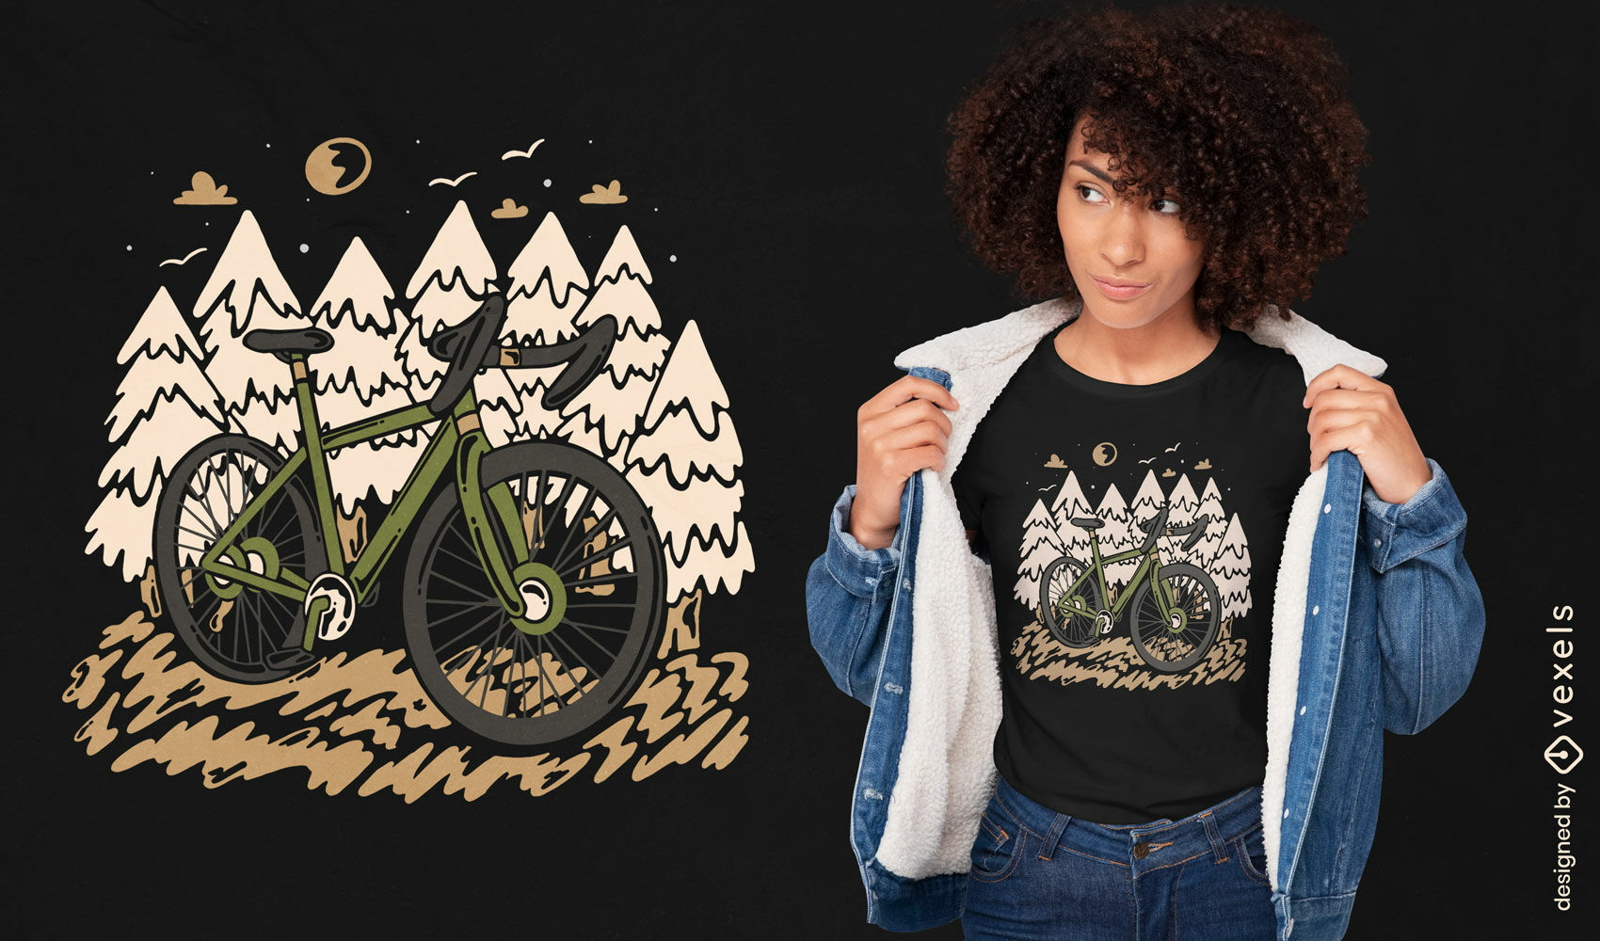
Mountain bike in forest t-shirt design
Choose a folder
All favorites
Create new
Save
Mountain bike in forest t-shirt design
Print ready
for Merch
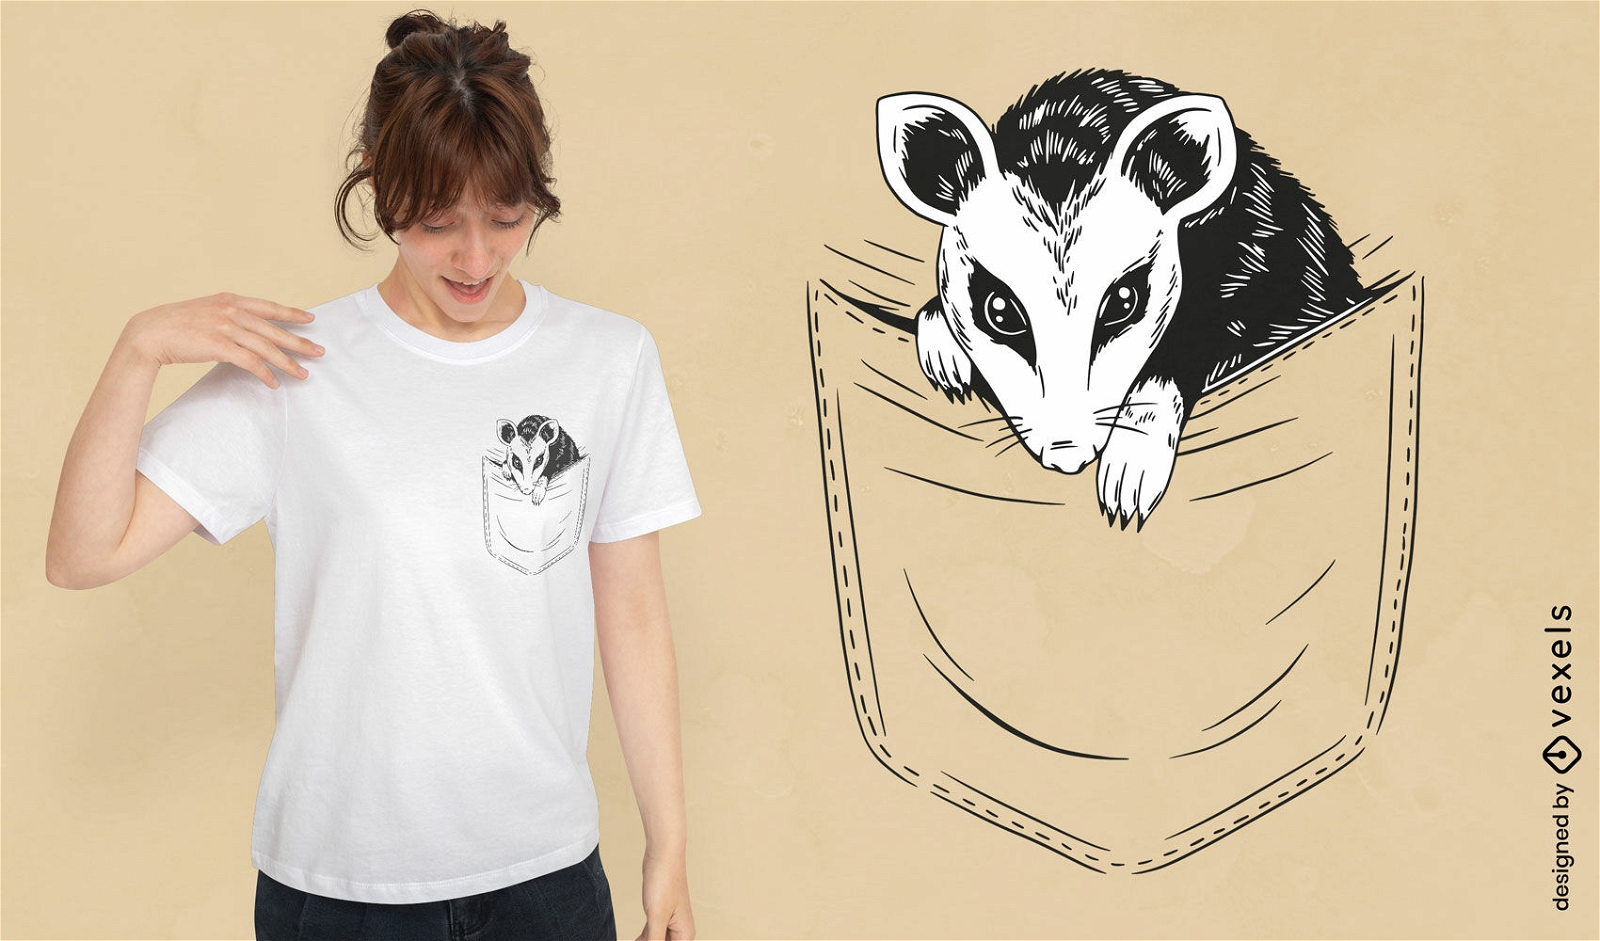
Possum pocket t-shirt design
Choose a folder
All favorites
Create new
Save
Possum pocket t-shirt design
Editable text
Print ready
for Merch
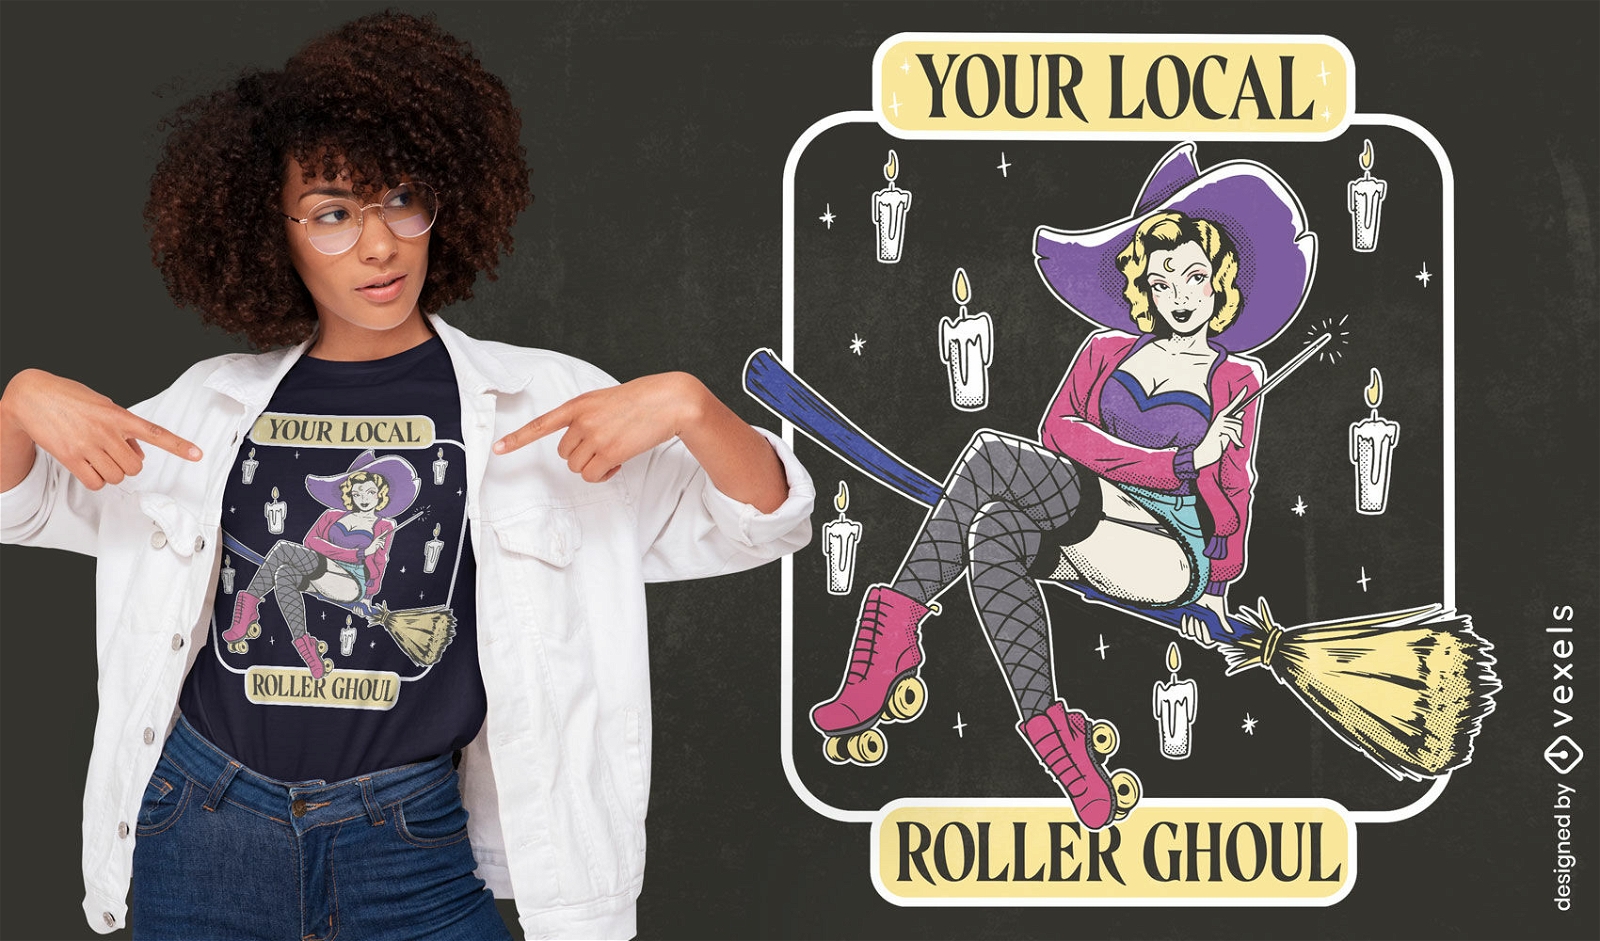
Witch in rollerblades on broom t-shirt design
Choose a folder
All favorites
Create new
Save
Witch in rollerblades on broom t-shirt design
Editable text
Print ready
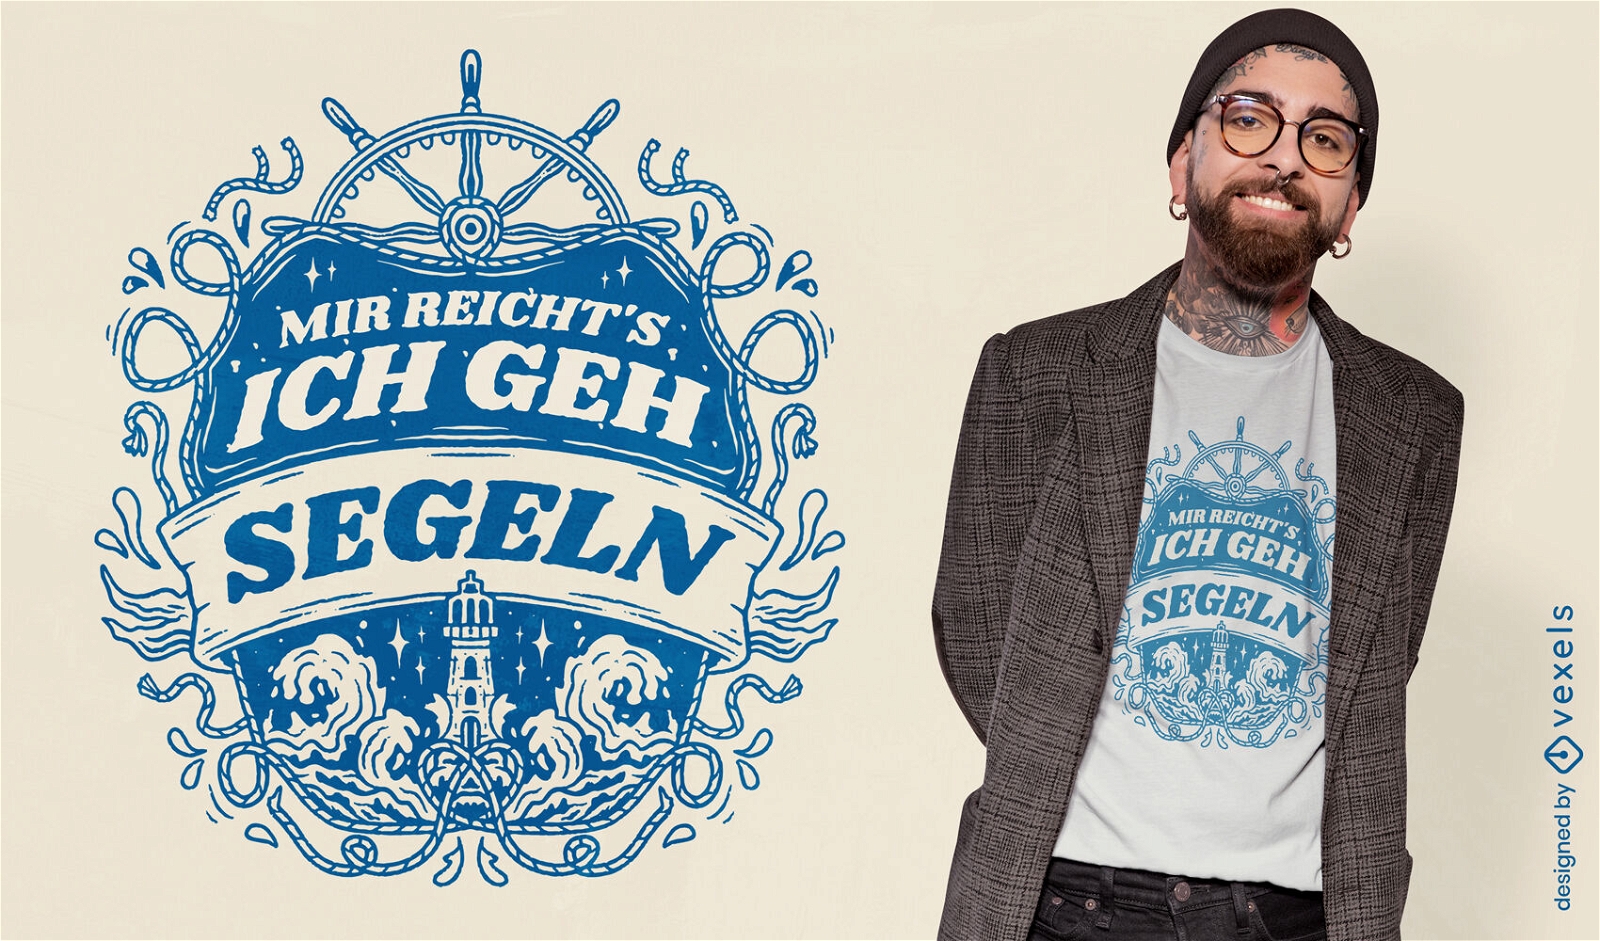
for Merch
Sailor quote t-shirt design
Choose a folder
All favorites
Create new
Save
Sailor quote t-shirt design
Print ready
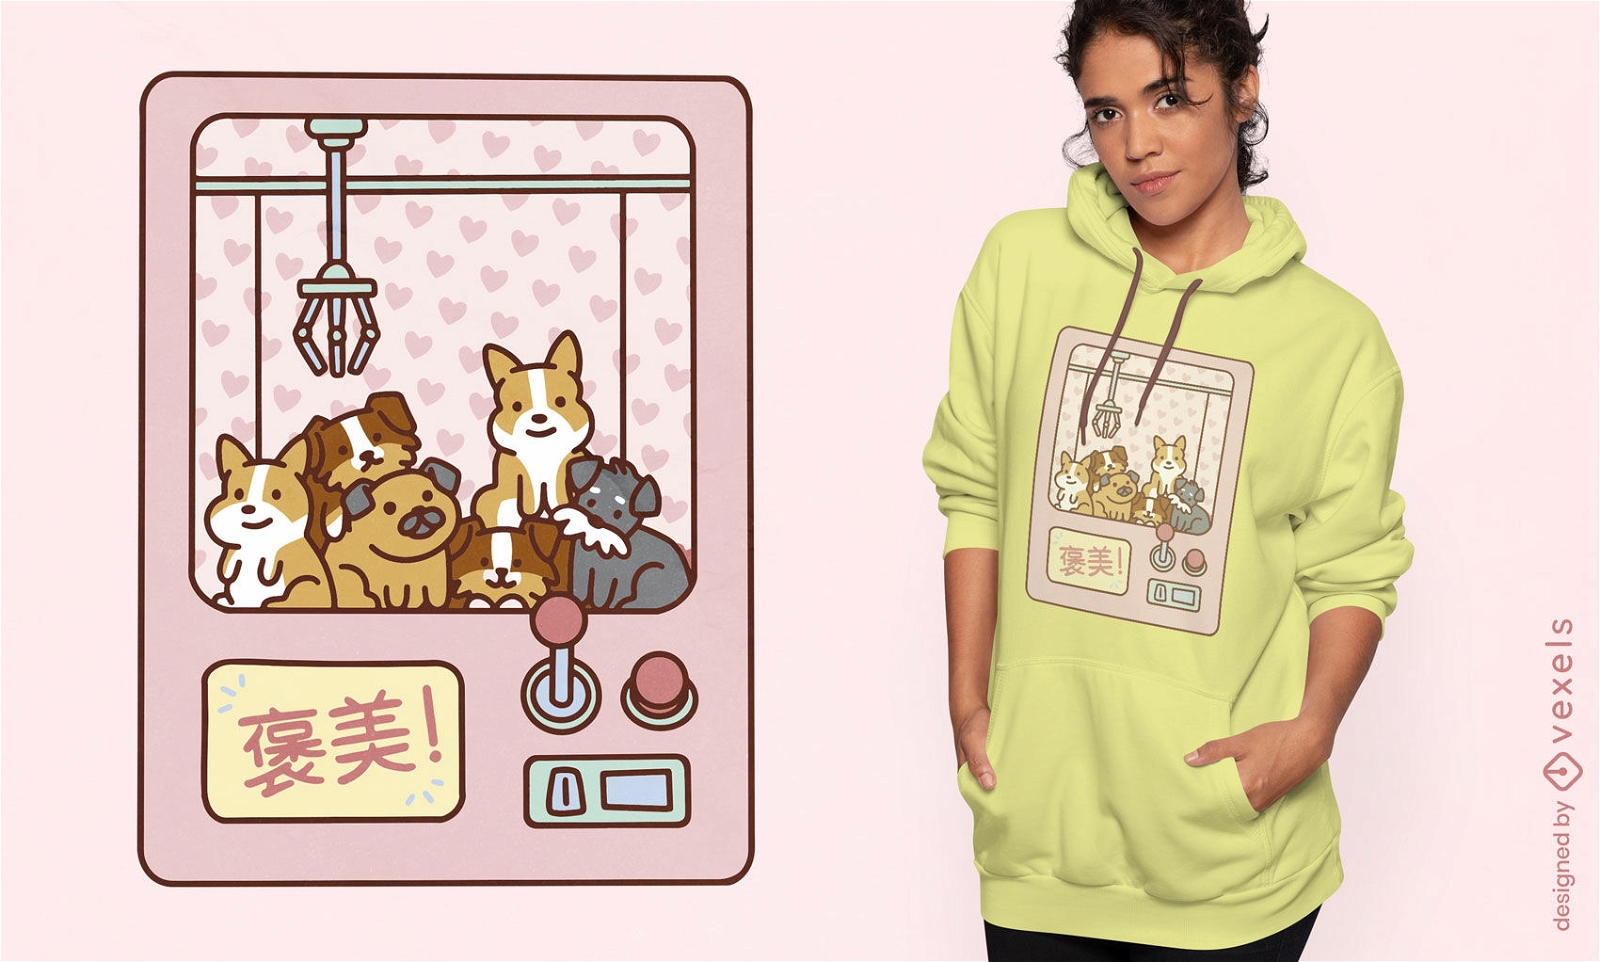
for Merch
Kawaii dog claw machine t-shirt design
Choose a folder
All favorites
Create new
Save
Kawaii dog claw machine t-shirt design
Print ready
for Merch
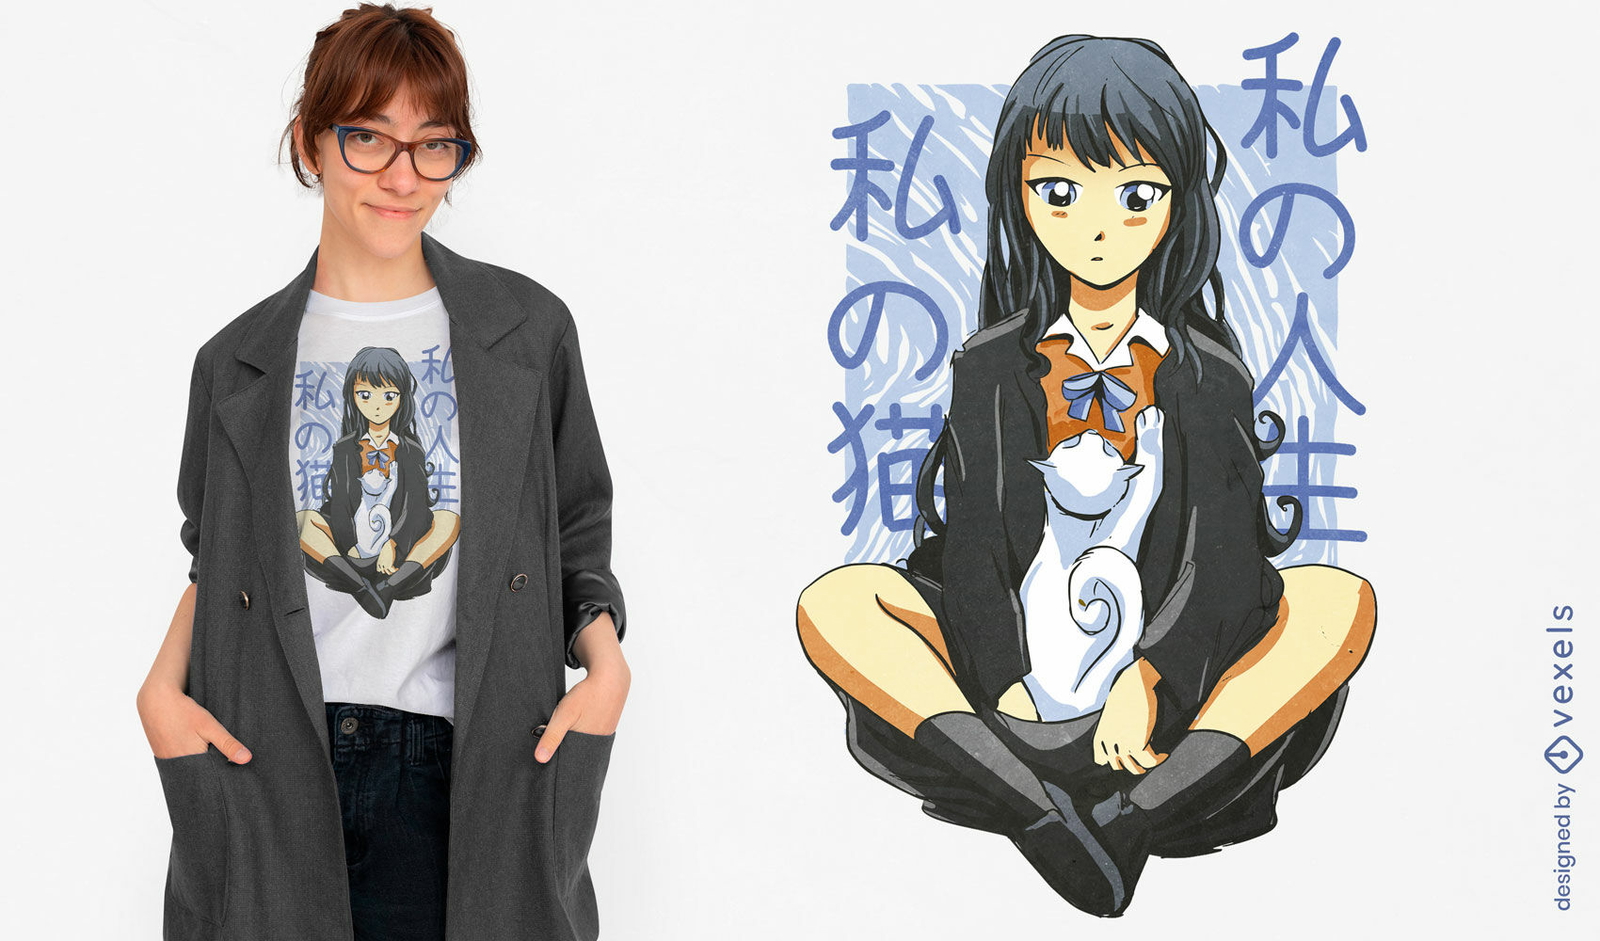
Anime girl sitting with cat t-shirt design
Choose a folder
All favorites
Create new
Save
Anime girl sitting with cat t-shirt design
Print ready
for Merch
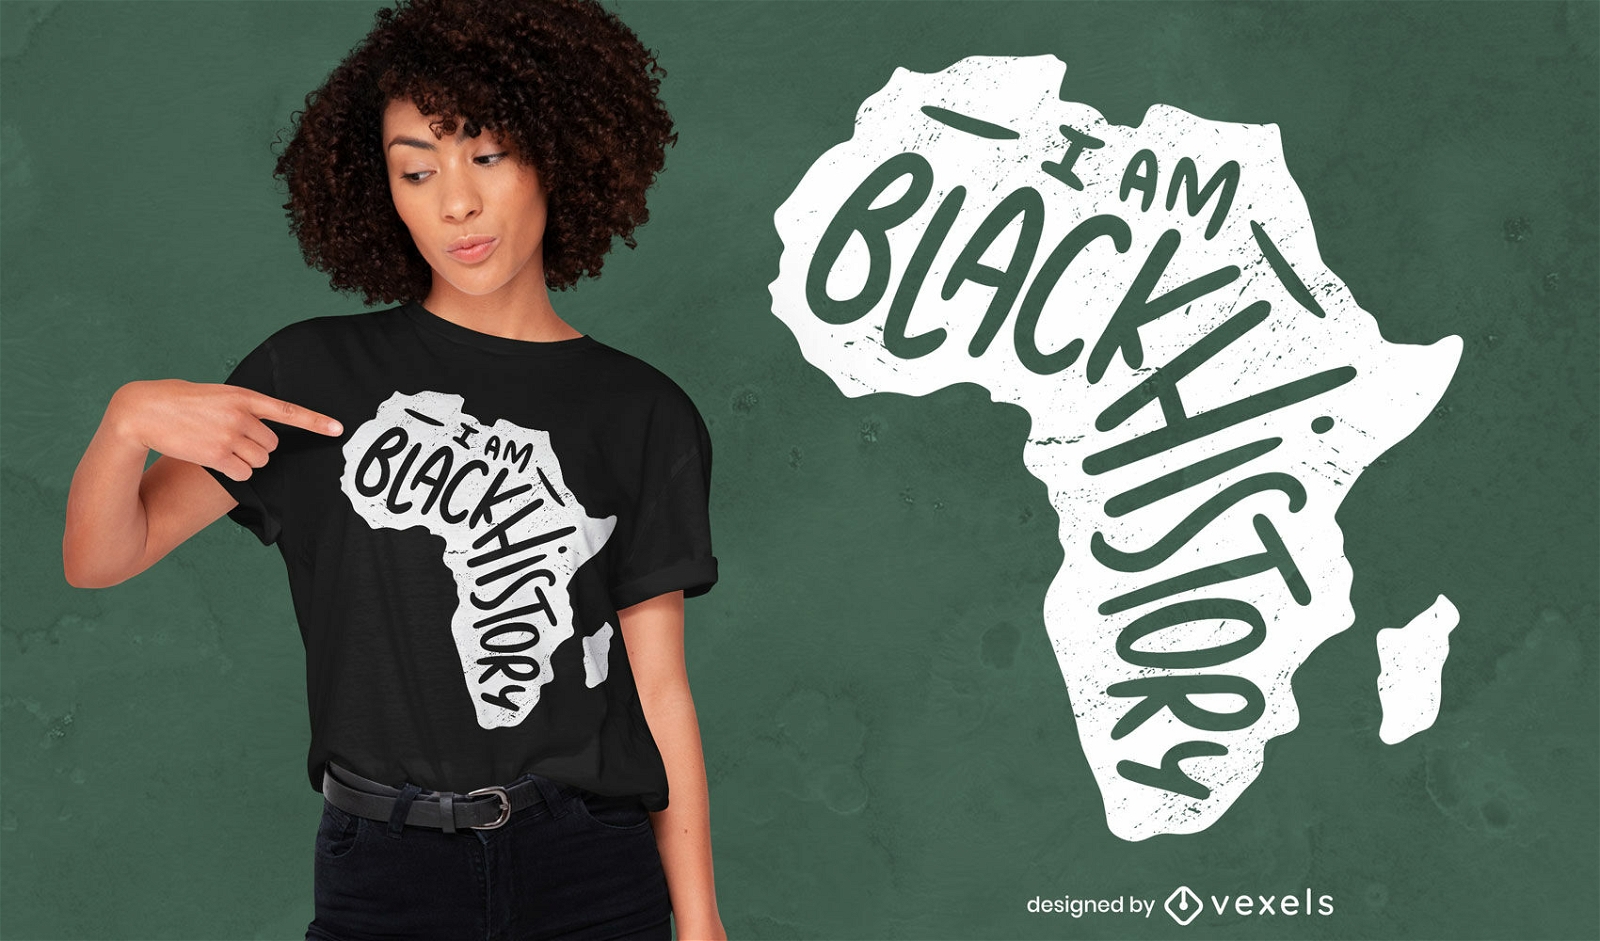
I am black history t-shirt design
Choose a folder
All favorites
Create new
Save
I am black history t-shirt design
Print ready
for Merch
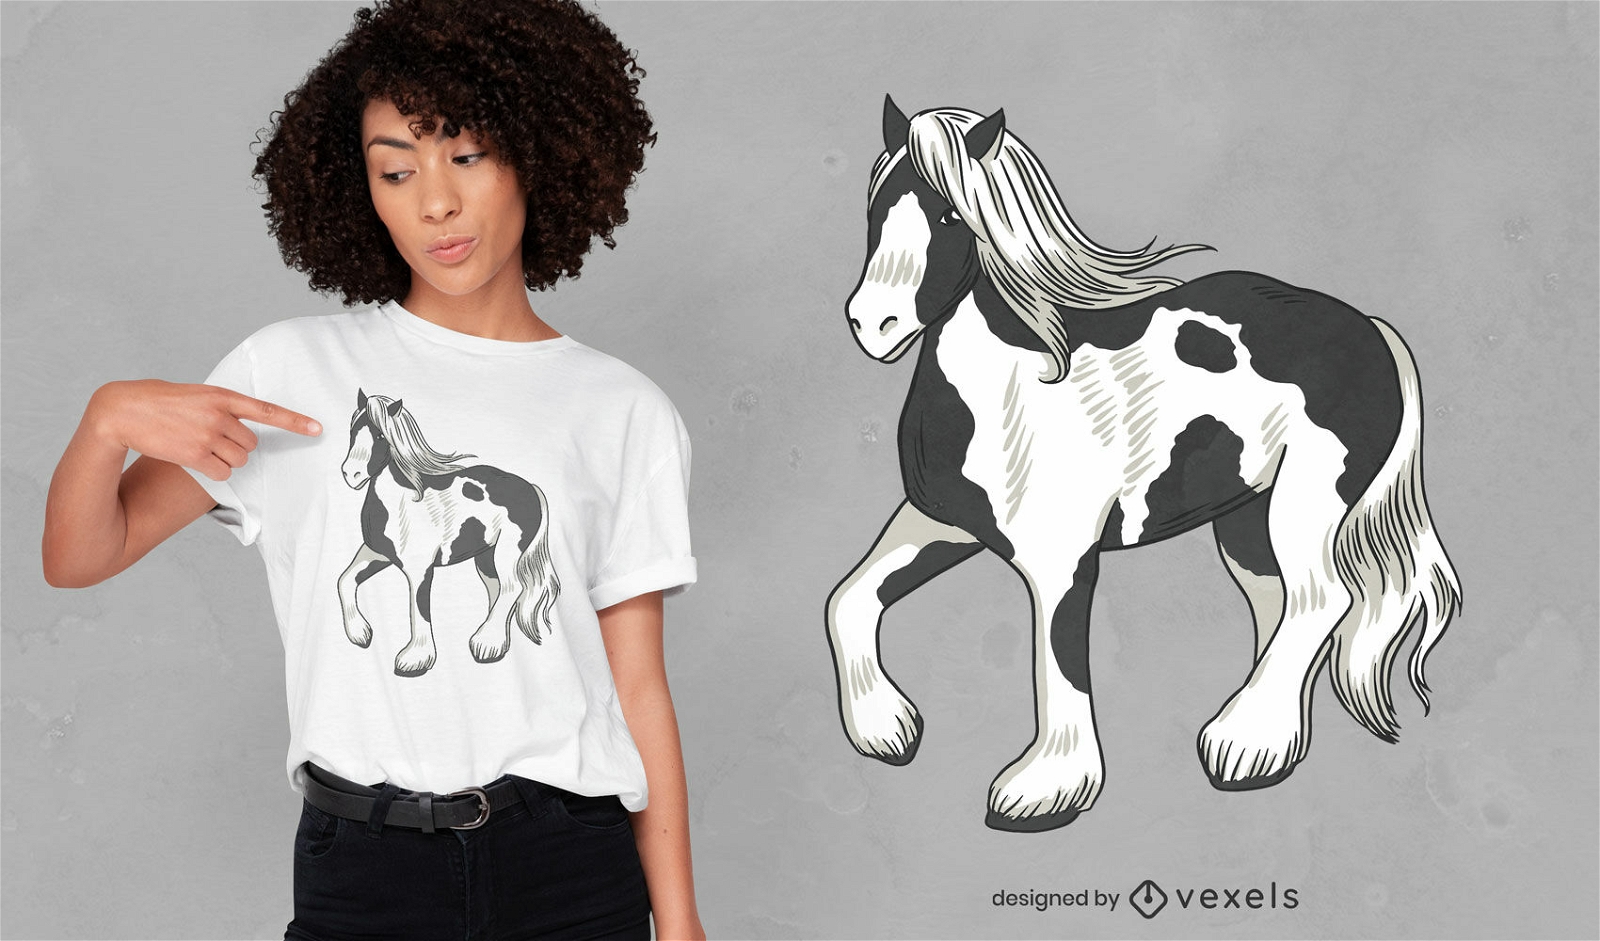
Cute spotted horse animal t-shirt design
Choose a folder
All favorites
Create new
Save
Cute spotted horse animal t-shirt design
Print ready
for Merch
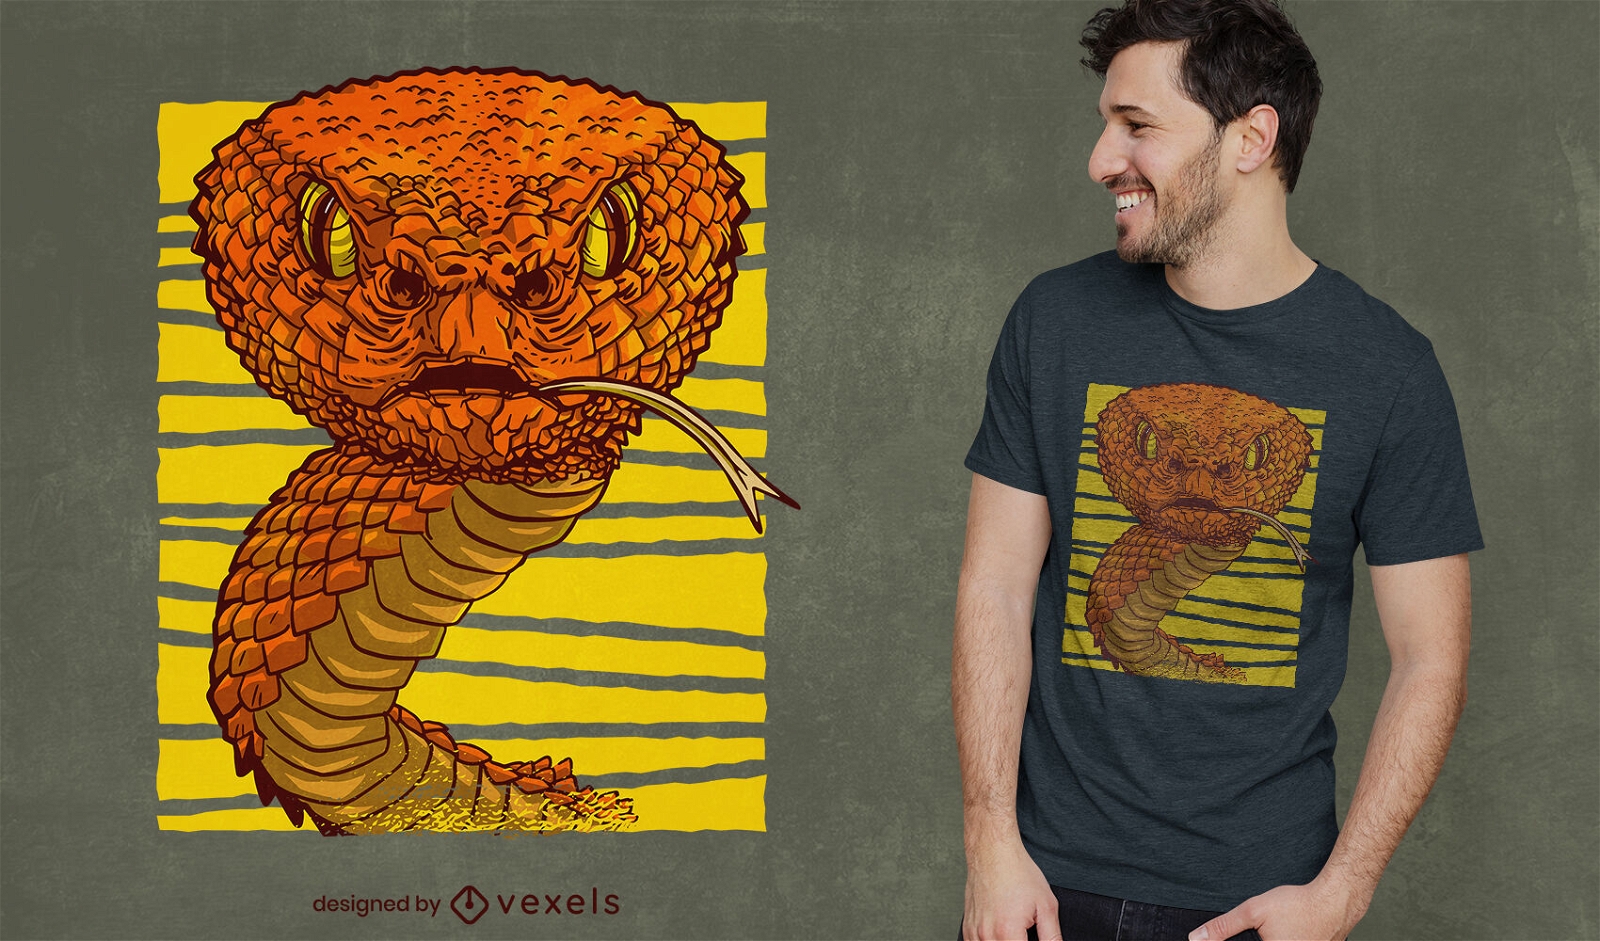
Realistic snake animal t-shirt design
Choose a folder
All favorites
Create new
Save
Realistic snake animal t-shirt design
Print ready
for Merch
Crypto buy quote t-shirt design
Choose a folder
All favorites
Create new
Save
Crypto buy quote t-shirt design
Print ready
for Merch
Not cartoons anime t-shirt design
Choose a folder
All favorites
Create new
Save
Not cartoons anime t-shirt design
Print ready
for Merch
Colorful Mandala Elephant T-Shirt Design
Choose a folder
All favorites
Create new
Save
Colorful Mandala Elephant T-Shirt Design
Editable text
Print ready
for Merch
It's fine shark t-shirt design
Choose a folder
All favorites
Create new
Save
It's fine shark t-shirt design
Editable text
Print ready
for Merch
Coconut tree political quote t-shirt design
Choose a folder
All favorites
Create new
Save
Coconut tree political quote t-shirt design
Editable text
Print ready
for Merch
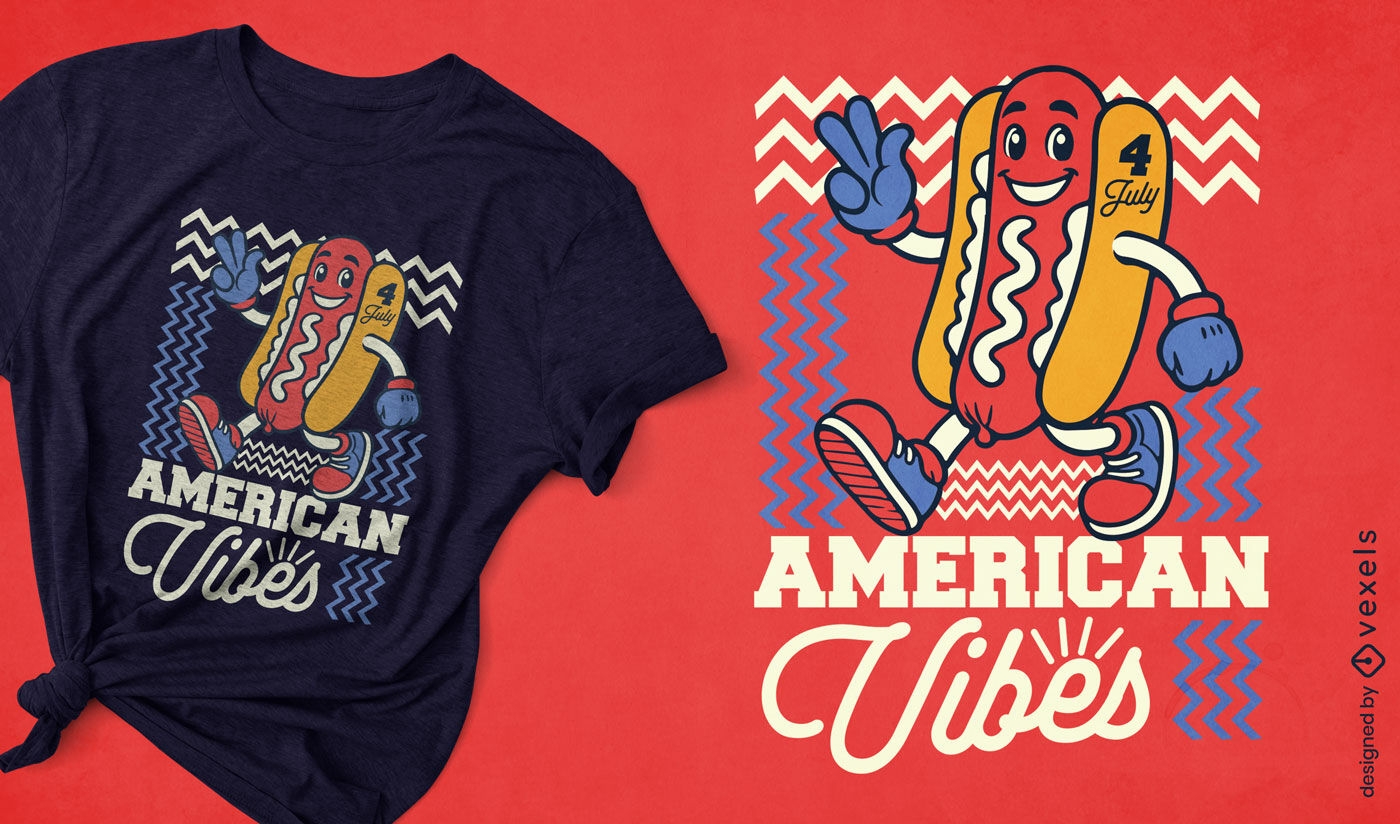
American vibes hot dog t-shirt design
Choose a folder
All favorites
Create new
Save
American vibes hot dog t-shirt design
Editable text
Print ready
for Merch
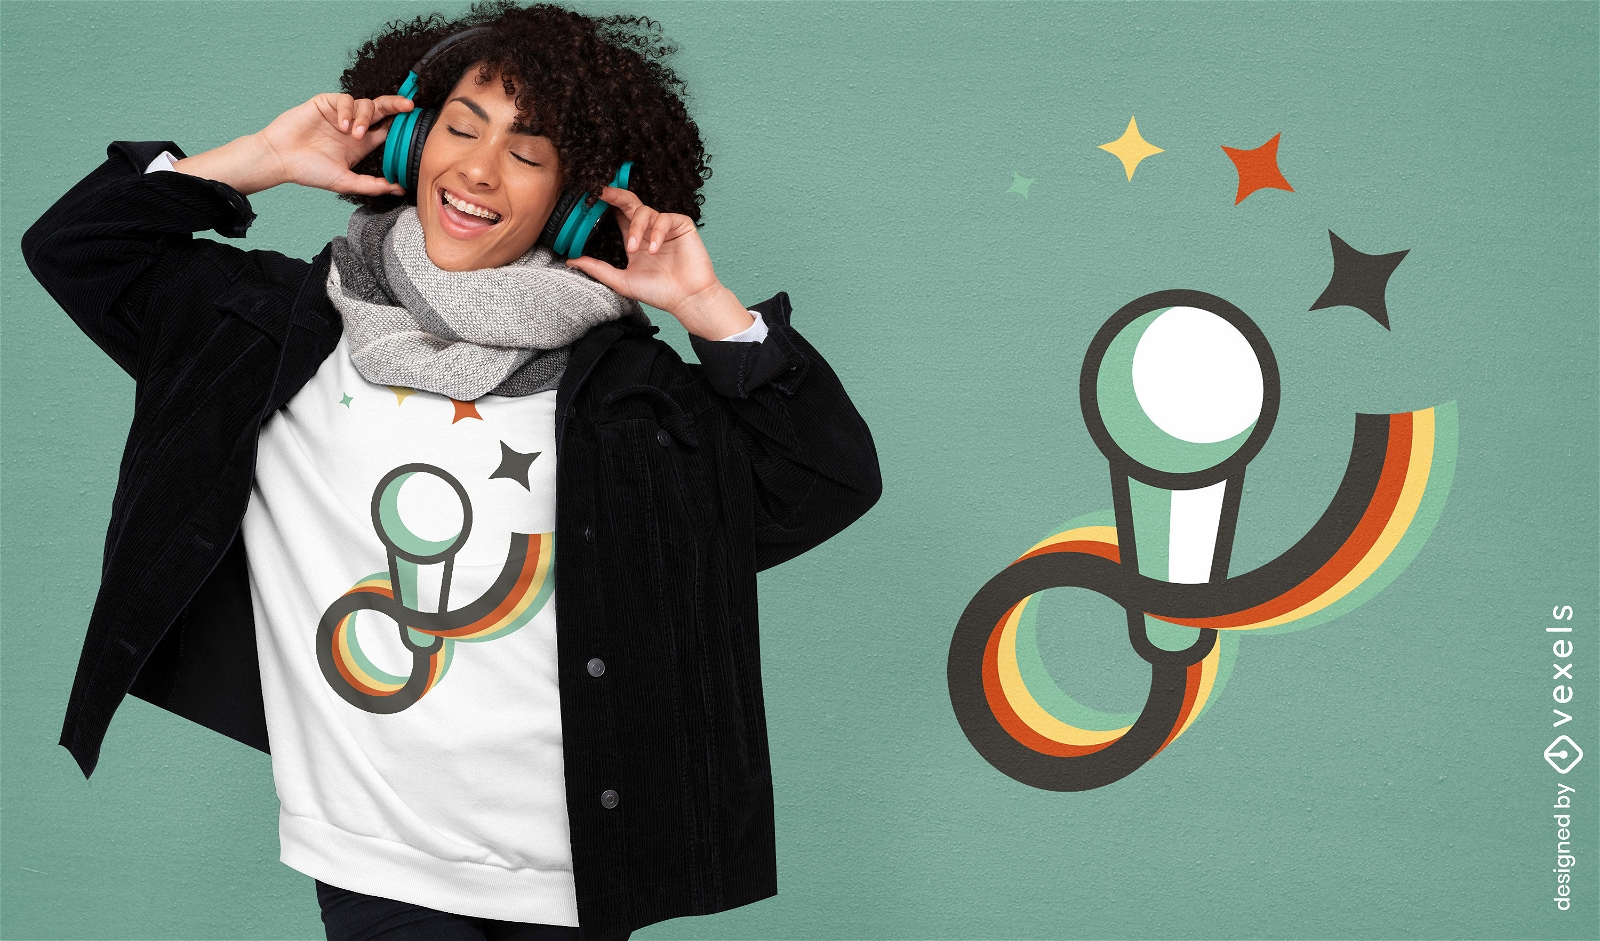
Retro music microphone t-shirt design
Choose a folder
All favorites
Create new
Save
Retro music microphone t-shirt design
Editable text
Print ready
for Merch
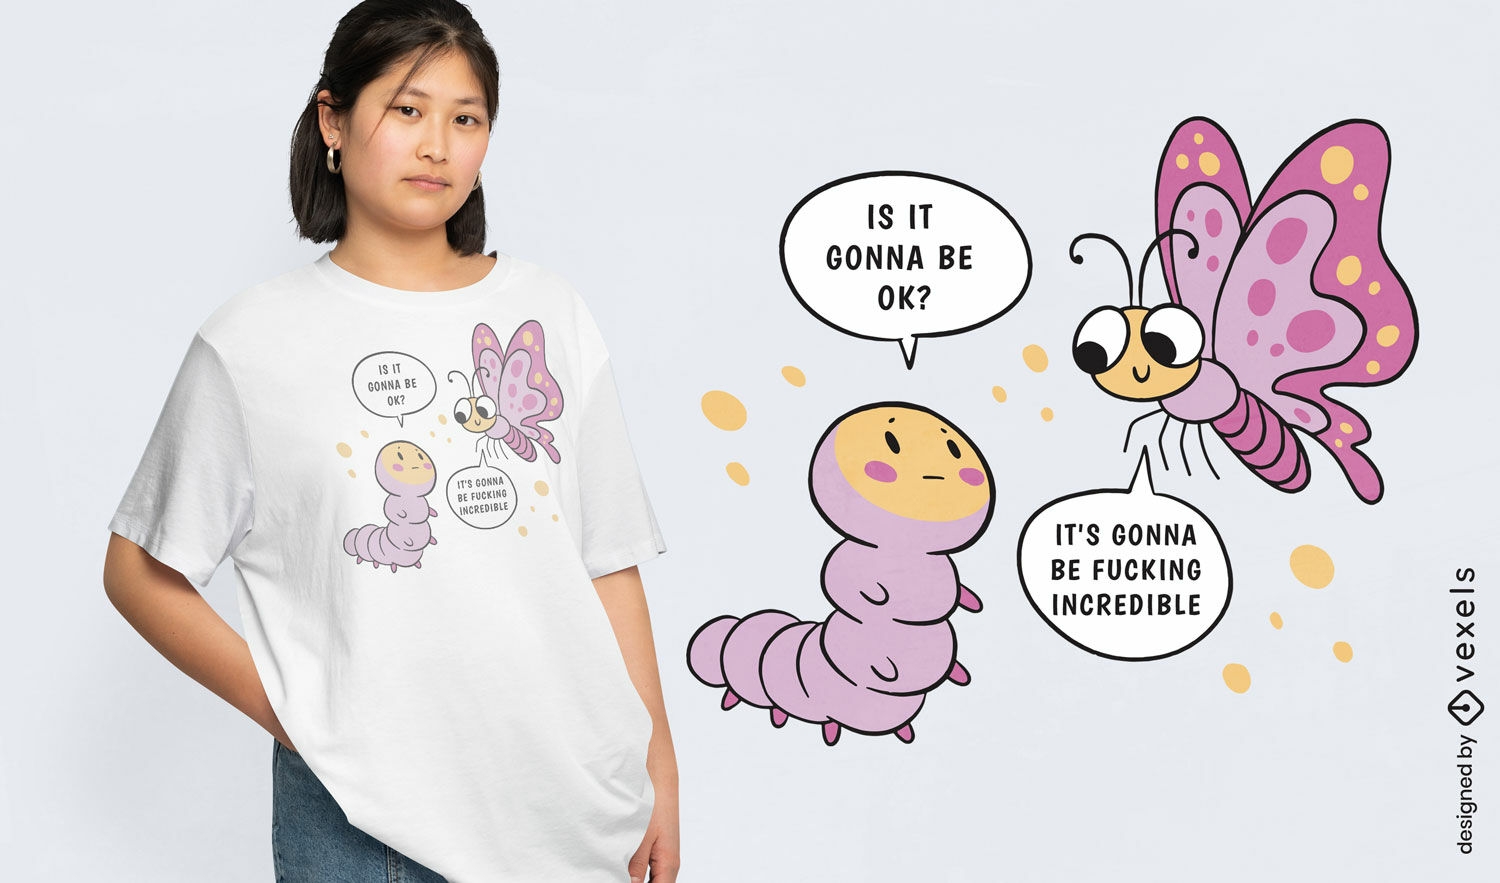
Motivational caterpillar and butterfly t-shirt design
Choose a folder
All favorites
Create new
Save
Motivational caterpillar and butterfly t-shirt design
Print ready
for Merch
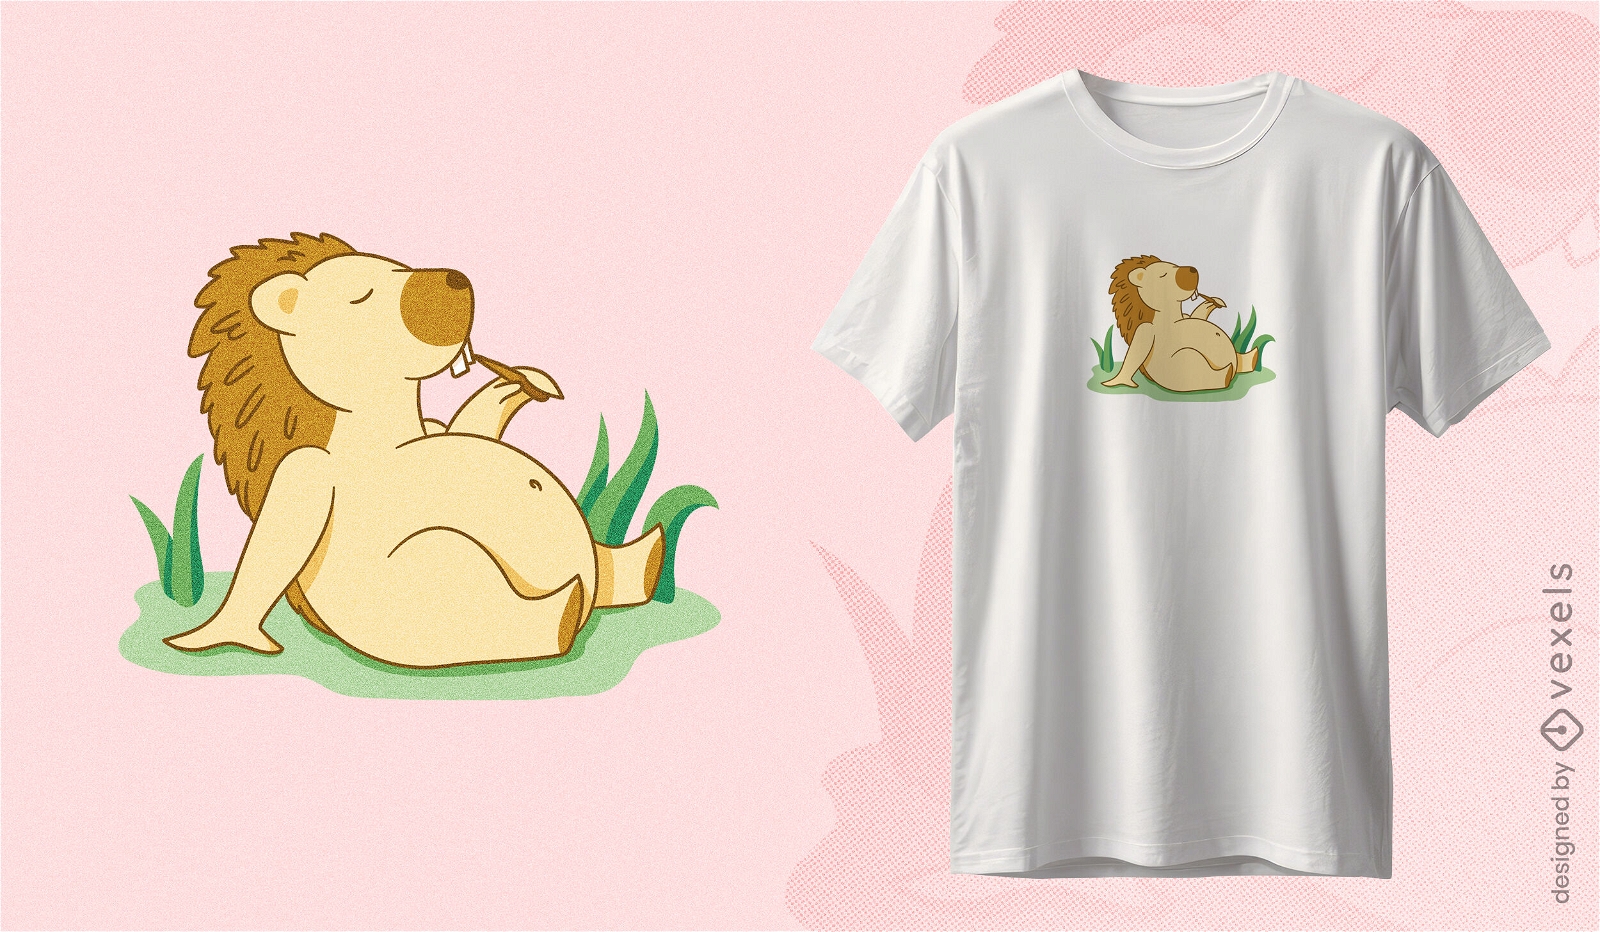
Lazy porcupine t-shirt design
Choose a folder
All favorites
Create new
Save
Lazy porcupine t-shirt design
Editable text
Print ready
for Merch
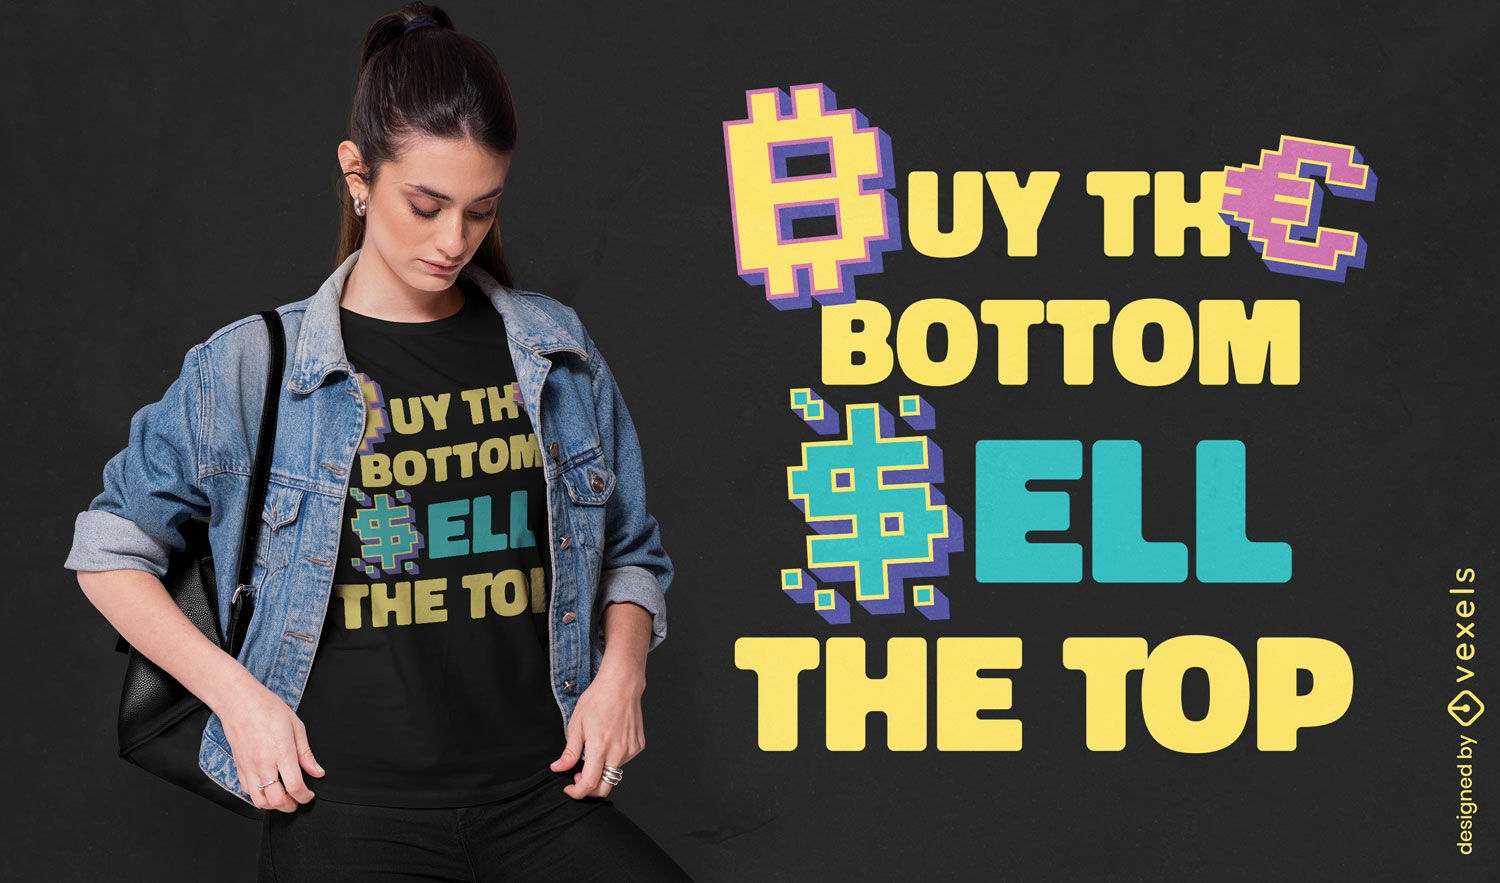
Cryptocurrency trading mantra t-shirt design
Choose a folder
All favorites
Create new
Save
Cryptocurrency trading mantra t-shirt design
Print ready
for Merch
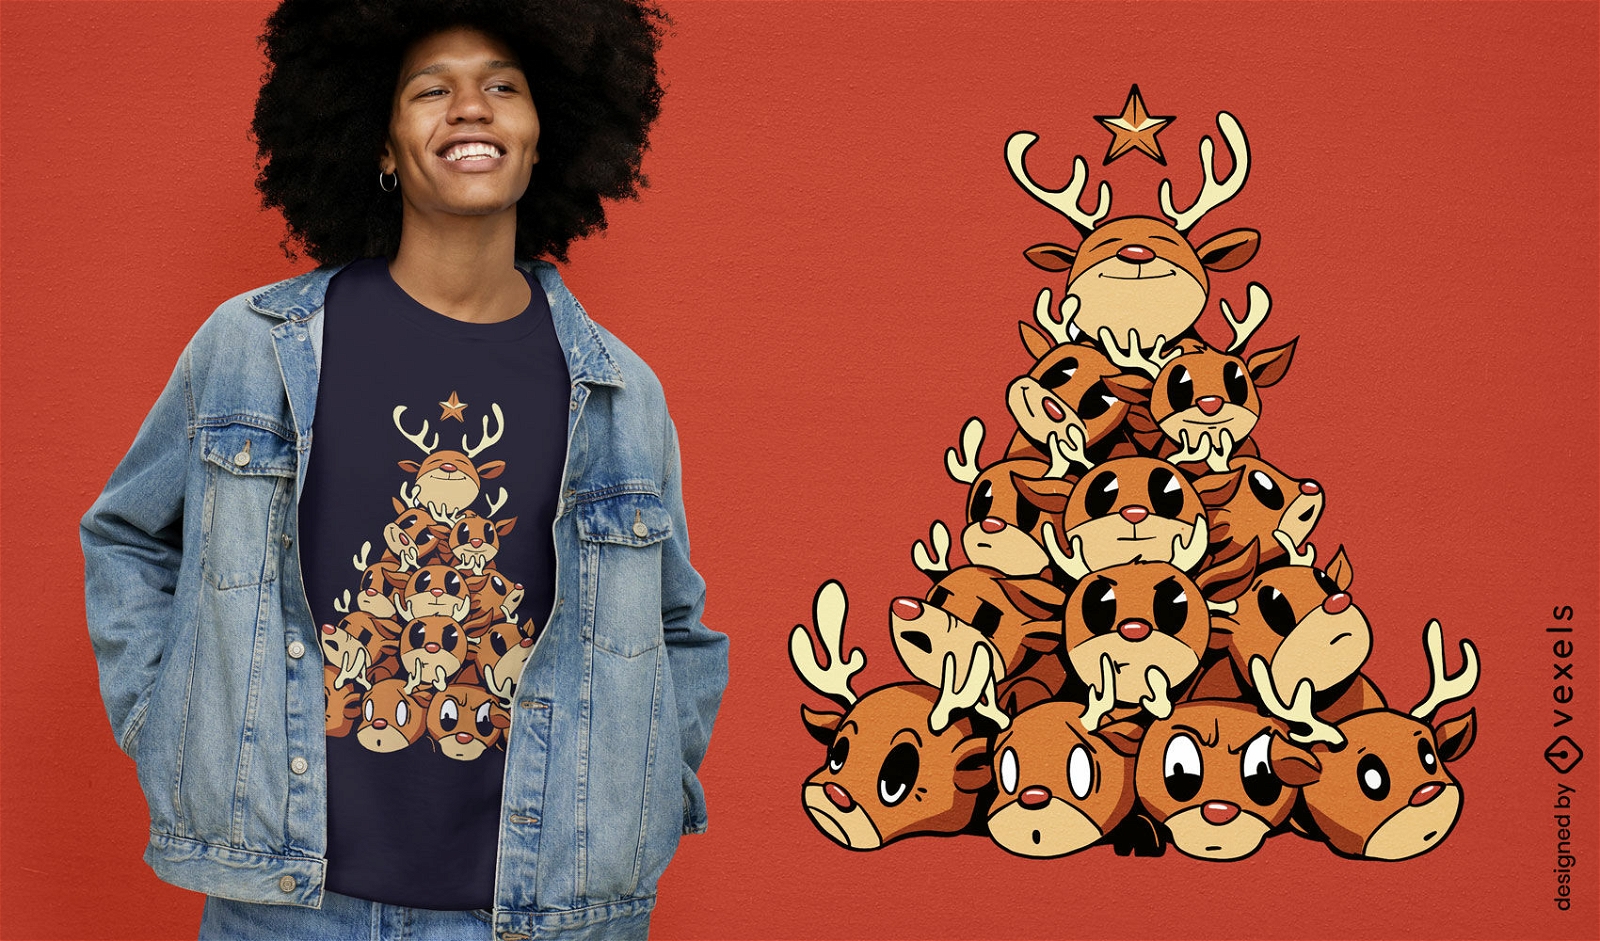
Reindeer pile Christmas t-shirt design
Choose a folder
All favorites
Create new
Save
Reindeer pile Christmas t-shirt design
Print ready
for Merch
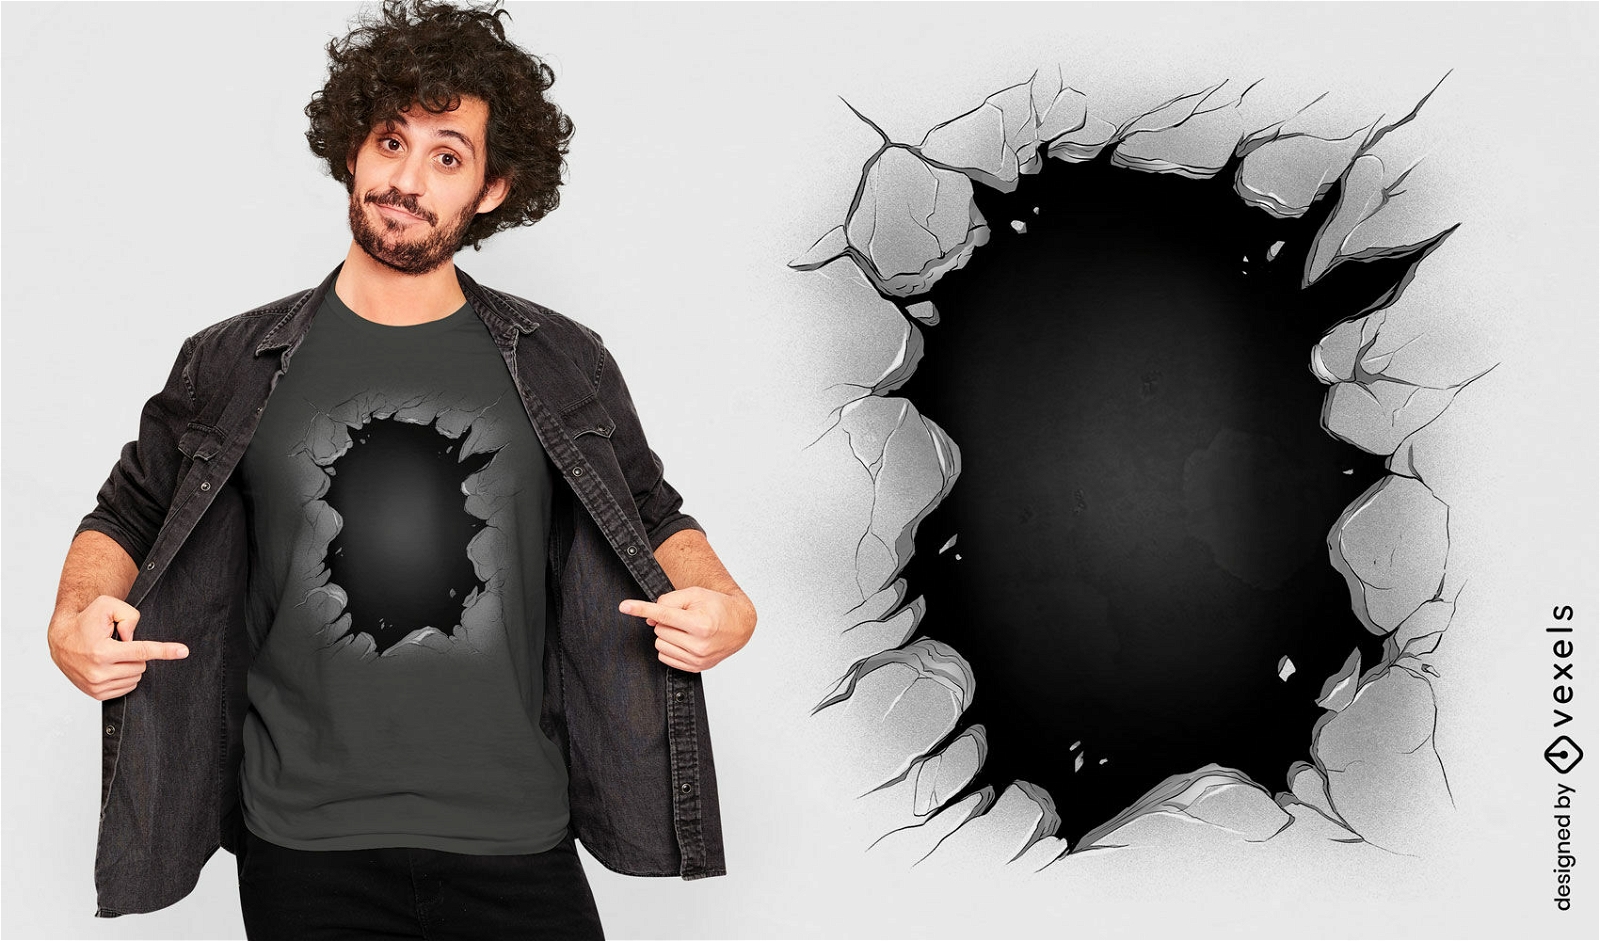
Wall hole t-shirt design
Choose a folder
All favorites
Create new
Save
Wall hole t-shirt design
Print ready
for Merch
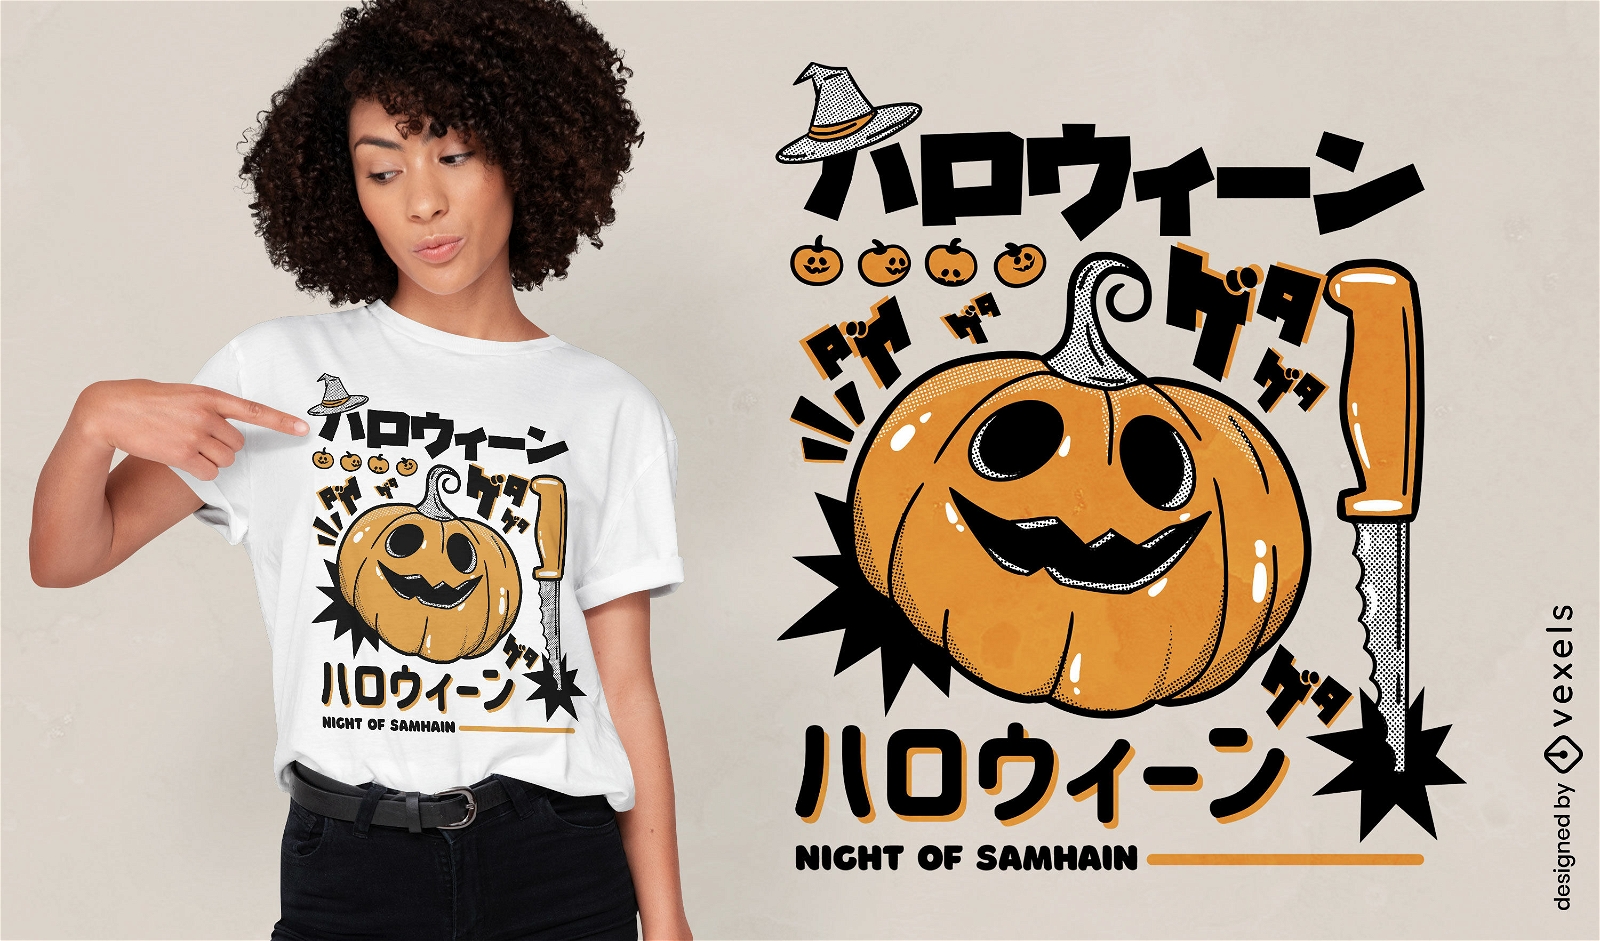
Pumpkin Halloween monster t-shirt design
Choose a folder
All favorites
Create new
Save
Pumpkin Halloween monster t-shirt design
Print ready
for Merch
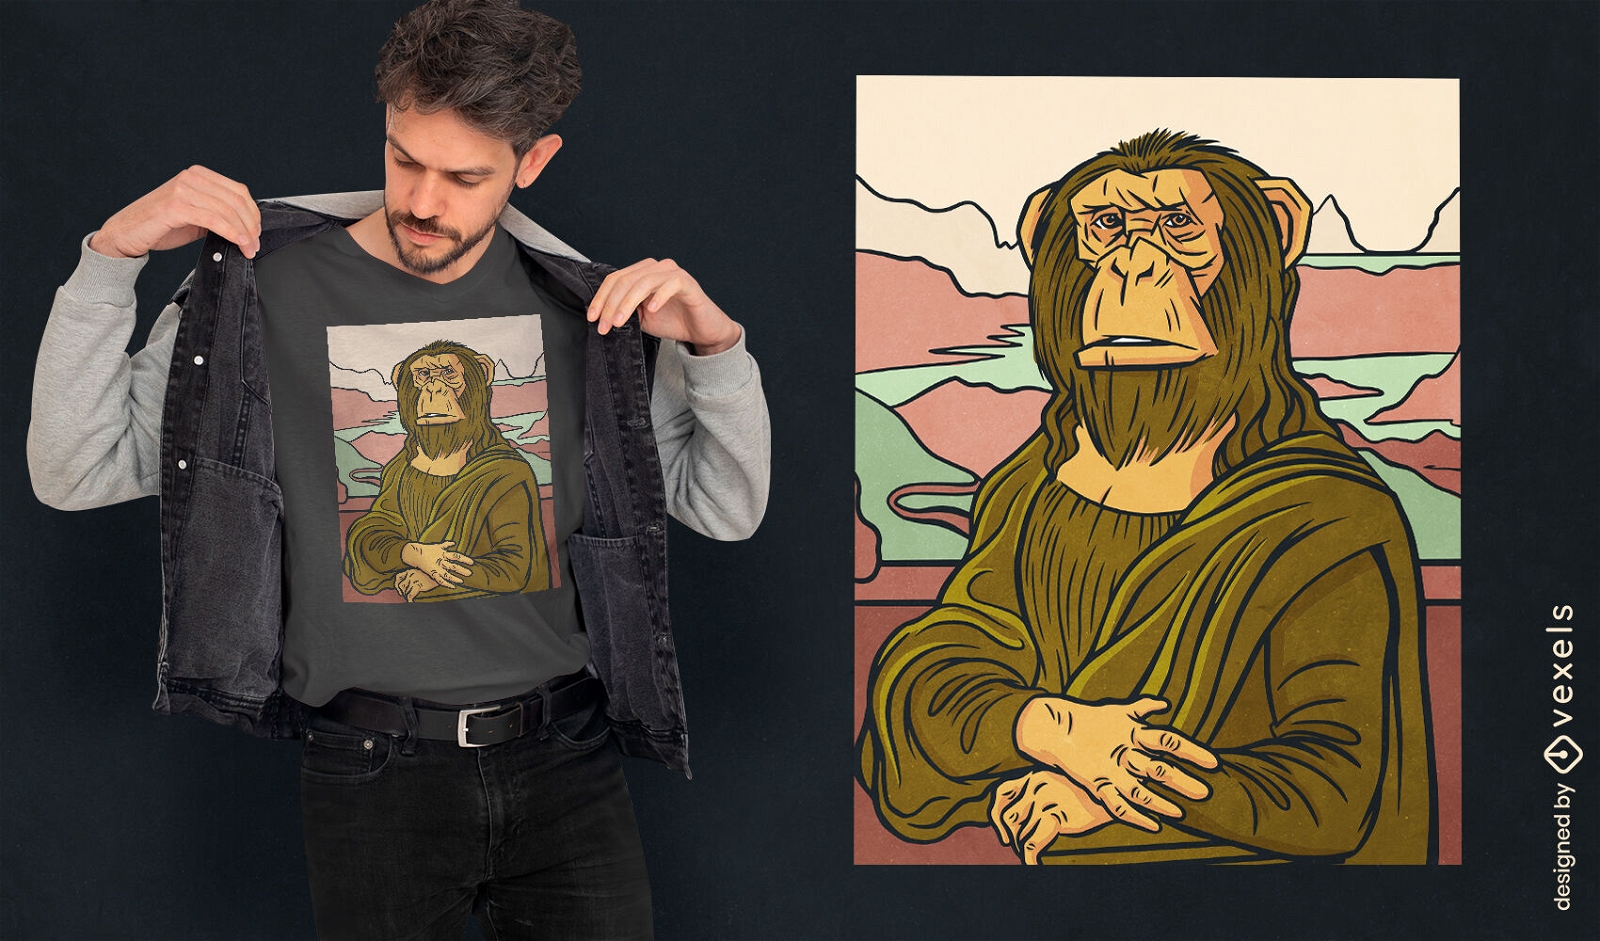
Monkey mona lisa painting t-shirt design
Choose a folder
All favorites
Create new
Save
Monkey mona lisa painting t-shirt design
Print ready
for Merch
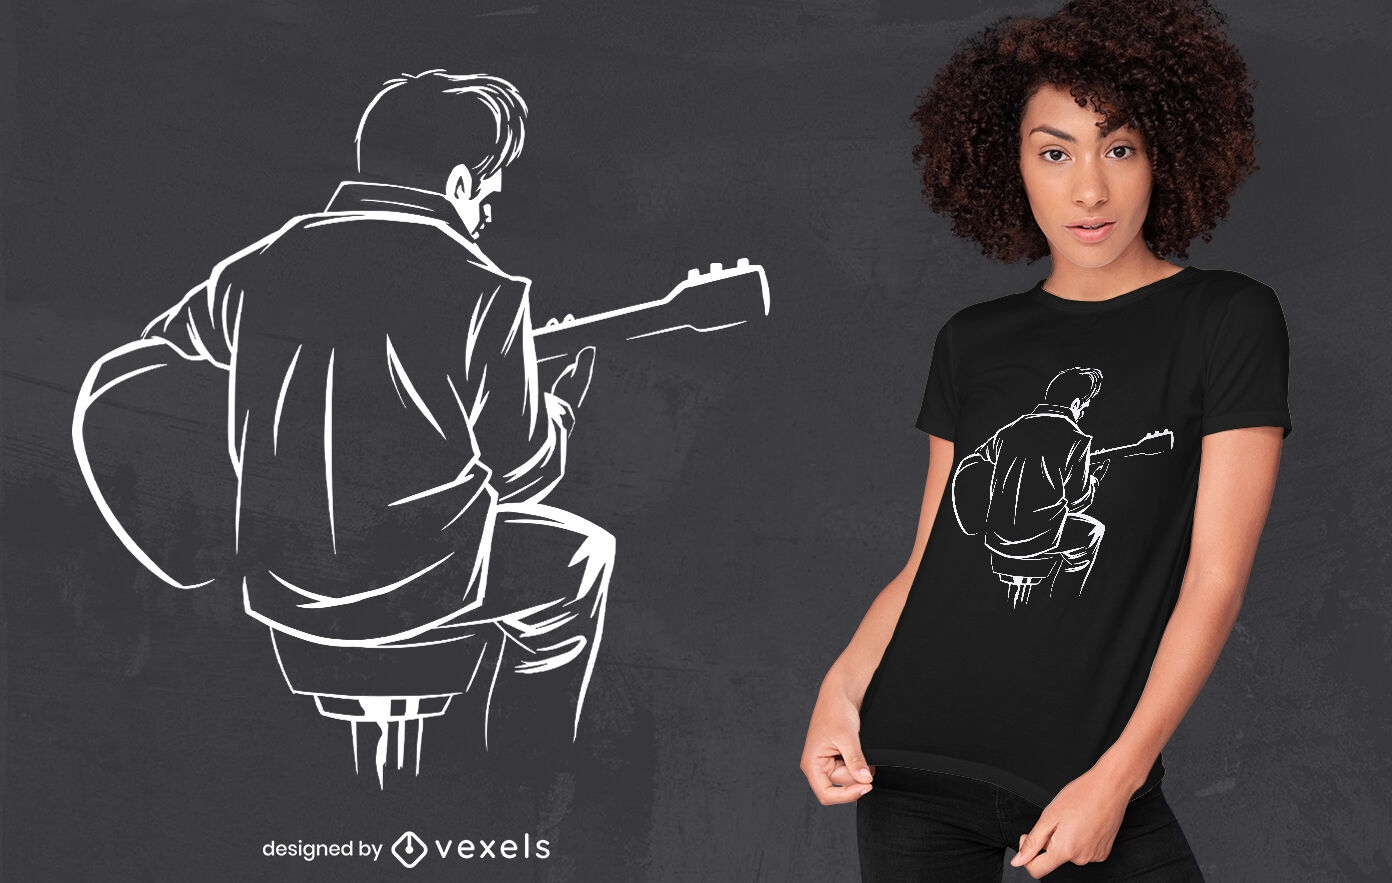
Man playing guitar music instrument t-shirt design
Choose a folder
All favorites
Create new
Save
Man playing guitar music instrument t-shirt design
Print ready
for Merch
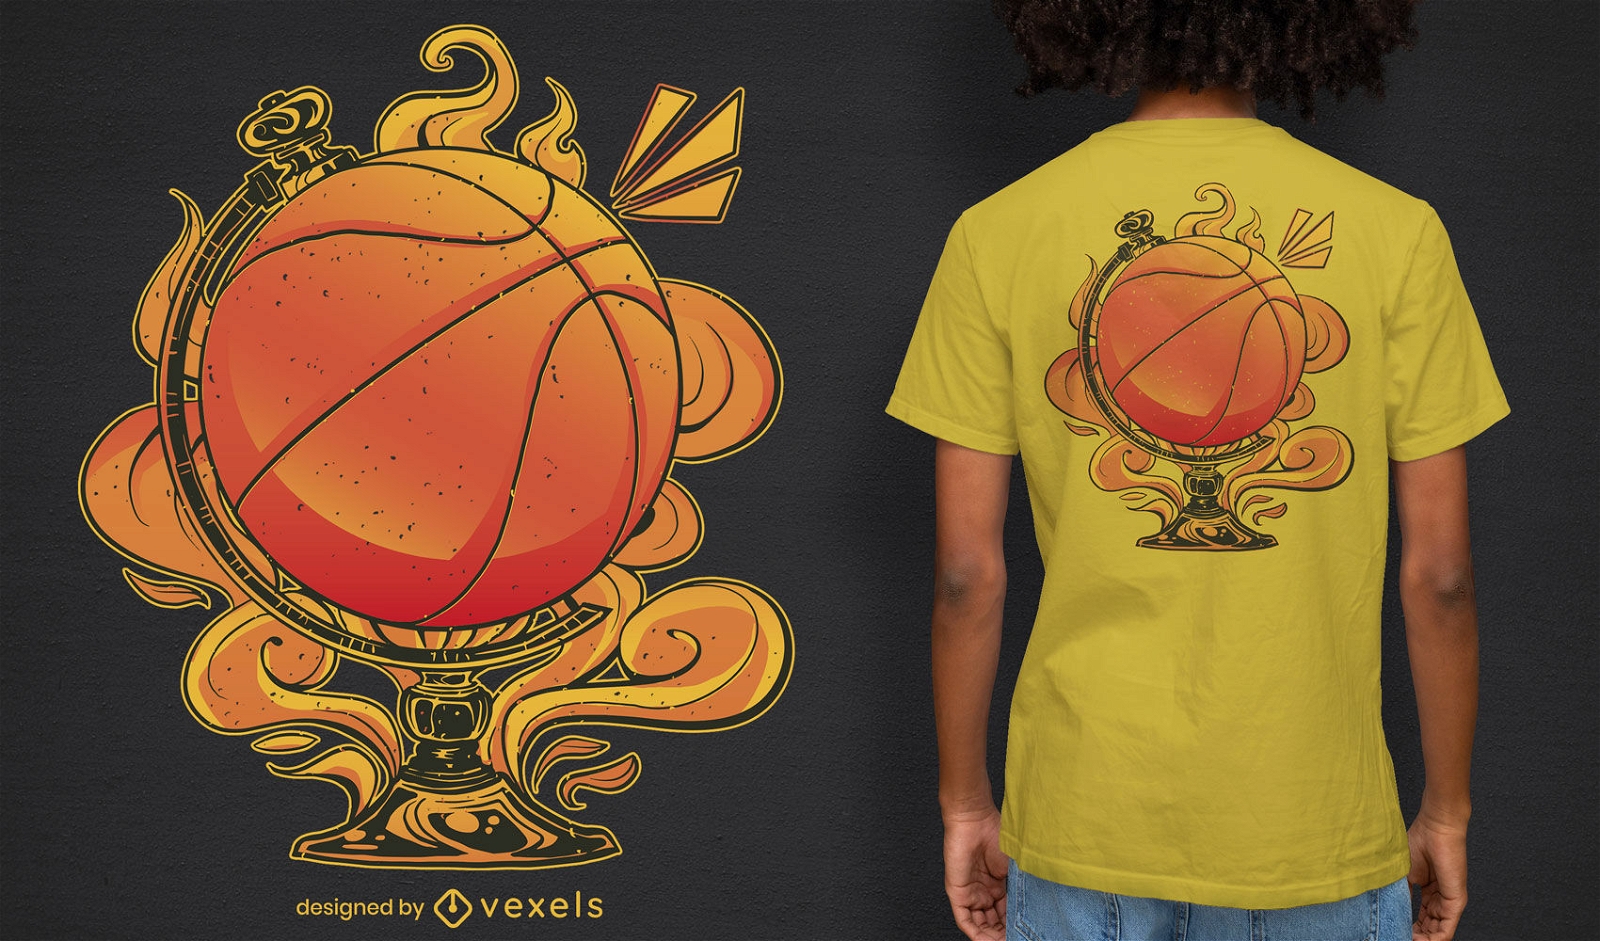
Basketball sport globe t-shirt design
Choose a folder
All favorites
Create new
Save
Basketball sport globe t-shirt design
Boost Your Business
With The Leading Graphic Platform For Merch.
SEE PLANS
Next
of 720
prev page
next page