Design Library
New Merch Designs
T-Shirts
Vectors
Trending Merch Designs
PNGs & SVGs
Mockups
T-Shirt PSD Templates
Explore Designs
KDP Designs
Posters
Mugs
Phone Cases
Tote Bags
Pillows
Design Tools
Merch Designer
New!
Mockup Generator
AI Design Generator
Image Vectorizer
Quote Generator
T-Shirt Maker (Old)
Resources
Merch Digest
Blog
Help Center
Learn About Merch
Feedback
Corporate Solutions
Enterprise
API Access
Design Studio
Bulk Design Production
Pricing
Loading...
Sign Up
Login
Vectors
graph
Design Library
New Merch Designs
T-Shirts
Vectors
Trending Merch Designs
PNGs & SVGs
Mockups
T-Shirt PSD Templates
Explore Designs
KDP Designs
Posters
Mugs
Phone Cases
Tote Bags
Pillows
Design Tools
Merch Designer
New!
Mockup Generator
AI Design Generator
Image Vectorizer
Quote Generator
T-Shirt Maker (Old)
Resources
Merch Digest
Blog
Help Center
Learn About Merch
Feedback
Corporate Solutions
Enterprise
API Access
Design Studio
Bulk Design Production
PLANS
Vectors
graph
159 graph Vectors & Graphics to Download
Download graph editable vector graphics for every design project. In AI, SVG, PNG, JPG and PSD.
Related:
graphic novel
,
this graphic tee design can be used on shirts
,
graphics
Sort by
Most relevant
Sponsored results by
Get 15% off with code: VEXELS15
Show more
Latest Business News on Laptop
Choose a folder
All favorites
Create new
Save
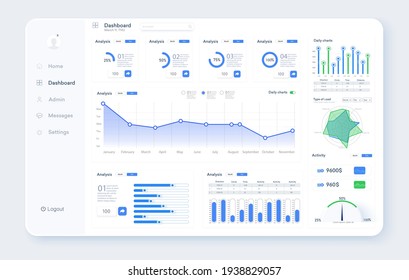
Latest Business News on Laptop
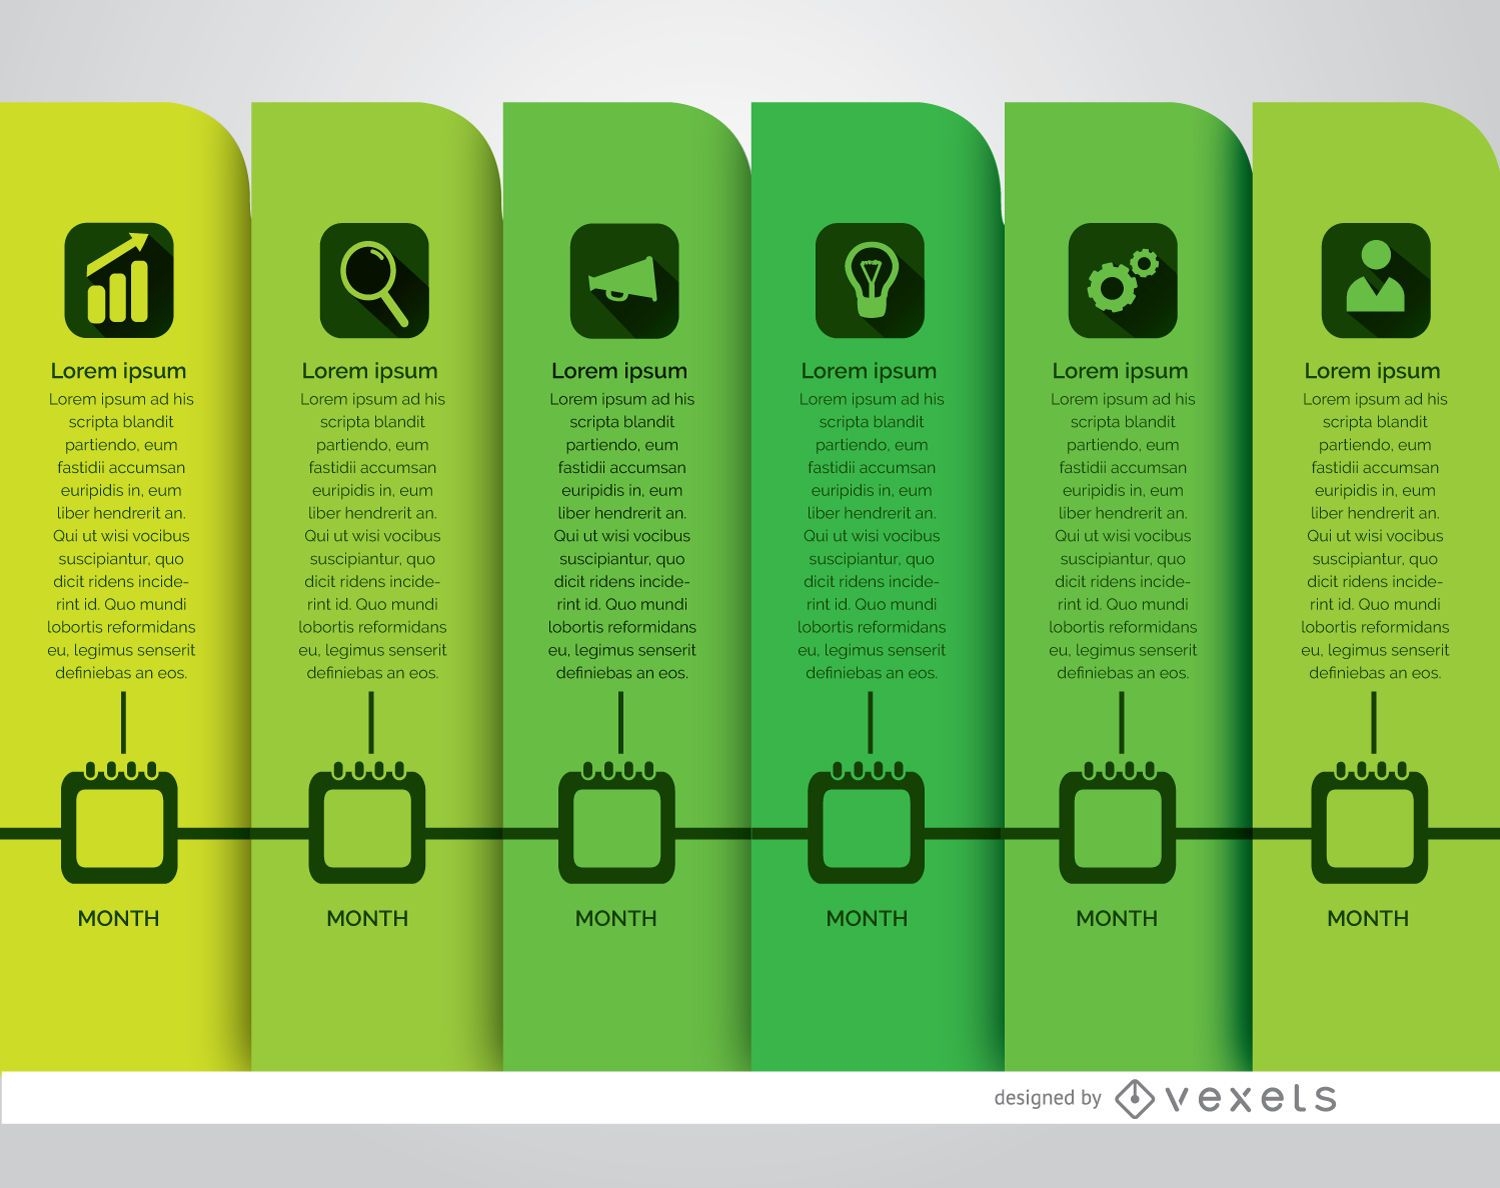
Timeline business development schedule
Choose a folder
All favorites
Create new
Save
Timeline business development schedule
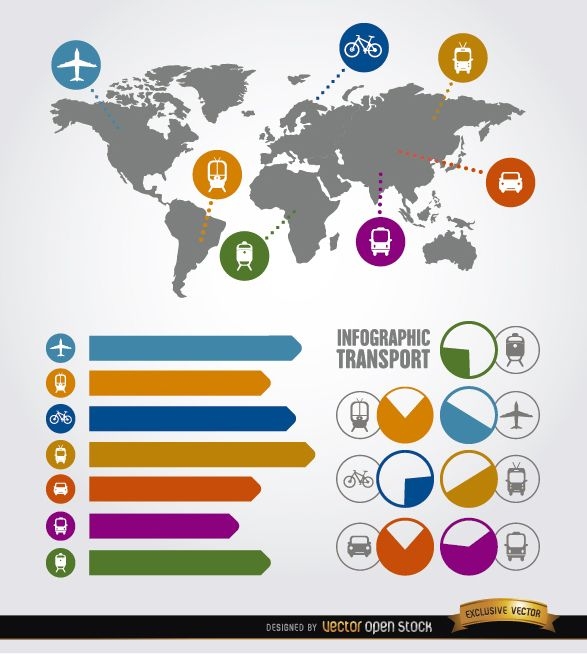
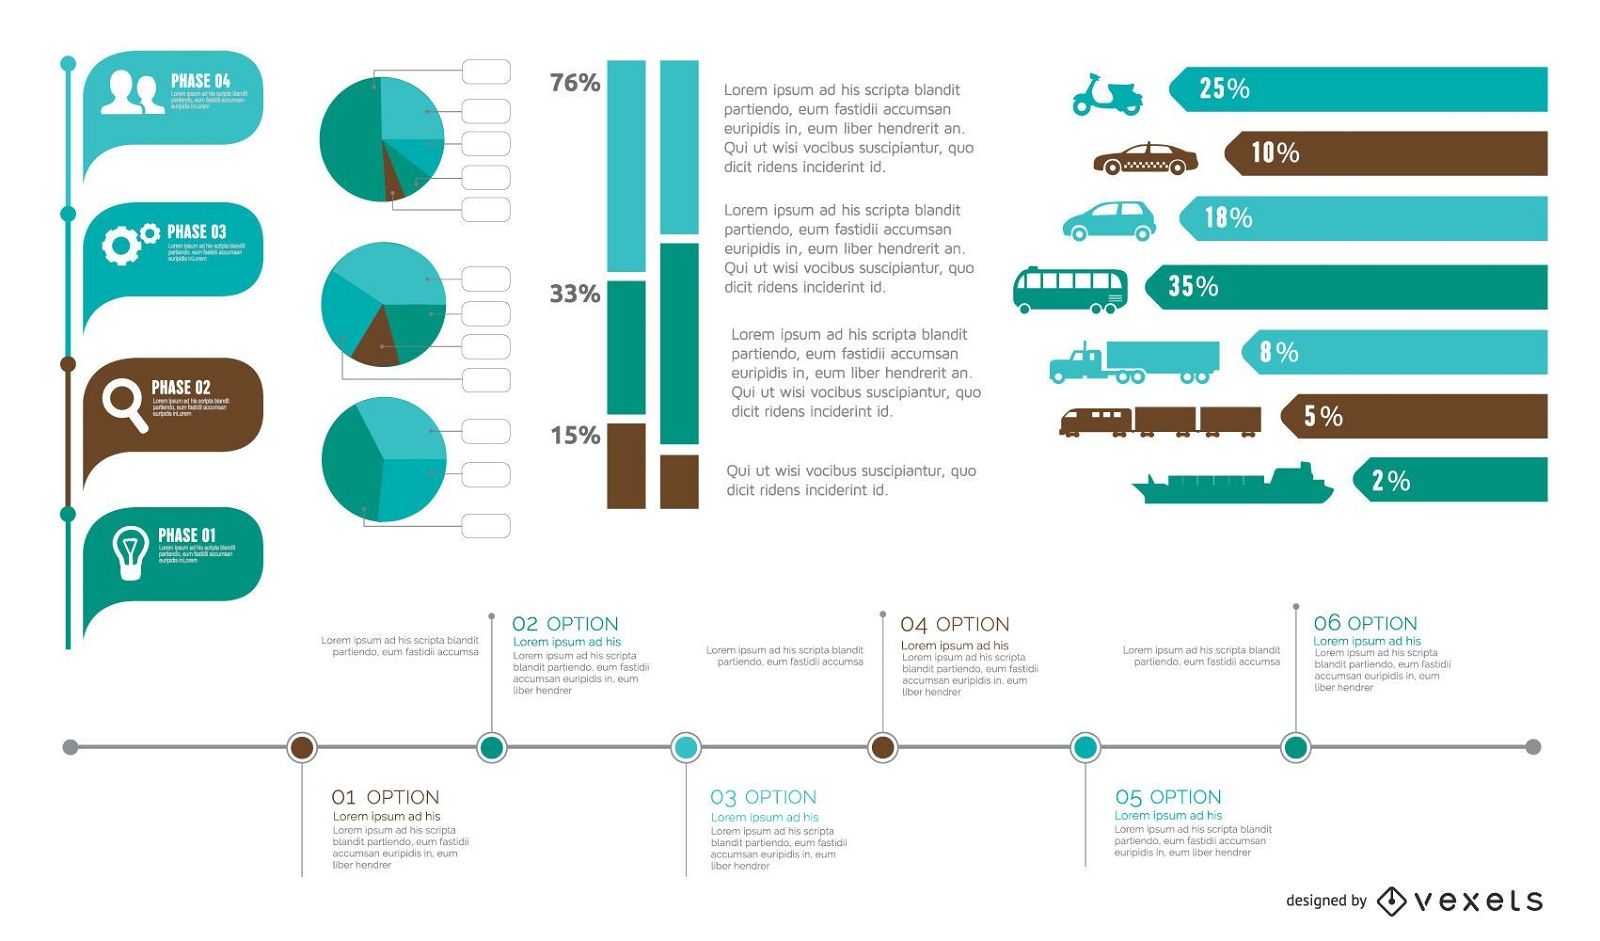
Travel infographic transport elements
Choose a folder
All favorites
Create new
Save
Travel infographic transport elements
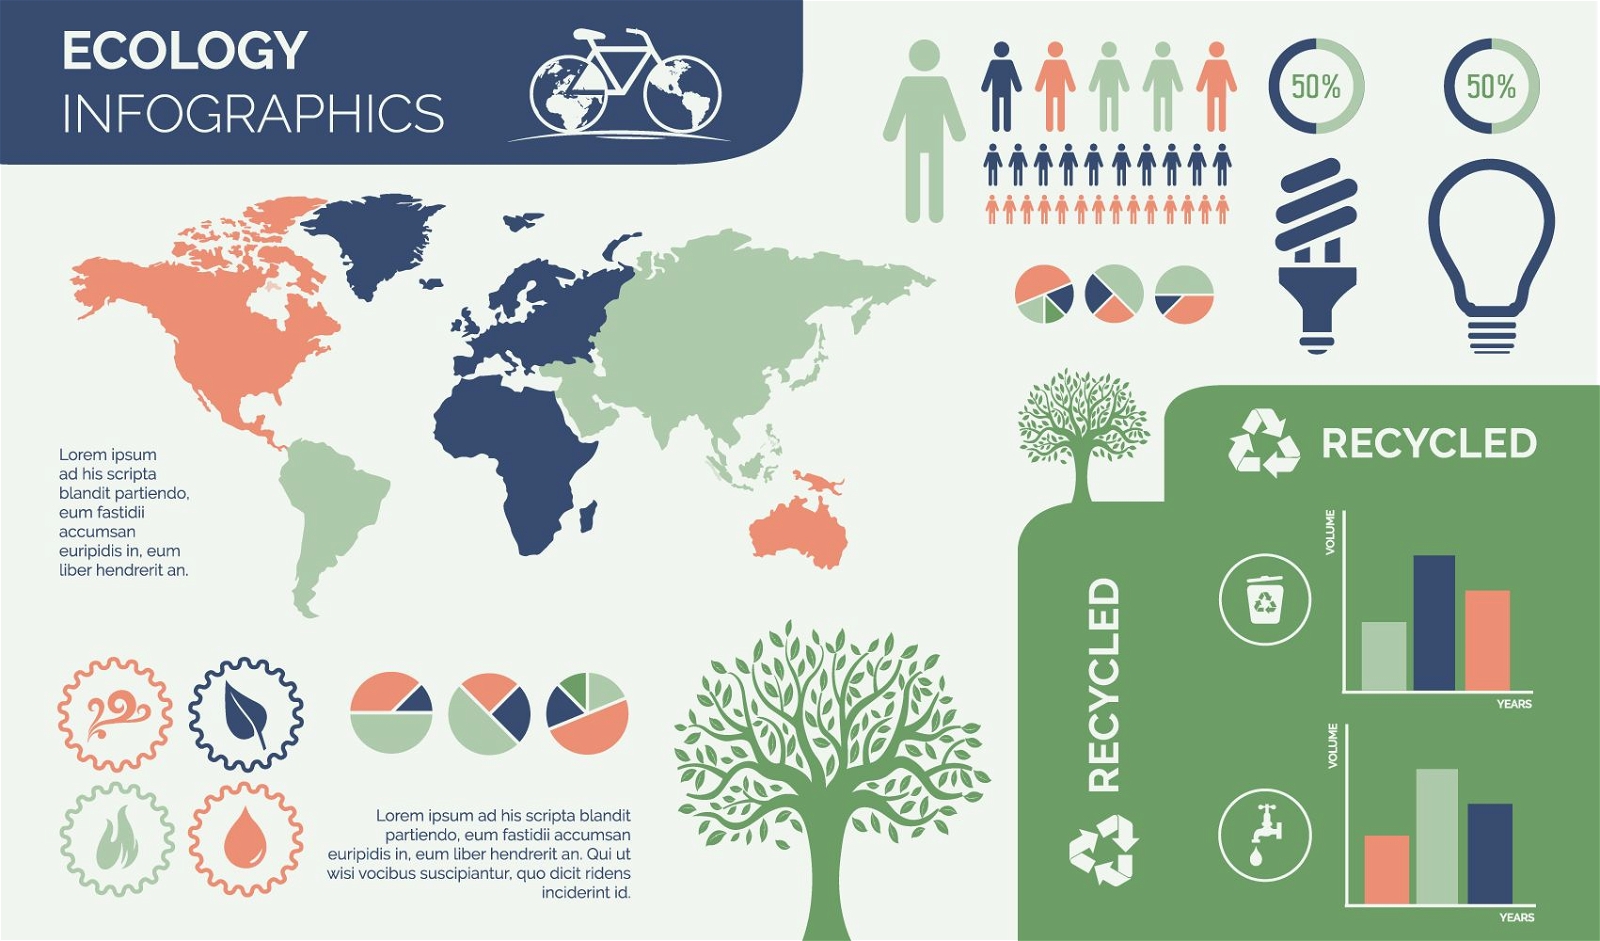
Environmental Ecology Infographic Design
Choose a folder
All favorites
Create new
Save
Environmental Ecology Infographic Design
Business Chart Icon Pack
Choose a folder
All favorites
Create new
Save
Business Chart Icon Pack
Statistic & Analytical Infographic Set
Choose a folder
All favorites
Create new
Save
Statistic & Analytical Infographic Set
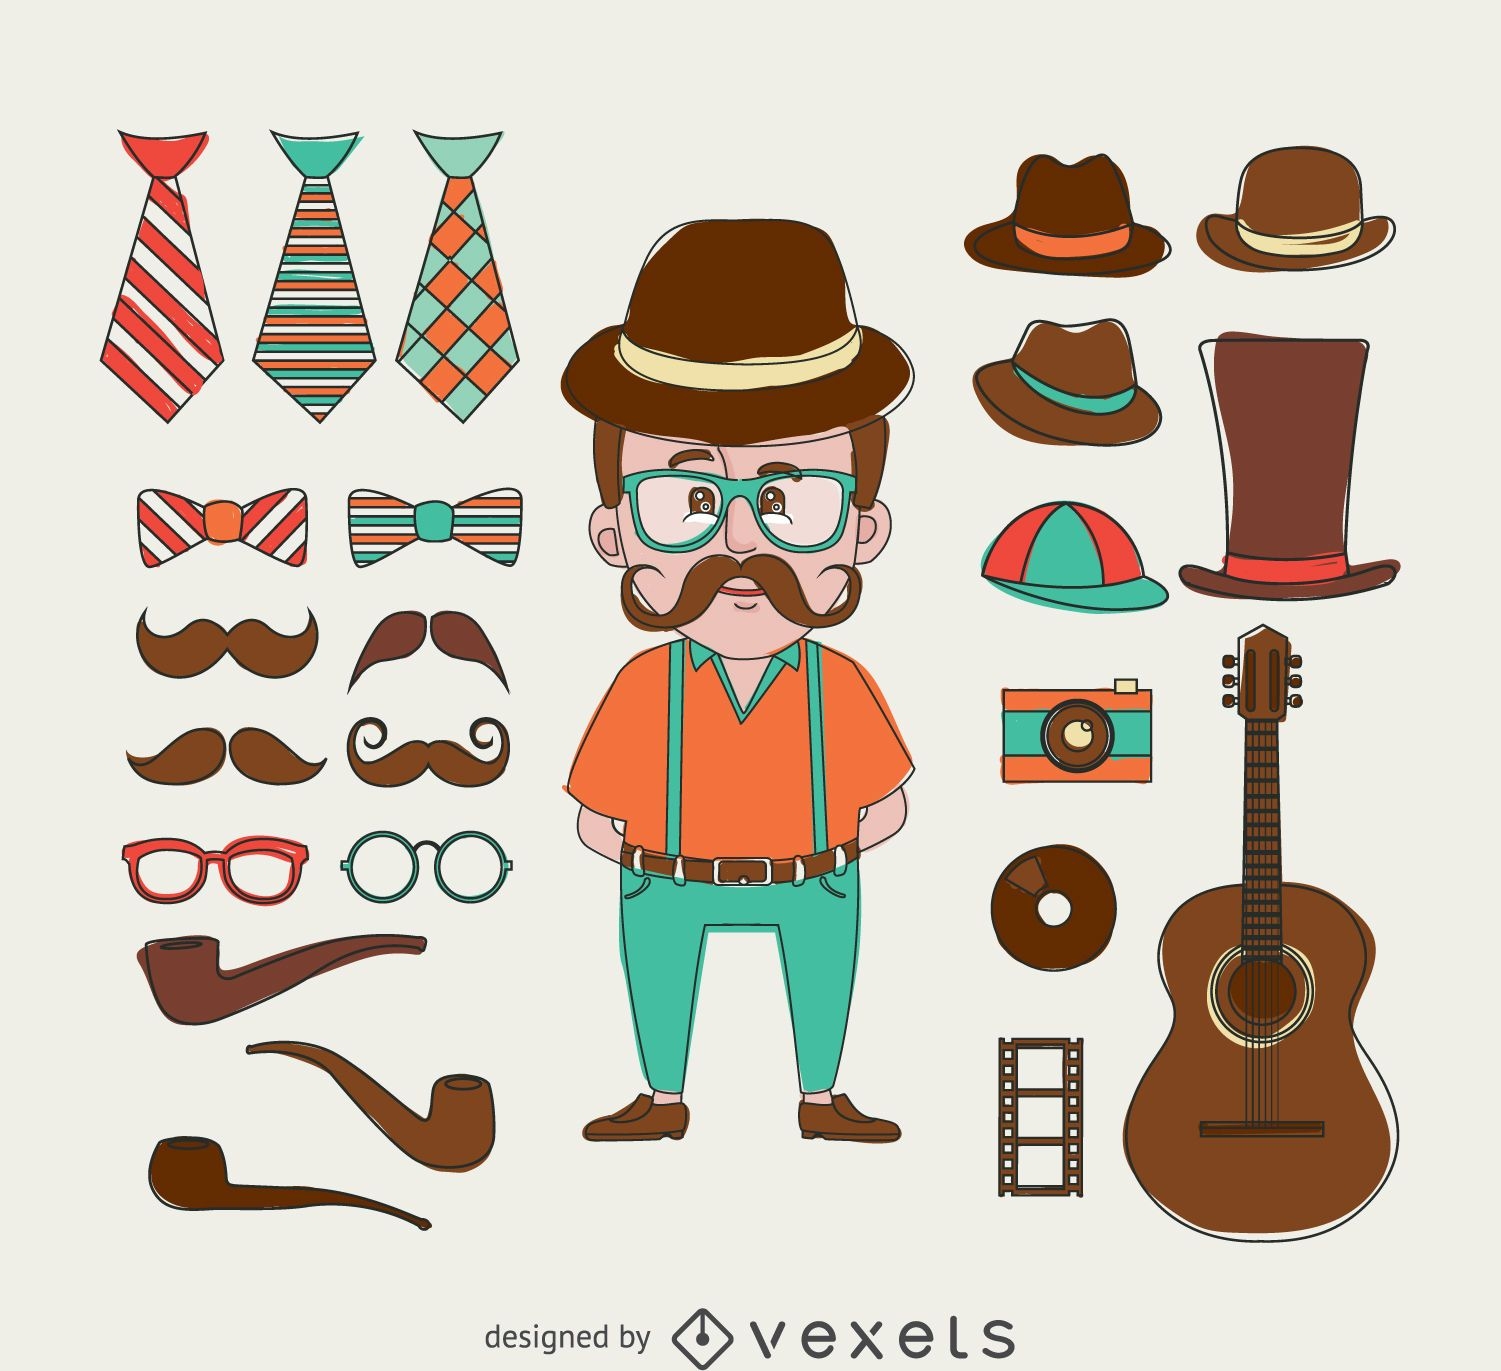
Hipster illustration with elements
Choose a folder
All favorites
Create new
Save
Hipster illustration with elements
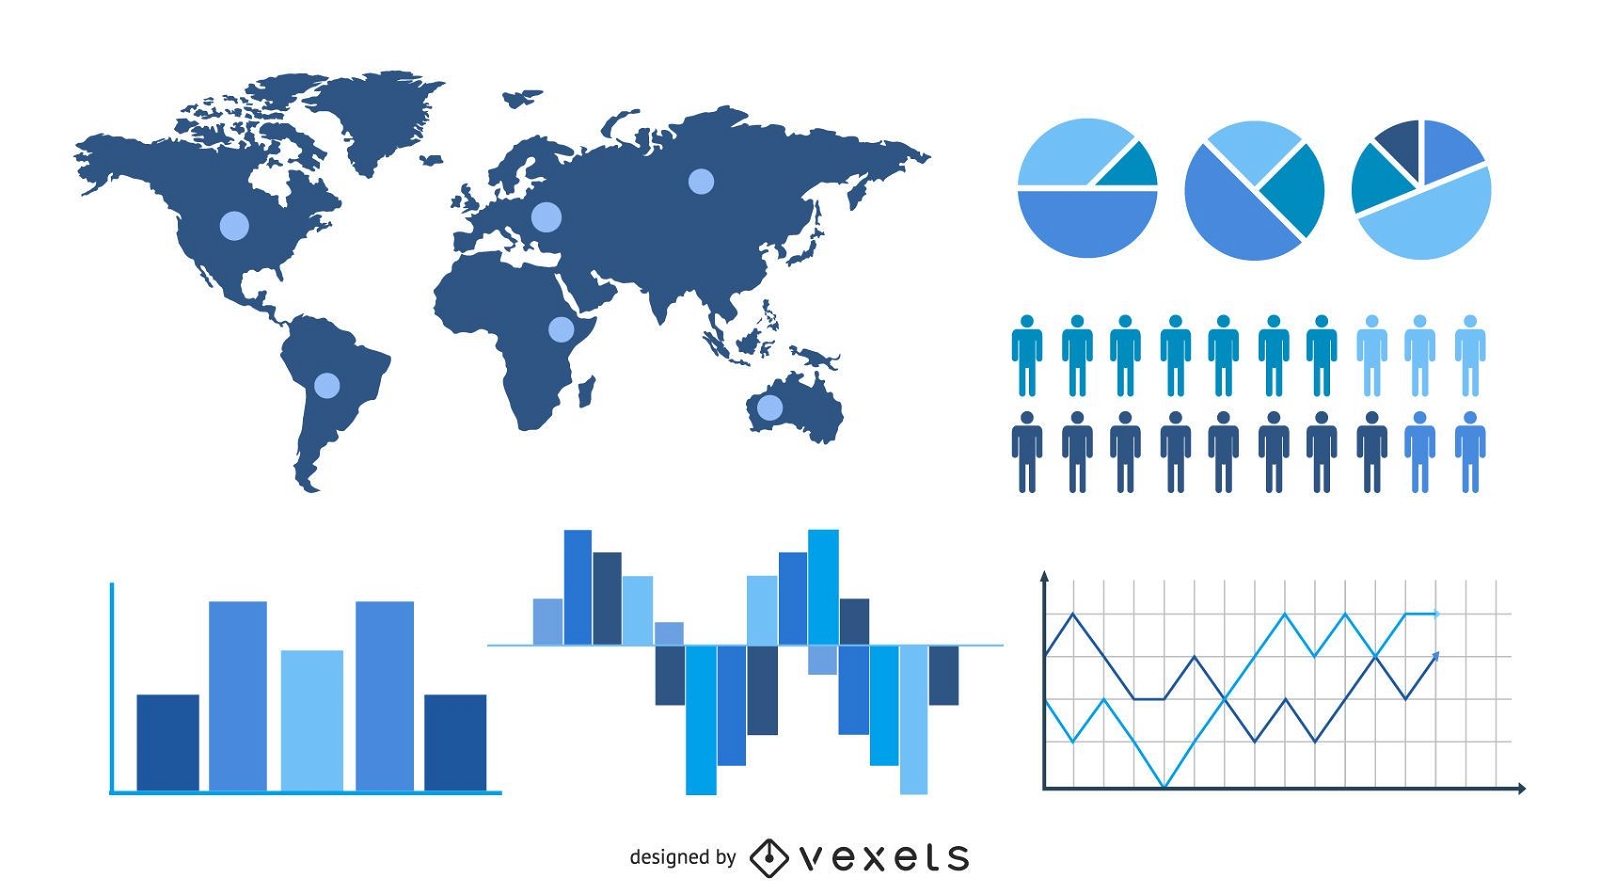
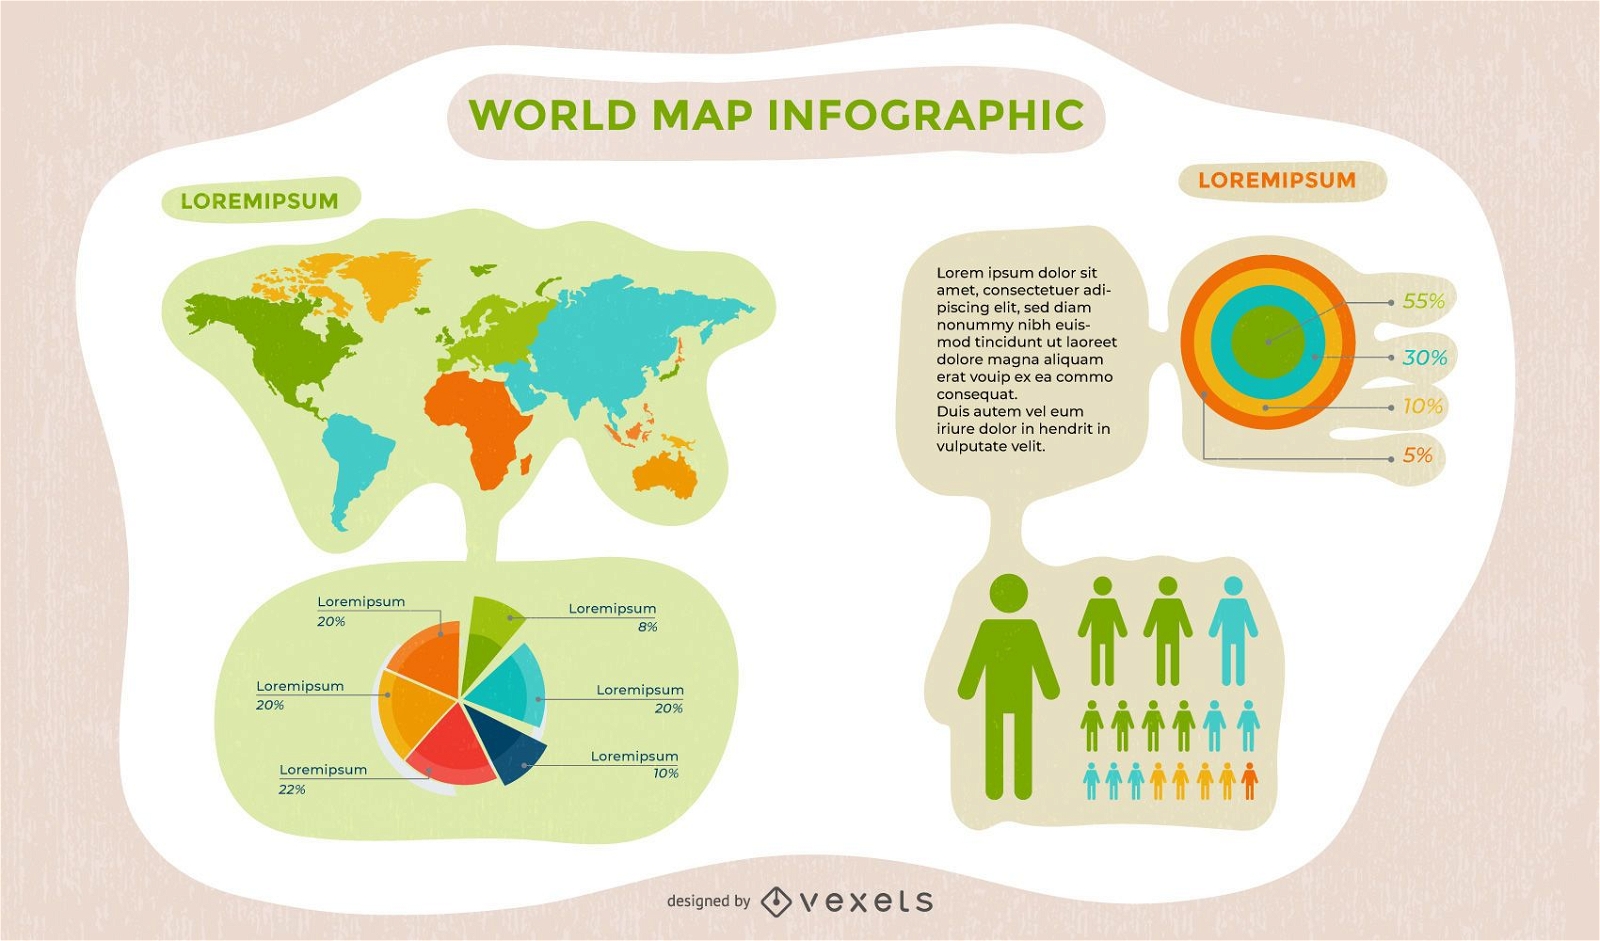
Communication World Map Infographic
Choose a folder
All favorites
Create new
Save
Communication World Map Infographic
Business Peoples & Puzzles with Sign
Choose a folder
All favorites
Create new
Save
Business Peoples & Puzzles with Sign
Editable text
Premium
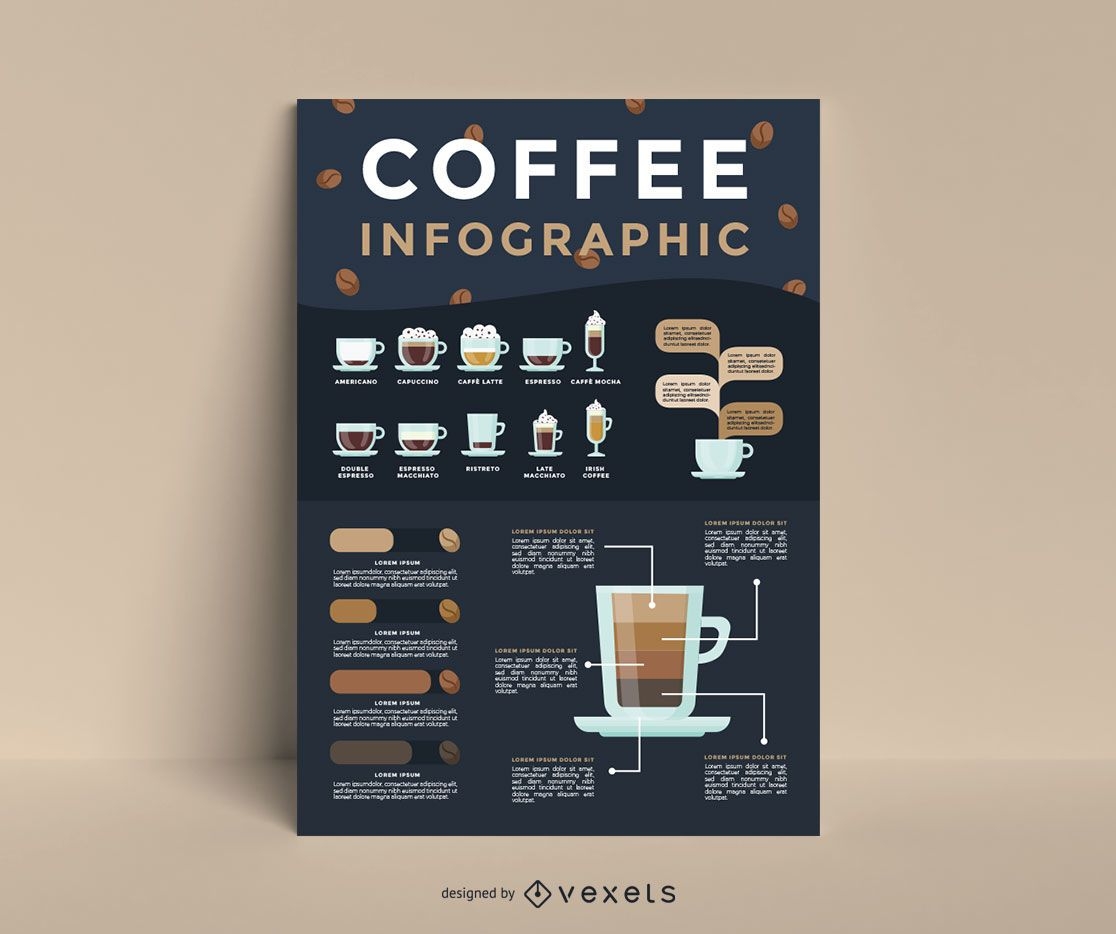
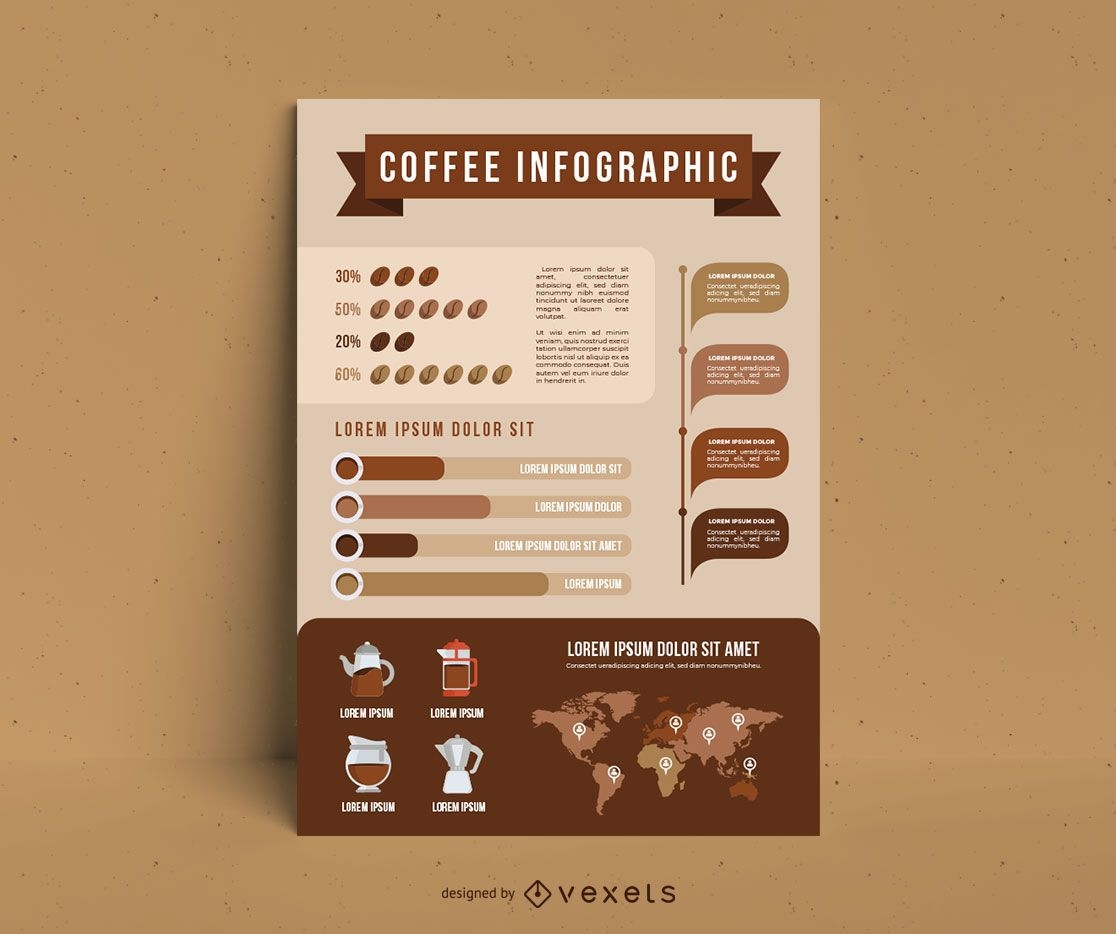
Coffee infographic template
Choose a folder
All favorites
Create new
Save
Coffee infographic template
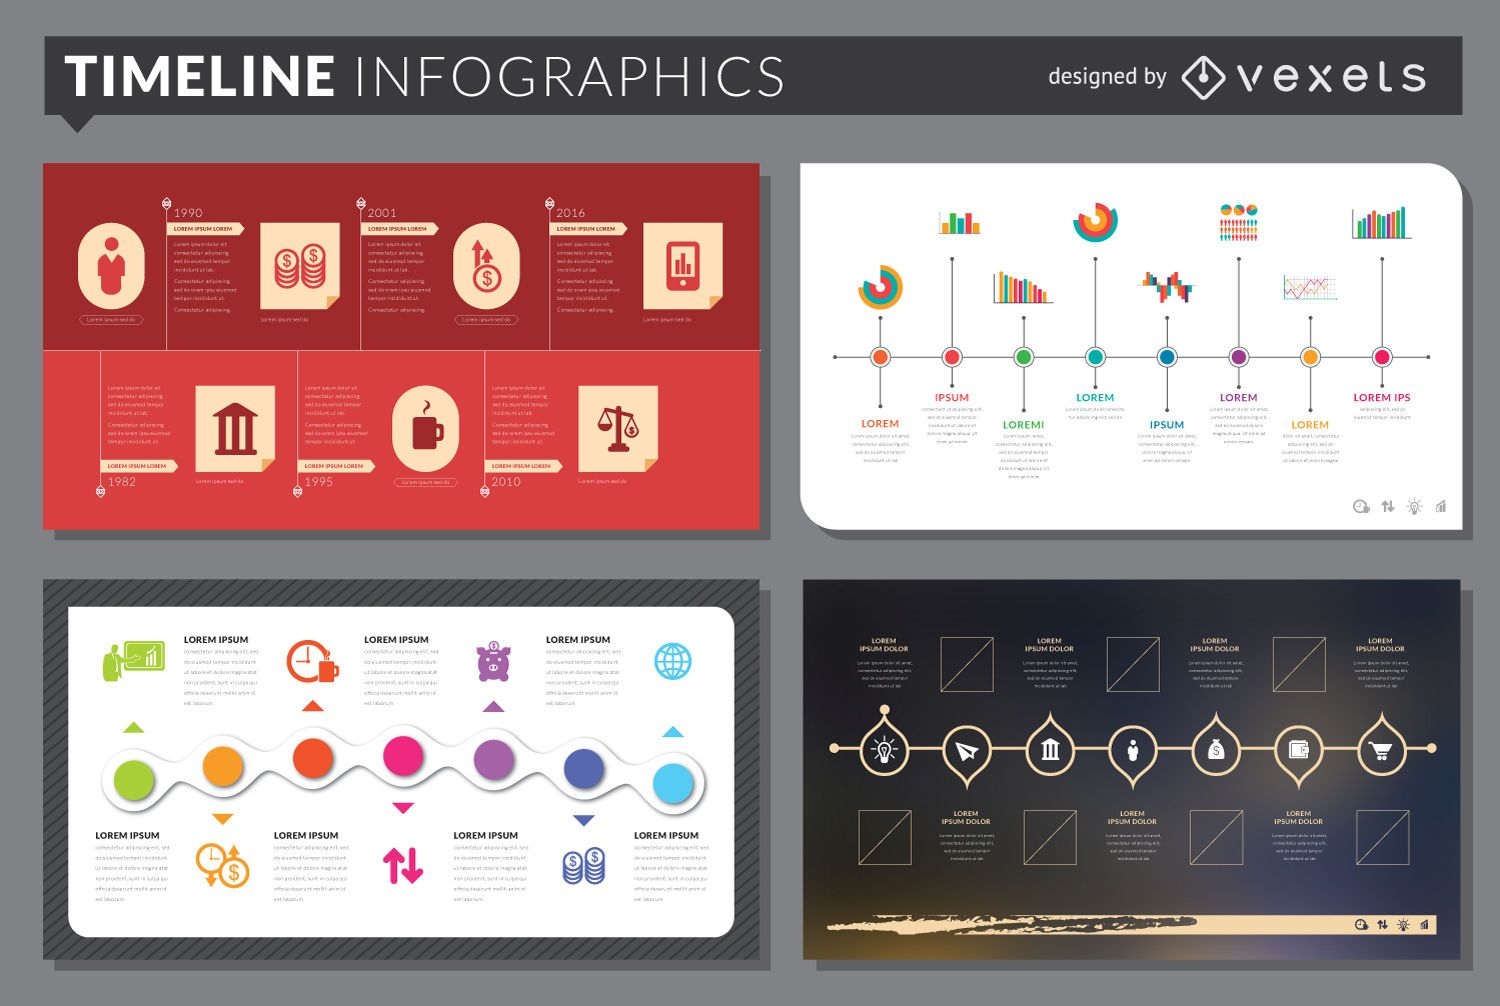
Timeline infographic template set
Choose a folder
All favorites
Create new
Save
Timeline infographic template set
Vector Icon Collection
Choose a folder
All favorites
Create new
Save
Vector Icon Collection
Premium
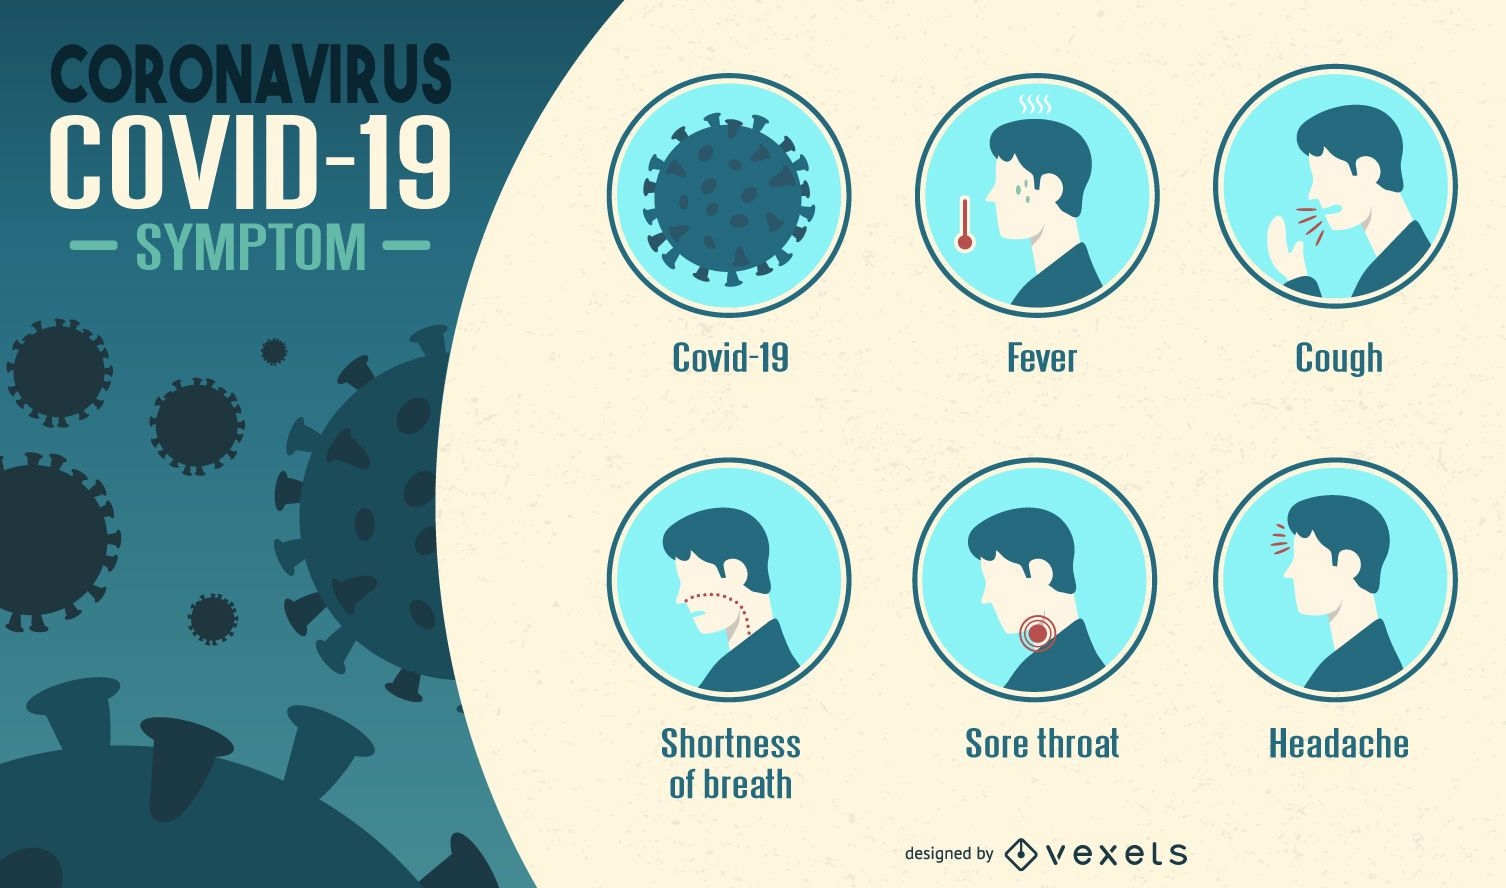
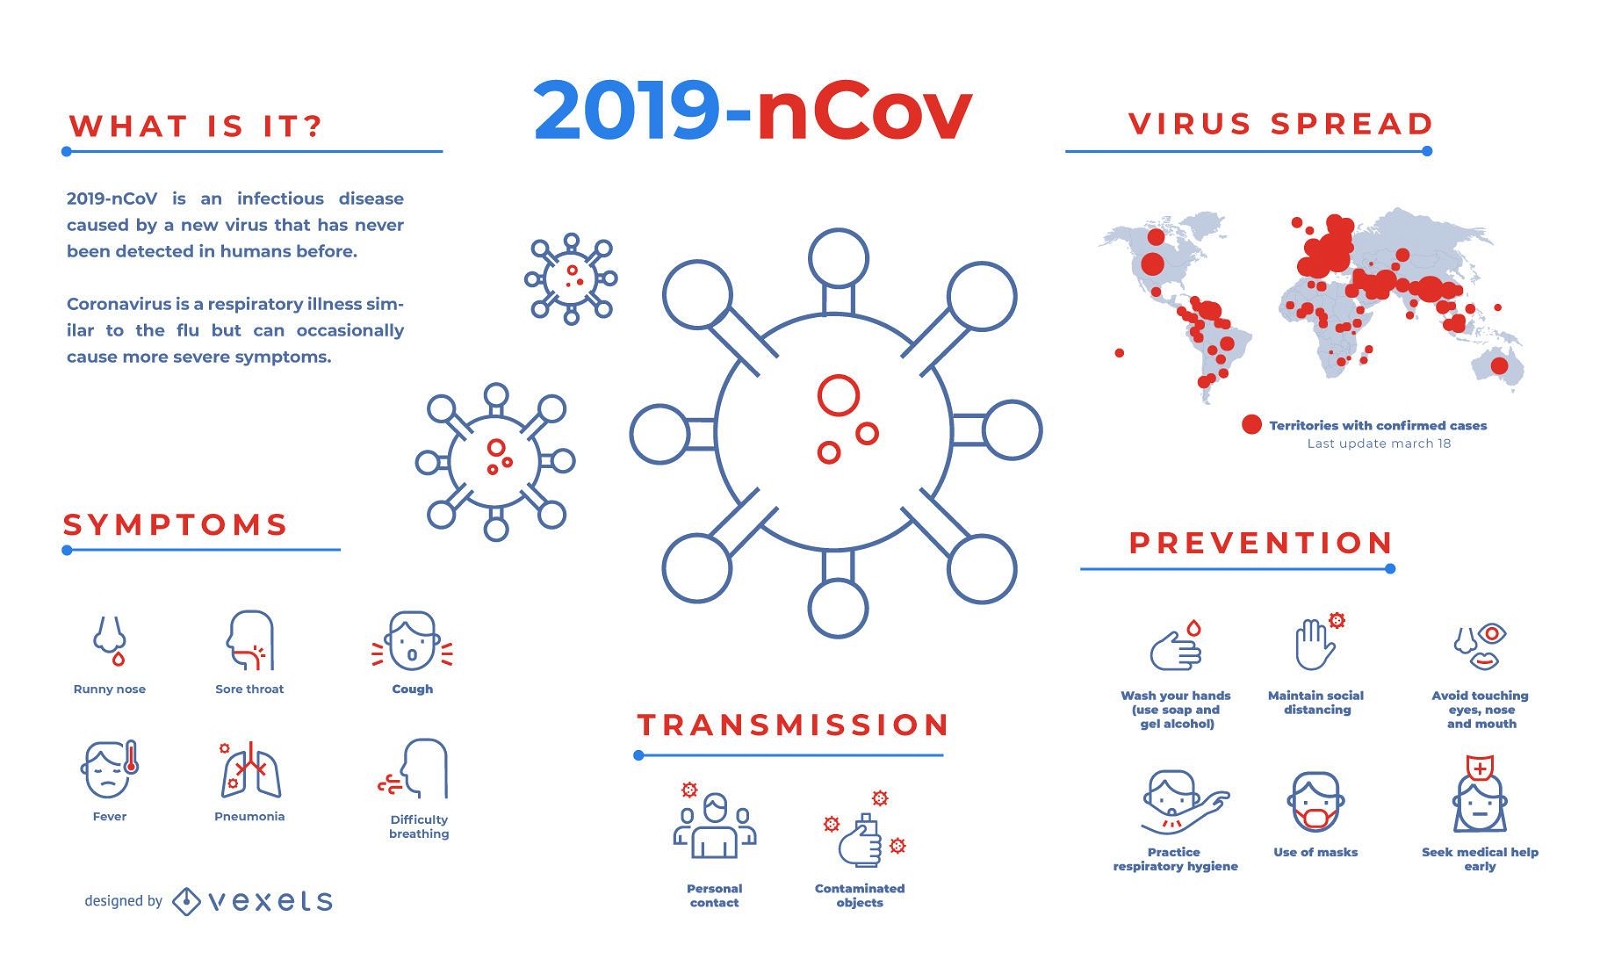
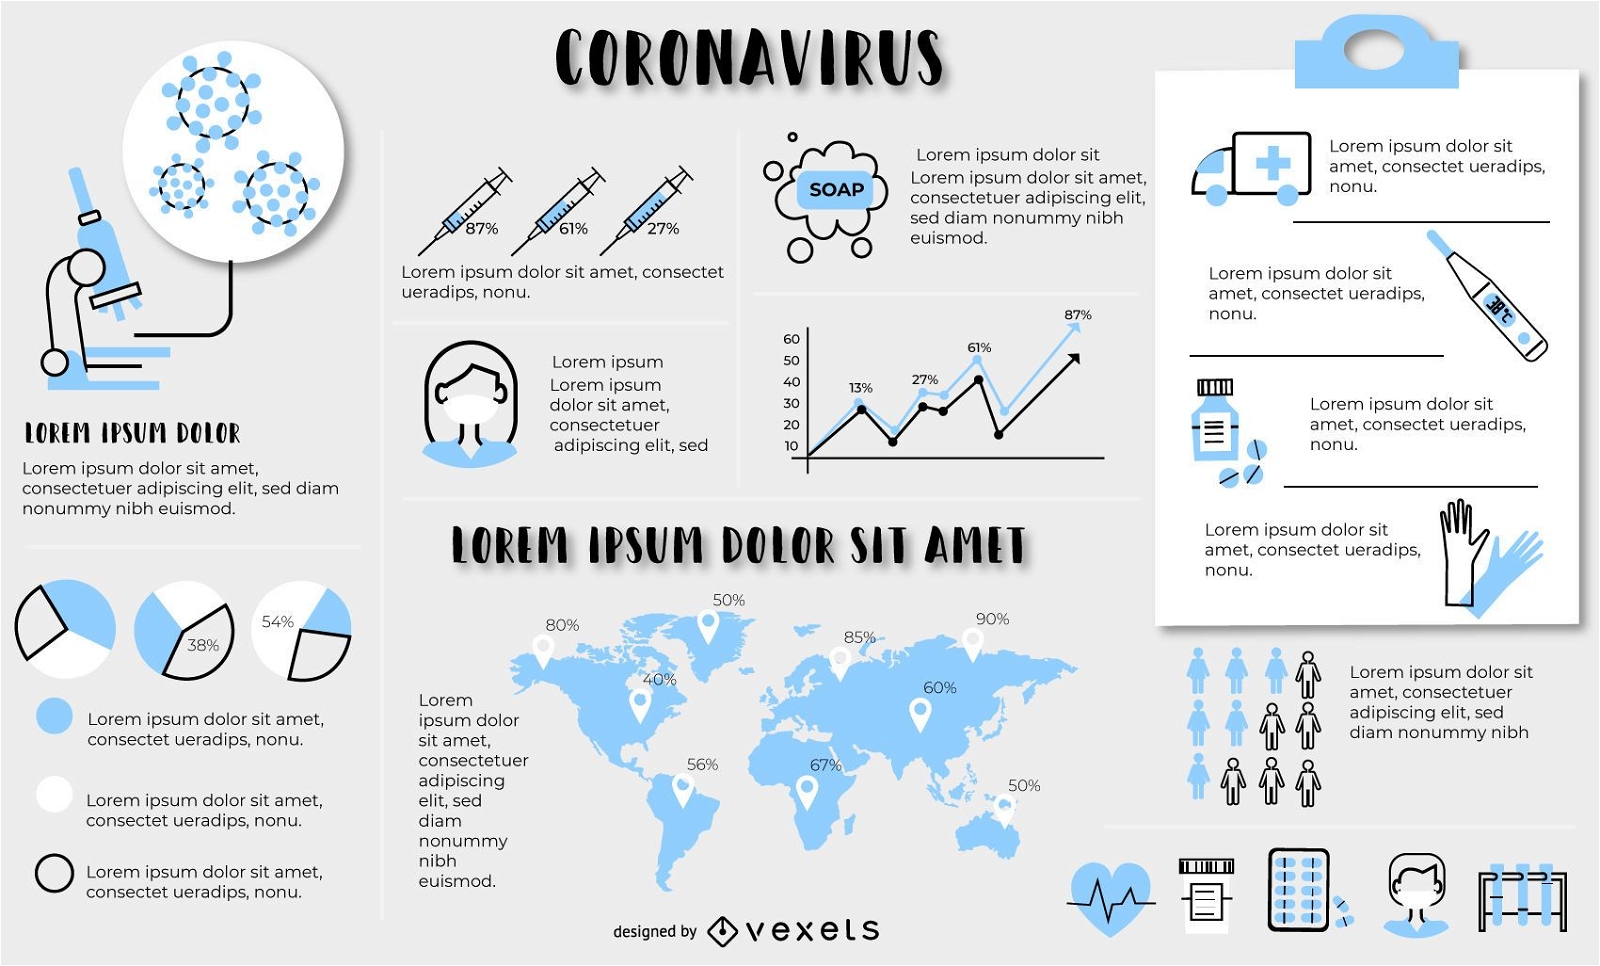
Coronavirus symptoms infographic
Choose a folder
All favorites
Create new
Save
Coronavirus symptoms infographic
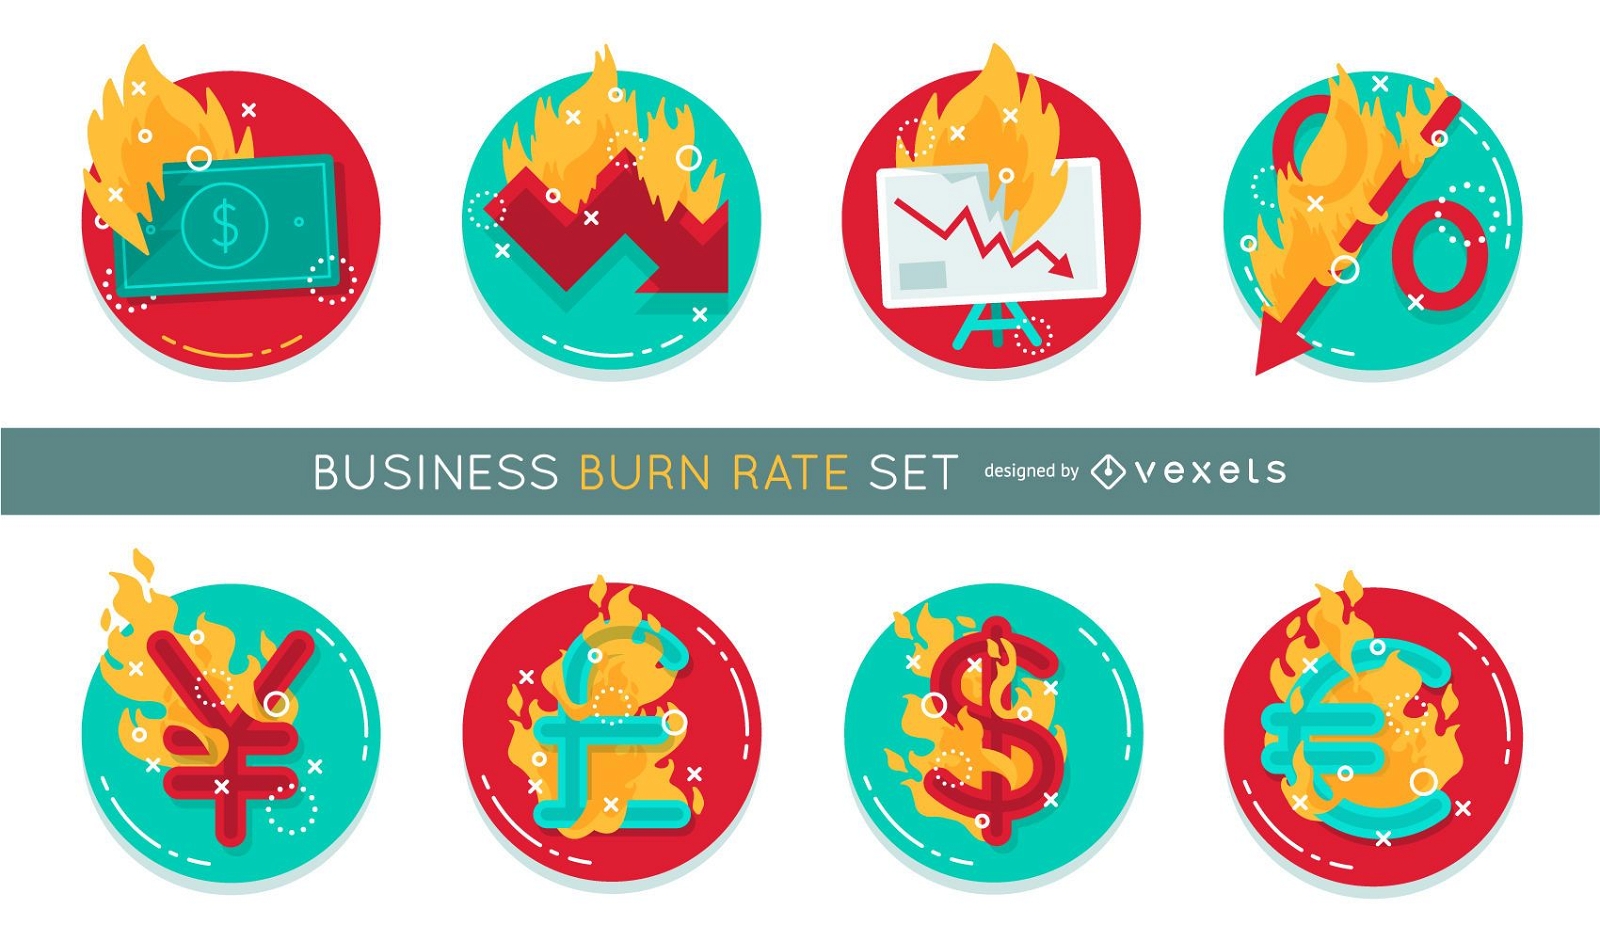
Business burn rate set
Choose a folder
All favorites
Create new
Save
Business burn rate set
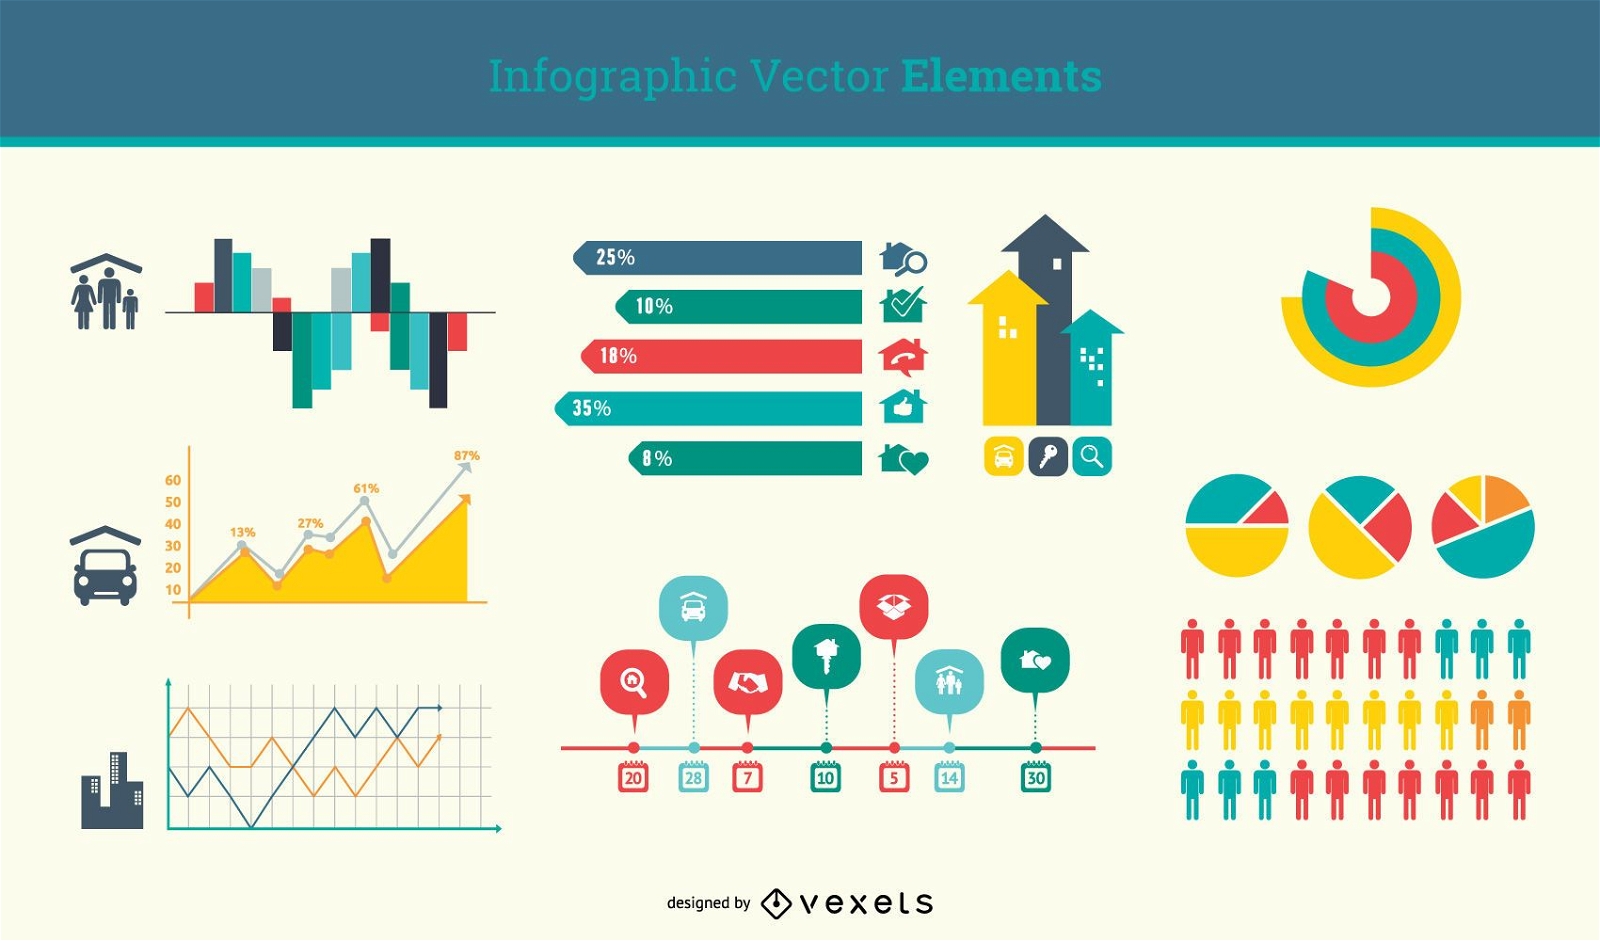
Flat Minimal Infographic Element Set
Choose a folder
All favorites
Create new
Save
Flat Minimal Infographic Element Set
Premium
Business and Commerce Stroke Icon Set
Choose a folder
All favorites
Create new
Save
Business and Commerce Stroke Icon Set
Colorful Infographic Element Pack in Flat Style
Choose a folder
All favorites
Create new
Save
Colorful Infographic Element Pack in Flat Style
Simple Black & White Web Icon Pack
Choose a folder
All favorites
Create new
Save
Simple Black & White Web Icon Pack
Premium
Covid-19 infographic template
Choose a folder
All favorites
Create new
Save
Covid-19 infographic template
Editable text
Premium
Types of coffee infographic template
Choose a folder
All favorites
Create new
Save
Types of coffee infographic template
Editable text
Premium
Coronavirus infographic elements template
Choose a folder
All favorites
Create new
Save
Coronavirus infographic elements template
Vintage Info-Graphic Chart
Choose a folder
All favorites
Create new
Save
Vintage Info-Graphic Chart
Premium
Ecommerce Stroke Icons Collection
Choose a folder
All favorites
Create new
Save
Ecommerce Stroke Icons Collection
Flat Style Template Infographic Set
Choose a folder
All favorites
Create new
Save
Flat Style Template Infographic Set
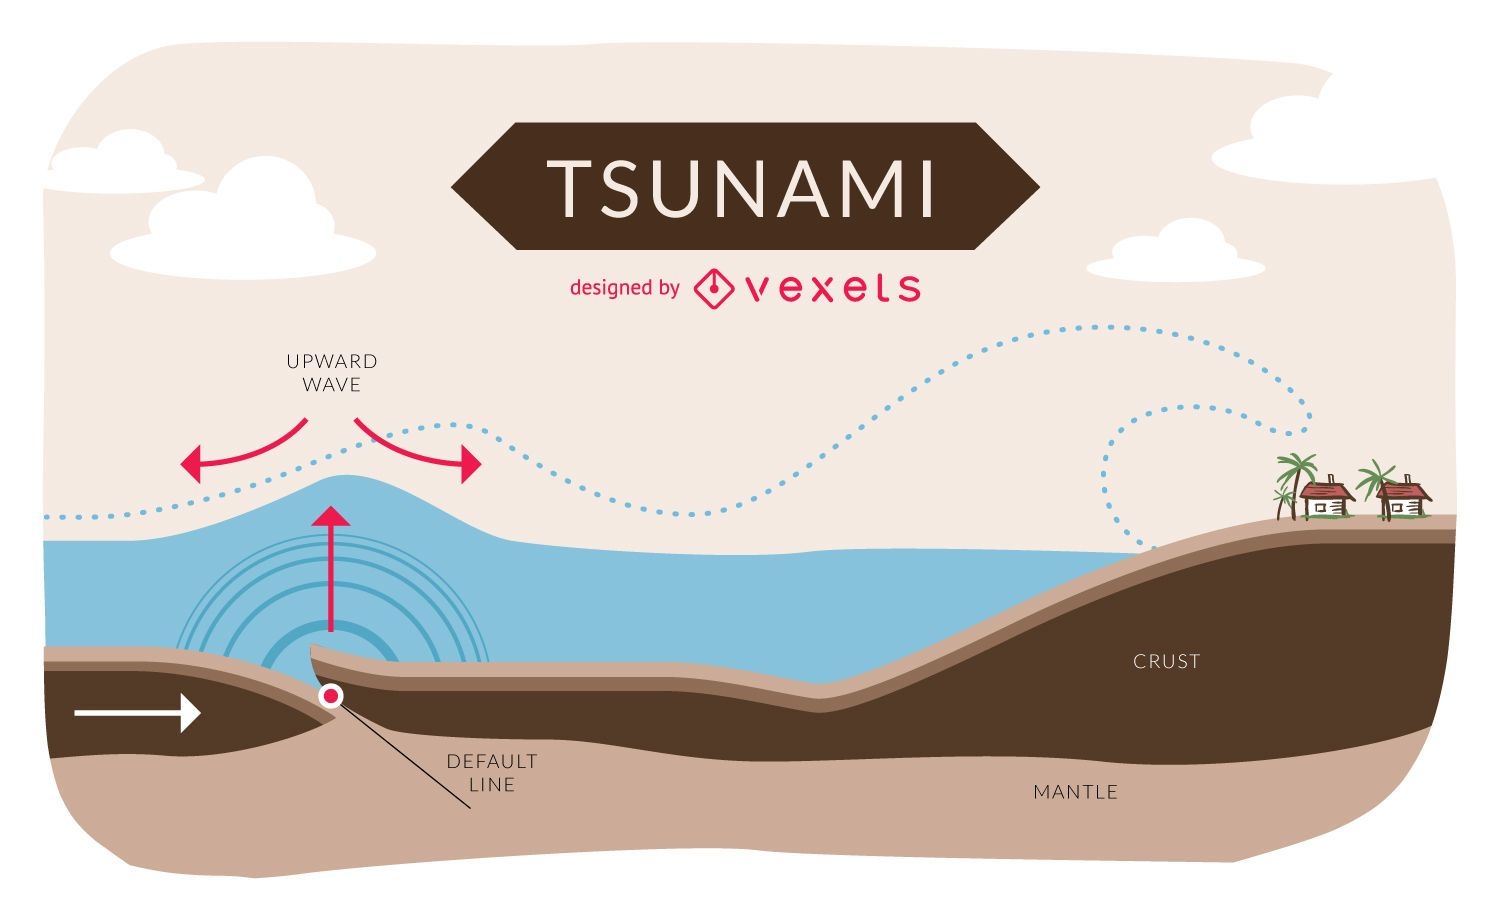
Tsunami infographic
Choose a folder
All favorites
Create new
Save
Tsunami infographic
Editable Template
Premium
Infographic abstract template
Choose a folder
All favorites
Create new
Save
Infographic abstract template
Editable text
Premium
Coffee infographic
Choose a folder
All favorites
Create new
Save
Coffee infographic
Full Branding Kit
Premium
Accounting geometric elements gradient logo
Choose a folder
All favorites
Create new
Save
Accounting geometric elements gradient logo
Premium
Business set of 24 icons
Choose a folder
All favorites
Create new
Save
Business set of 24 icons
Vector Icons
Choose a folder
All favorites
Create new
Save
Vector Icons
Premium
Math Flat Design Icon Pack
Choose a folder
All favorites
Create new
Save
Math Flat Design Icon Pack
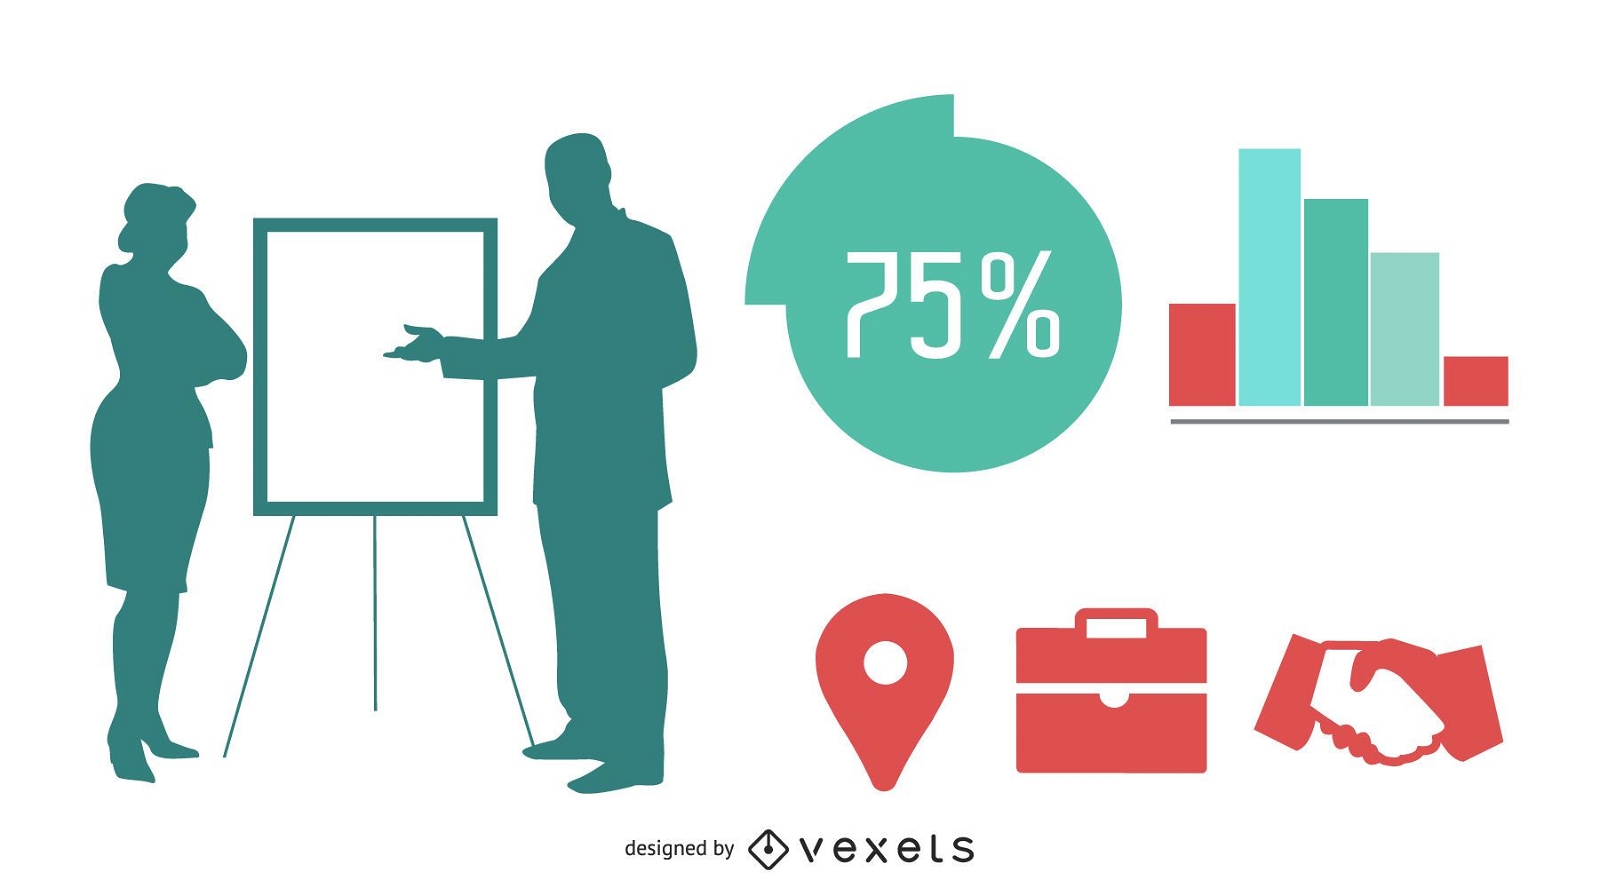
Silhouette Business People with Info-graphics
Choose a folder
All favorites
Create new
Save
Silhouette Business People with Info-graphics
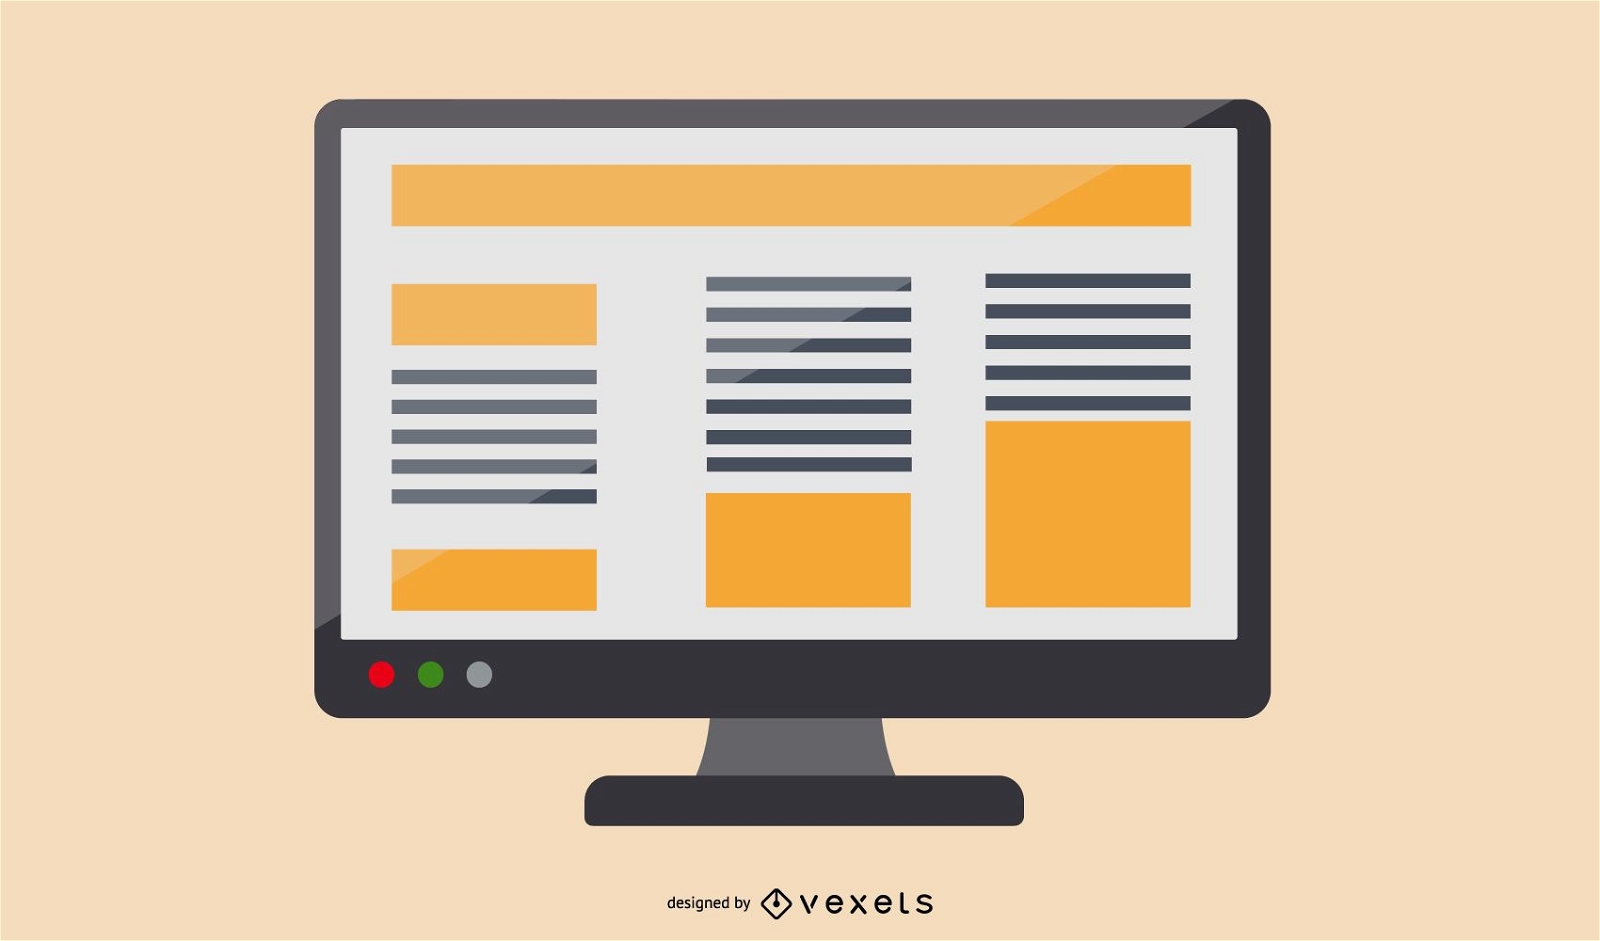
Business News Layout Monitor
Choose a folder
All favorites
Create new
Save
Business News Layout Monitor
Premium
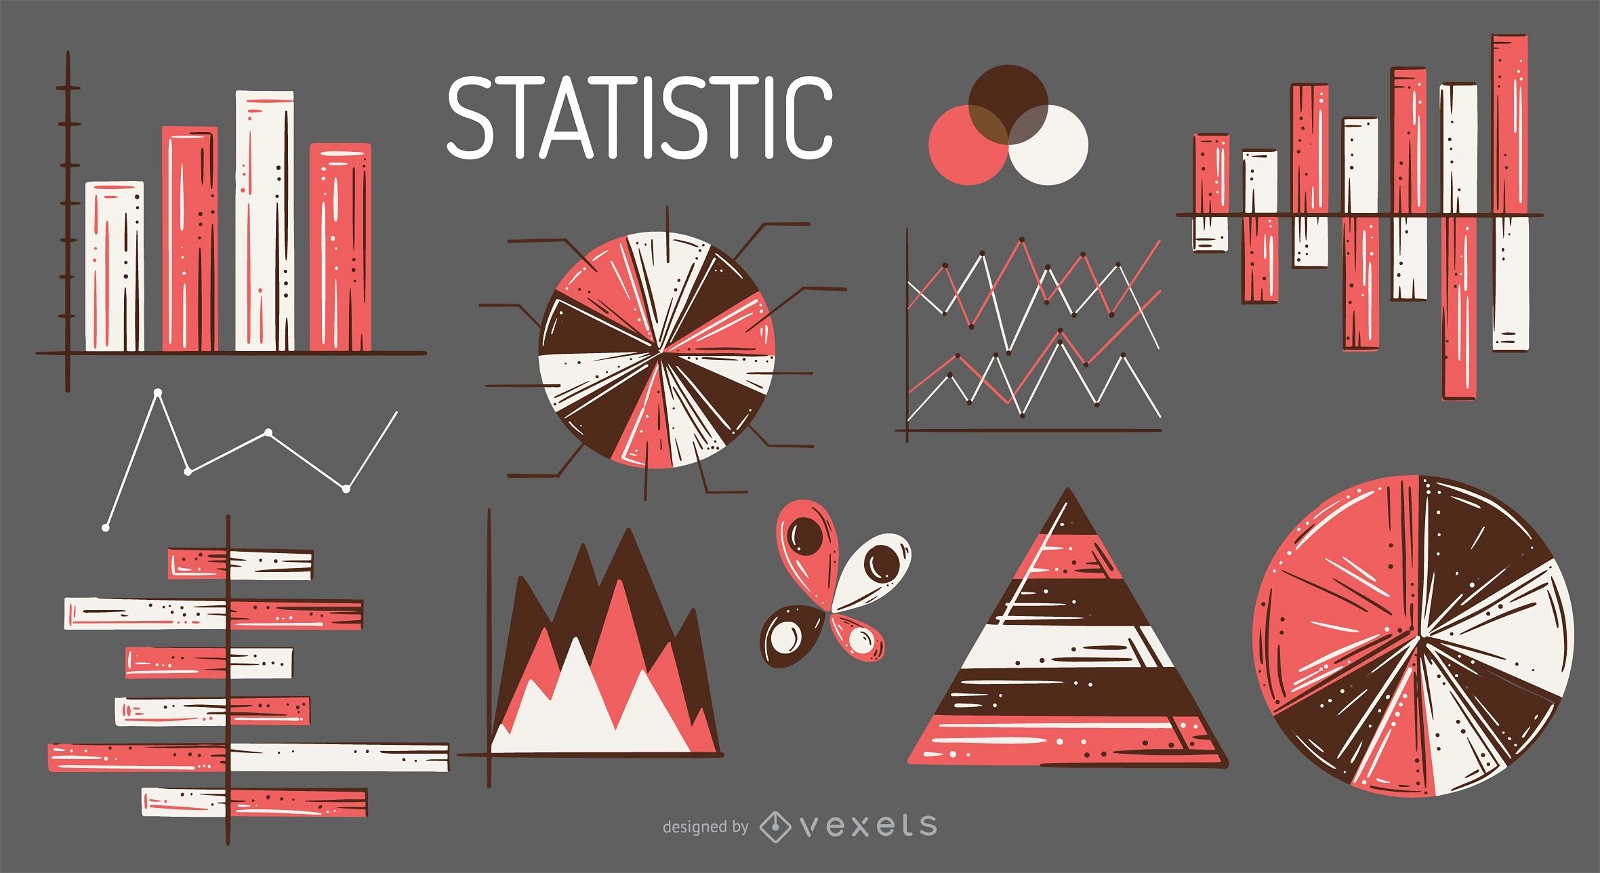
Statistic elements illustration set
Choose a folder
All favorites
Create new
Save
Statistic elements illustration set
Editable text
Premium
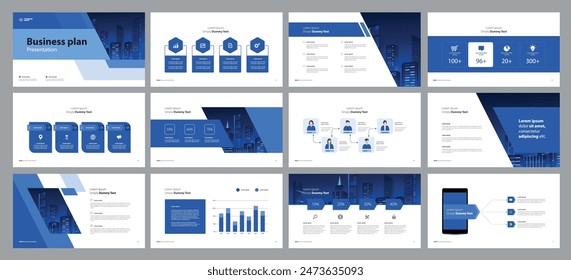
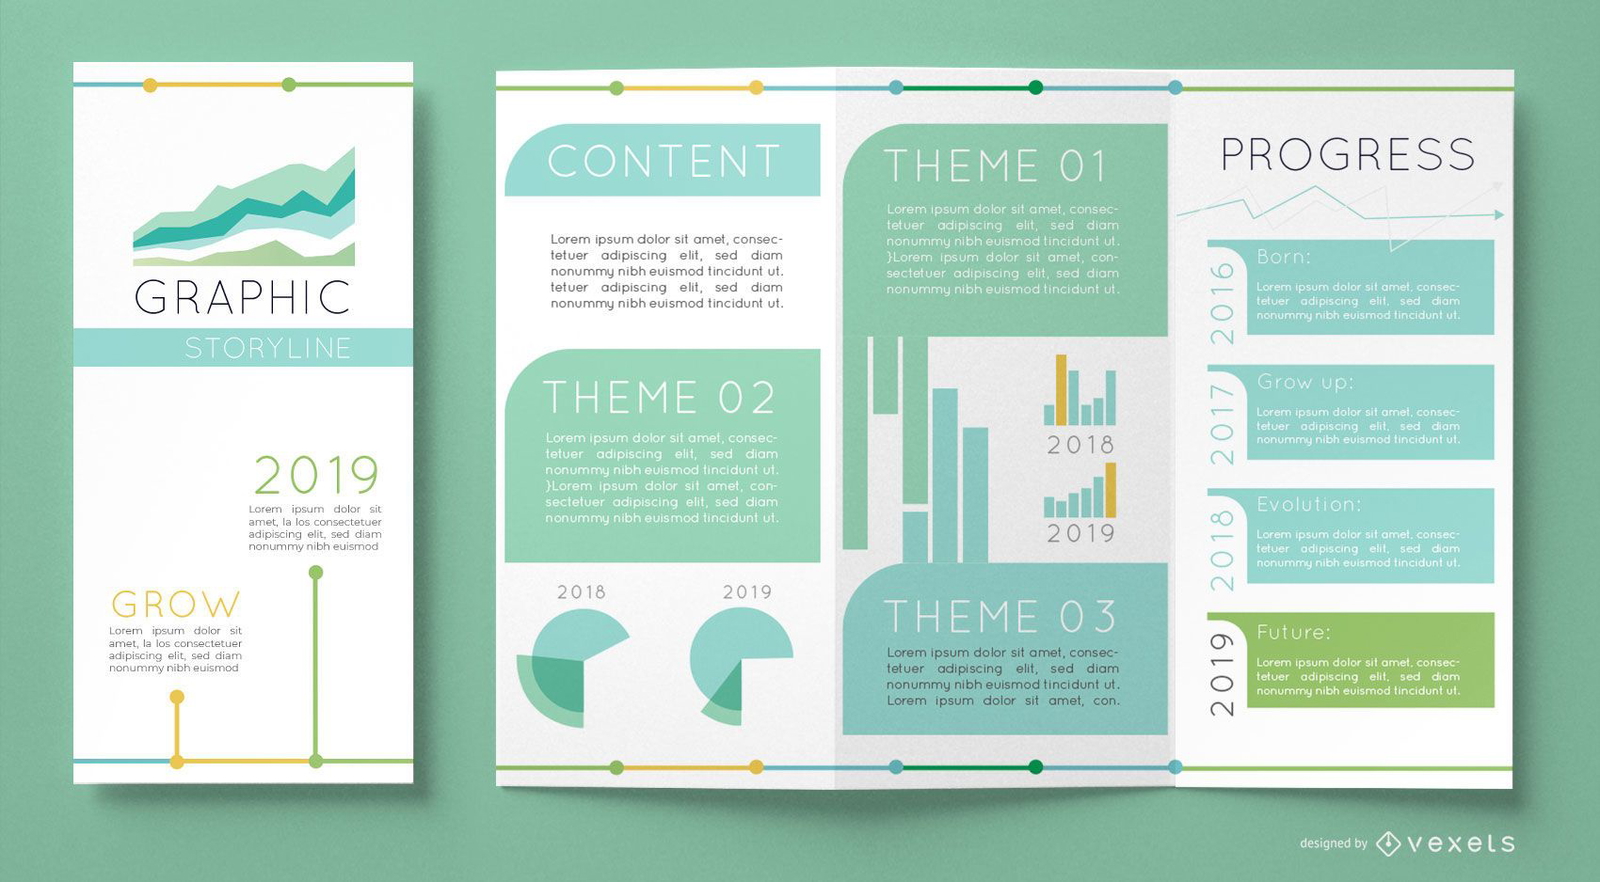
Business brochure graphs template
Choose a folder
All favorites
Create new
Save
Business brochure graphs template
Editable text
Premium
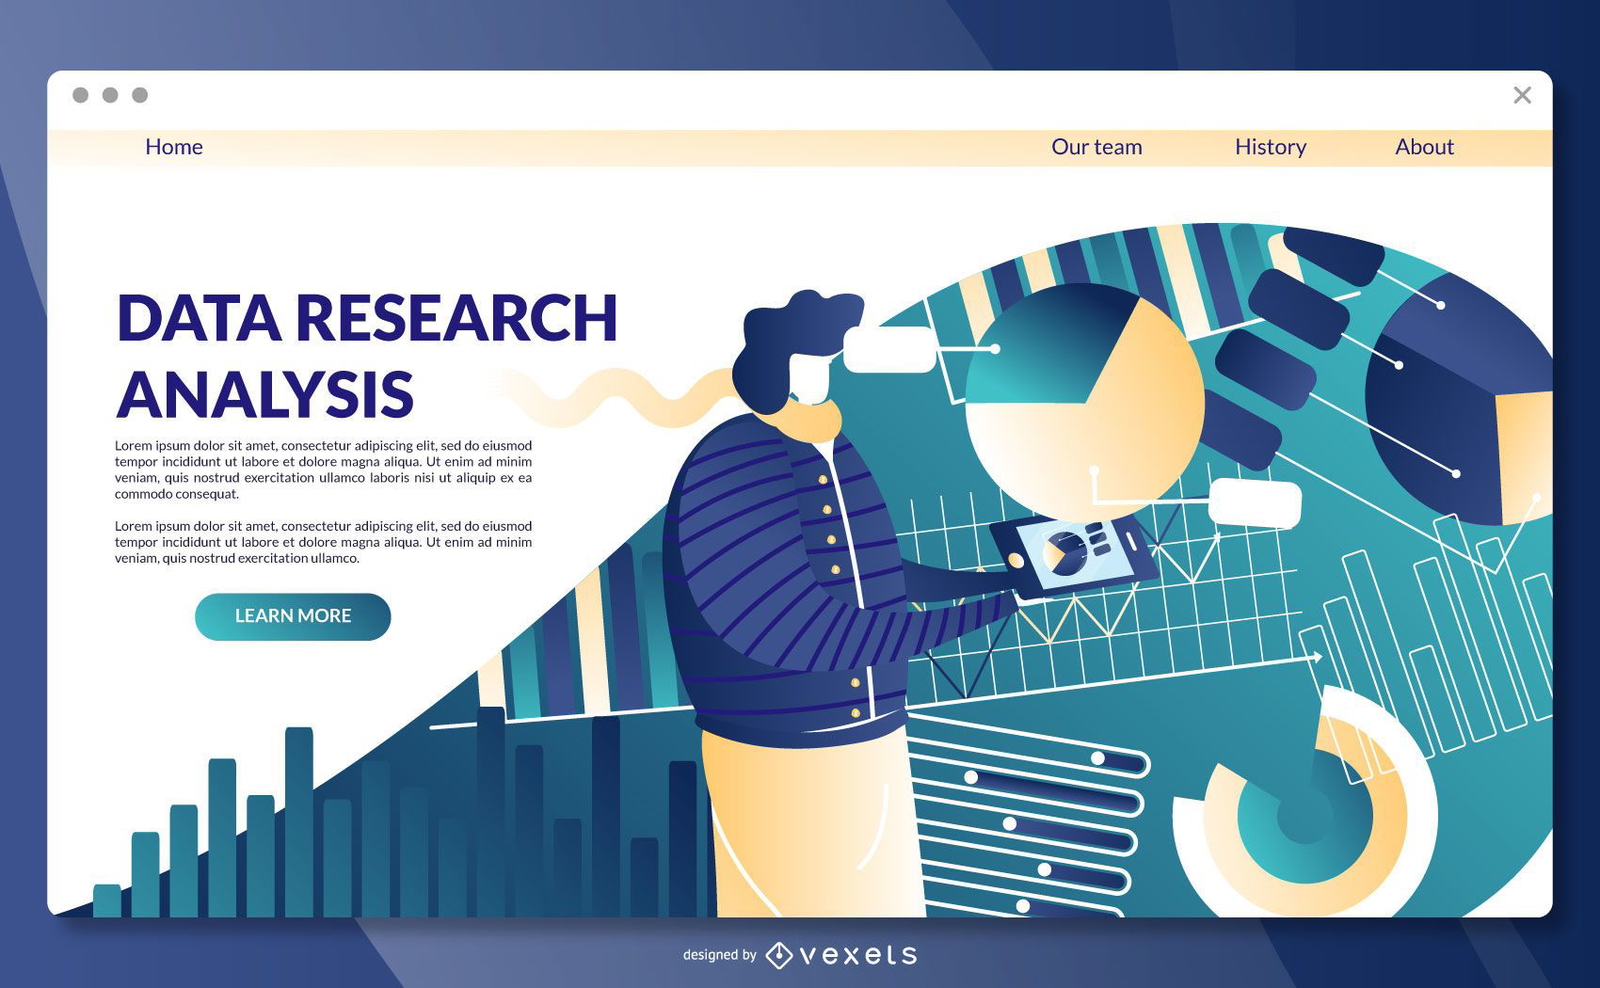
Data research landing page template
Choose a folder
All favorites
Create new
Save
Data research landing page template
Editable text
Premium
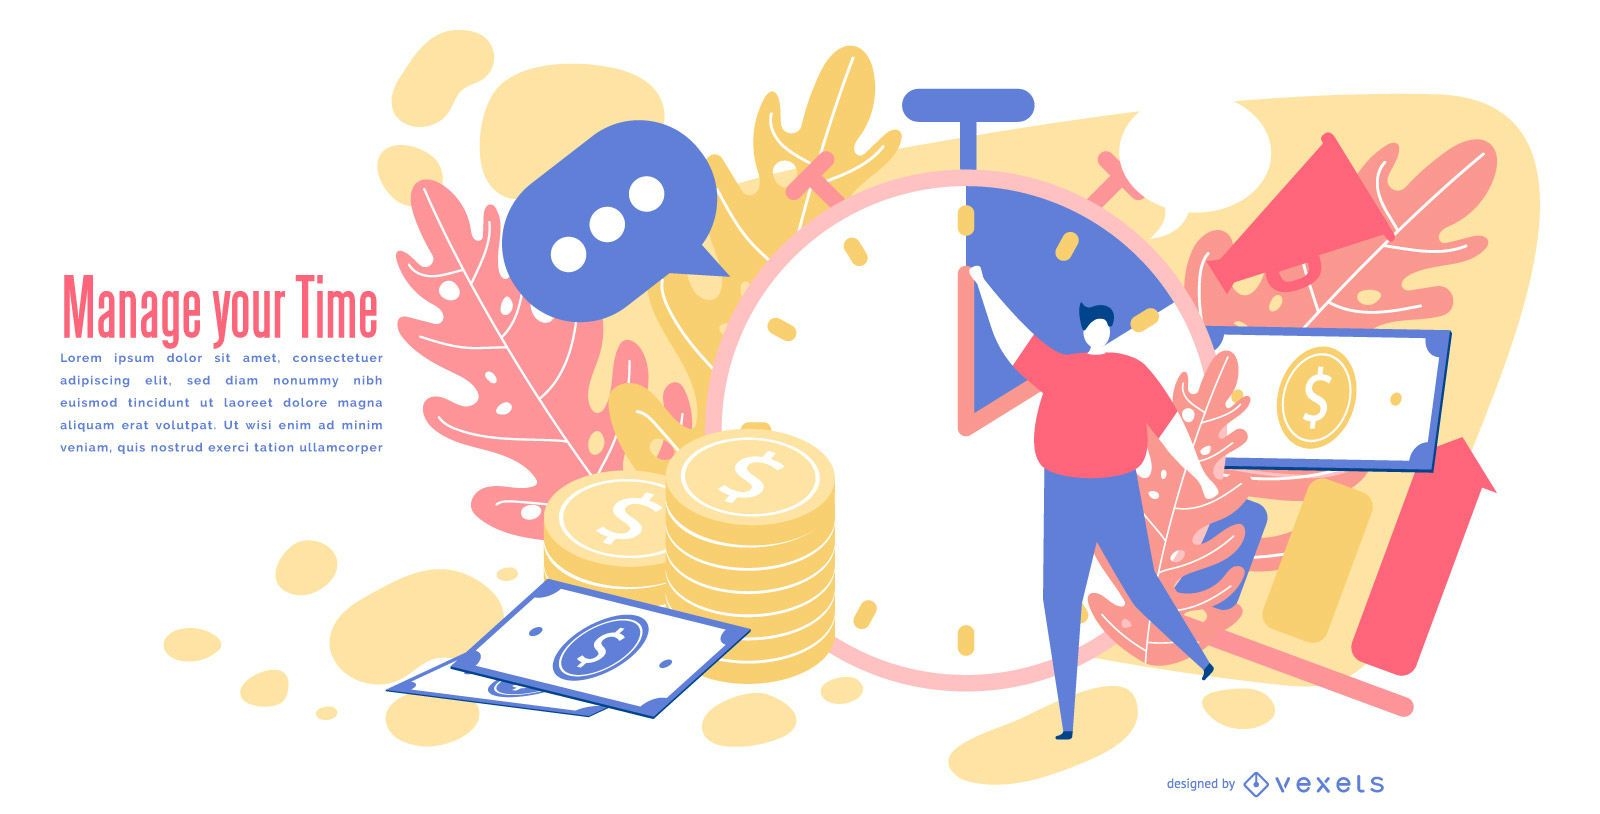
Time money abstract editable design
Choose a folder
All favorites
Create new
Save
Time money abstract editable design
Super Vector Samples
Choose a folder
All favorites
Create new
Save
Super Vector Samples
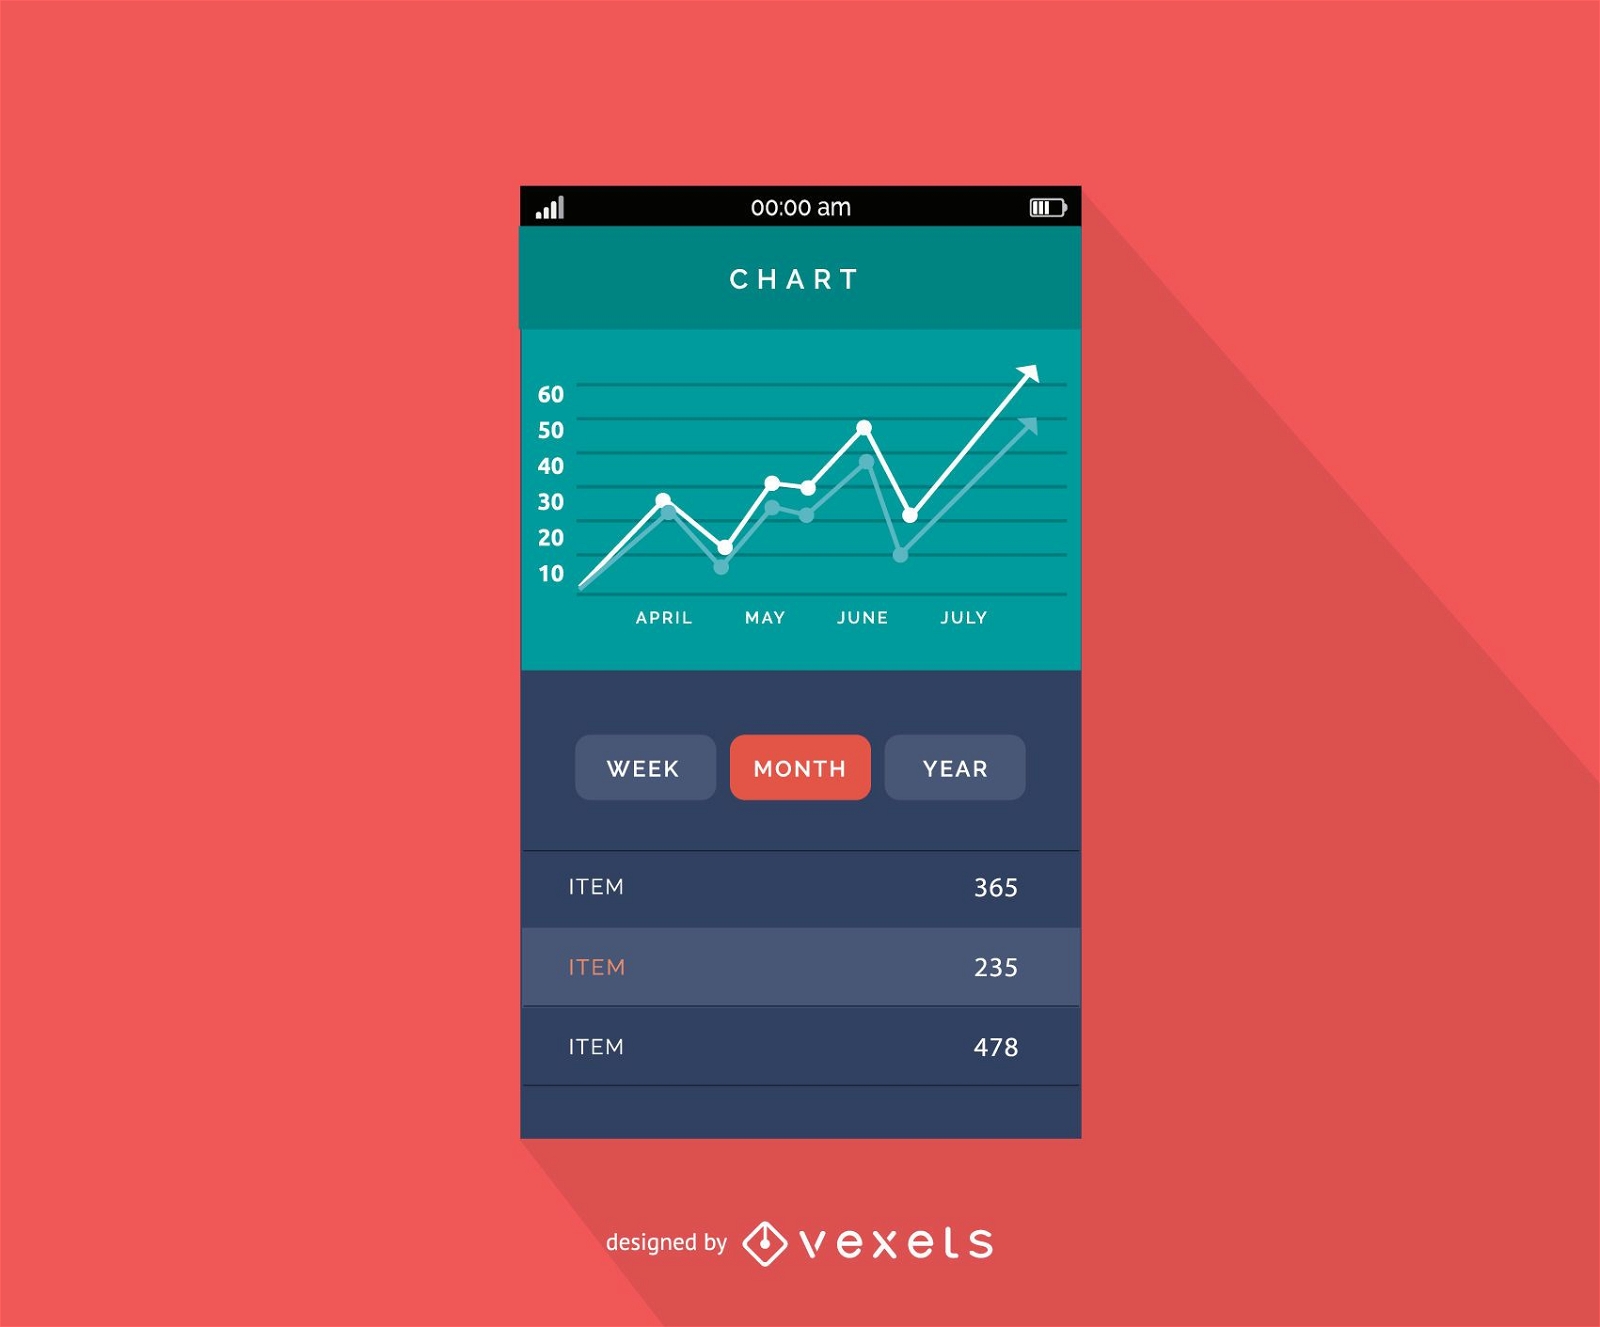
Mobile chart interface design
Choose a folder
All favorites
Create new
Save
Mobile chart interface design
Premium
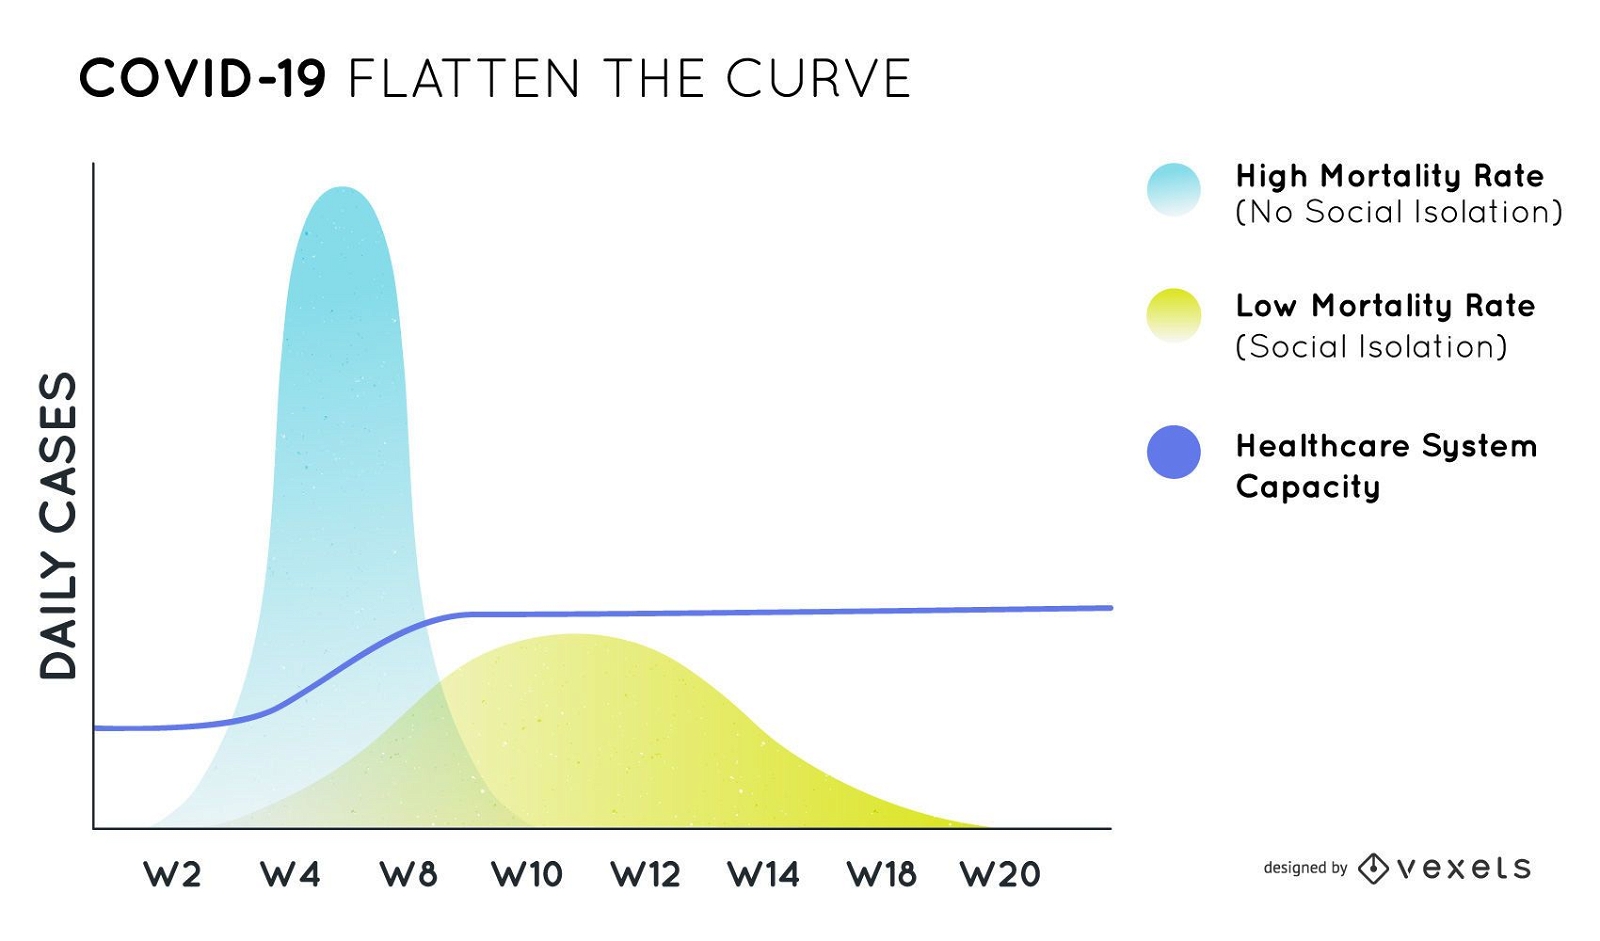
Covid-19 flatten the curve chart design
Choose a folder
All favorites
Create new
Save
Covid-19 flatten the curve chart design
4 Colors Abstract Waves Background Vector Set
Choose a folder
All favorites
Create new
Save
4 Colors Abstract Waves Background Vector Set
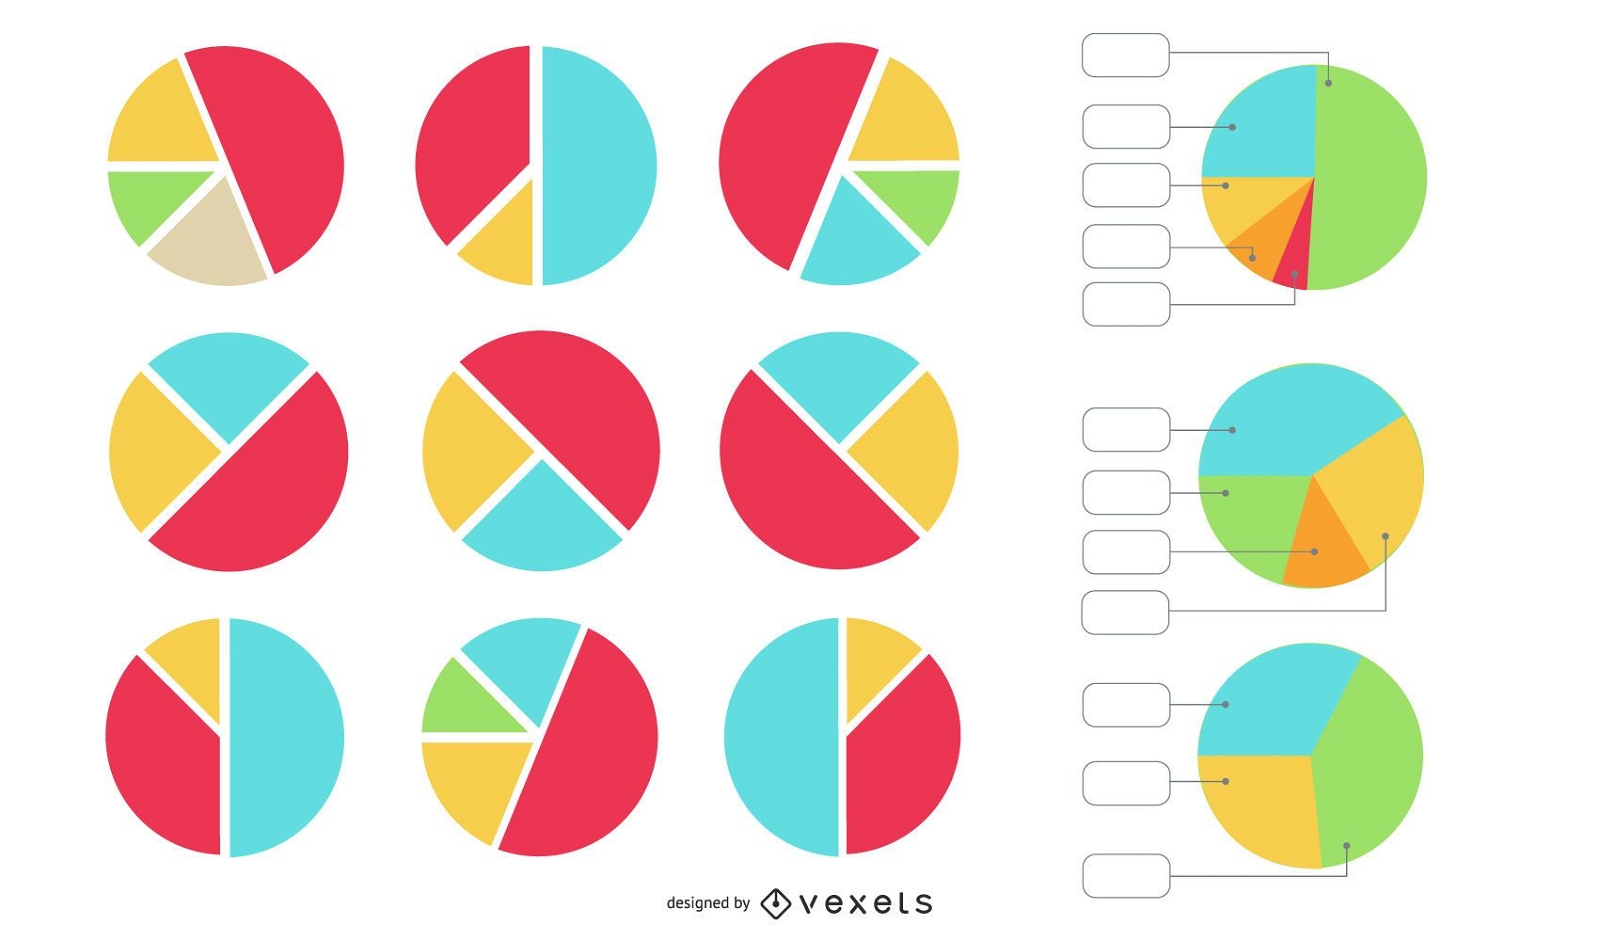
Pie Chart Vector Set
Choose a folder
All favorites
Create new
Save
Pie Chart Vector Set
Finance Investment Icons
Choose a folder
All favorites
Create new
Save
Finance Investment Icons
Business growth success illustration
Choose a folder
All favorites
Create new
Save
Business growth success illustration
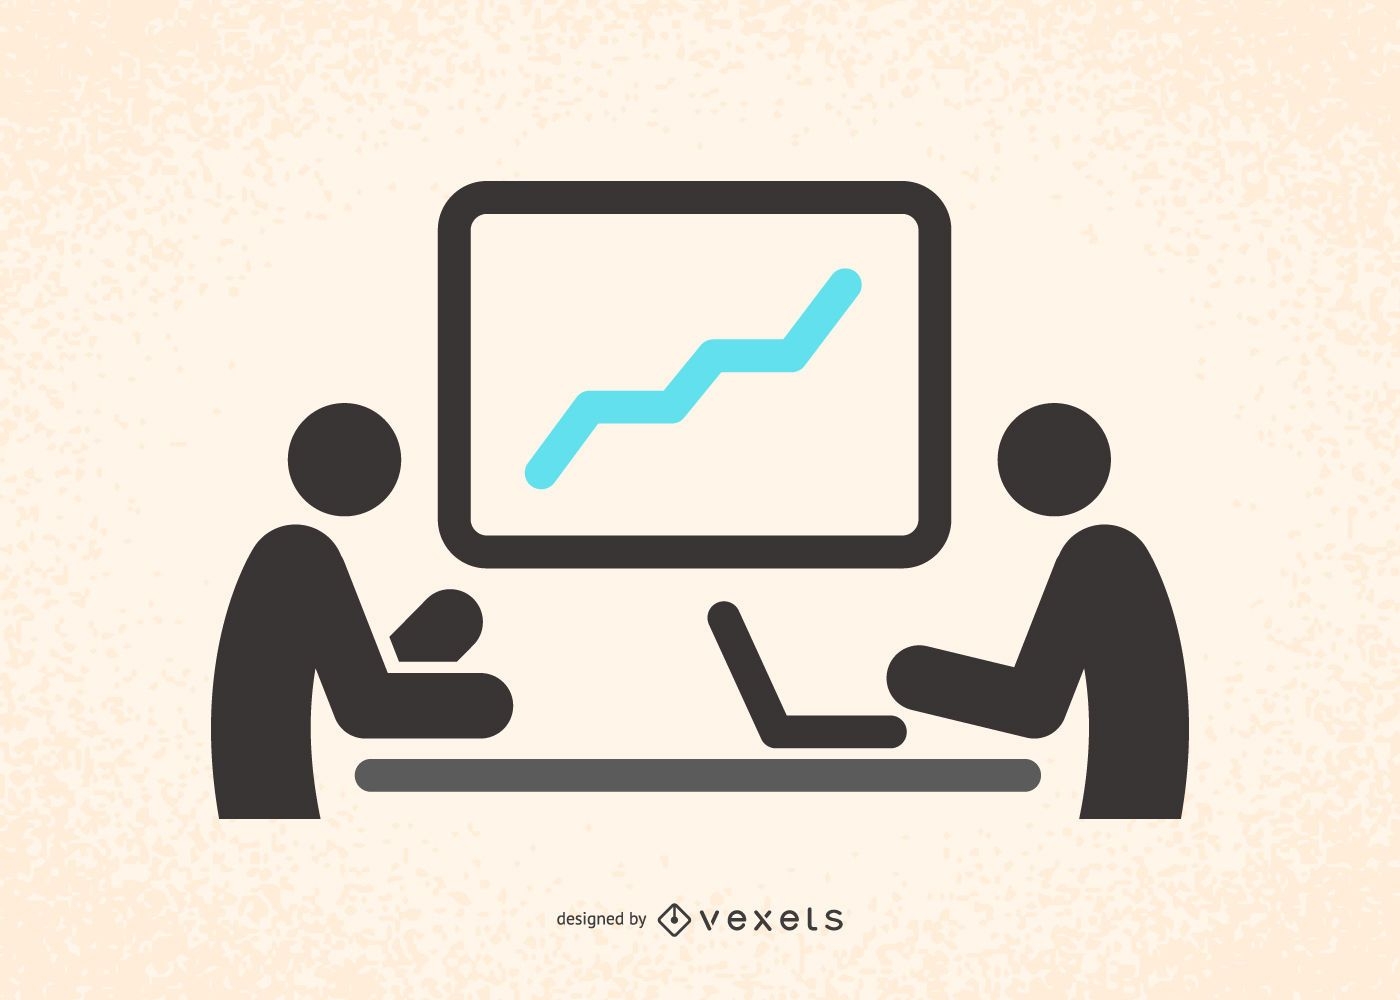
Meeting silhouette with businessmen
Choose a folder
All favorites
Create new
Save
Meeting silhouette with businessmen
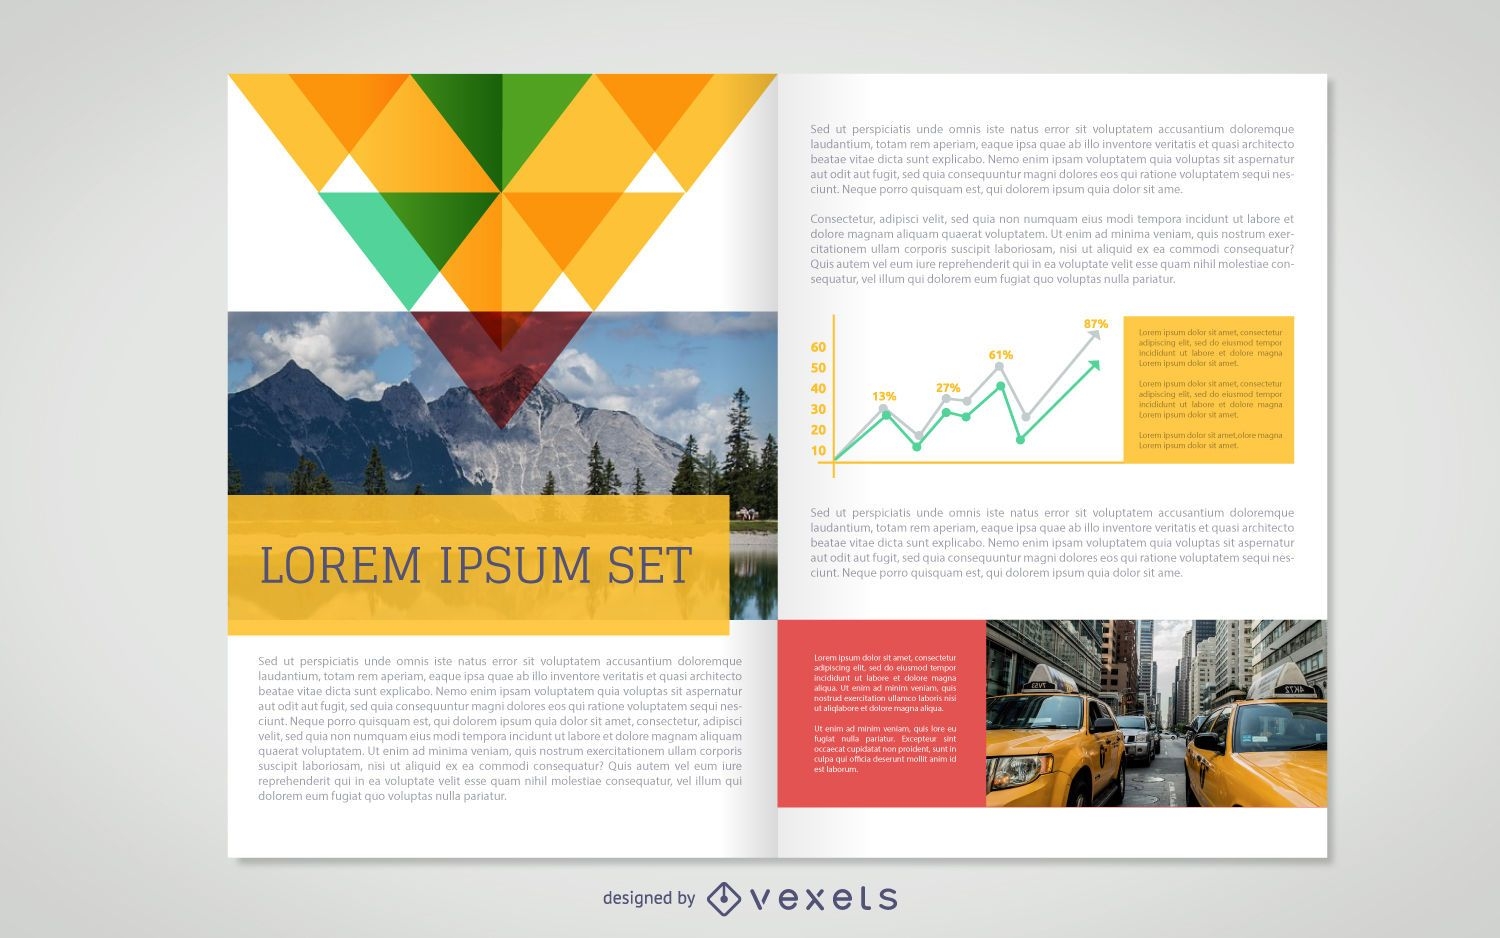
Flat brochure yellow template
Choose a folder
All favorites
Create new
Save
Flat brochure yellow template
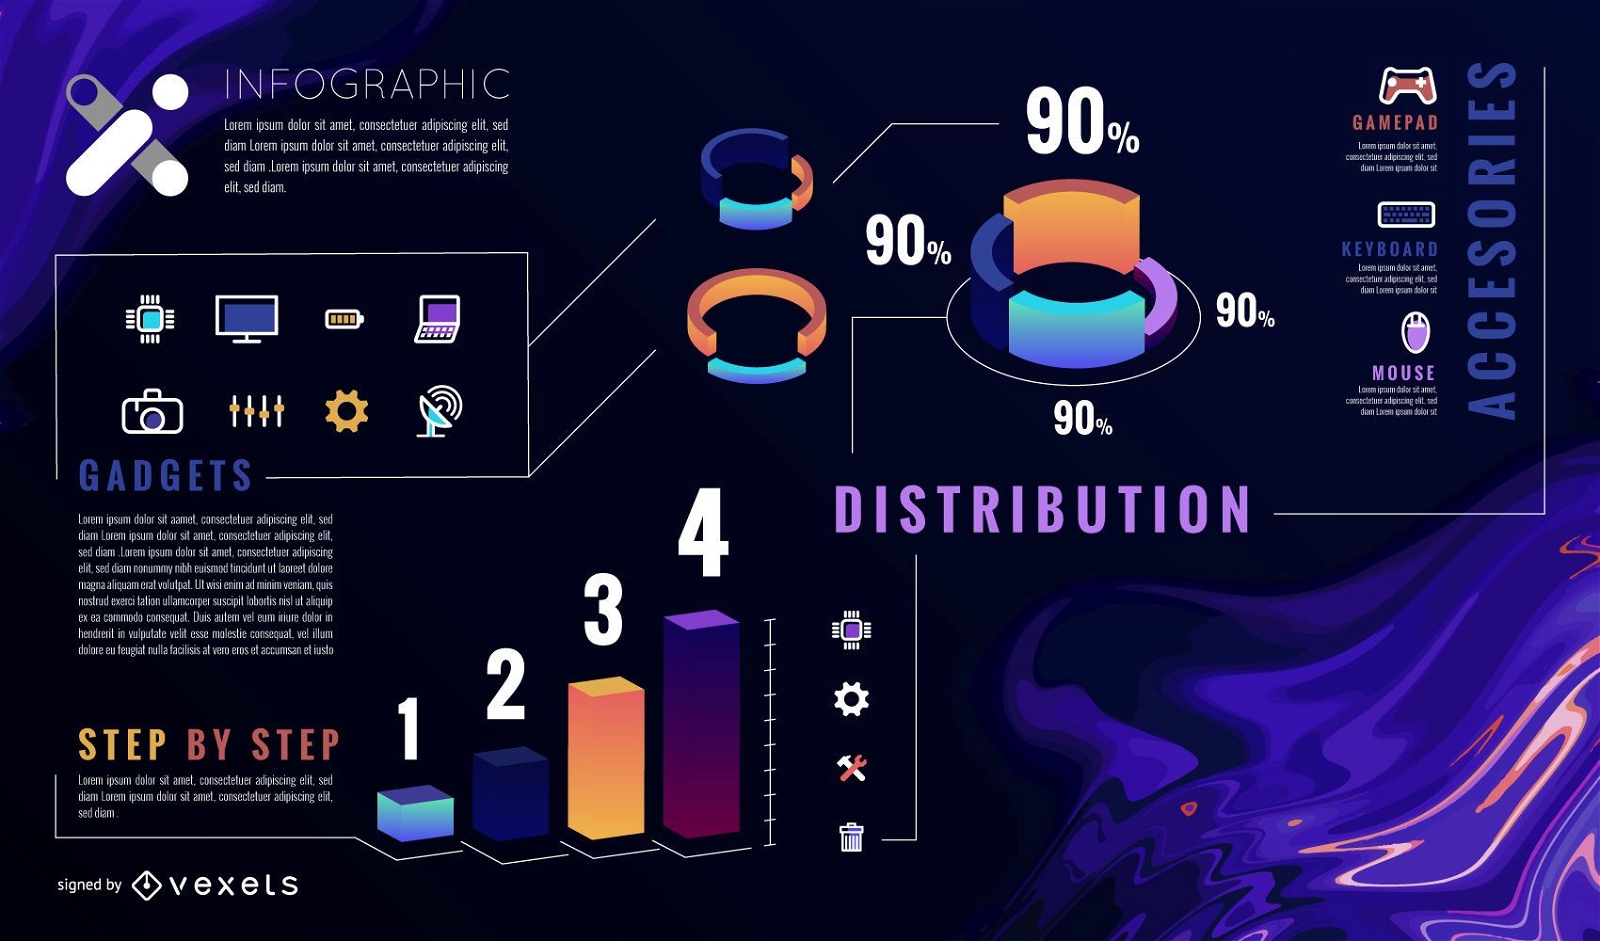
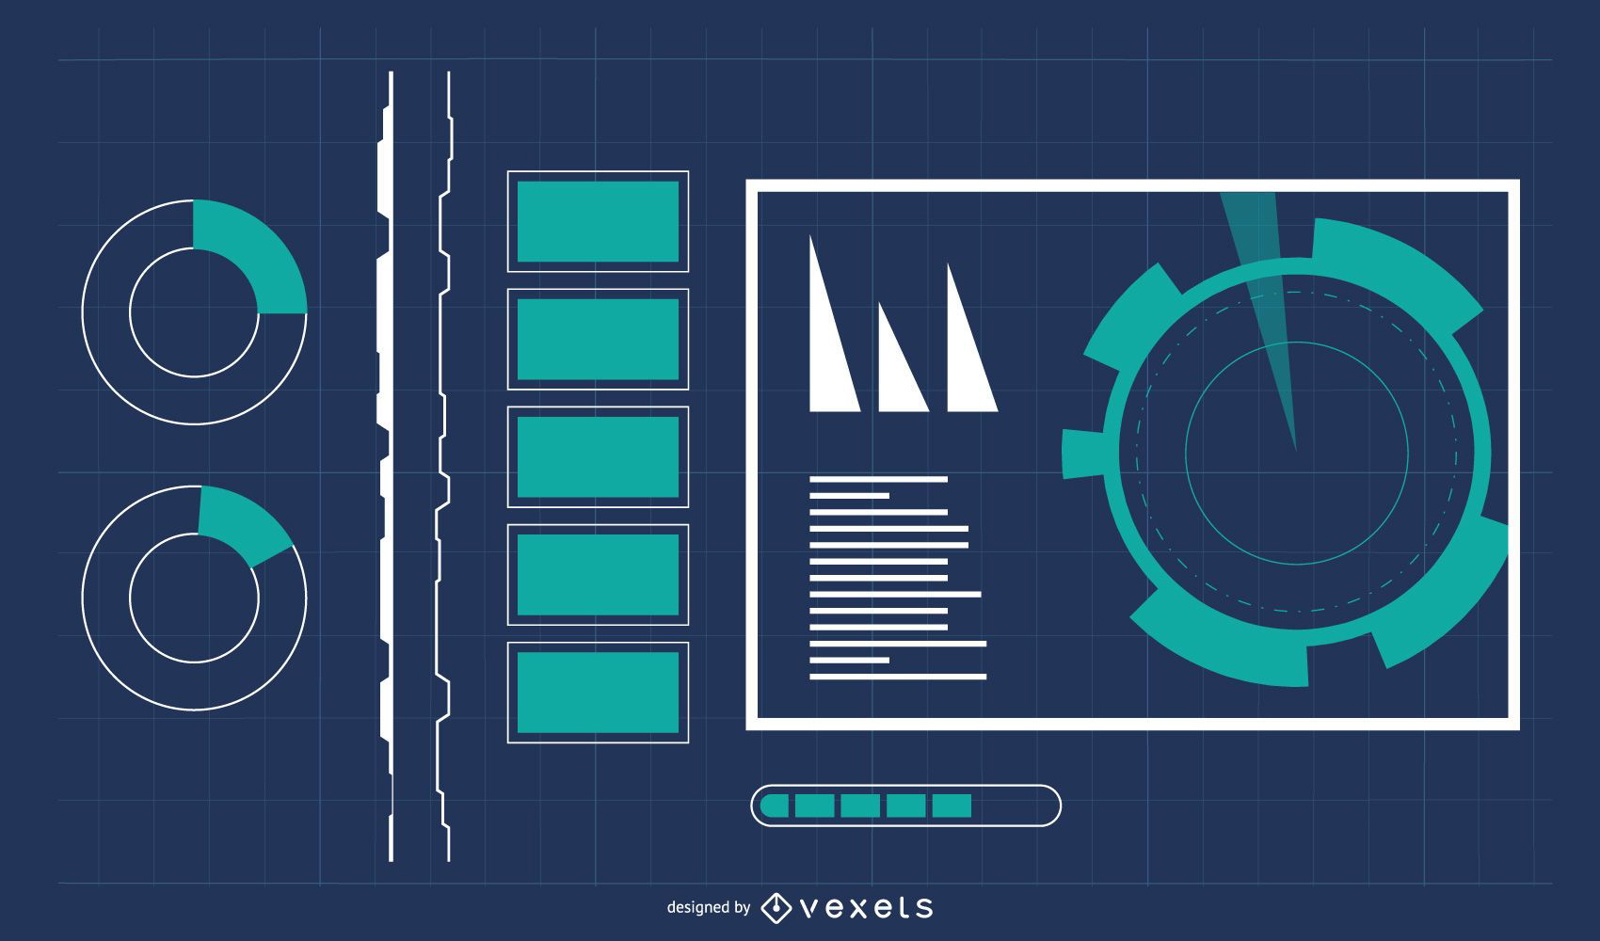
Digital Technology Background with Info-Graphic
Choose a folder
All favorites
Create new
Save
Digital Technology Background with Info-Graphic
Print ready
for Merch
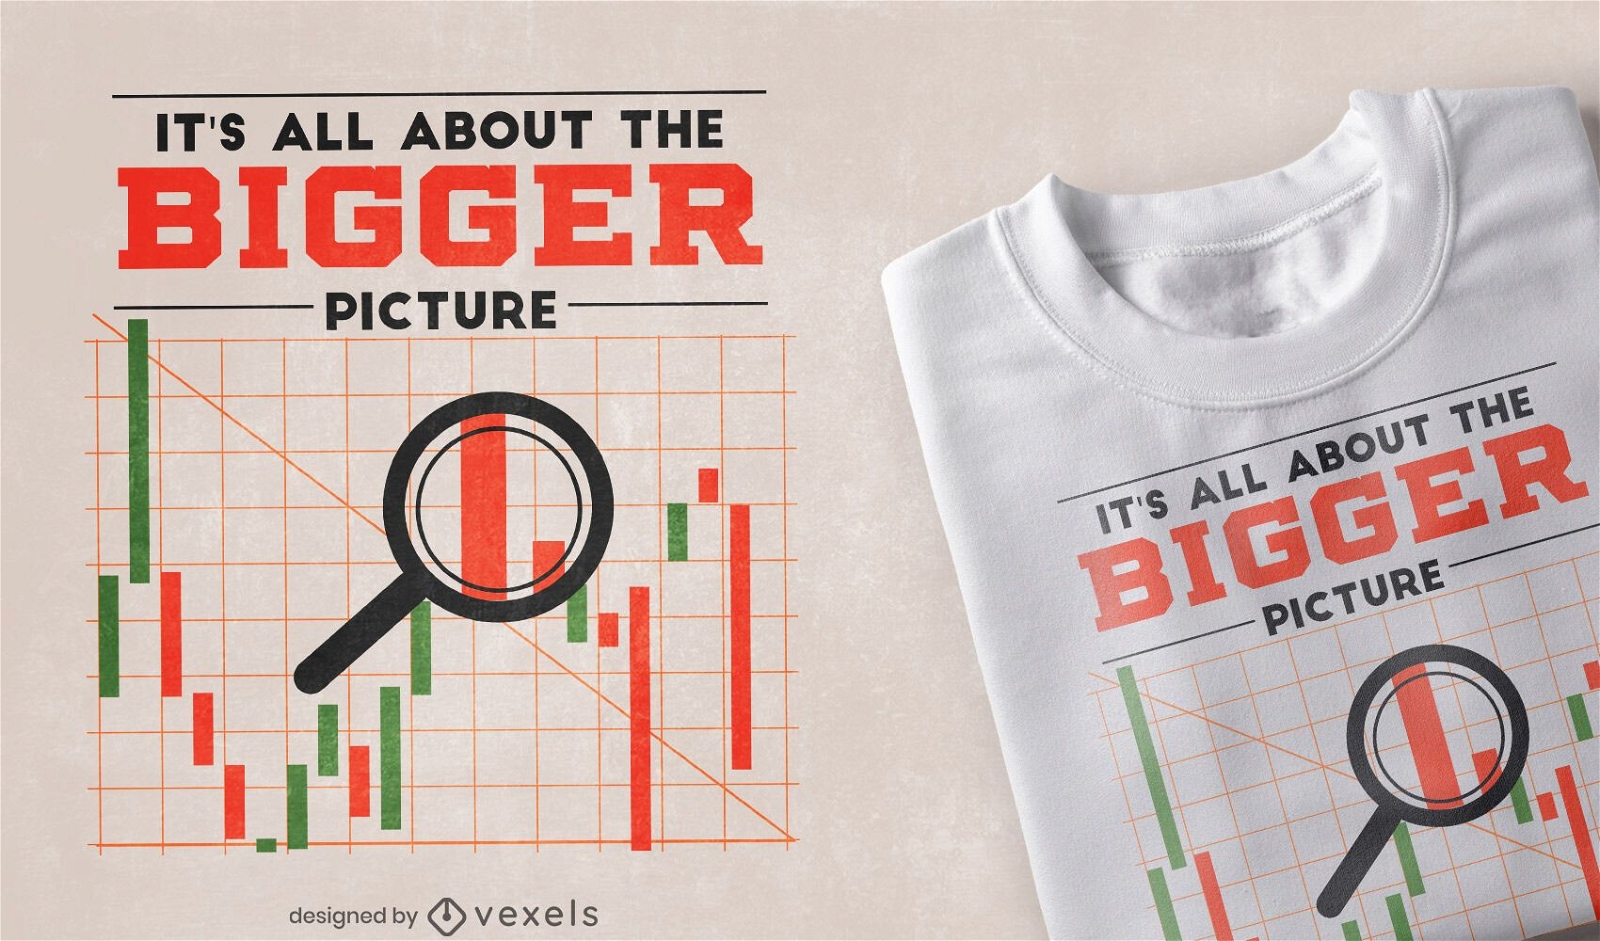
Stock market graph quote t-shirt design
Choose a folder
All favorites
Create new
Save
Stock market graph quote t-shirt design
Editable text
Print ready
for Merch
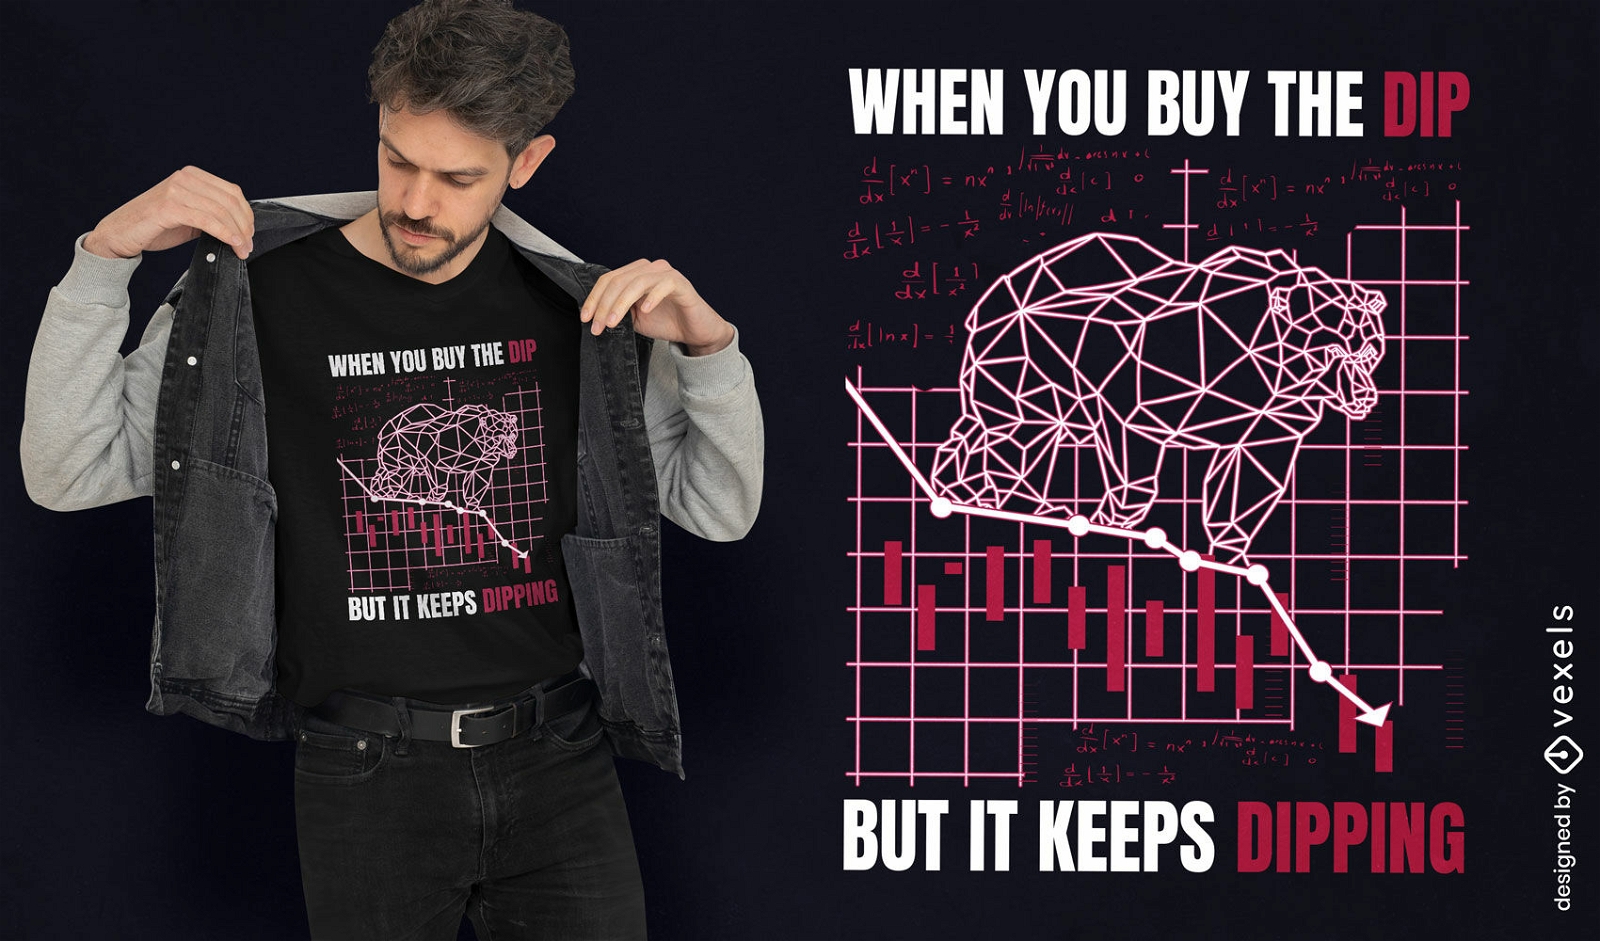
Bear animal in a graph t-shirt design
Choose a folder
All favorites
Create new
Save
Bear animal in a graph t-shirt design
Print ready
for Merch
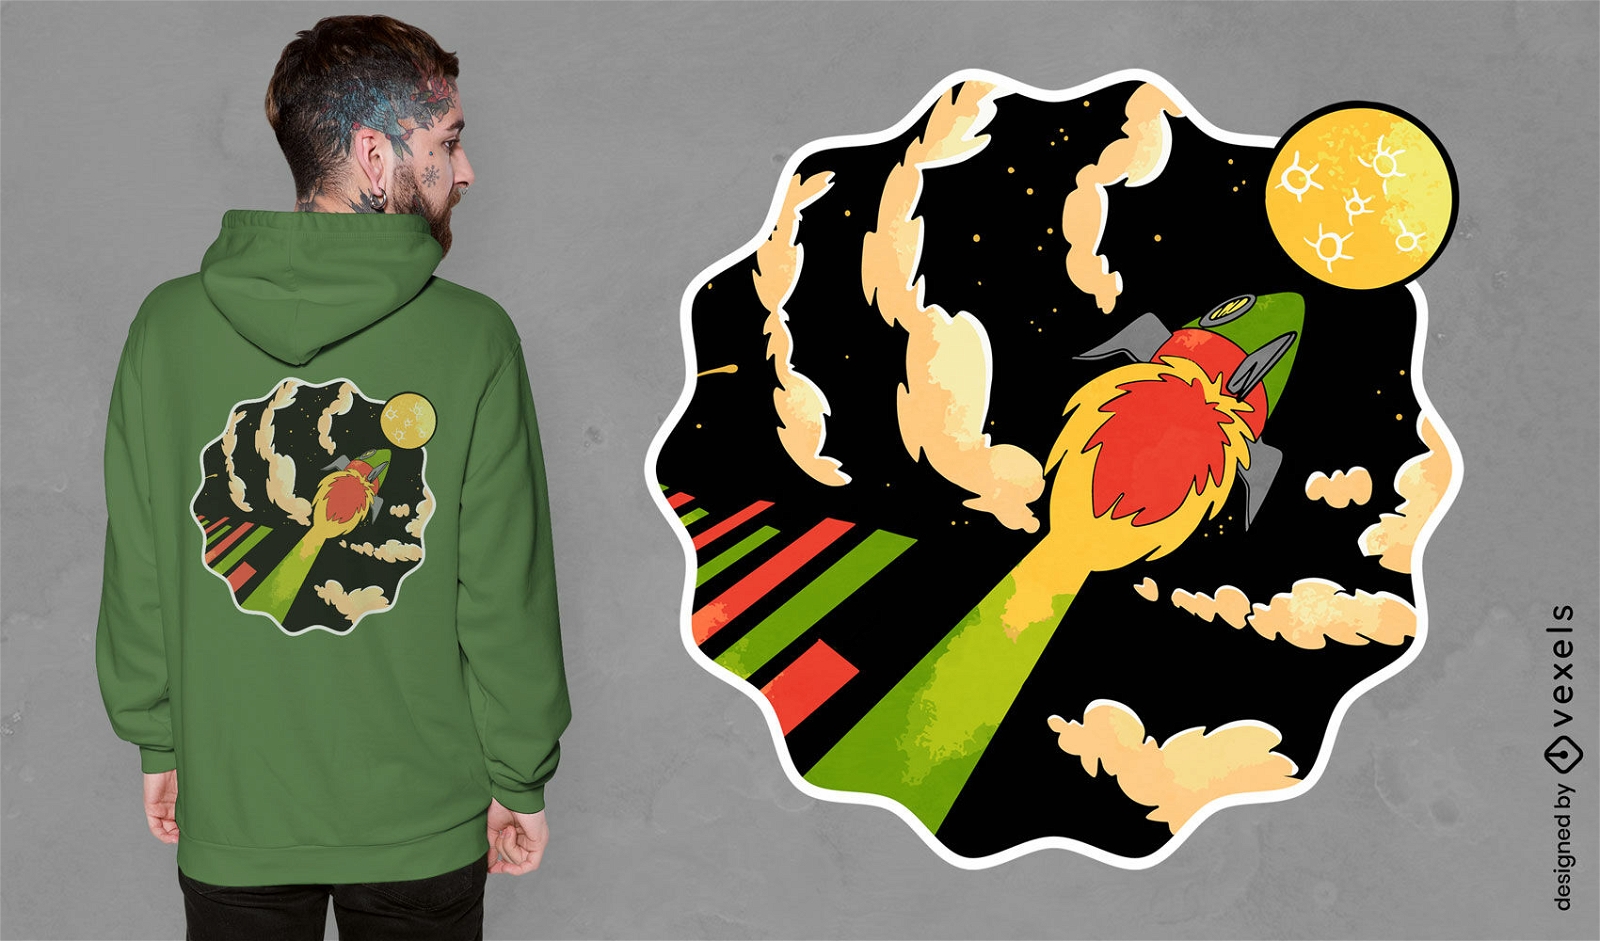
Space rocket flying over graph t-shirt design
Choose a folder
All favorites
Create new
Save
Space rocket flying over graph t-shirt design
Subscribe
To Get High-Quality Commercial Use Designs For Your Business
SEE PLANS
Next
of 4
prev page
next page