Design Library
New Merch Designs
T-Shirts
Vectors
Trending Merch Designs
PNGs & SVGs
Mockups
T-Shirt PSD Templates
Explore Designs
KDP Designs
Posters
Mugs
Phone Cases
Tote Bags
Pillows
Design Tools
Merch Designer
New!
Mockup Generator
AI Design Generator
Image Vectorizer
Quote Generator
T-Shirt Maker (Old)
Resources
Merch Digest
Blog
Help Center
Learn About Merch
Feedback
Corporate Solutions
Enterprise
API Access
Design Studio
Bulk Design Production
Pricing
Loading...
Sign Up
Login
Vectors
chart
Design Library
New Merch Designs
T-Shirts
Vectors
Trending Merch Designs
PNGs & SVGs
Mockups
T-Shirt PSD Templates
Explore Designs
KDP Designs
Posters
Mugs
Phone Cases
Tote Bags
Pillows
Design Tools
Merch Designer
New!
Mockup Generator
AI Design Generator
Image Vectorizer
Quote Generator
T-Shirt Maker (Old)
Resources
Merch Digest
Blog
Help Center
Learn About Merch
Feedback
Corporate Solutions
Enterprise
API Access
Design Studio
Bulk Design Production
PLANS
Vectors
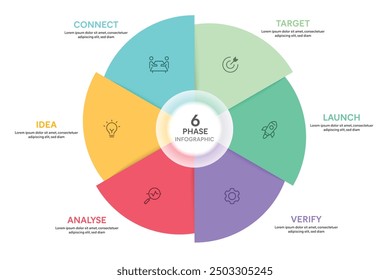
chart
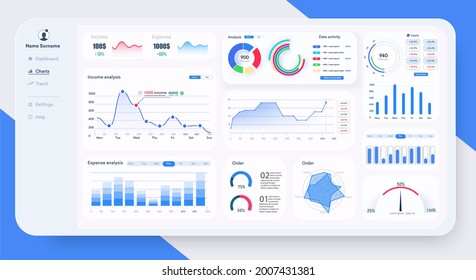
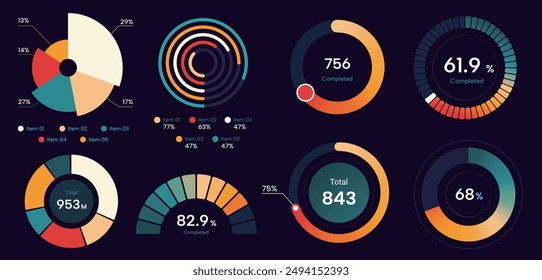
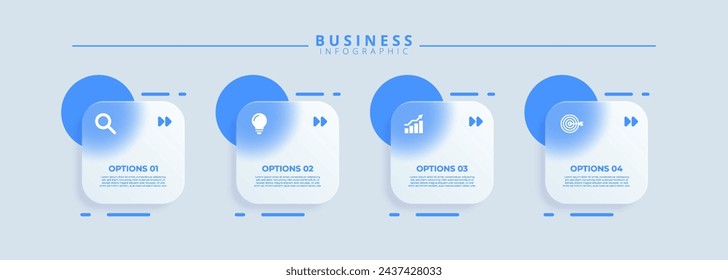
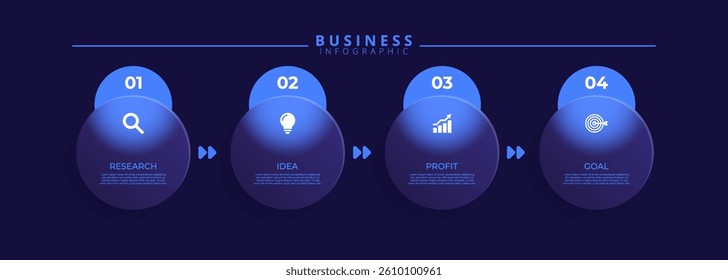
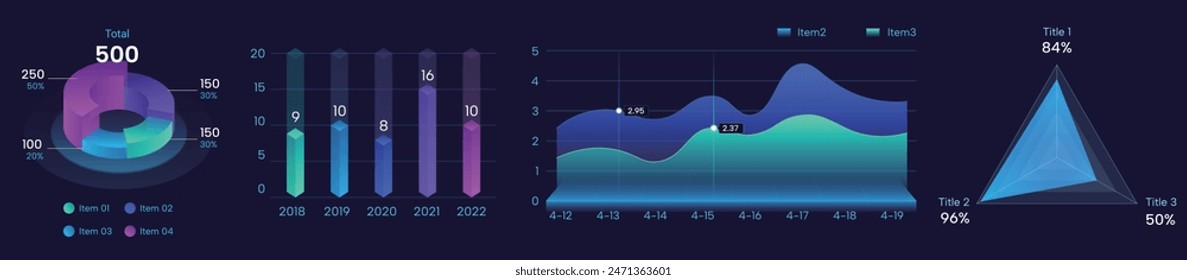
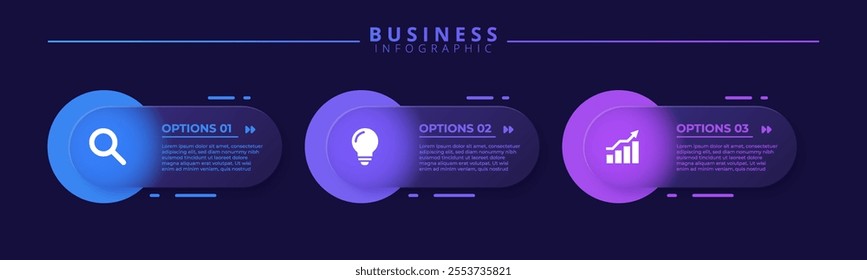
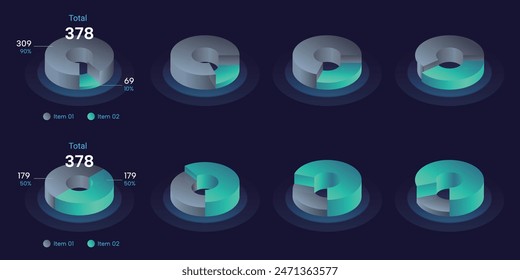
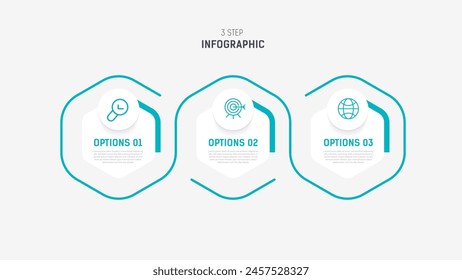
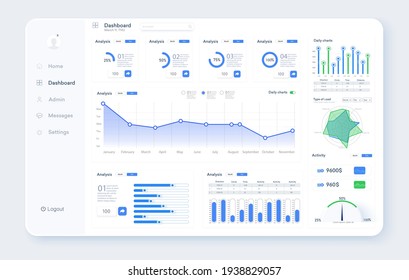
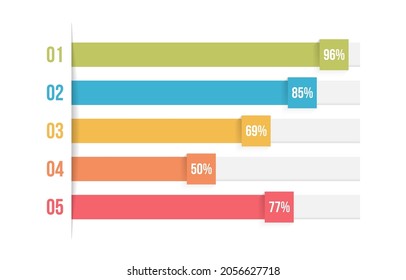
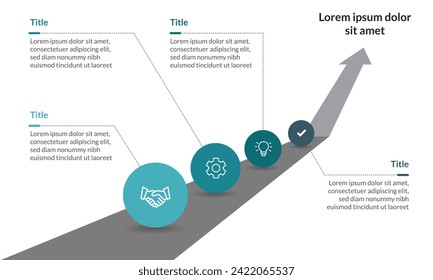
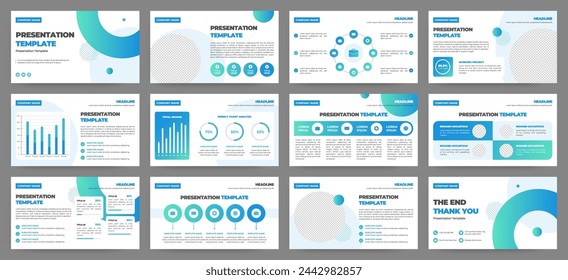
234 chart Vectors & Graphics to Download
Download chart editable vector graphics for every design project. In AI, SVG, PNG, JPG and PSD.
Related:
charts
,
pie chart
,
pie charts
Sort by
Most relevant
Sponsored results by
Get 15% off with code: VEXELS15
Show more
Beautiful Financial Icon Set
Choose a folder
All favorites
Create new
Save
Beautiful Financial Icon Set
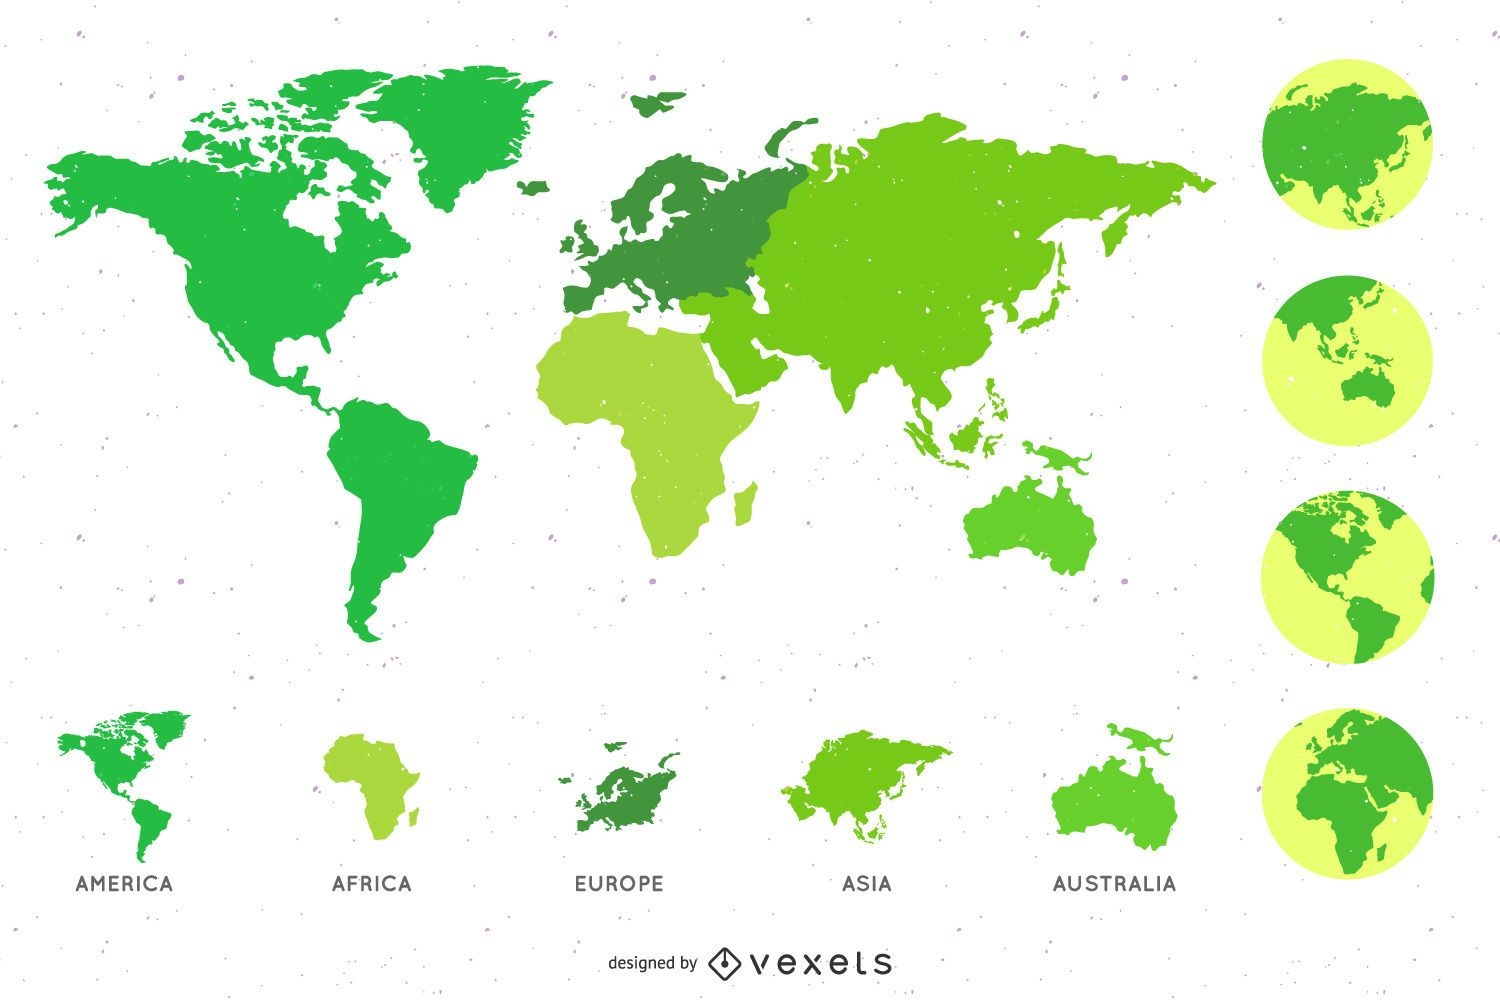
Globe Pack with Map Around
Choose a folder
All favorites
Create new
Save
Globe Pack with Map Around
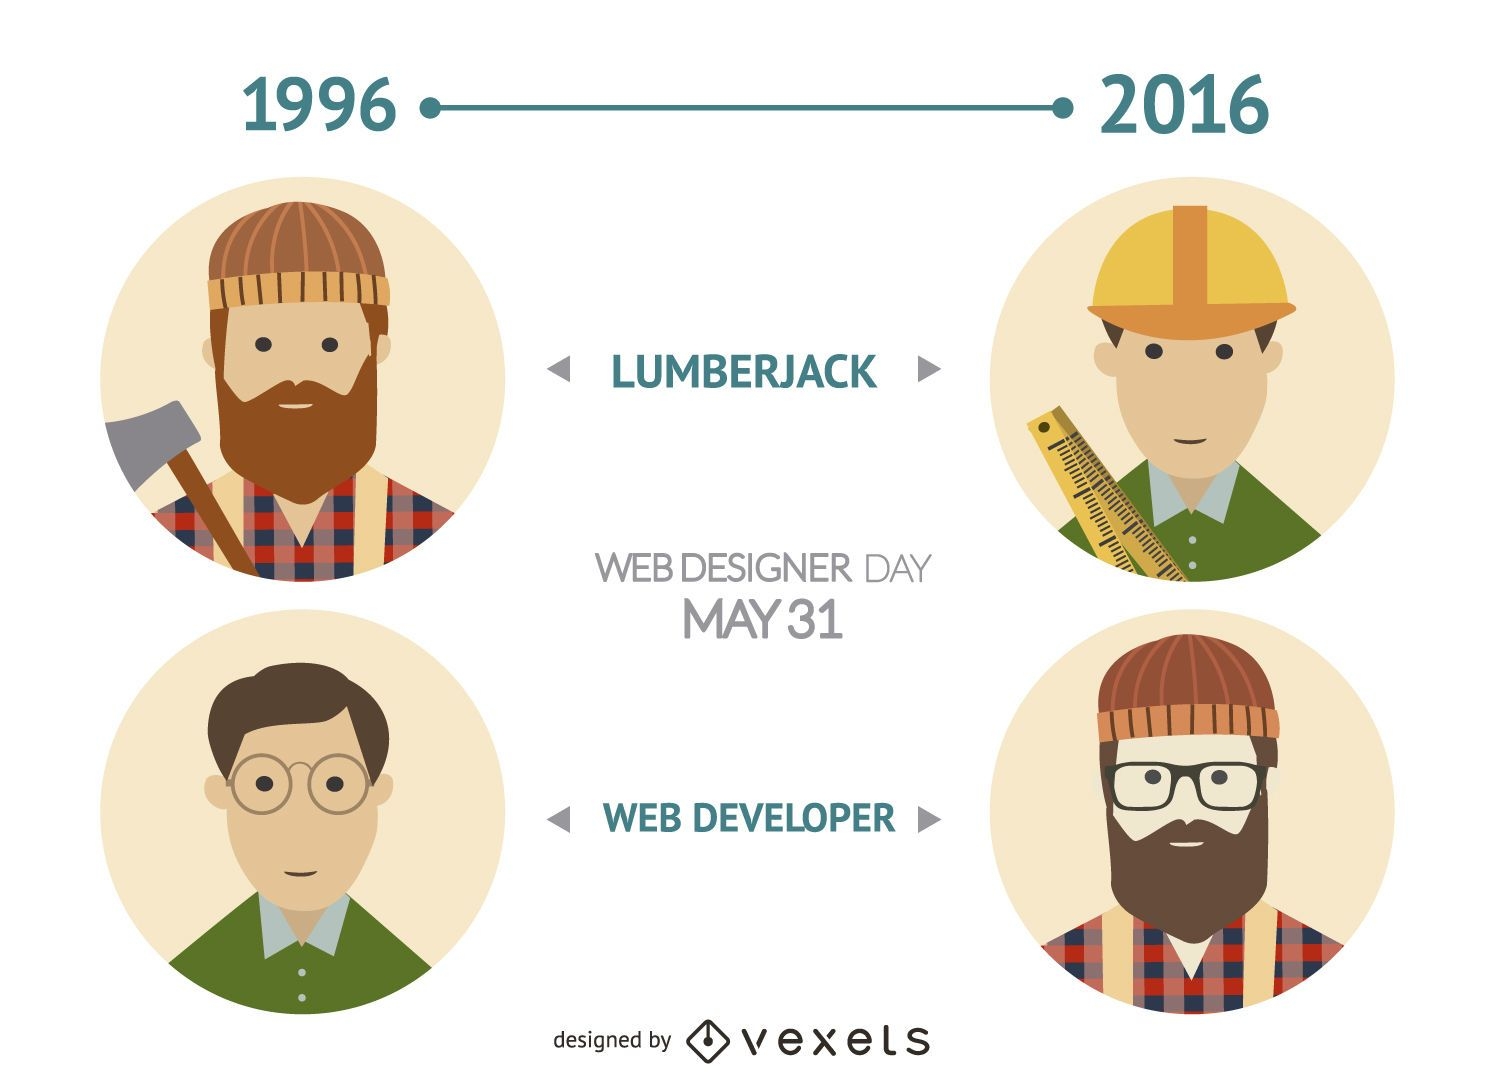
Web developer and lumberjack comparison
Choose a folder
All favorites
Create new
Save
Web developer and lumberjack comparison
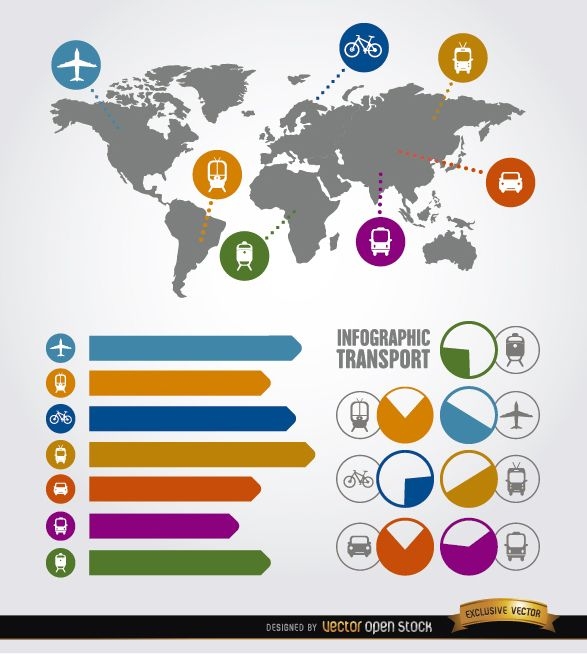
Travel infographic transport elements
Choose a folder
All favorites
Create new
Save
Travel infographic transport elements
Digital Technology Background with Info-Graphic
Choose a folder
All favorites
Create new
Save
Digital Technology Background with Info-Graphic
Isometric Vector icons
Choose a folder
All favorites
Create new
Save
Isometric Vector icons
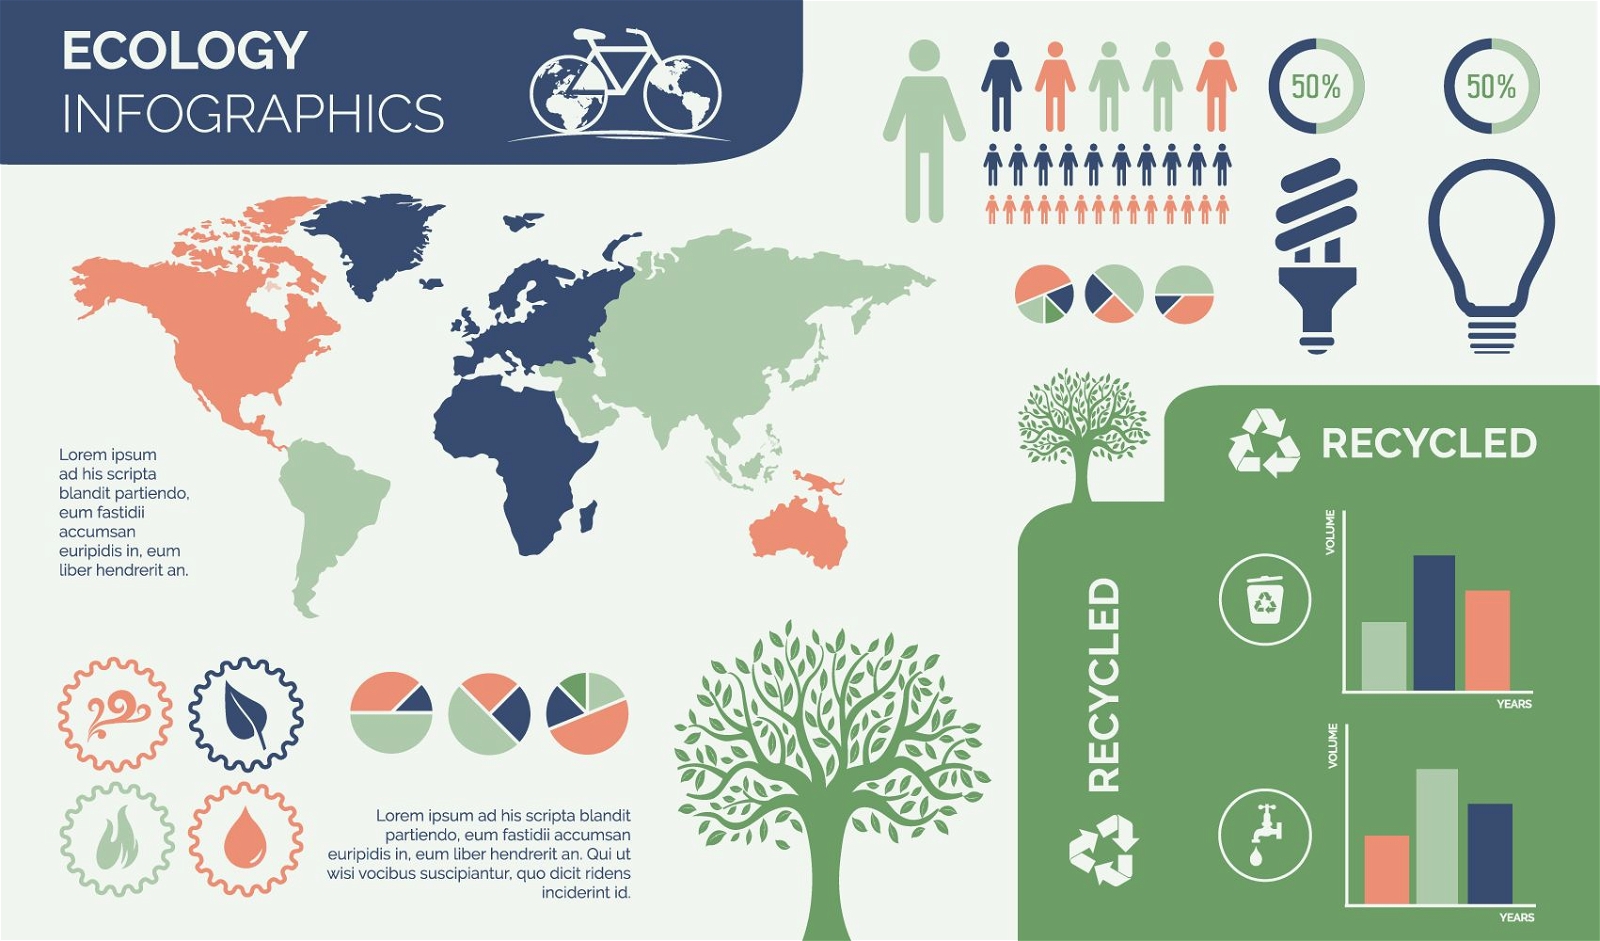
Environmental Ecology Infographic Design
Choose a folder
All favorites
Create new
Save
Environmental Ecology Infographic Design
Latest Business News on Laptop
Choose a folder
All favorites
Create new
Save
Latest Business News on Laptop
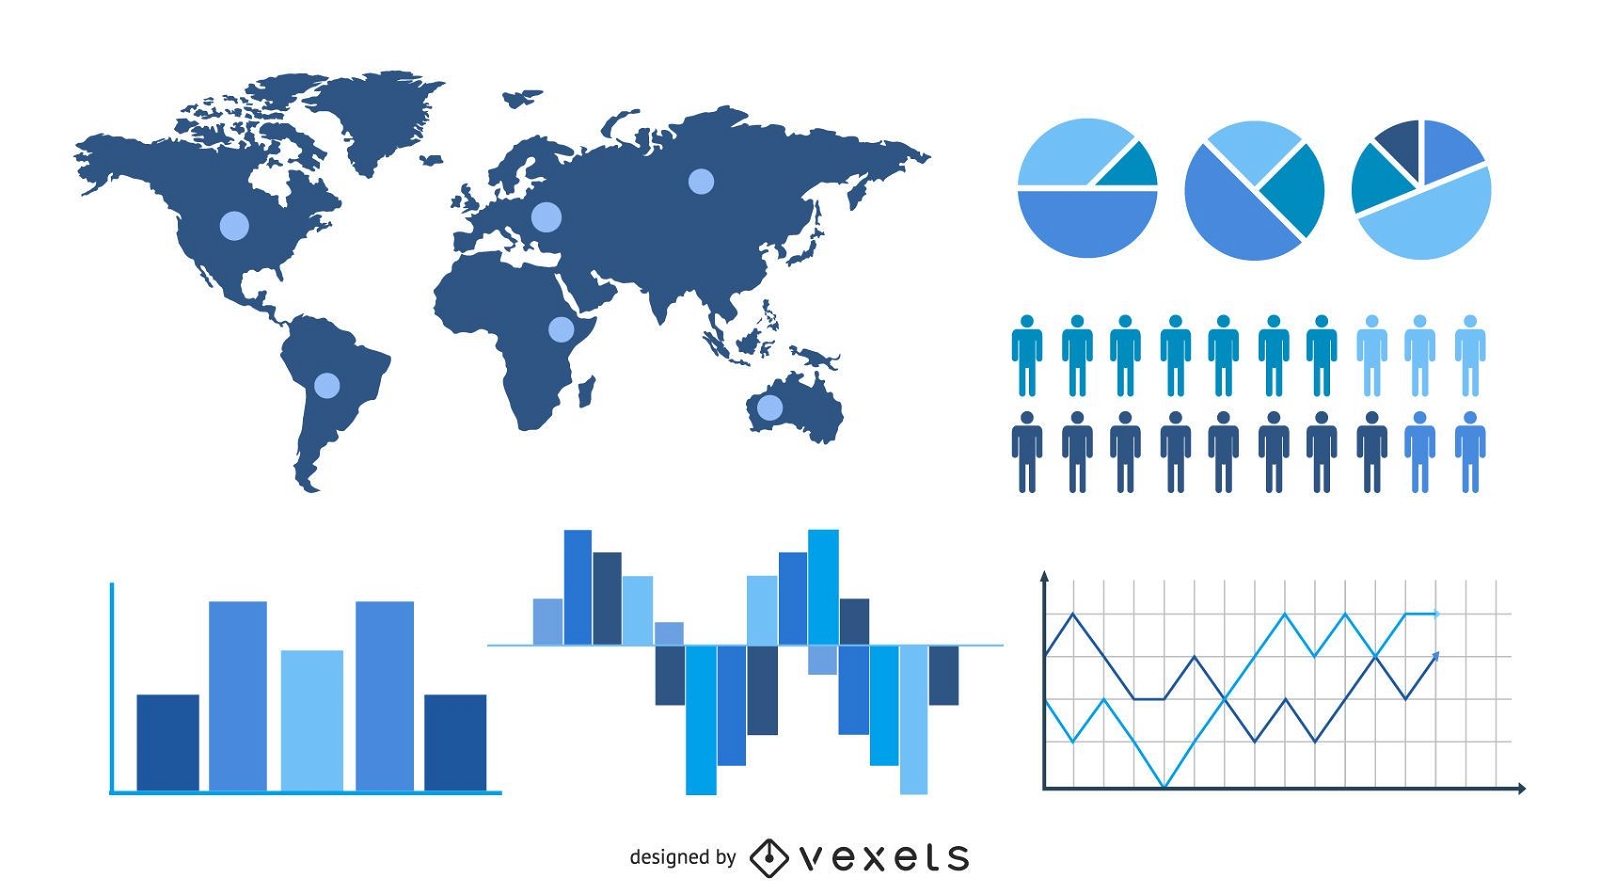
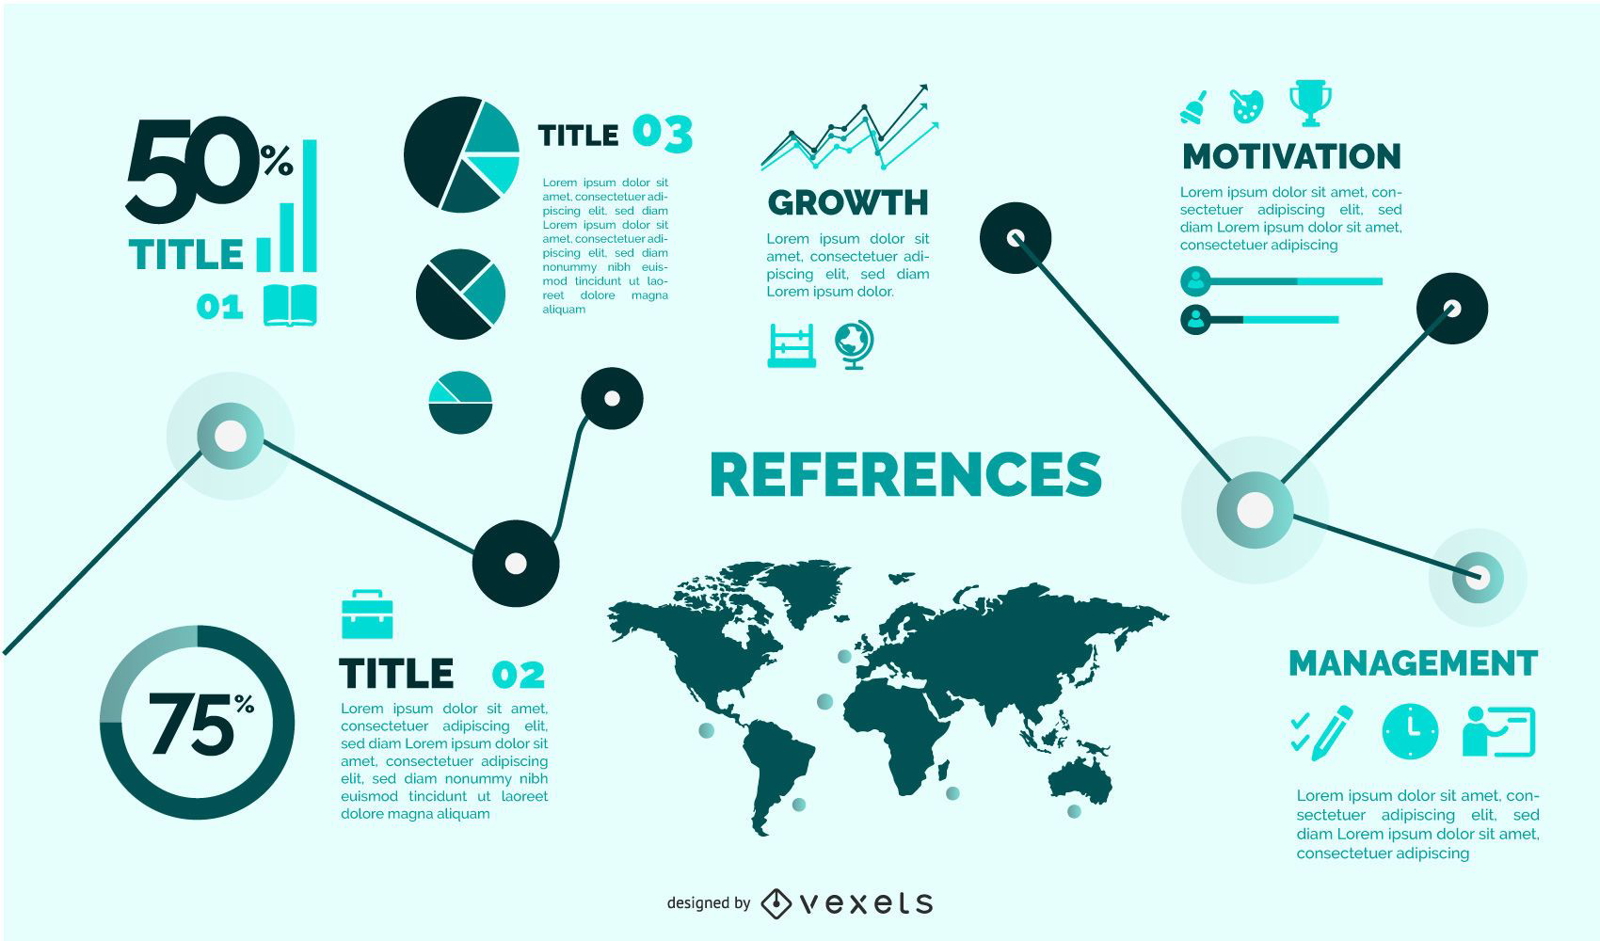
Statistic & Analytical Infographic Set
Choose a folder
All favorites
Create new
Save
Statistic & Analytical Infographic Set
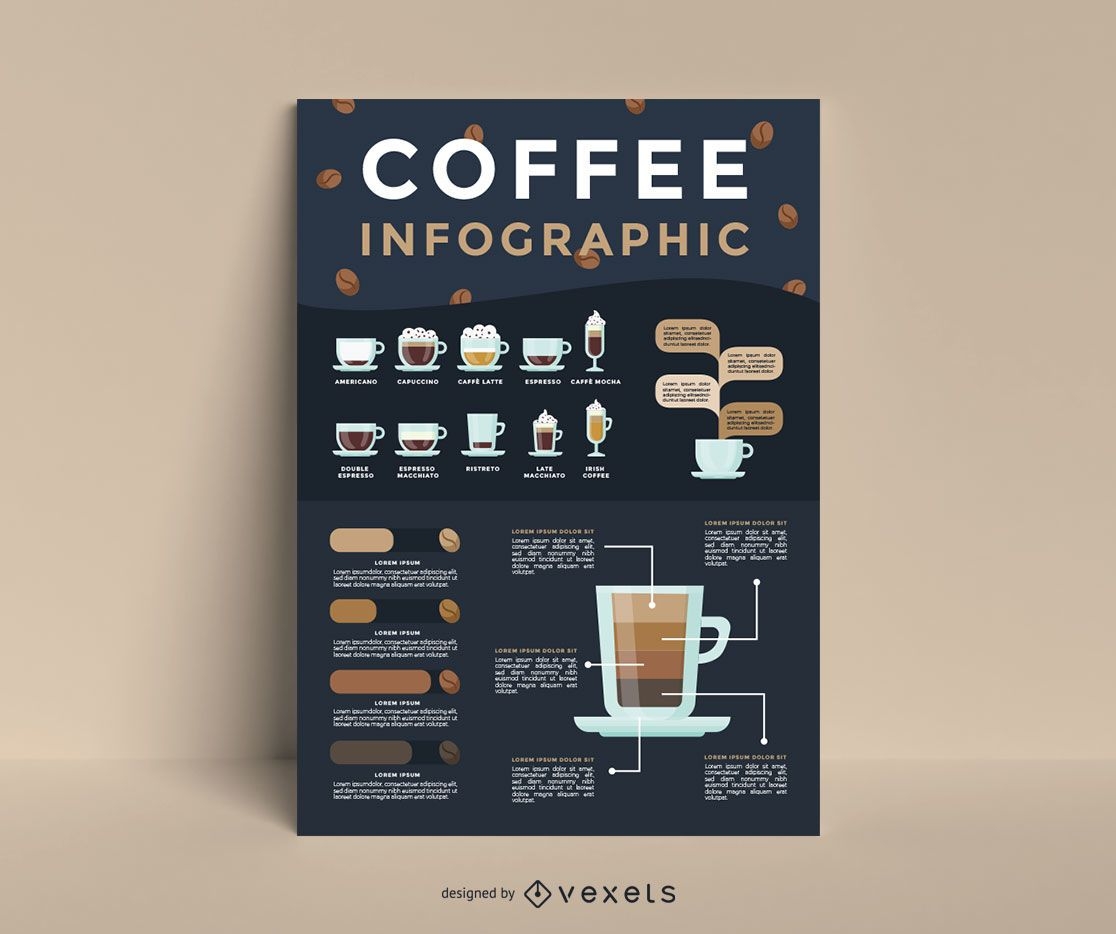
Editable text
Premium
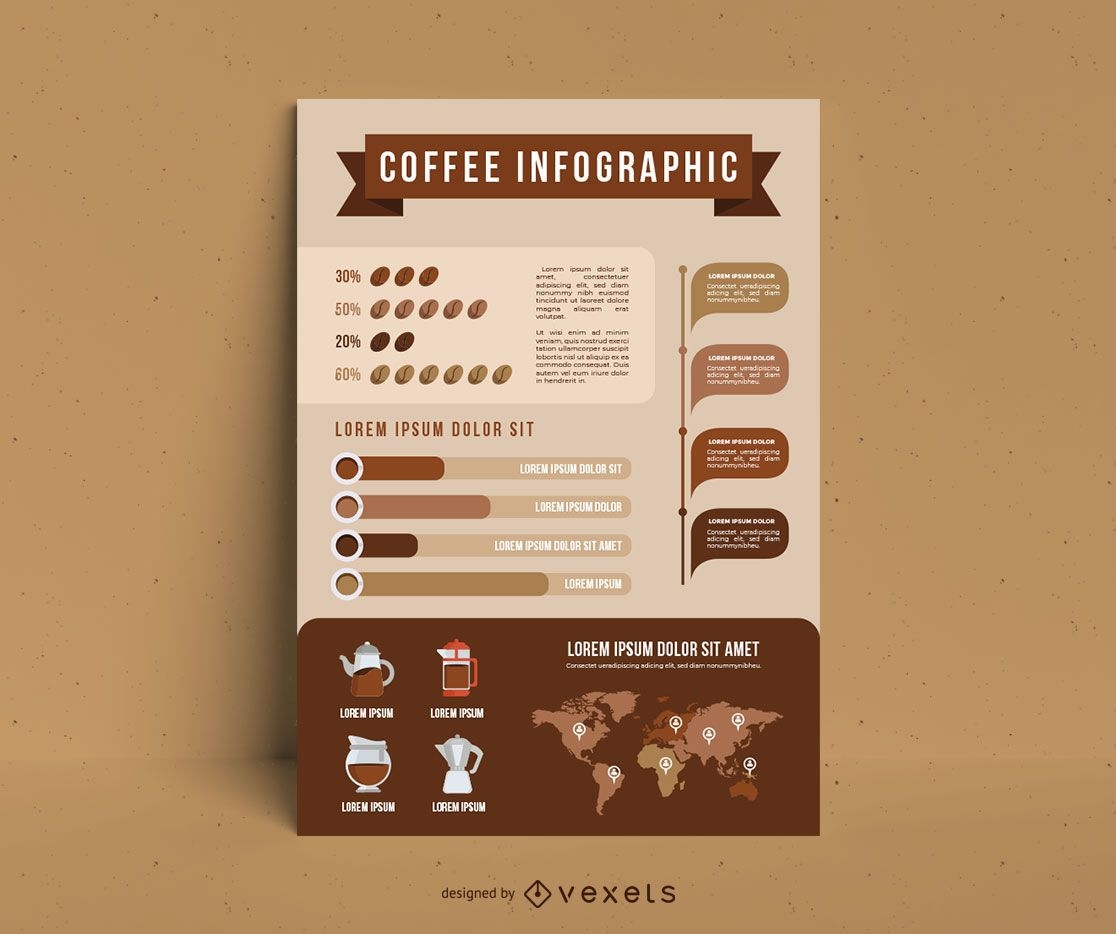
Coffee infographic template
Choose a folder
All favorites
Create new
Save
Coffee infographic template
Premium
Hospital Element Design Pack
Choose a folder
All favorites
Create new
Save
Hospital Element Design Pack
Flat electronic devices with shadows set
Choose a folder
All favorites
Create new
Save
Flat electronic devices with shadows set
Web development process backgrounds
Choose a folder
All favorites
Create new
Save
Web development process backgrounds
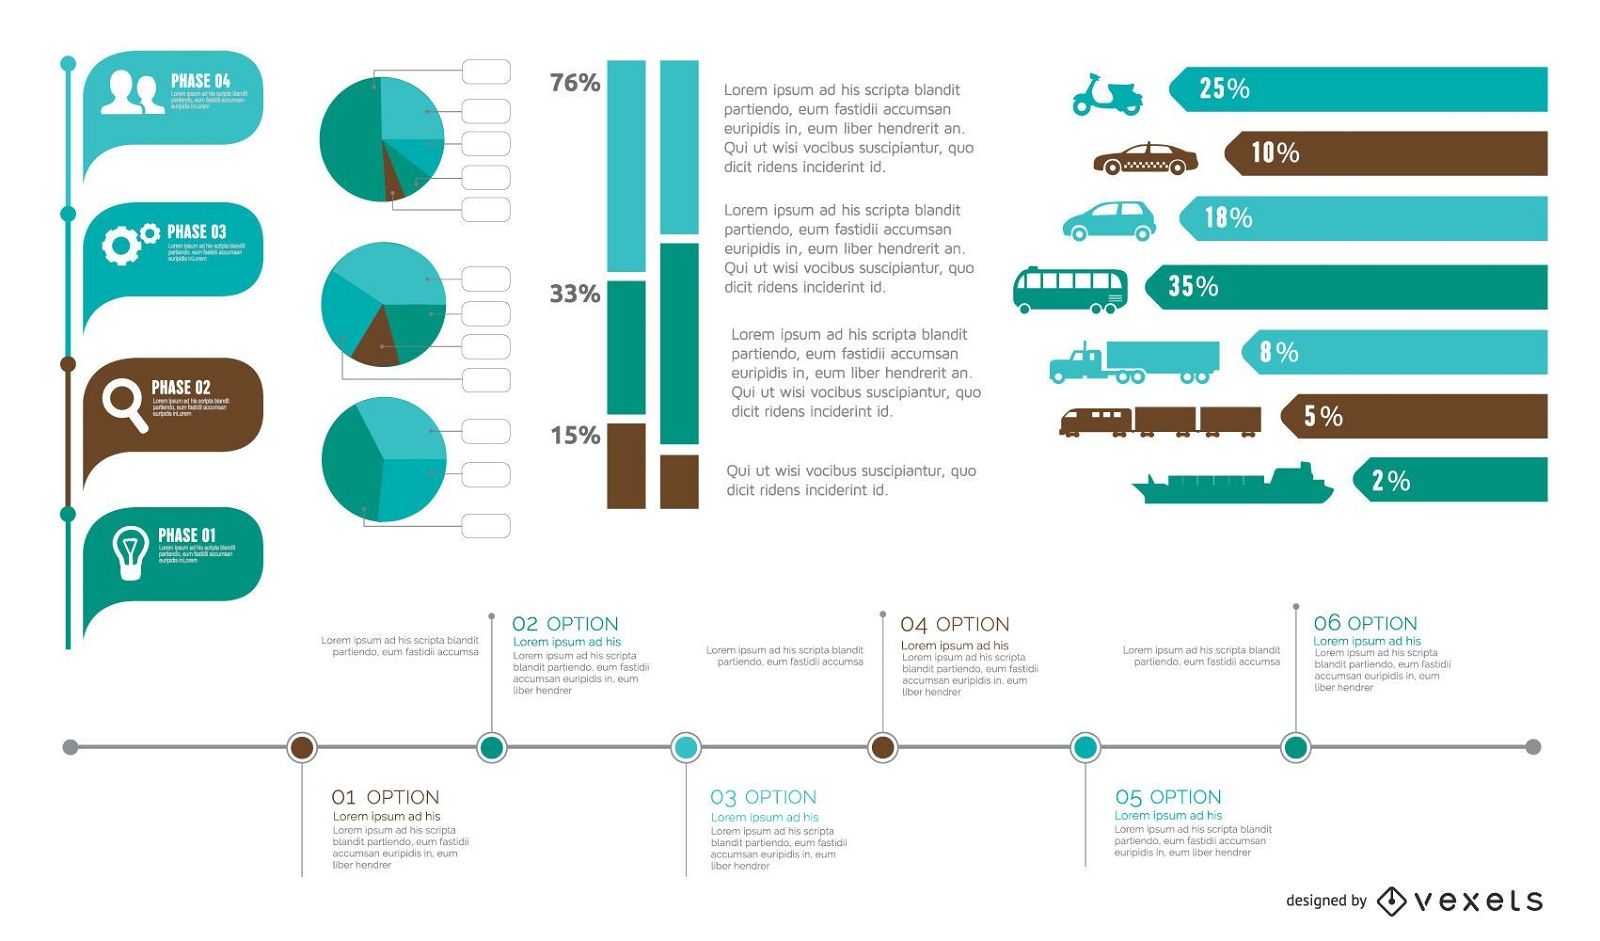
Timeline infographic template set
Choose a folder
All favorites
Create new
Save
Timeline infographic template set
Christmas Infographic elements
Choose a folder
All favorites
Create new
Save
Christmas Infographic elements
Hand Drawn Business Icon Pack
Choose a folder
All favorites
Create new
Save
Hand Drawn Business Icon Pack
Vector Icon Collection
Choose a folder
All favorites
Create new
Save
Vector Icon Collection
Premium
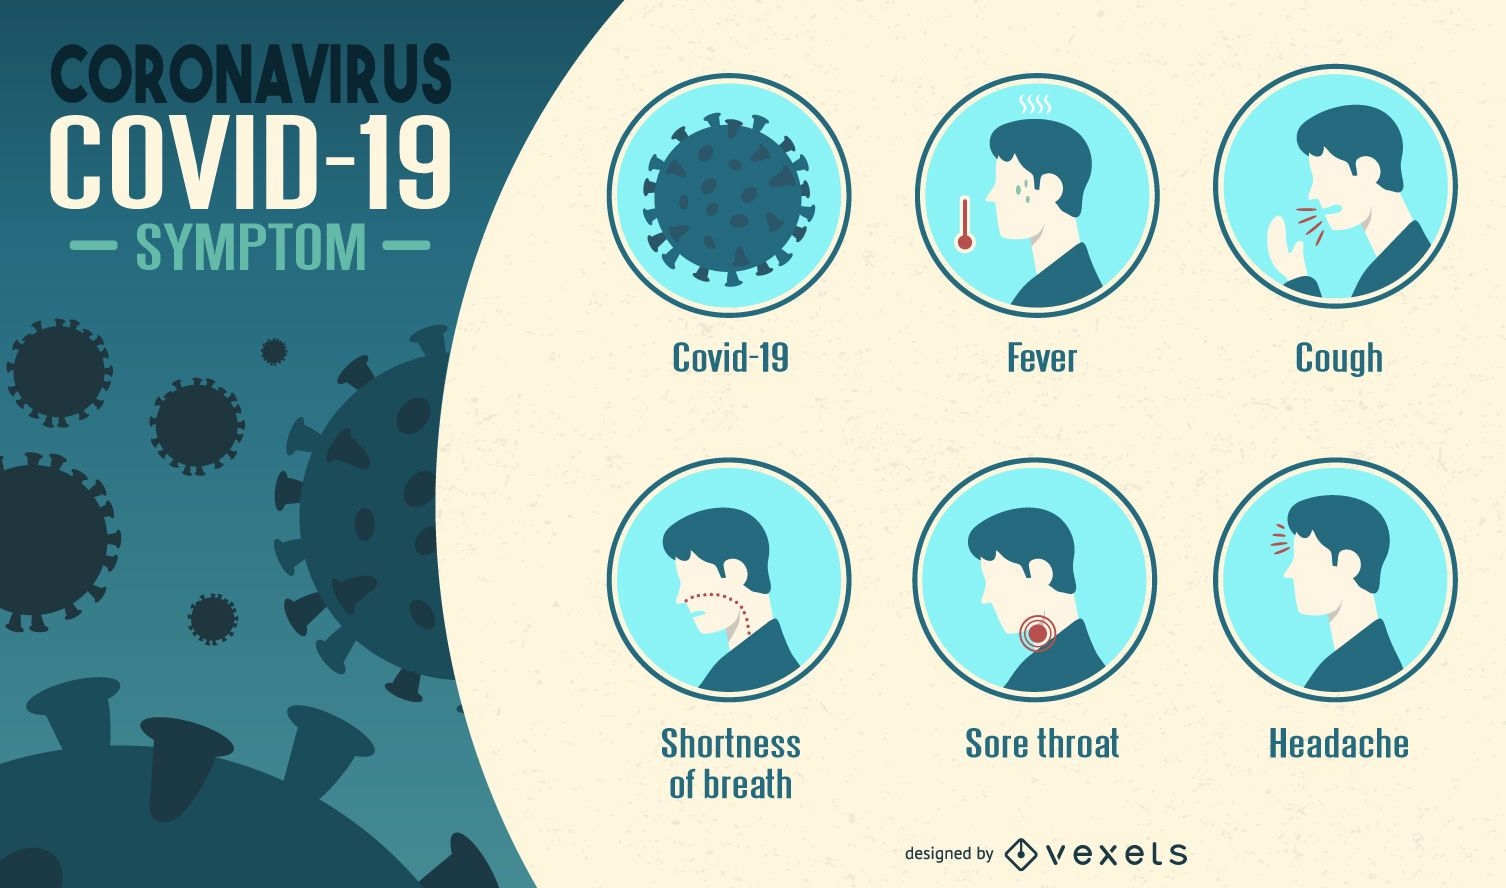
Coronavirus symptoms infographic
Choose a folder
All favorites
Create new
Save
Coronavirus symptoms infographic
Flat Diamond Layout Colorful Squares Infographic
Choose a folder
All favorites
Create new
Save
Flat Diamond Layout Colorful Squares Infographic
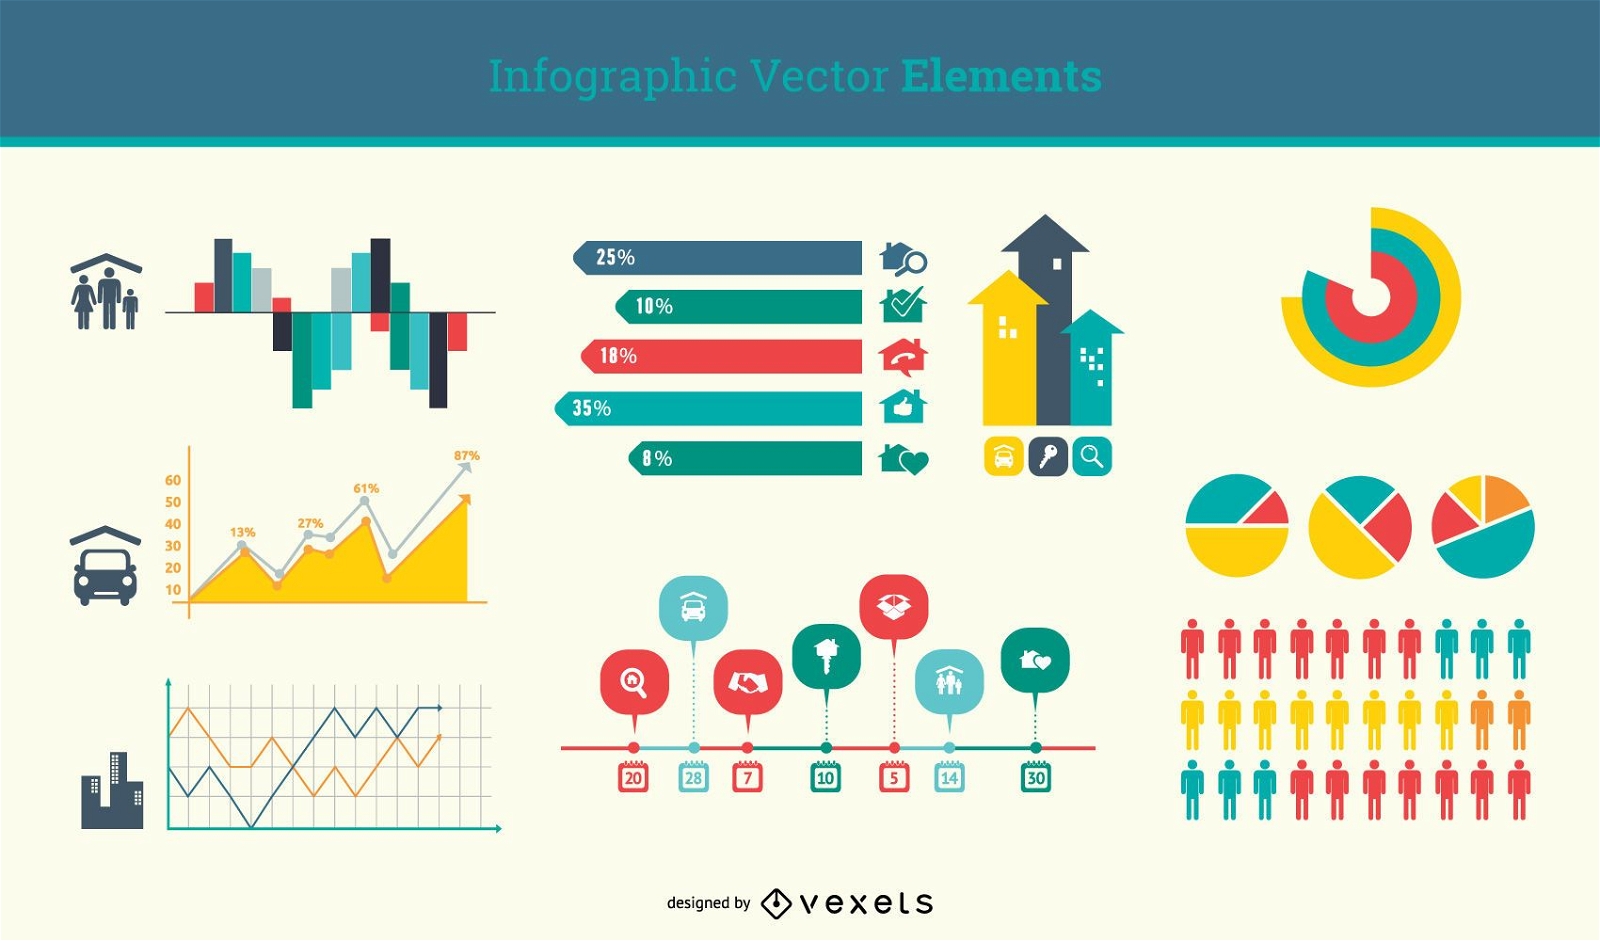
Flat Minimal Infographic Element Set
Choose a folder
All favorites
Create new
Save
Flat Minimal Infographic Element Set
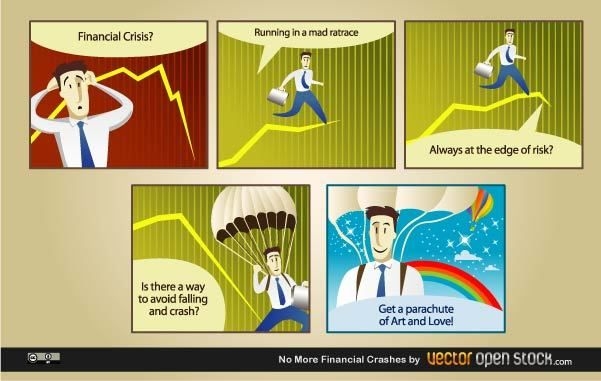
No more financial Crashes
Choose a folder
All favorites
Create new
Save
No more financial Crashes
Premium
Halloween Zombie Alphabet Number Set
Choose a folder
All favorites
Create new
Save
Halloween Zombie Alphabet Number Set
Colorful Infographic Element Pack in Flat Style
Choose a folder
All favorites
Create new
Save
Colorful Infographic Element Pack in Flat Style
Editable text
Premium
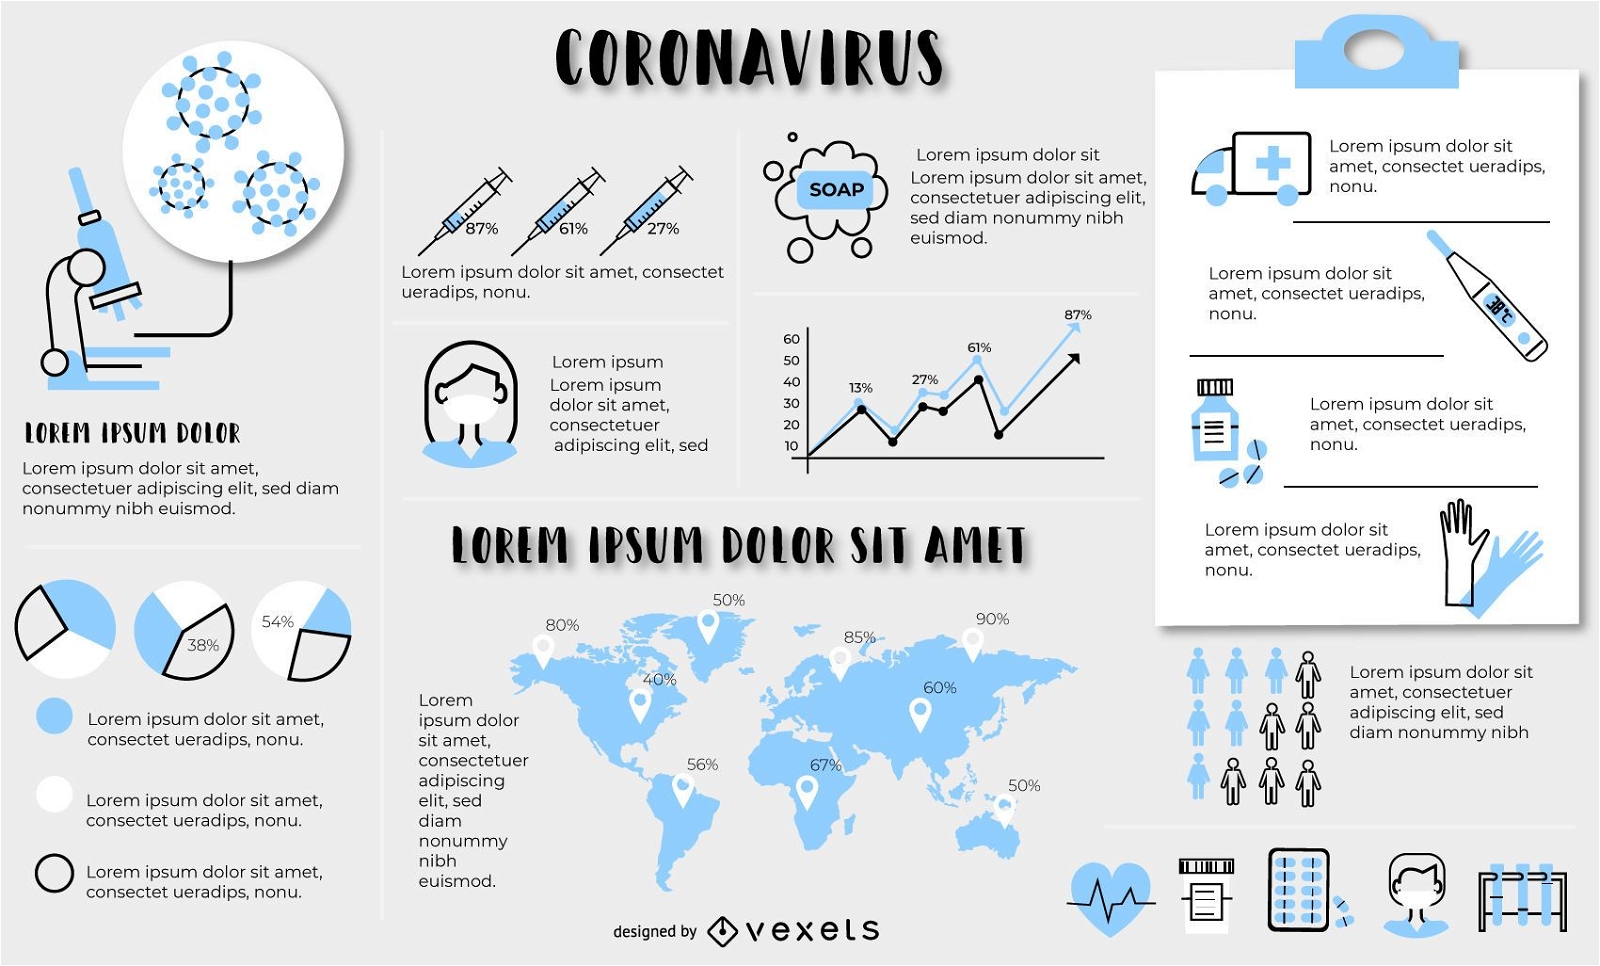
Coronavirus infographic elements template
Choose a folder
All favorites
Create new
Save
Coronavirus infographic elements template
Premium
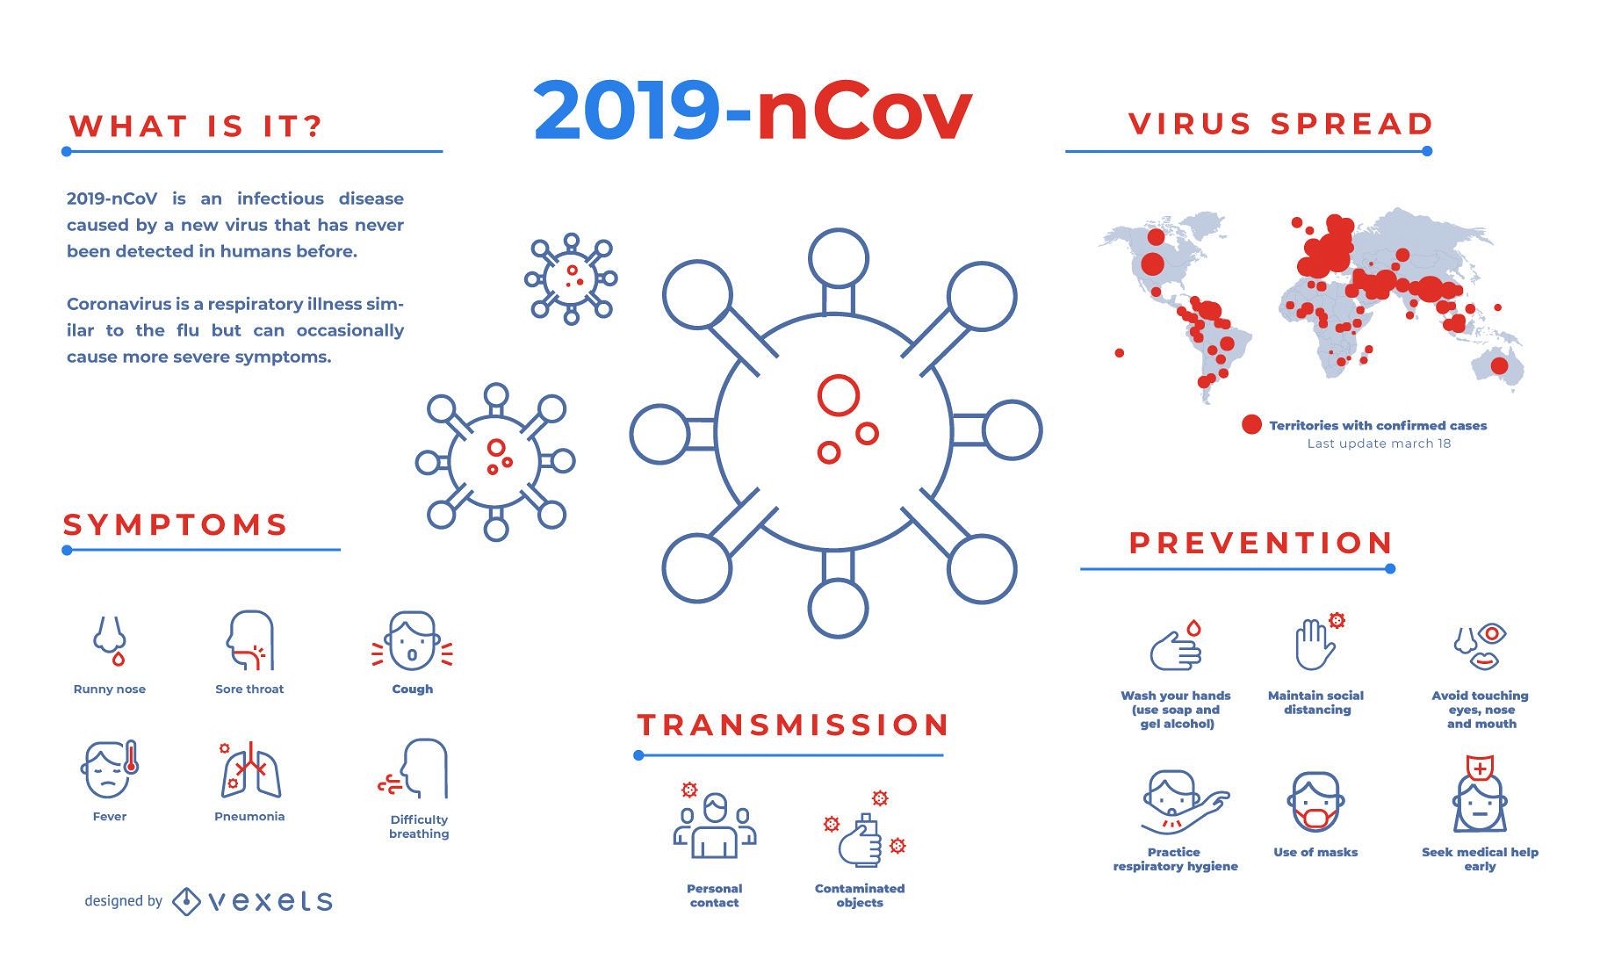
Covid-19 infographic template
Choose a folder
All favorites
Create new
Save
Covid-19 infographic template
Editable text
Premium
Types of coffee infographic template
Choose a folder
All favorites
Create new
Save
Types of coffee infographic template
No GMO label set
Choose a folder
All favorites
Create new
Save
No GMO label set
Premium
Halloween Witch Letter Set
Choose a folder
All favorites
Create new
Save
Halloween Witch Letter Set
Colorful Glowing Background
Choose a folder
All favorites
Create new
Save
Colorful Glowing Background
Premium
Ecommerce Stroke Icons Collection
Choose a folder
All favorites
Create new
Save
Ecommerce Stroke Icons Collection
Flat Style Template Infographic Set
Choose a folder
All favorites
Create new
Save
Flat Style Template Infographic Set
Editable Template
Premium
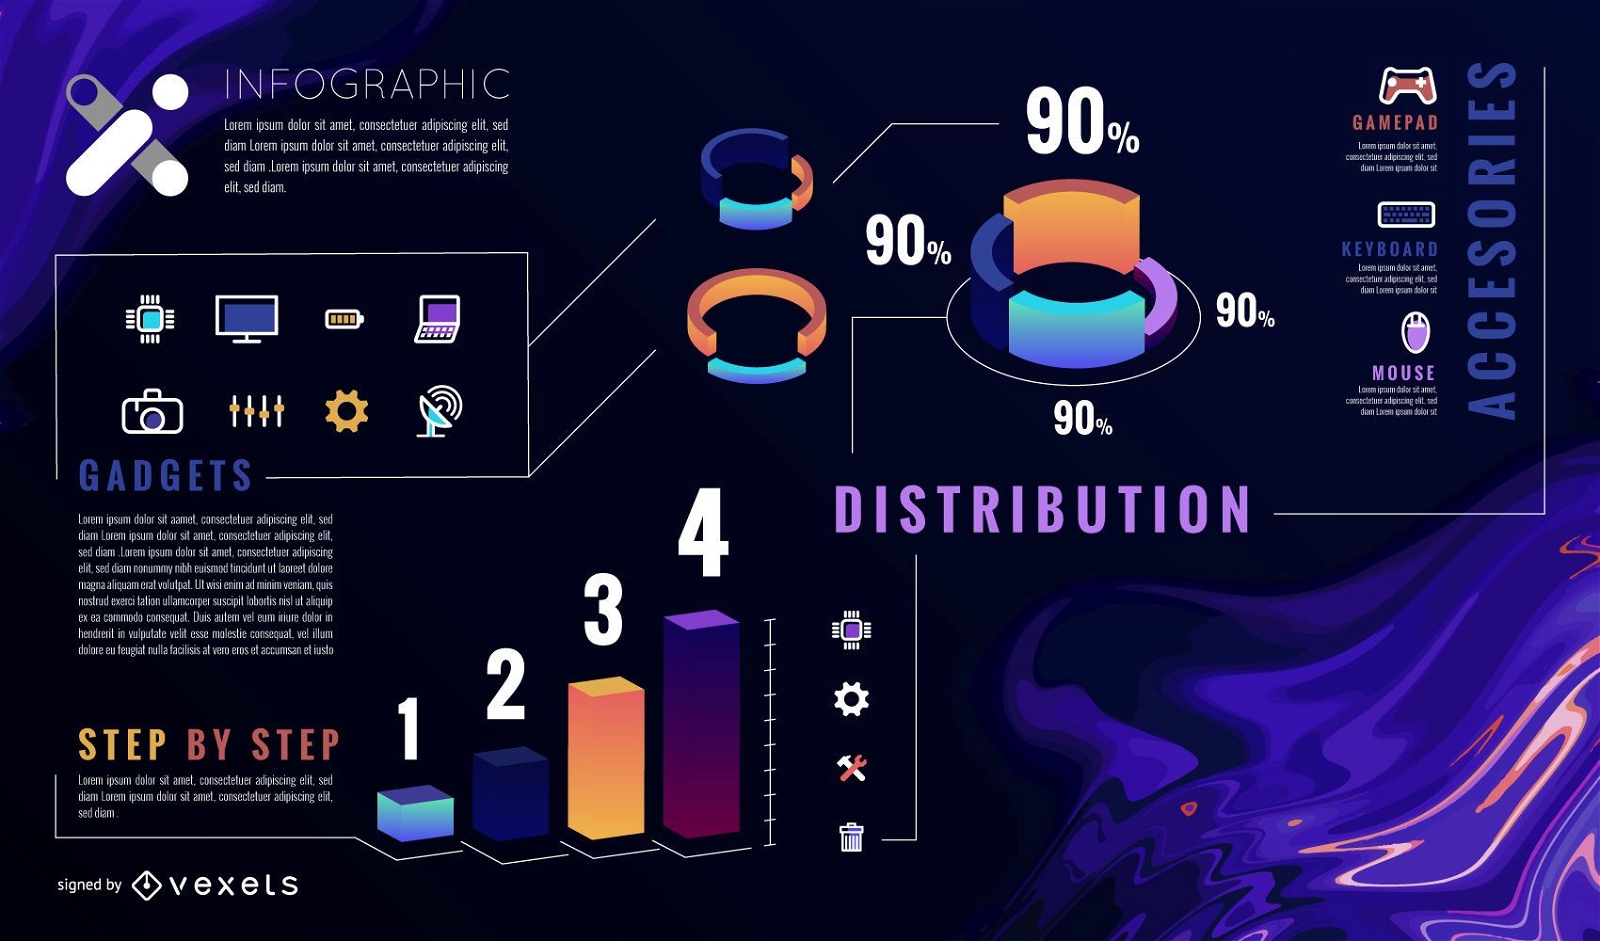
Infographic abstract template
Choose a folder
All favorites
Create new
Save
Infographic abstract template
Editable text
Premium
Coffee infographic
Choose a folder
All favorites
Create new
Save
Coffee infographic
Vector Icons
Choose a folder
All favorites
Create new
Save
Vector Icons
Flat design stop GMO sign
Choose a folder
All favorites
Create new
Save
Flat design stop GMO sign
Premium
Stroke Hospital Elements Design Pack
Choose a folder
All favorites
Create new
Save
Stroke Hospital Elements Design Pack
Icon set
Choose a folder
All favorites
Create new
Save
Icon set
Growing Buildings Background
Choose a folder
All favorites
Create new
Save
Growing Buildings Background
Web 2.0 vector icons
Choose a folder
All favorites
Create new
Save
Web 2.0 vector icons
Premium
Pharmacy Icons Design Pack
Choose a folder
All favorites
Create new
Save
Pharmacy Icons Design Pack
Premium
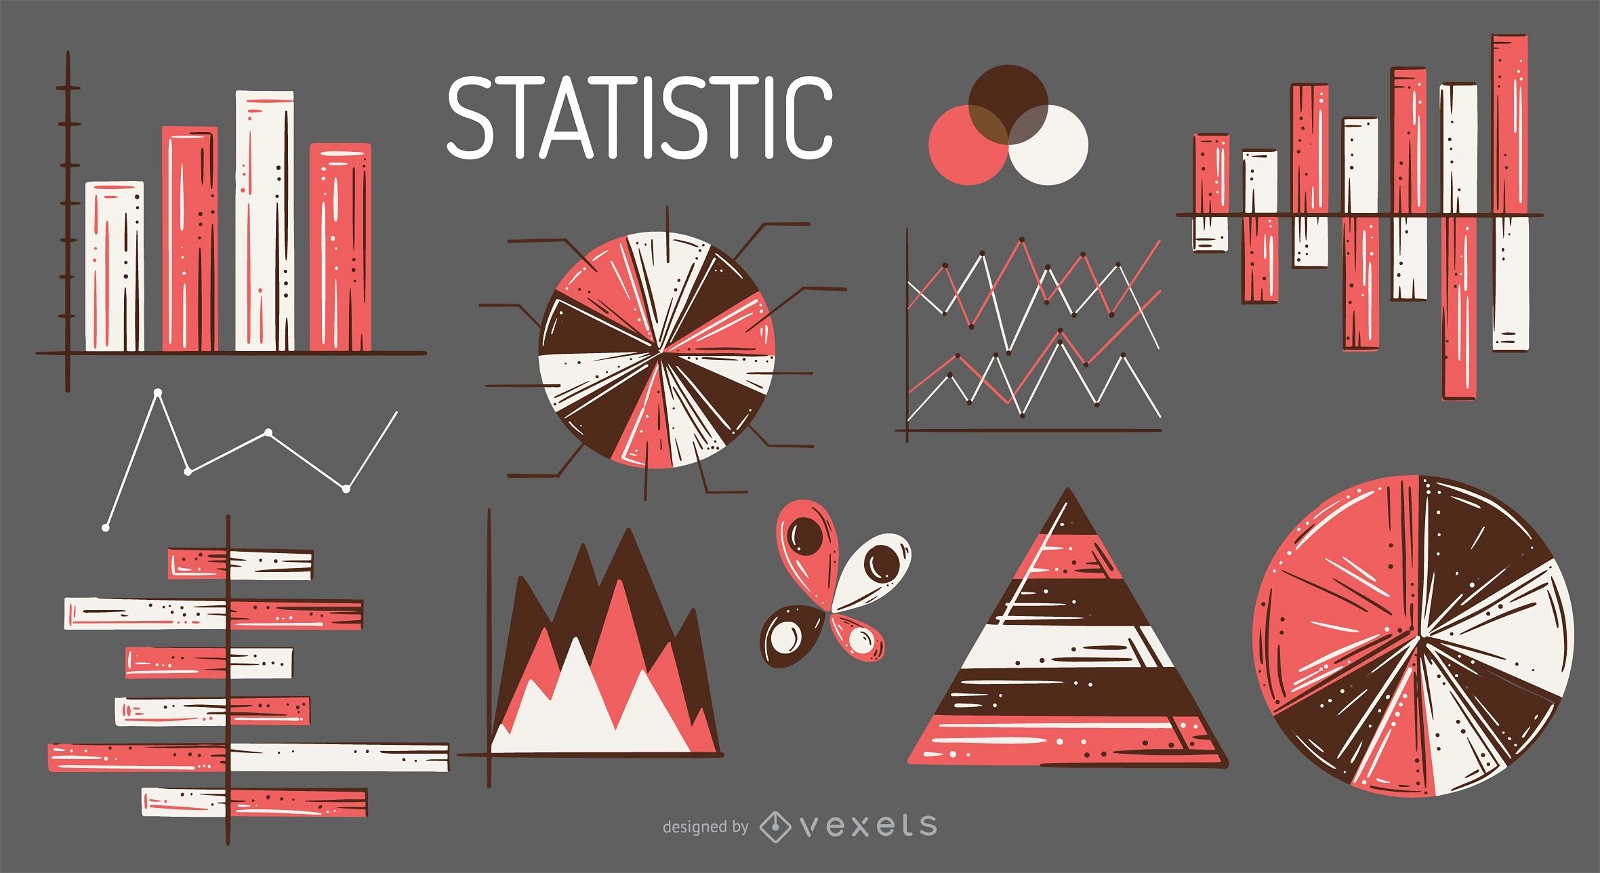
Statistic elements illustration set
Choose a folder
All favorites
Create new
Save
Statistic elements illustration set
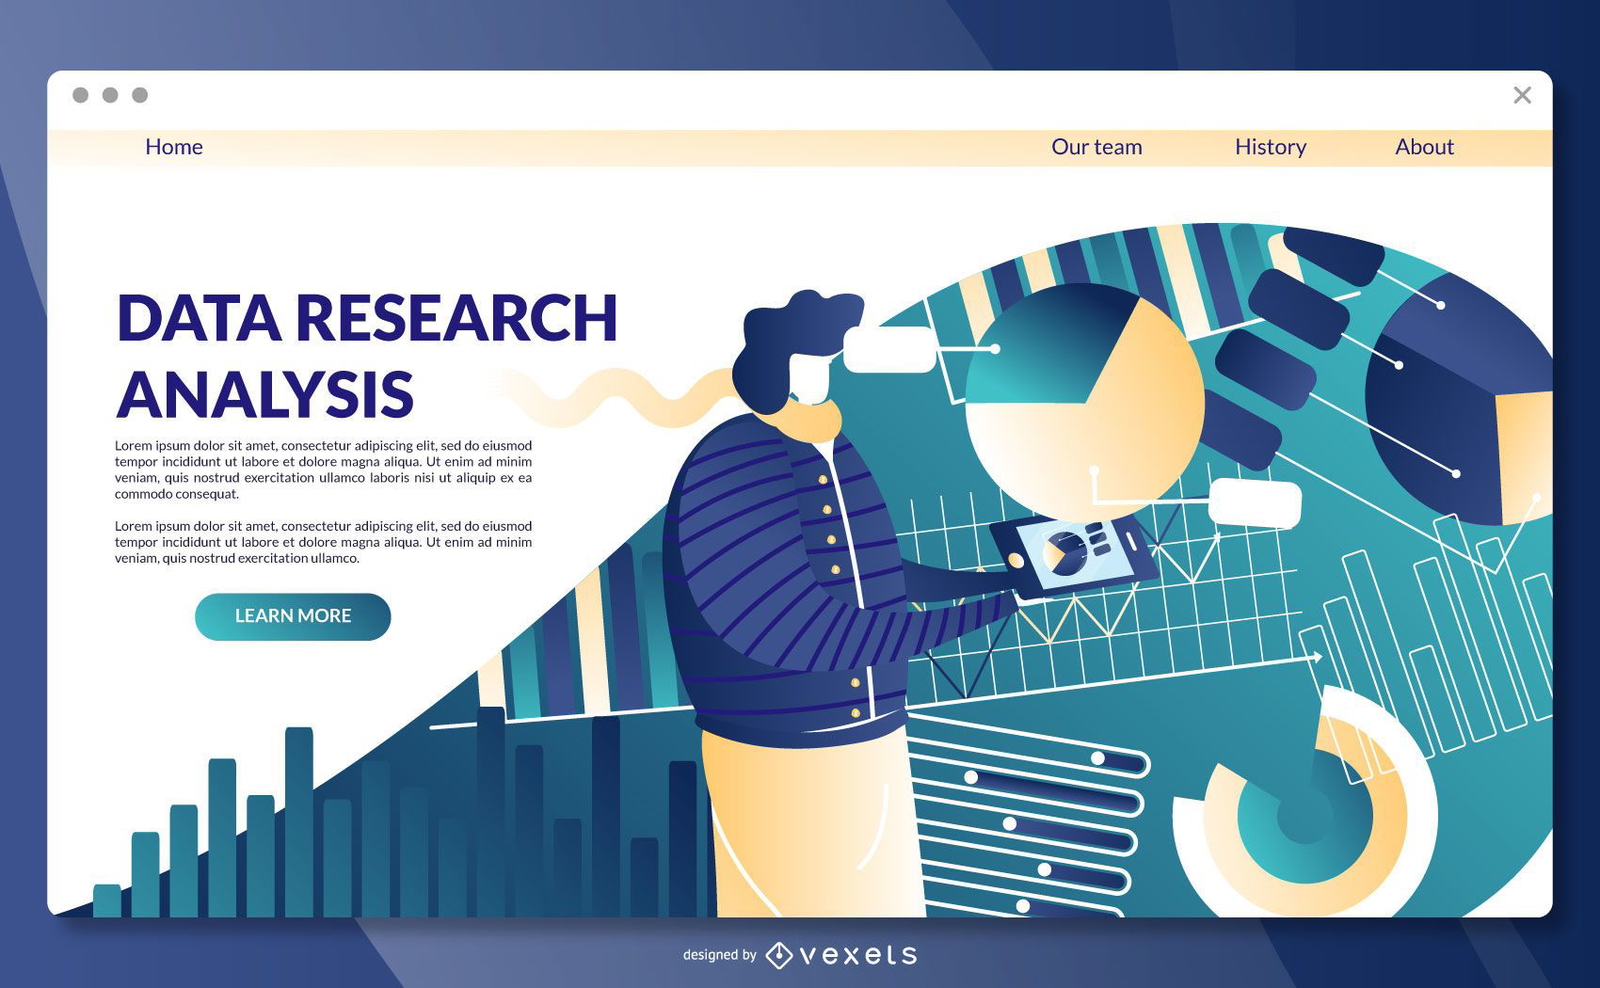
Editable text
Premium
Data research landing page template
Choose a folder
All favorites
Create new
Save
Data research landing page template
2d orange web 2.0 icons
Choose a folder
All favorites
Create new
Save
2d orange web 2.0 icons
Premium
Colorful Pharmacy Flat Icon Pack
Choose a folder
All favorites
Create new
Save
Colorful Pharmacy Flat Icon Pack
Premium
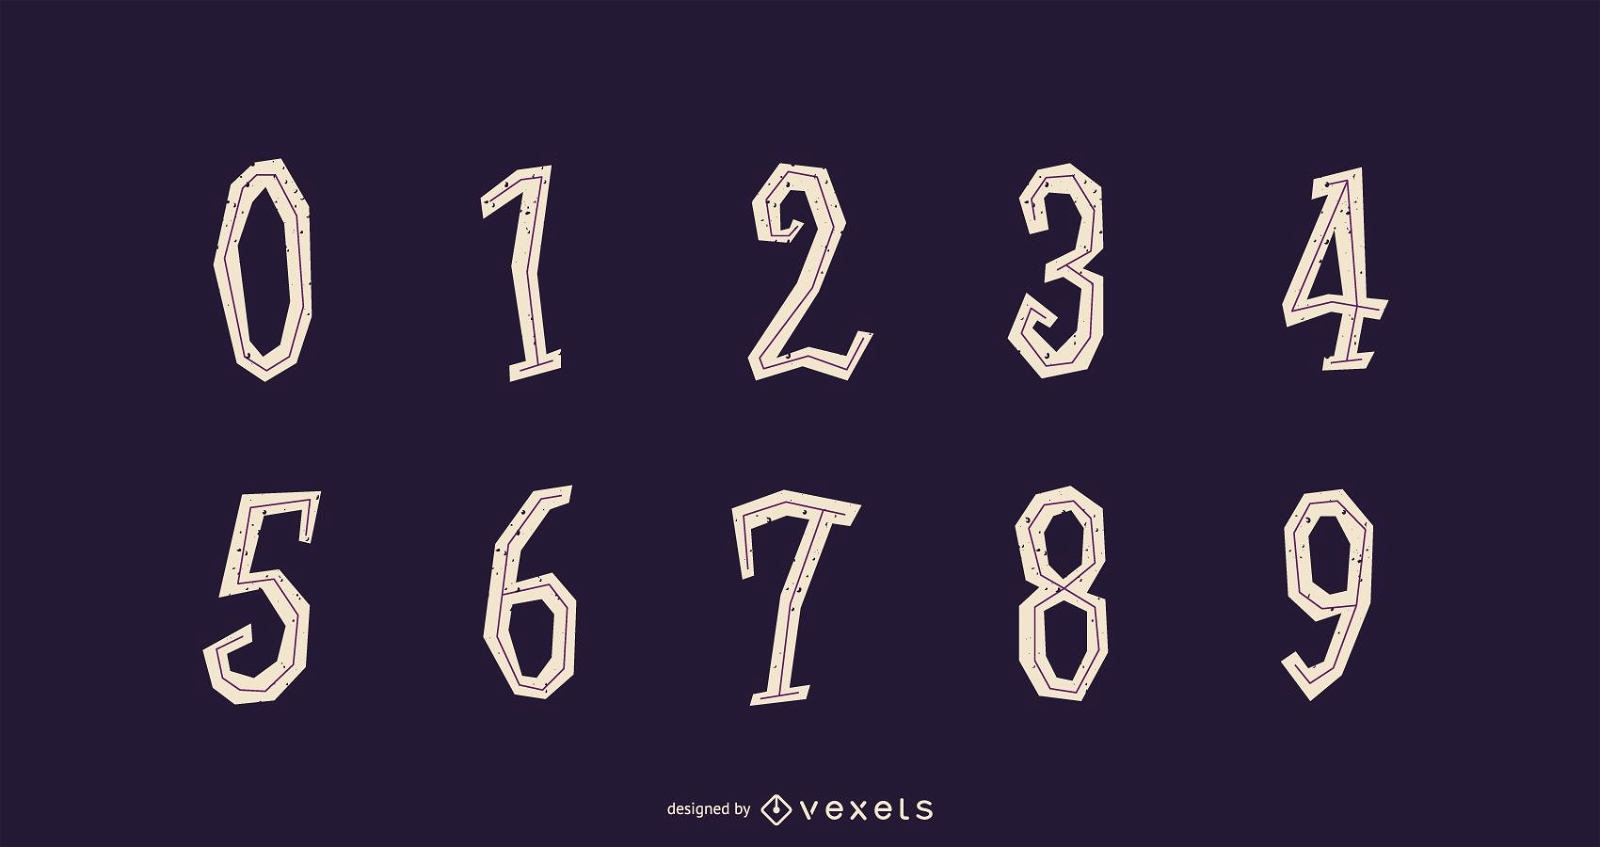
Halloween Number Set
Choose a folder
All favorites
Create new
Save
Halloween Number Set
Premium
Pharmacy Icons Monochrome Set
Choose a folder
All favorites
Create new
Save
Pharmacy Icons Monochrome Set
Vector Beautiful Eyes
Choose a folder
All favorites
Create new
Save
Vector Beautiful Eyes
Sound wave illustration silhouette
Choose a folder
All favorites
Create new
Save
Sound wave illustration silhouette
Daily Cosmetics 05 Vector
Choose a folder
All favorites
Create new
Save
Daily Cosmetics 05 Vector
4 Colors Abstract Waves Background Vector Set
Choose a folder
All favorites
Create new
Save
4 Colors Abstract Waves Background Vector Set
Subscribe
To Get High-Quality Commercial Use Designs For Your Business
SEE PLANS
Next
of 5
prev page
next page