Infographics allow content creators to share information in a concise but captivating manner. Are you creating informative content for your website? Are you crafting content that explains your products and services? With a high-quality infographic, your target audience will consume more information than they’d probably get from reading a page of text.
Your text content may be super-packed with the best bits of information, but will your target audience spend the time to read it all? Infographics solve this problem by condensing information and making it more visually appealing. The overall appeal of infographics is why they are three times more likely to be shared than other forms of content.
A recent survey stated that 50% of marketers said they would prefer to create more content. This trend in content marketing has been constant over the years. Coming up with cool infographics is something that will help you stand out from the crowd.
Infographics have become so successful in recent years because they are a perfect response to our decreasing attention span. As we become more immersed in the smartphone culture, there are lots of things demanding our attention. This is why content creators have to spend more time on developing ways to get information across quickly and concisely.
The best infographic designers know how to combine various techniques to create a final product that will retain the attention of readers in the distraction-filled webspace. The patterns, colors, graphics and visual hierarchy are all combined to deliver the best results.
Unfortunately, not all infographics achieve positive results. Many poorly designed infographics that only end up confusing the users exist. This article will help you to avoid creating subpar infographics and unlock the full potential of using this highly effective content delivery method.
Brainstorm

Before you settle for an infographic topic, spend time with all the relevant teams to discuss the ideas. The best ideas come from collaboration between your creative, marketing and business teams. Decide on the objective of the project. Are you looking to draw more traffic to your site? Do you want to drive sales? Do you want to inform your audience? Answering these questions will guide you towards topics that will resonate with your audience and deliver the results you need.
To help you generate ideas for your infographic, and create your first draft, here are some points you should keep in mind.
Put your target audience first
The content must be focused on your target audience, so think about them in every step of the way. Is the topic valuable? Will it have enough useful information? If you choose the right topic, you will attract your target audience as well as other website owners and influencers in your niche.
Keep it simple
Avoid broad or complicated concepts when designing an infographic. The topic needs to be catchy and engaging and adequately categorized. Don’t use industry jargon. Remember that the goal is to create an exciting piece that will be digested quickly.
Use a healthy dose of statistics

Although it is certainly possible to create quality infographics without statistics, the most shared ones come with lots of relevant statistics. Most niches have lots of quotable data that can be incorporated into any content. To get you started, here are some top sources for statistics:
Your brainstorming sessions should yield at least seven ideas you can flesh out. When you have completed the initial draft on all the ideas, you can choose the one that stands out the most. The fastest way to figure this out is to check online to see if someone else has created an infographic on the same topics you have.
If you have any topic that hasn’t been covered, that’s usually the best one to consider. If all your topics have been covered, look for new ways to improve existing ones with your new content or find a new set of ideas.
The Design

Even with the best of topics, a poor infographic design will undo all your hard work. To achieve the best results, here are some things you should keep in mind.
Choose your colors carefully
Colors are the foundation of any infographic design. The right selections will draw attention, but you can also use colors to deliver information more effectively. From highlighting negative statistics in red to using colorful pie or bar charts to show prevalent trends, there is no limit to how you can use color to improve your content.
Don’t forget to use a color theme that agrees with your topic. For example, pink/red themes work well for health-related content that concerns HIV/AIDS or cancer, while a green theme will work for topics about eco-friendliness.
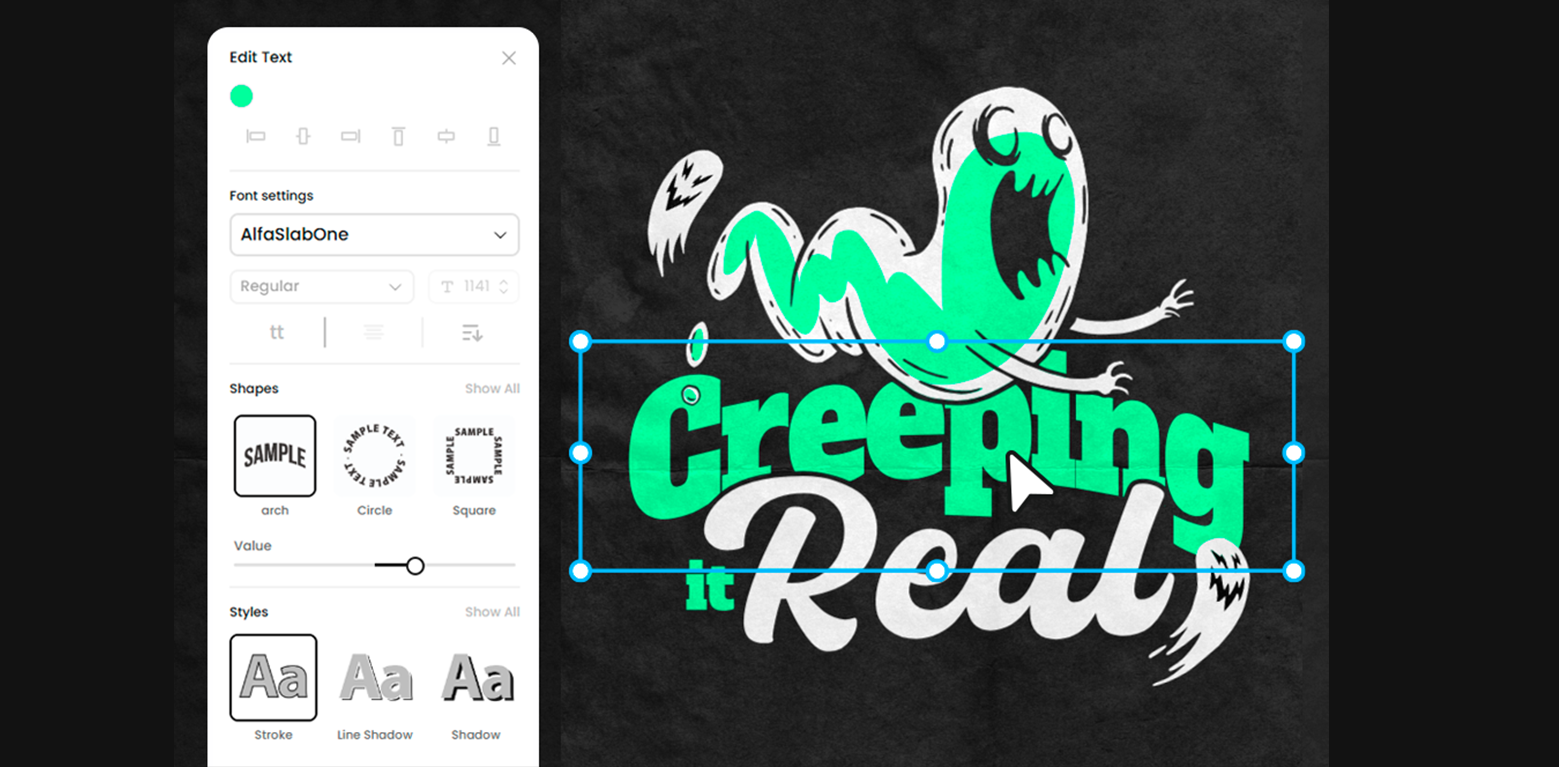
Pick the right fonts
Your choice of fonts determines your infographic’s readability. Choosing the wrong font option will make the page look cluttered and could be a strain on the eyes for your target audience. Spend as much time as you need at this stage to ensure you pick the font that agrees with the theme of the infographic.
Decide on the orientation and visual hierarchy
The orientation and the wireframe of your infographic is the next consideration in the design process. Most people are already used to vertically oriented infographics so before you try to reinvent the wheels, think it through.
The visual hierarchy is an outline based on the order of importance. Decide on your focal points and let the rest of the design complement them.
Choose the right size for your infographic based on how you intend to share
Although infographics are predominantly shared online, they can also be shared in print as a brochure or poster. Infographics shared online can also be formatted differently to reflect the platform. The right size for your website might not fit on Instagram or Facebook.
After you have settled on the right size, you can start adding graphics to the layout. You can create your graphics from scratch, but many people save time by importing vector graphics.
At the end of the design process, ensure the design is exported in the right way. For designs that will be printed professionally, export the design as a press-quality PDF. If you are sharing online, you should export your graphics in JPEG or PNG with a 72 dpi resolution.
If you are unsure of how to design your infographic, there are many tools online that can help. They include Piktochart, Canva, and Venngage. You can also hire a graphic designer after you have covered all the basics, including the wireframe. The first draft of the project will give you a glimpse into the completed project.
Regardless of whether you are choosing to design your infographic by yourself or hiring a graphic designer, ensure that it perfectly encapsulates your vision for the project and is a compliment for your brand. The infographic could be the first time many people come in contact with your brand.
If you stick to the guidelines above, you will create a compelling and shareable infographic that can attract and retain the attention of your target audience.
Promotion

When you have completed the design process, you’d like to put the infographic in front of as many people as possible. You need to spend time to make a list of where you can promote the final work.
Apart from your existing distribution channels, are there any others you can leverage? Are there influencers you can enlist to help amplify the content? Decide on your promotion channels as the design of your infographic is in progress so you can start achieving results from the first day of publishing.
For online marketers, infographics are a powerful means of acquiring high-quality backlinks. Many websites have no problem republishing a user-friendly infographic loaded with well-researched data even without your asking.
To further increase the number of places where your infographic is published, you can engage in a mini-outreach. As is the case with typical link-building or guest-posting outreaches, the first step here is to collate prospects. These are sites that have accepted infographics in your niche before. To find these types of sites, do a quick Google search for infographics similar to yours and take note of the sites.
Alternatively, you can do a reverse image search for a specific infographic to find all the sites that have published it. Reach out to these sites and see if they will post yours. Ensure your outreach emails adhere to best practices. Be polite, and avoid sending more than two emails with the same request to a website. If they haven’t responded after the first two, they likely won’t respond ever.
Don’t forget to apply all the standard link-building strategies. These include confirming the domain authority of the website, the overall niche relevance and the general quality of the brand. Is the website one you’d like to be associated with your brand?
If the sites you pick have little or no authority, they will have sparse traffic. This defeats the purpose of republishing your infographic. Worse, it can lead to Google penalties for your website.
Infographic directories can also publish your infographics for a small fee or free of charge. Many websites pick content to republish from there.
Conclusion
Infographics are an excellent way of presenting complicated or dull content in a fun and engaging way. Regardless of your niche, you will find a use for infographics. With this guide, you can create high-converting designs from scratch. Remember, sophisticated or popular infographics do not have to spend a great deal of money to design.
You can create from scratch, but some of the best designs you have seen were created using existing elements. Spend as much time as possible in the ideation stage. If the content resonates with your target audience, half the job is done.
Author’s bio: Vipin Nayar is the Co-founder of Aviv Digital. He’s a Social Media, SEO & SEM expert with over nine years’ experience in Digital marketing. He keeps himself updated about all the latest trends in the world of Digital Marketing and shares his knowledge with us through his blogs and articles.


