Design Library
New Merch Designs
T-Shirts
Vectors
Trending Merch Designs
PNGs & SVGs
Mockups
T-Shirt PSD Templates
Explore Designs
KDP Designs
Posters
Mugs
Phone Cases
Tote Bags
Pillows
Design Tools
Merch Designer
New!
Mockup Generator
AI Design Generator
Image Vectorizer
Quote Generator
T-Shirt Maker (Old)
Resources
Merch Digest
Blog
Help Center
Learn About Merch
Feedback
Corporate Solutions
Enterprise
API Access
Design Studio
Bulk Design Production
Pricing
Loading...
Sign Up
Login
PNG
chart
Design Library
New Merch Designs
T-Shirts
Vectors
Trending Merch Designs
PNGs & SVGs
Mockups
T-Shirt PSD Templates
Explore Designs
KDP Designs
Posters
Mugs
Phone Cases
Tote Bags
Pillows
Design Tools
Merch Designer
New!
Mockup Generator
AI Design Generator
Image Vectorizer
Quote Generator
T-Shirt Maker (Old)
Resources
Merch Digest
Blog
Help Center
Learn About Merch
Feedback
Corporate Solutions
Enterprise
API Access
Design Studio
Bulk Design Production
PLANS
PNG
chart
512 chart PNG and SVG Editable Vectors
Download editable chart PNG and SVG Vectors with transparent background.
Related:
charts
,
pie chart
,
pie charts
Sort by
Most relevant
Sponsored results by
Get 15% off with code: VEXELS15
Show more
×
We didn't find any
chart
PNG, but here's all our
chart
designs or
request design here
Growing graph icon PNG Design
Choose a folder
All favorites
Create new
Save
Growing graph icon PNG Design
Growing graph icon stroke pink PNG Design
Choose a folder
All favorites
Create new
Save
Growing graph icon stroke pink PNG Design
Premium
Graph square icon PNG Design
Choose a folder
All favorites
Create new
Save
Graph square icon PNG Design
Premium
Half blue multicolor piechart PNG Design
Choose a folder
All favorites
Create new
Save
Half blue multicolor piechart PNG Design
Premium
Taurus sign in the western horoscope PNG Design
Choose a folder
All favorites
Create new
Save
Taurus sign in the western horoscope PNG Design
Graph flat icon PNG Design
Choose a folder
All favorites
Create new
Save
Graph flat icon PNG Design
Premium
The eastern sign of rooster PNG Design
Choose a folder
All favorites
Create new
Save
The eastern sign of rooster PNG Design
Premium
The eastern sign of rat PNG Design
Choose a folder
All favorites
Create new
Save
The eastern sign of rat PNG Design
Premium
The eastern zodiac sign of snake PNG Design
Choose a folder
All favorites
Create new
Save
The eastern zodiac sign of snake PNG Design
Premium
The eastern zodiac sign of rabbit PNG Design
Choose a folder
All favorites
Create new
Save
The eastern zodiac sign of rabbit PNG Design
Graph curve doodle PNG Design
Choose a folder
All favorites
Create new
Save
Graph curve doodle PNG Design
Premium
The eastern zodiac sign of pig PNG Design
Choose a folder
All favorites
Create new
Save
The eastern zodiac sign of pig PNG Design
Premium
The eastern zodiac sign of dragon PNG Design
Choose a folder
All favorites
Create new
Save
The eastern zodiac sign of dragon PNG Design
Premium
Growing graph screen stroke icon PNG Design
Choose a folder
All favorites
Create new
Save
Growing graph screen stroke icon PNG Design
Premium
The eastern sign of monkey PNG Design
Choose a folder
All favorites
Create new
Save
The eastern sign of monkey PNG Design
Premium
The eastern sign of snake PNG Design
Choose a folder
All favorites
Create new
Save
The eastern sign of snake PNG Design
Premium
The eastern sign of rabbit PNG Design
Choose a folder
All favorites
Create new
Save
The eastern sign of rabbit PNG Design
Premium
The eastern zodiac sign of dog PNG Design
Choose a folder
All favorites
Create new
Save
The eastern zodiac sign of dog PNG Design
Premium
The eastern zodiac sign of monkey PNG Design
Choose a folder
All favorites
Create new
Save
The eastern zodiac sign of monkey PNG Design
Premium
The eastern zodiac sign of horse PNG Design
Choose a folder
All favorites
Create new
Save
The eastern zodiac sign of horse PNG Design
Premium
The eastern zodiac sign of goat PNG Design
Choose a folder
All favorites
Create new
Save
The eastern zodiac sign of goat PNG Design
Premium
The eastern zodiac sign of tiger PNG Design
Choose a folder
All favorites
Create new
Save
The eastern zodiac sign of tiger PNG Design
Premium
The eastern zodiac sign of rat PNG Design
Choose a folder
All favorites
Create new
Save
The eastern zodiac sign of rat PNG Design
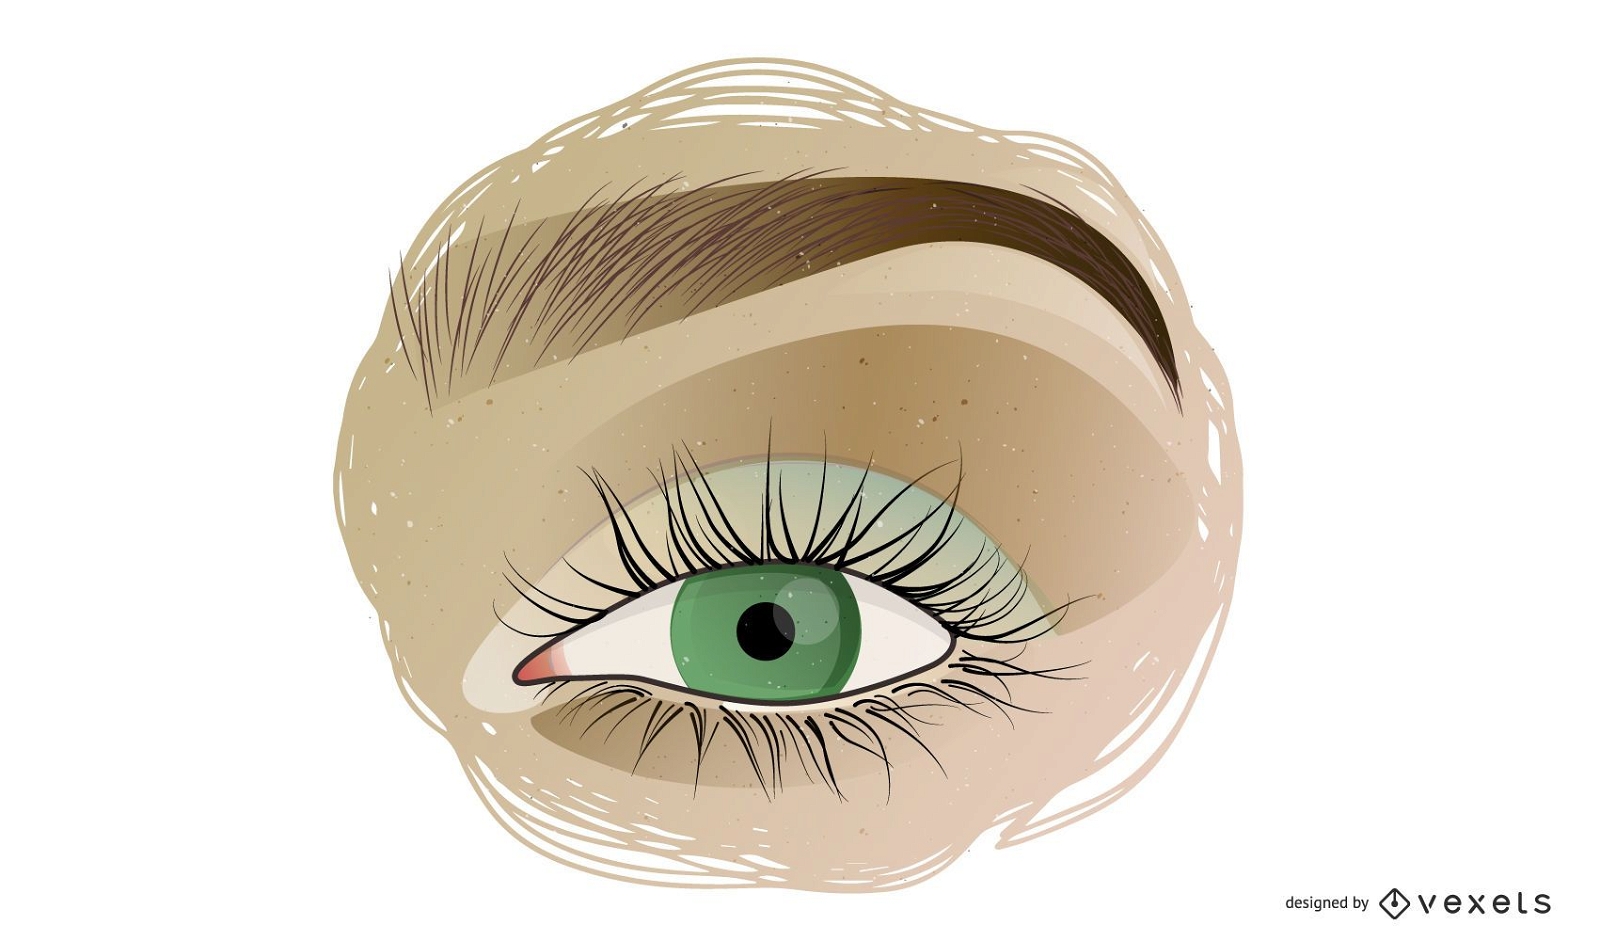
Vector Beautiful Eyes
Choose a folder
All favorites
Create new
Save
Vector Beautiful Eyes
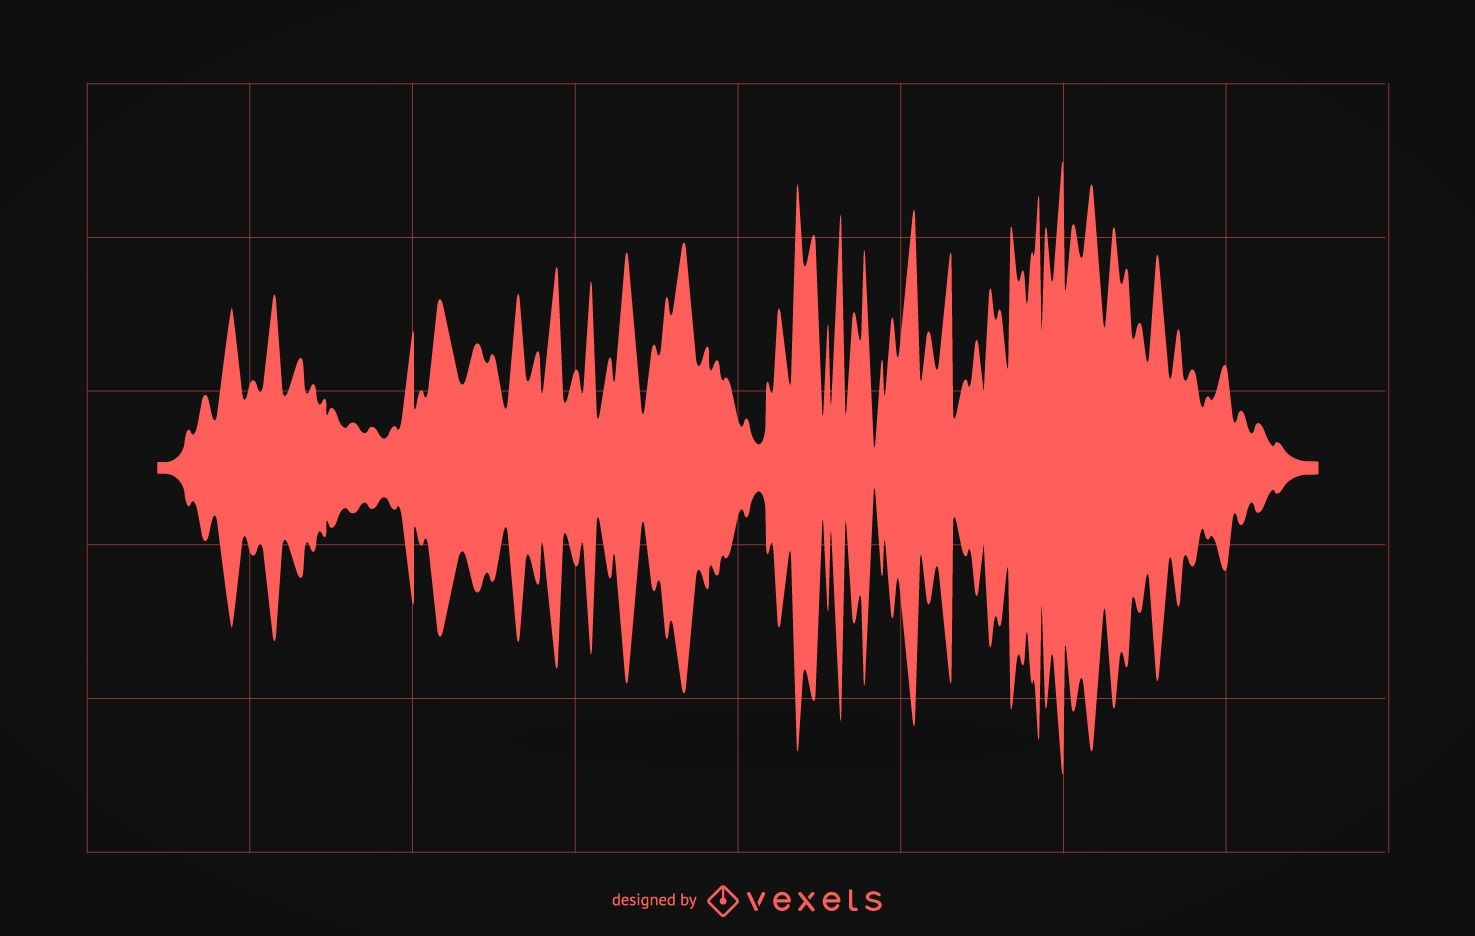
Sound wave illustration silhouette
Choose a folder
All favorites
Create new
Save
Sound wave illustration silhouette
Daily Cosmetics 05 Vector
Choose a folder
All favorites
Create new
Save
Daily Cosmetics 05 Vector
4 Colors Abstract Waves Background Vector Set
Choose a folder
All favorites
Create new
Save
4 Colors Abstract Waves Background Vector Set
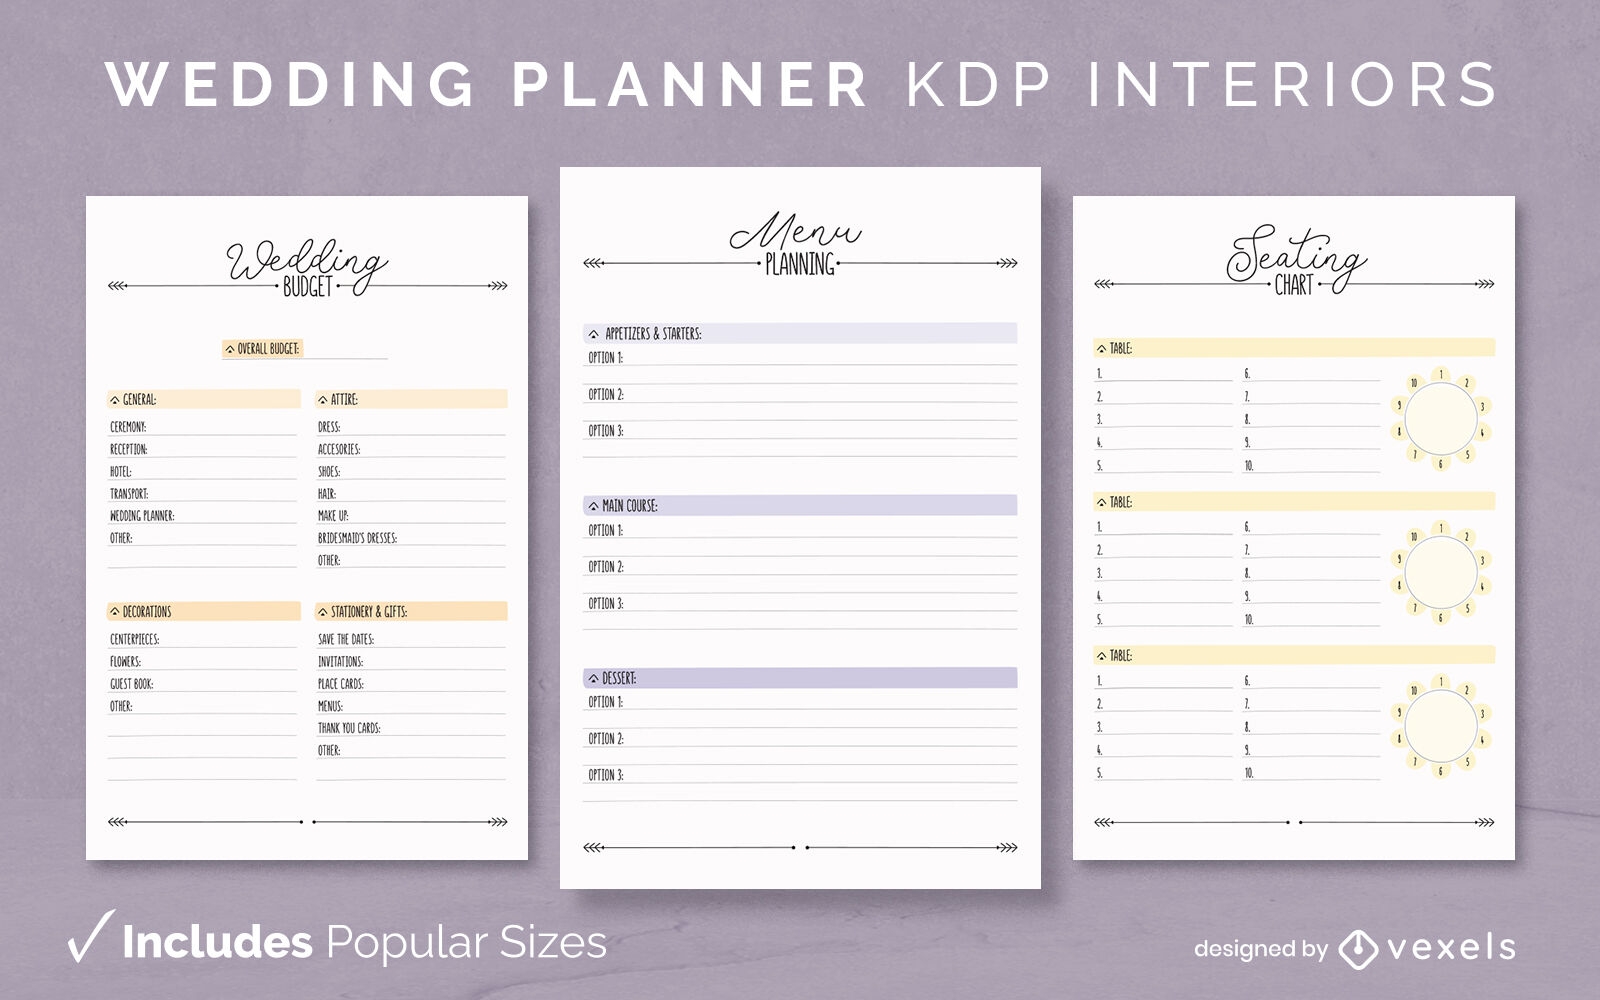
Editable text
Print ready
Premium
Wedding planner template KDP interior design
Choose a folder
All favorites
Create new
Save
Wedding planner template KDP interior design
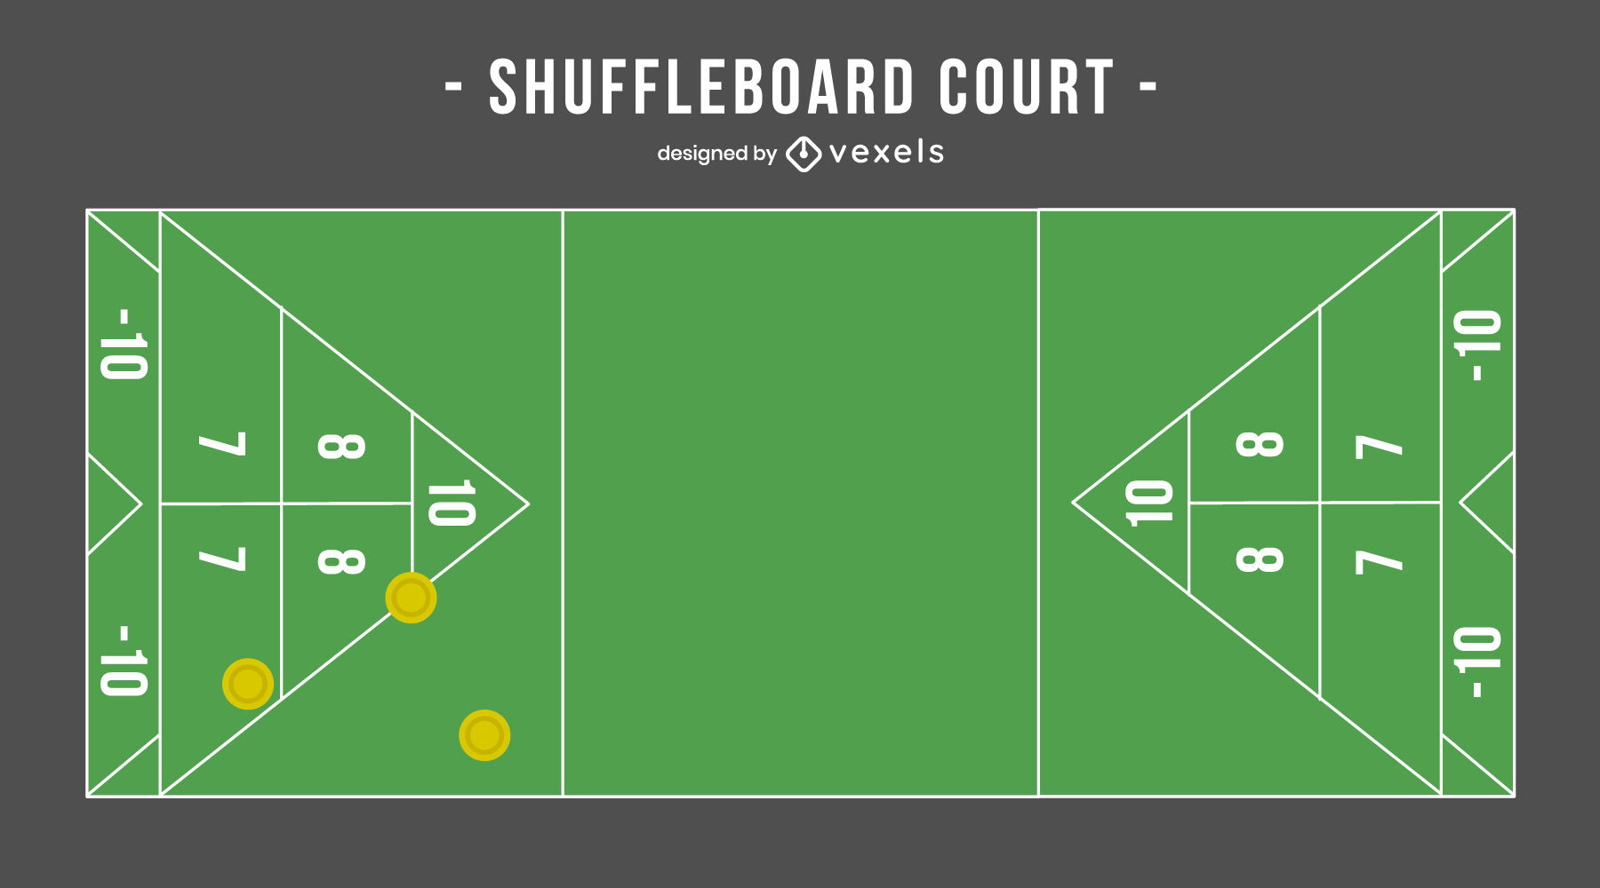
Premium
Shuffleboard Court Illustration Design
Choose a folder
All favorites
Create new
Save
Shuffleboard Court Illustration Design
Business Icons in 3D and in badge form
Choose a folder
All favorites
Create new
Save
Business Icons in 3D and in badge form
Editable text
Print ready
Premium
Simple floral wedding journal design template KDP
Choose a folder
All favorites
Create new
Save
Simple floral wedding journal design template KDP
Audio waves illustration
Choose a folder
All favorites
Create new
Save
Audio waves illustration
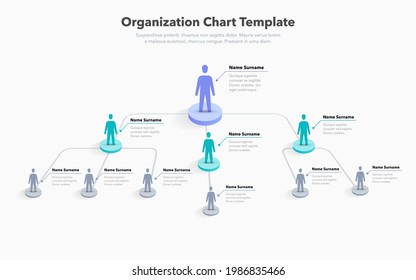
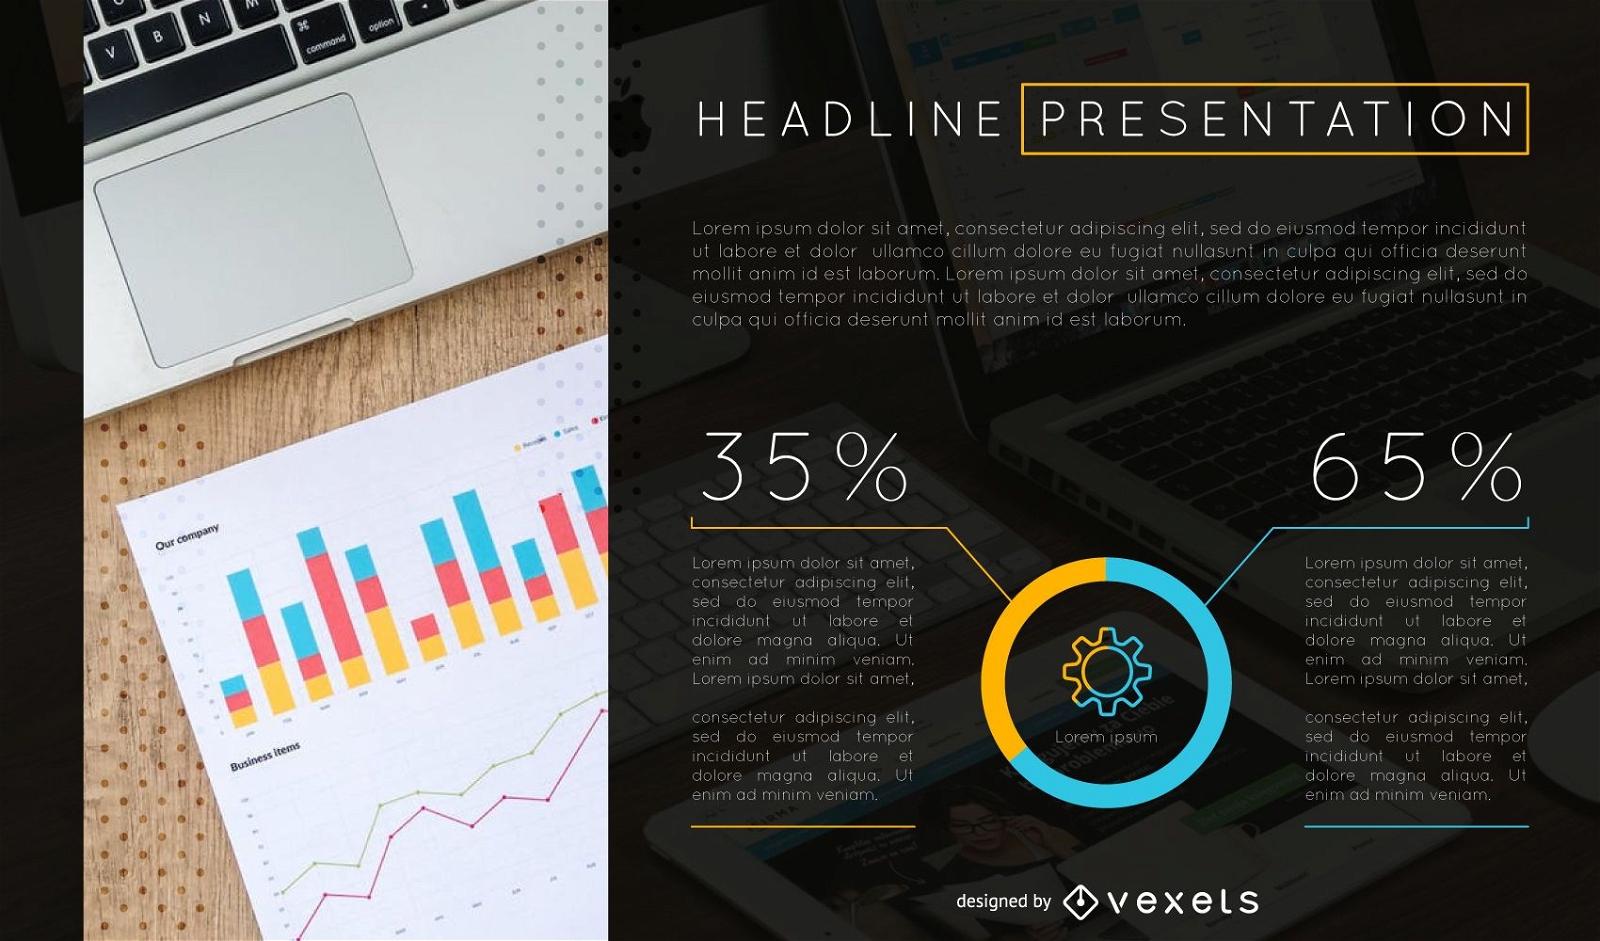
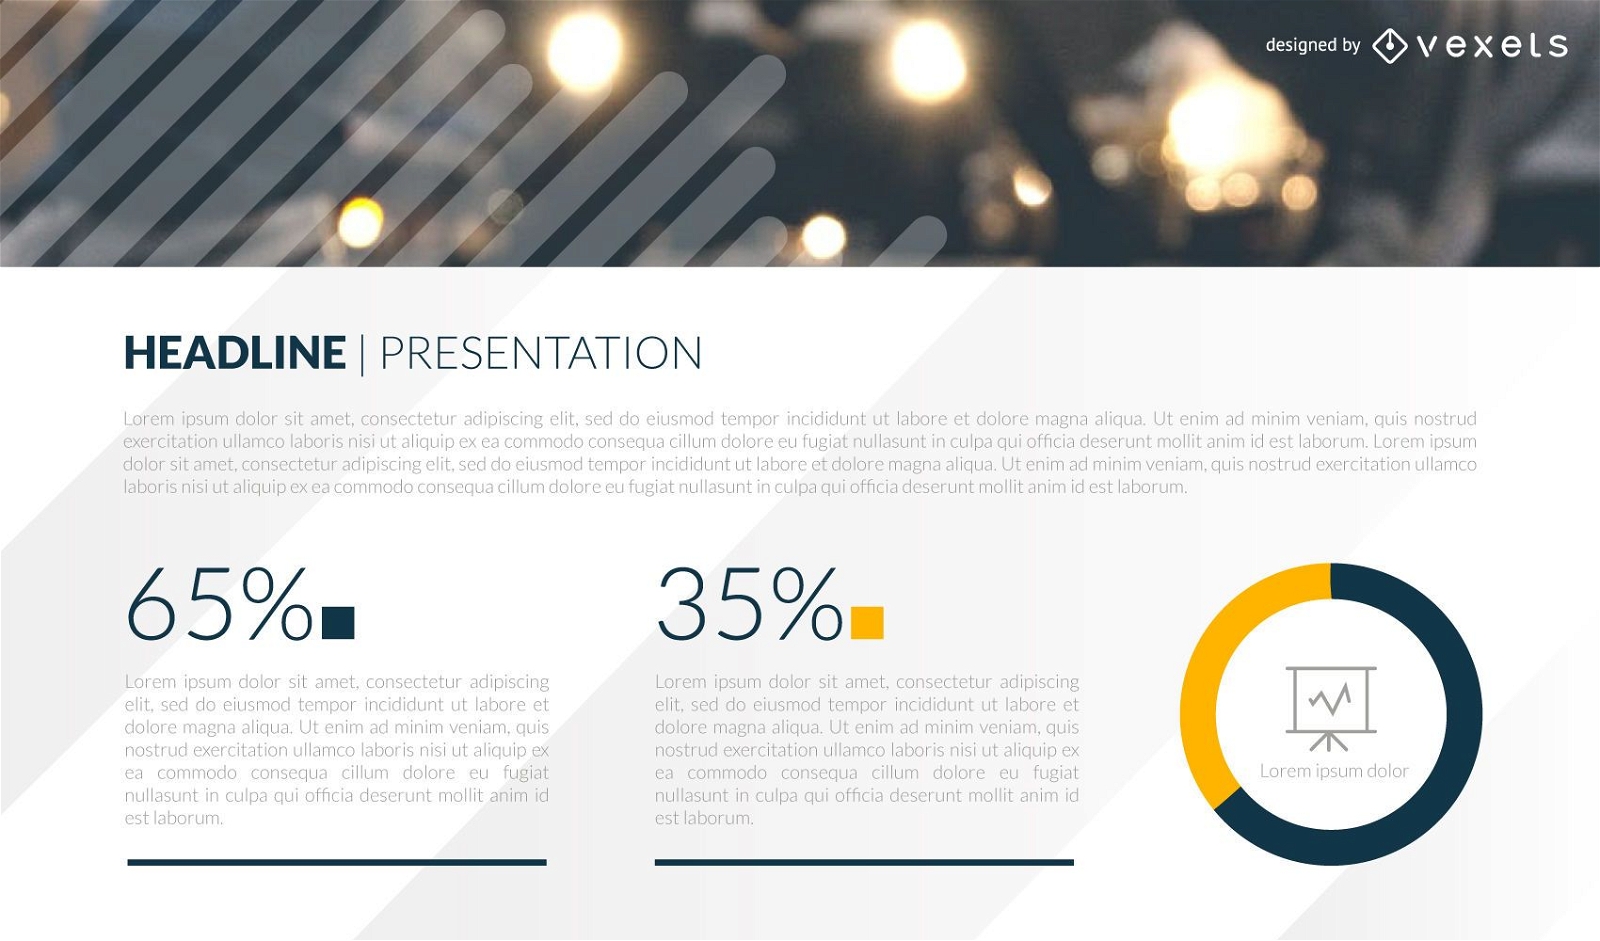
Analyses presentation slide template
Choose a folder
All favorites
Create new
Save
Analyses presentation slide template
Kindle Direct
Editable text
Premium
Medication logbook KDP interior pages design
Choose a folder
All favorites
Create new
Save
Medication logbook KDP interior pages design
Businessman jumping success
Choose a folder
All favorites
Create new
Save
Businessman jumping success
Successful businesswoman illustration
Choose a folder
All favorites
Create new
Save
Successful businesswoman illustration
Chat CRM Contact Icon Pack
Choose a folder
All favorites
Create new
Save
Chat CRM Contact Icon Pack
Editable text
Print ready
Premium
Wedding planner Diary Design Template KDP
Choose a folder
All favorites
Create new
Save
Wedding planner Diary Design Template KDP
Audio wave silhouette
Choose a folder
All favorites
Create new
Save
Audio wave silhouette
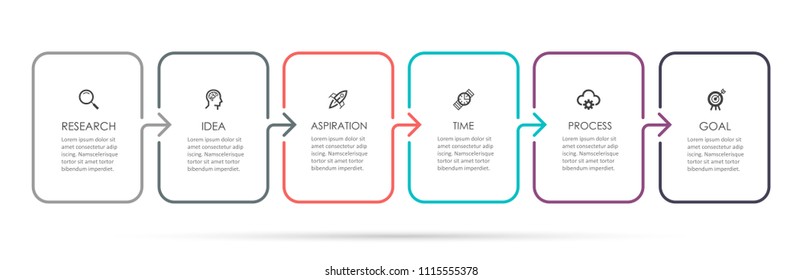
Elegant Infographic & Project Timeline Set
Choose a folder
All favorites
Create new
Save
Elegant Infographic & Project Timeline Set
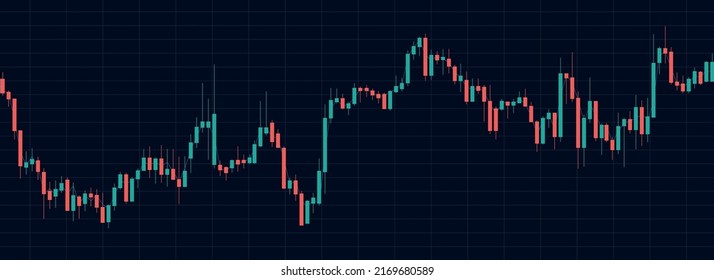
Statistics presentation slide template
Choose a folder
All favorites
Create new
Save
Statistics presentation slide template
Print ready
for Merch
Baby teeth chart t-shirt design
Choose a folder
All favorites
Create new
Save
Baby teeth chart t-shirt design
Print ready
for Merch
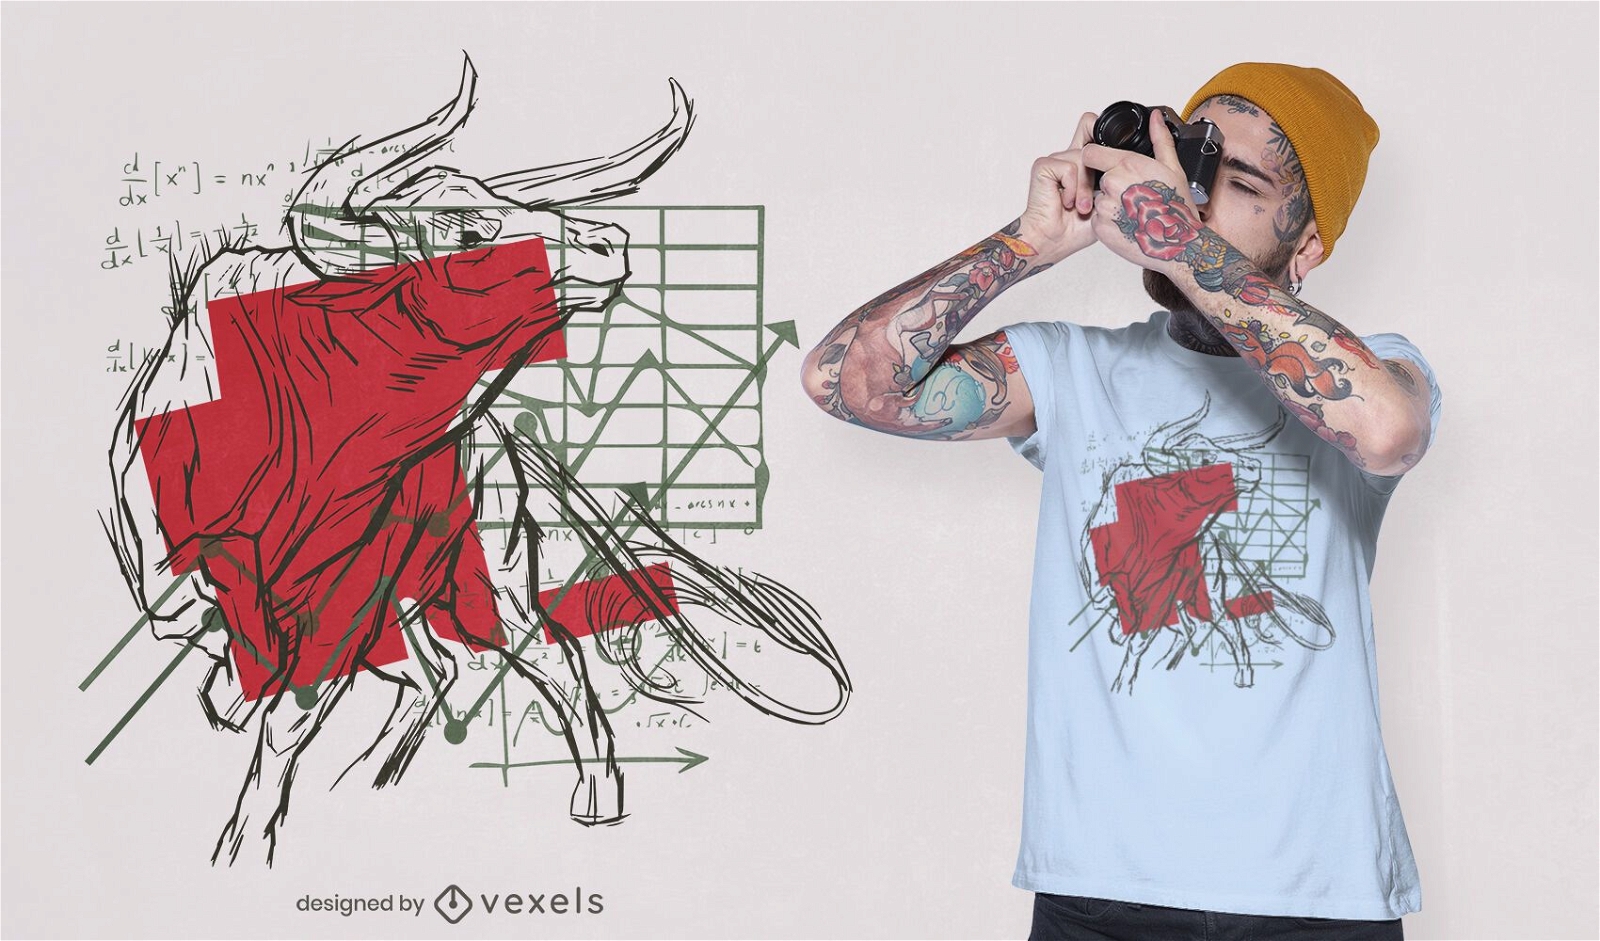
Bull charts t-shirt design
Choose a folder
All favorites
Create new
Save
Bull charts t-shirt design
Editable text
Print ready
for Merch
Trading chart finances job t-shirt design
Choose a folder
All favorites
Create new
Save
Trading chart finances job t-shirt design
Print ready
for Merch
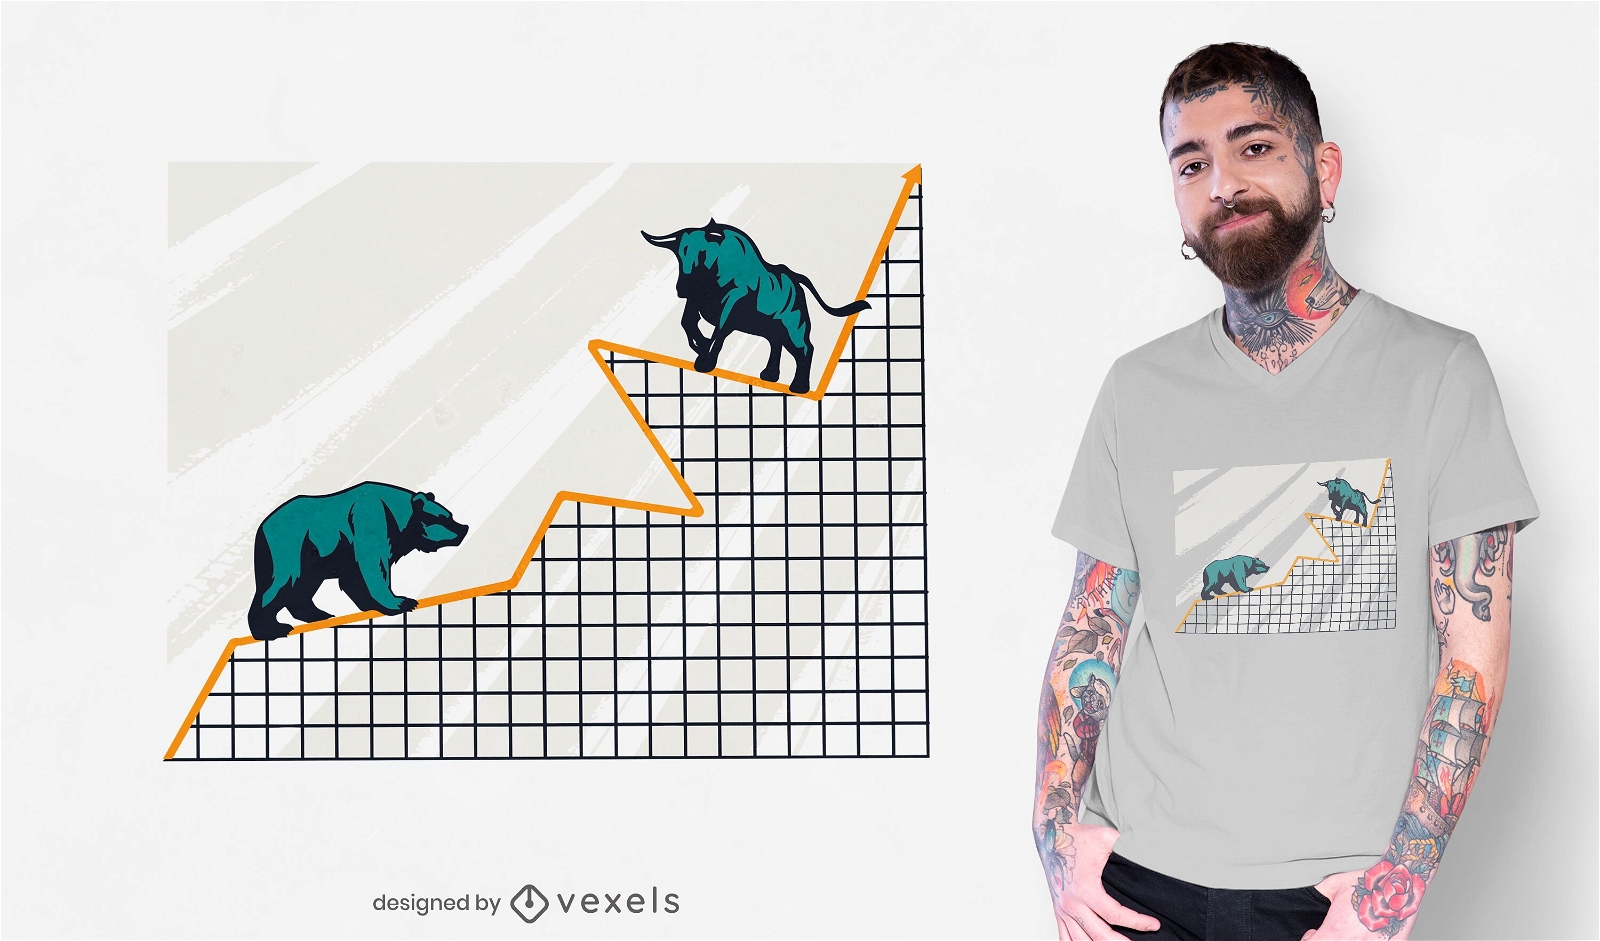
Bull chart t-shirt design
Choose a folder
All favorites
Create new
Save
Bull chart t-shirt design
Print ready
for Merch
Stock market chart t-shirt design
Choose a folder
All favorites
Create new
Save
Stock market chart t-shirt design
Print ready
for Merch
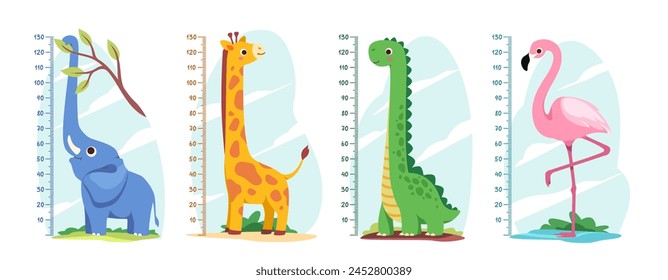
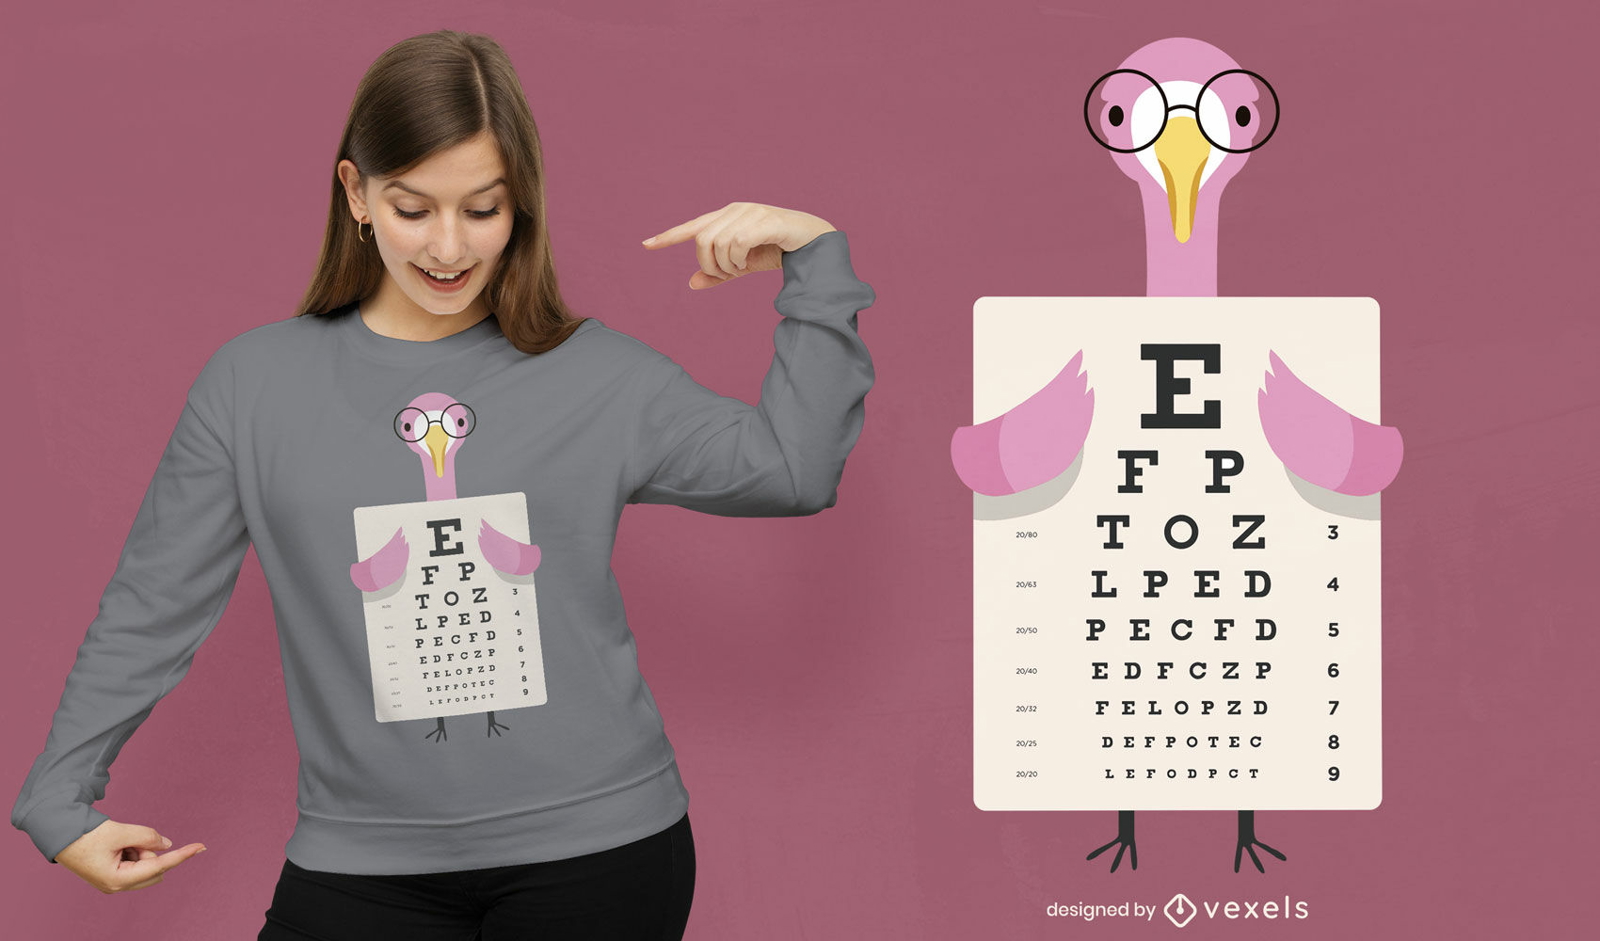
Flamingo eye chart t-shirt design
Choose a folder
All favorites
Create new
Save
Flamingo eye chart t-shirt design
Print ready
for Merch
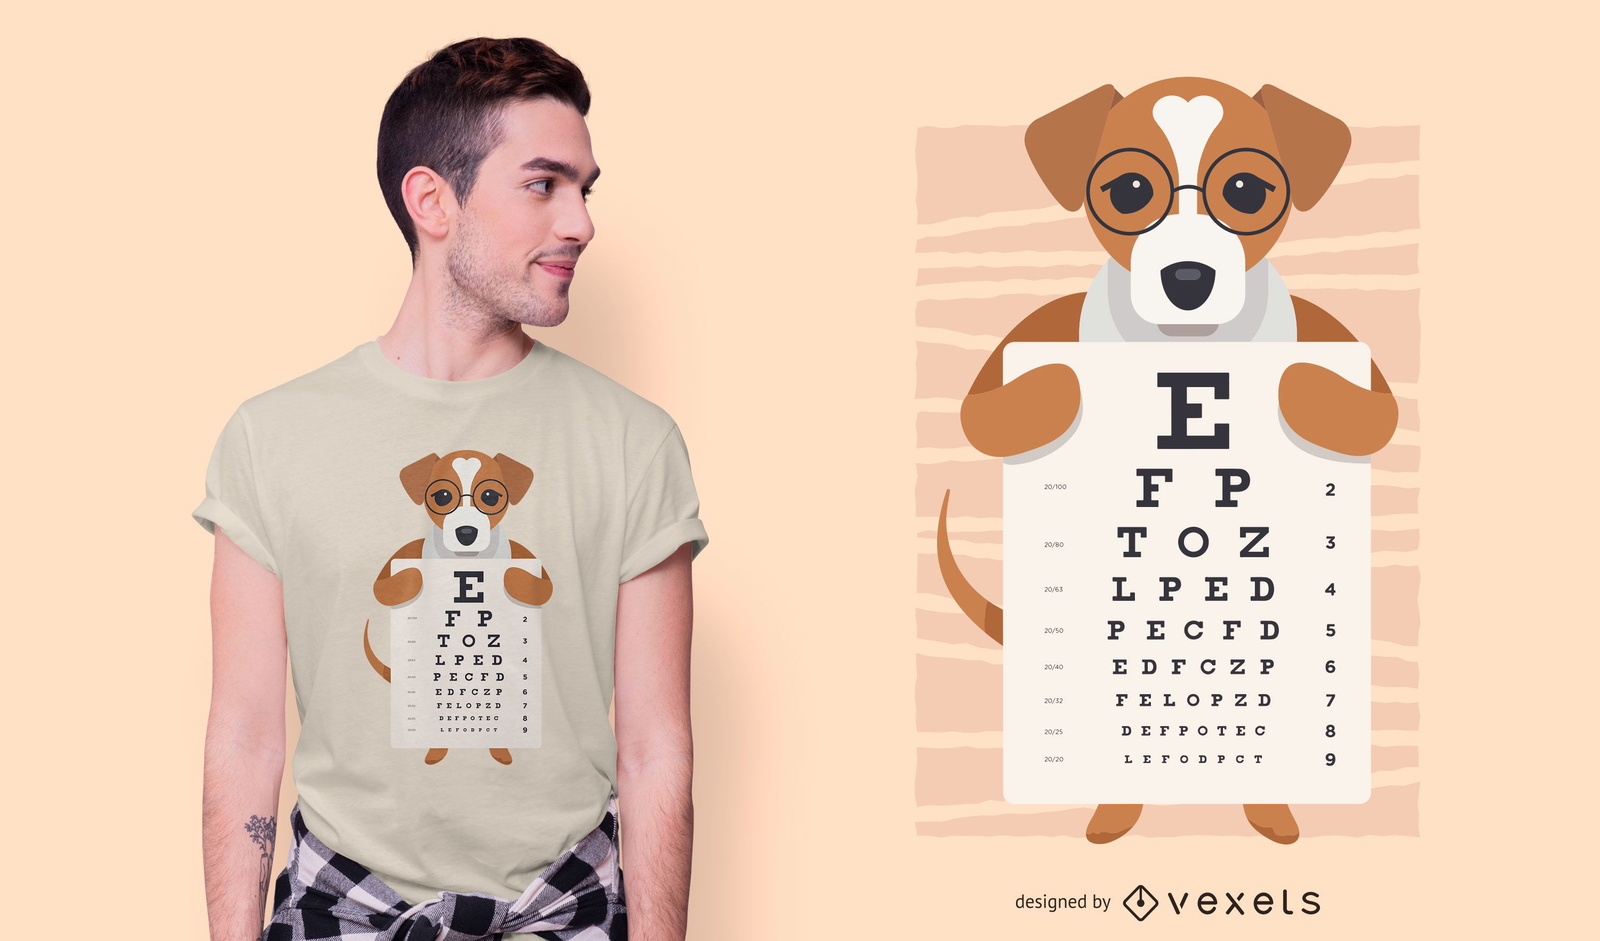
Dog Eye Chart T-shirt Design
Choose a folder
All favorites
Create new
Save
Dog Eye Chart T-shirt Design
Editable text
Print ready
for Merch
Crypto chart life t-shirt design
Choose a folder
All favorites
Create new
Save
Crypto chart life t-shirt design
Print ready
for Merch
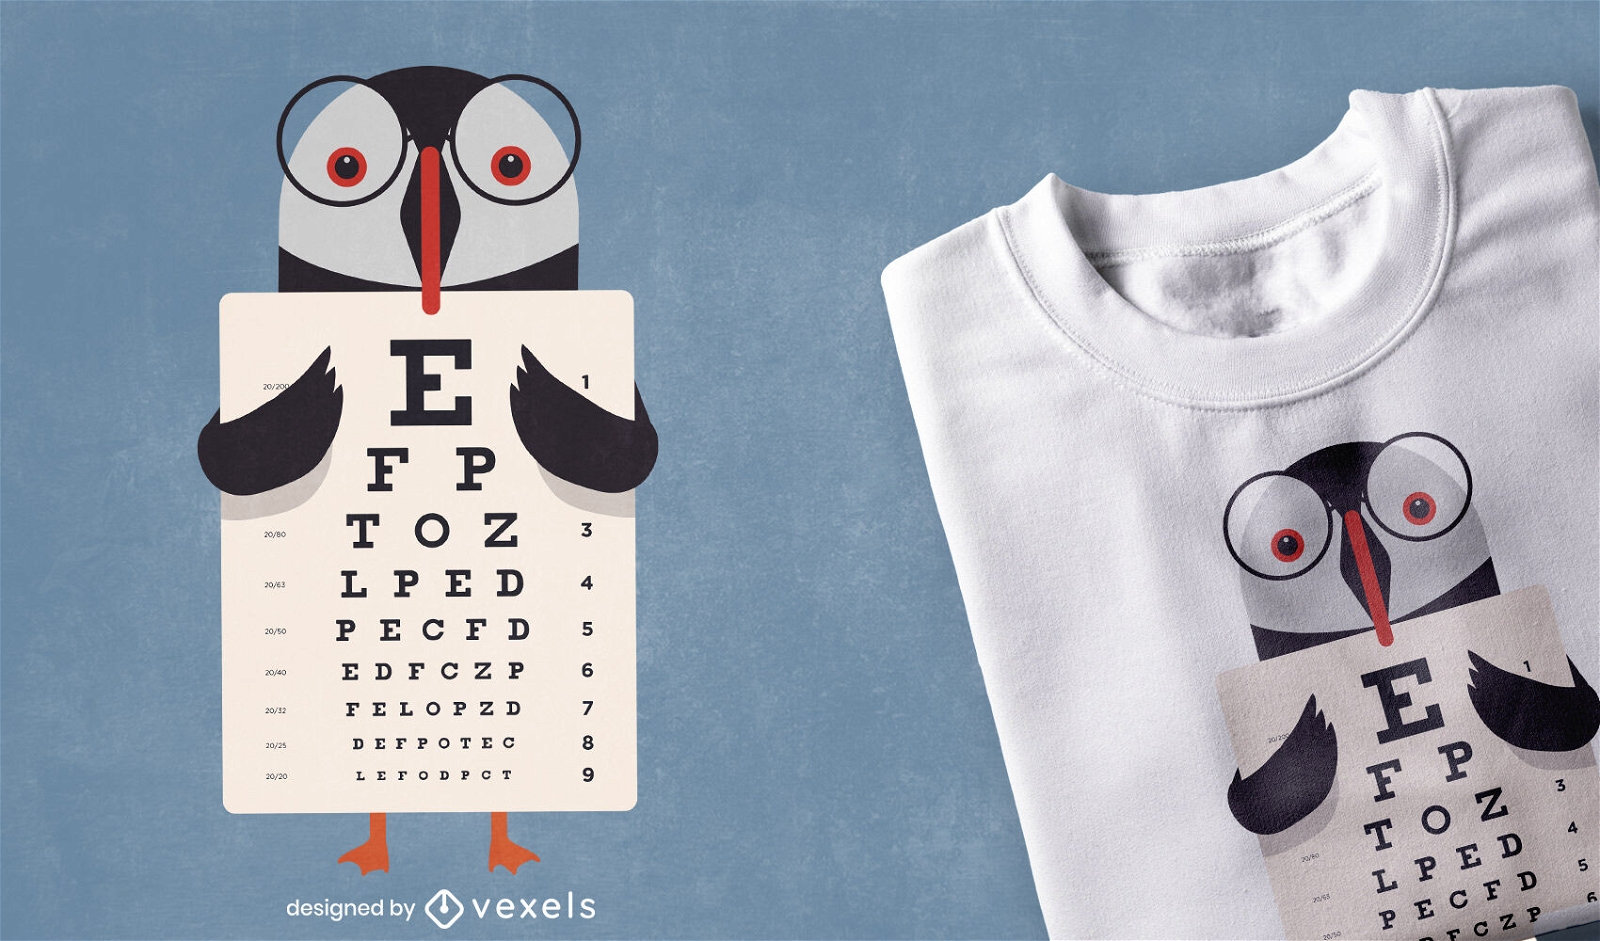
Penguin animal with eye chart t-shirt design
Choose a folder
All favorites
Create new
Save
Penguin animal with eye chart t-shirt design
Subscribe
To Get High-Quality Commercial Use Designs For Your Business
SEE PLANS
Next
of 11
prev page
next page