Design Library
New Merch Designs
T-Shirts
Vectors
Trending Merch Designs
PNGs & SVGs
Mockups
T-Shirt PSD Templates
Explore Designs
KDP Designs
Posters
Mugs
Phone Cases
Tote Bags
Pillows
Design Tools
Merch Designer
New!
Mockup Generator
AI Design Generator
Image Vectorizer
Quote Generator
T-Shirt Maker (Old)
Resources
Merch Digest
Blog
Help Center
Learn About Merch
Feedback
Corporate Solutions
Enterprise
API Access
Design Studio
Bulk Design Production
Pricing
Loading...
Sign Up
Login
PNG
chart
Design Library
New Merch Designs
T-Shirts
Vectors
Trending Merch Designs
PNGs & SVGs
Mockups
T-Shirt PSD Templates
Explore Designs
KDP Designs
Posters
Mugs
Phone Cases
Tote Bags
Pillows
Design Tools
Merch Designer
New!
Mockup Generator
AI Design Generator
Image Vectorizer
Quote Generator
T-Shirt Maker (Old)
Resources
Merch Digest
Blog
Help Center
Learn About Merch
Feedback
Corporate Solutions
Enterprise
API Access
Design Studio
Bulk Design Production
PLANS
PNG
chart
512 chart PNG and SVG Editable Vectors
Download editable chart PNG and SVG Vectors with transparent background.
Related:
charts
,
pie chart
,
pie charts
Sort by
Most relevant
Sponsored results by
Get 15% off with code: VEXELS15
Show more
×
We didn't find any
chart
PNG, but here's all our
chart
designs or
request design here
Premium
Line graph PNG Design
Choose a folder
All favorites
Create new
Save
Line graph PNG Design
Businessman standing growing graph icon PNG Design
Choose a folder
All favorites
Create new
Save
Businessman standing growing graph icon PNG Design
Premium
Half grey colorful piechart PNG Design
Choose a folder
All favorites
Create new
Save
Half grey colorful piechart PNG Design
Premium
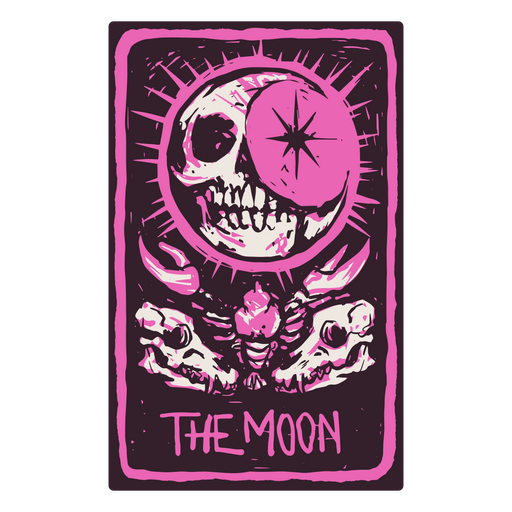
The Moon card in a skeleton-themed tarot PNG Design
Choose a folder
All favorites
Create new
Save
The Moon card in a skeleton-themed tarot PNG Design
Businessman in front pie icon PNG Design
Choose a folder
All favorites
Create new
Save
Businessman in front pie icon PNG Design
Premium
Glossy piechart with boxes PNG Design
Choose a folder
All favorites
Create new
Save
Glossy piechart with boxes PNG Design
Premium
Libra sign in the horoscope PNG Design
Choose a folder
All favorites
Create new
Save
Libra sign in the horoscope PNG Design
Premium
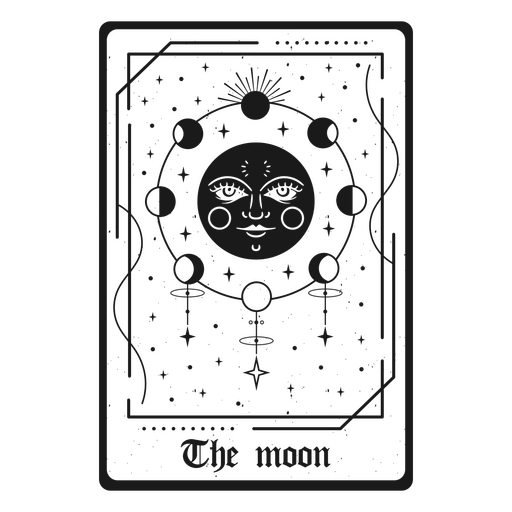
Moon tarot image PNG Design
Choose a folder
All favorites
Create new
Save
Moon tarot image PNG Design
Premium
Halloween Witch Letter Set
Choose a folder
All favorites
Create new
Save
Halloween Witch Letter Set
Colorful Glowing Background
Choose a folder
All favorites
Create new
Save
Colorful Glowing Background
Premium
Virgo sign in the horoscope PNG Design
Choose a folder
All favorites
Create new
Save
Virgo sign in the horoscope PNG Design
Premium
Cancer sign in the horoscope PNG Design
Choose a folder
All favorites
Create new
Save
Cancer sign in the horoscope PNG Design
Premium
Moon sorceress design PNG Design
Choose a folder
All favorites
Create new
Save
Moon sorceress design PNG Design
Premium
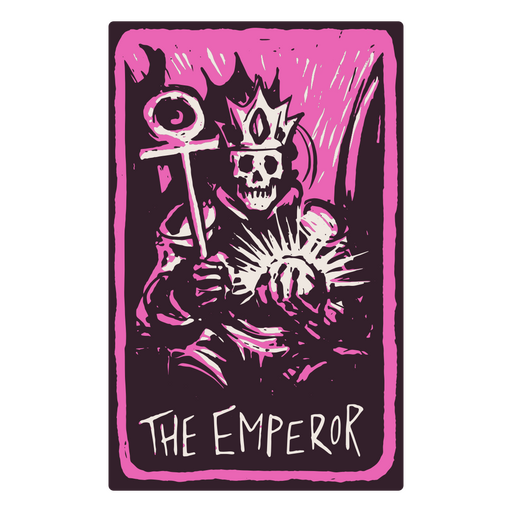
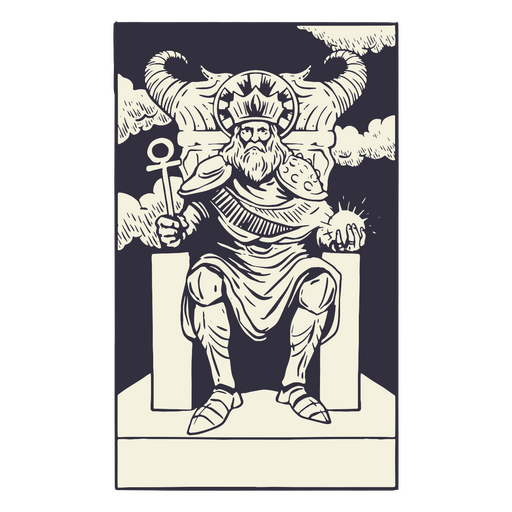
The Emperor card in a skeleton-themed tarot PNG Design
Choose a folder
All favorites
Create new
Save
The Emperor card in a skeleton-themed tarot PNG Design
Premium
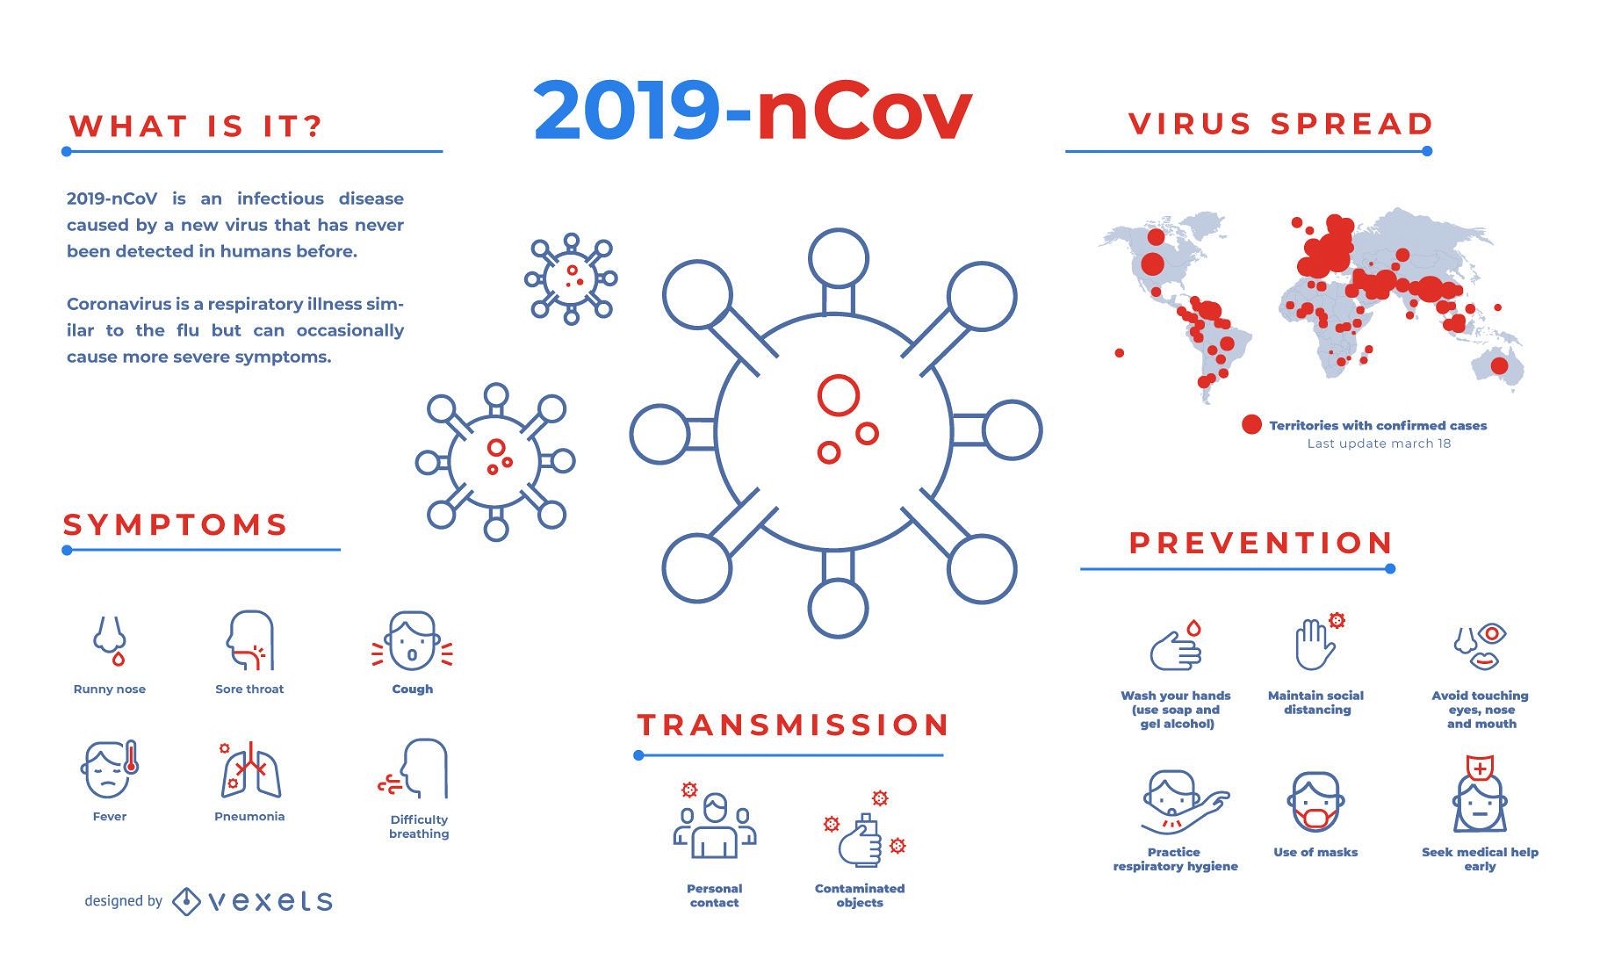
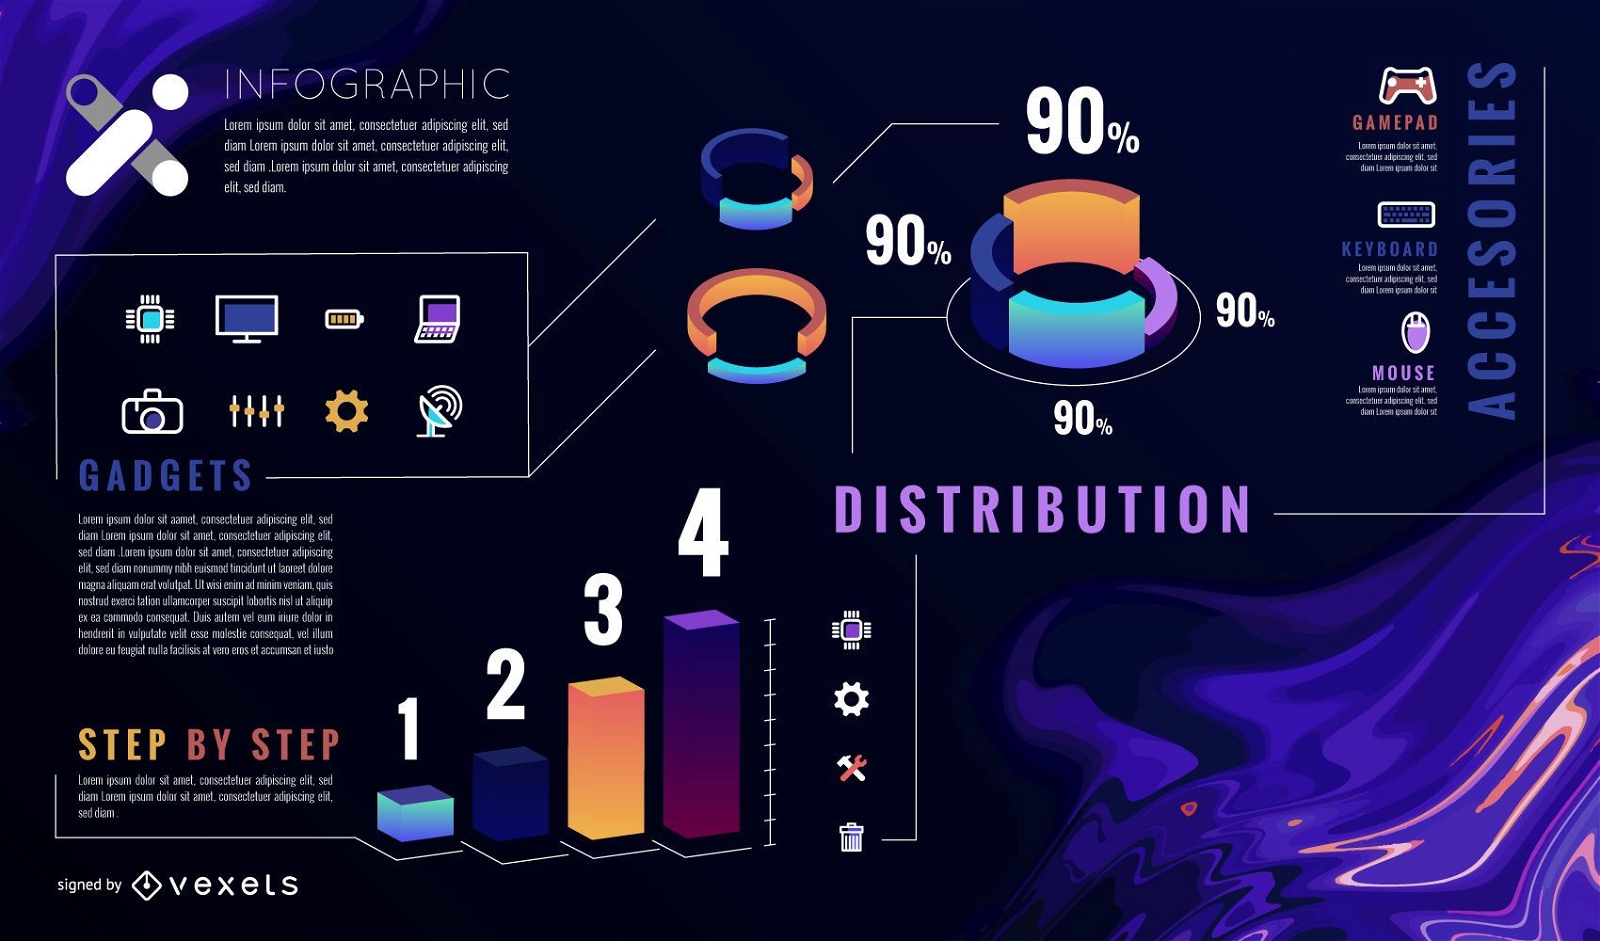
Covid-19 infographic template
Choose a folder
All favorites
Create new
Save
Covid-19 infographic template
Editable text
Premium
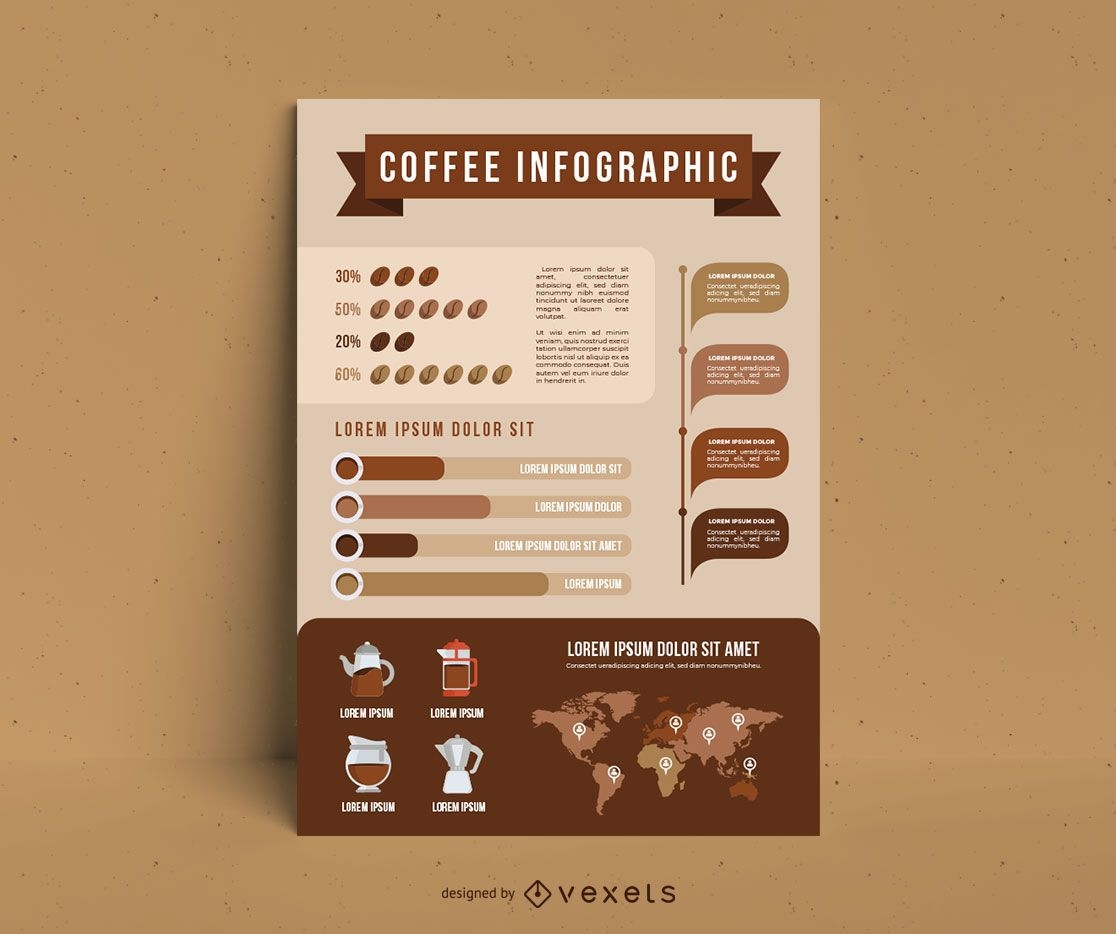
Types of coffee infographic template
Choose a folder
All favorites
Create new
Save
Types of coffee infographic template
Premium
Graph tv circle icon PNG Design
Choose a folder
All favorites
Create new
Save
Graph tv circle icon PNG Design
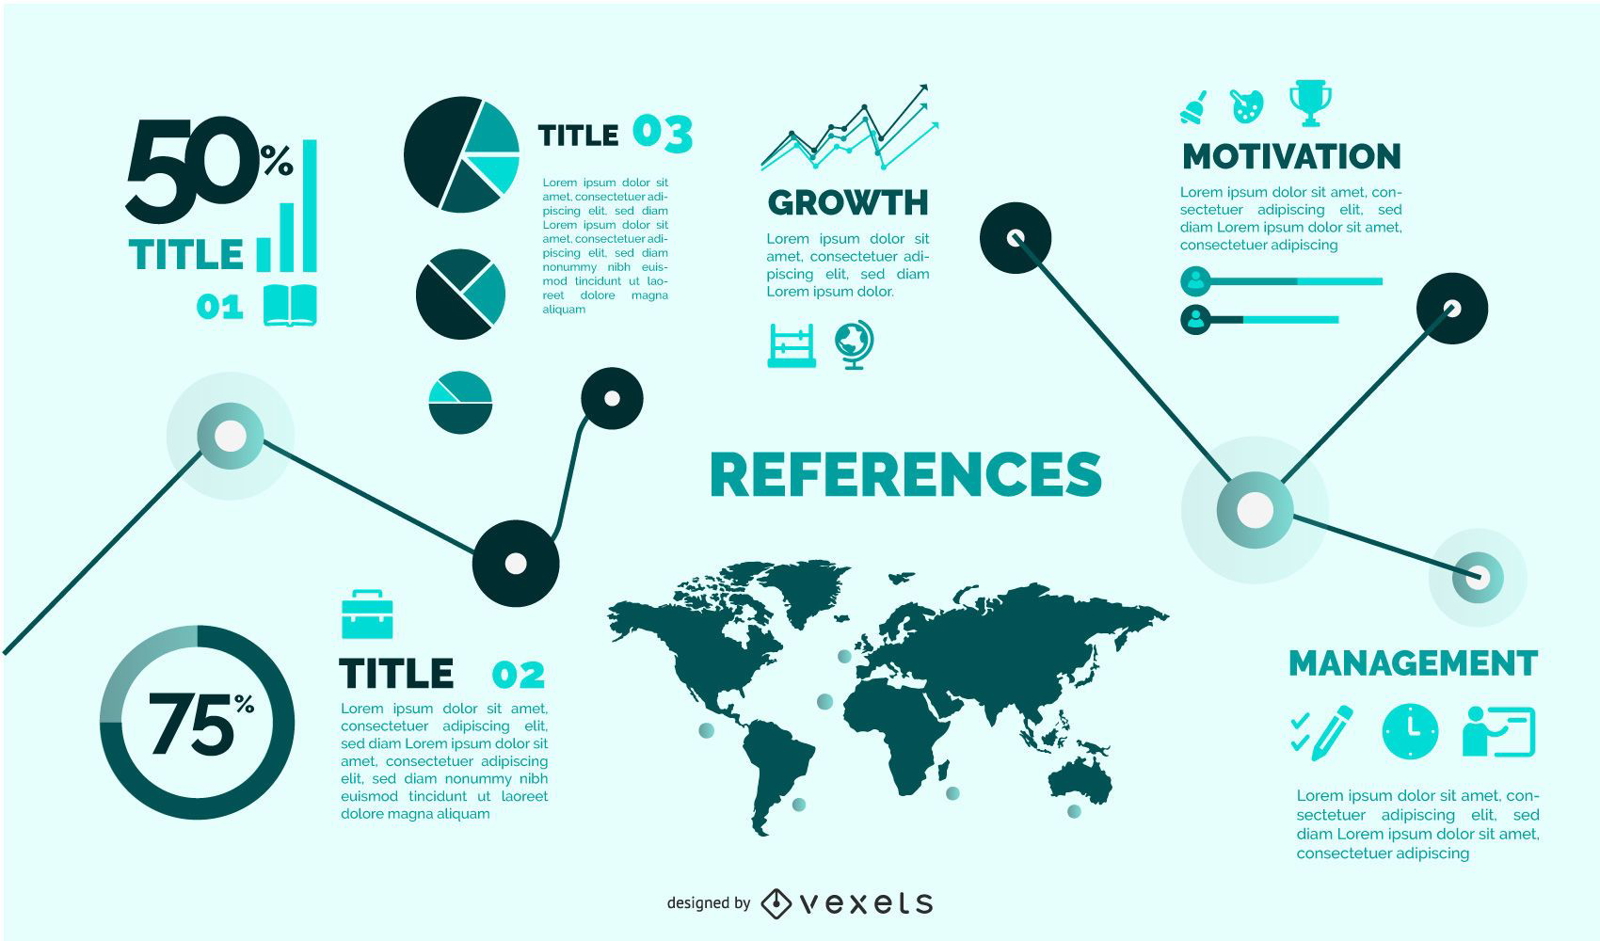
Flat Style Template Infographic Set
Choose a folder
All favorites
Create new
Save
Flat Style Template Infographic Set
Premium
The World card in a skeleton-themed tarot PNG Design
Choose a folder
All favorites
Create new
Save
The World card in a skeleton-themed tarot PNG Design
Premium
Ecommerce Stroke Icons Collection
Choose a folder
All favorites
Create new
Save
Ecommerce Stroke Icons Collection
Editable text
Premium
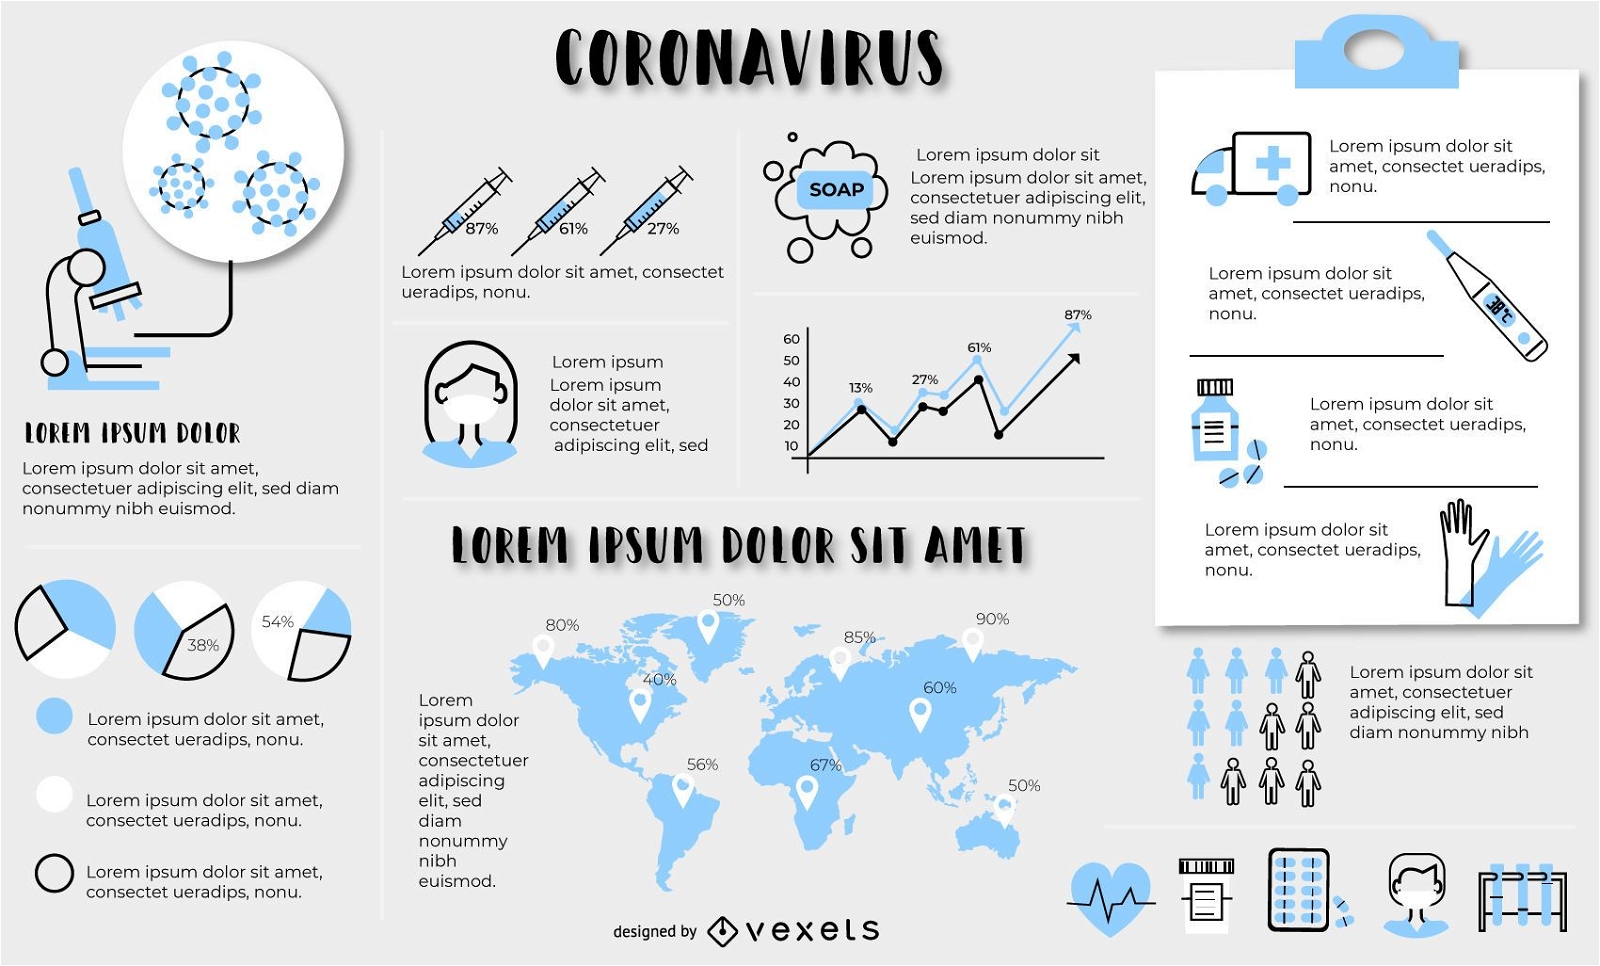
Coronavirus infographic elements template
Choose a folder
All favorites
Create new
Save
Coronavirus infographic elements template
Premium
Two sided colorful bar graph PNG Design
Choose a folder
All favorites
Create new
Save
Two sided colorful bar graph PNG Design
Premium
The Strength card in a skeleton-themed tarot PNG Design
Choose a folder
All favorites
Create new
Save
The Strength card in a skeleton-themed tarot PNG Design
Premium
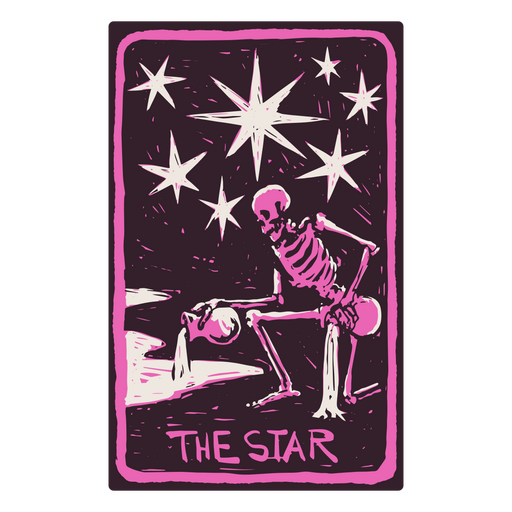
The Star card in a skeleton-themed tarot PNG Design
Choose a folder
All favorites
Create new
Save
The Star card in a skeleton-themed tarot PNG Design
Premium
Sagitarius sign in the horoscope PNG Design
Choose a folder
All favorites
Create new
Save
Sagitarius sign in the horoscope PNG Design
Premium
The emperor tarot card design PNG Design
Choose a folder
All favorites
Create new
Save
The emperor tarot card design PNG Design
Premium
The eastern sign of dragon PNG Design
Choose a folder
All favorites
Create new
Save
The eastern sign of dragon PNG Design
Premium
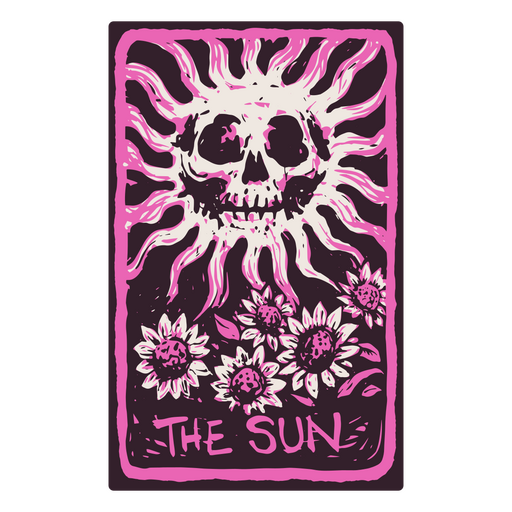
The Sun card in a skeleton-themed tarot PNG Design
Choose a folder
All favorites
Create new
Save
The Sun card in a skeleton-themed tarot PNG Design
Premium
Bar graph square icon PNG Design
Choose a folder
All favorites
Create new
Save
Bar graph square icon PNG Design
Premium
Fortune teller hands PNG Design
Choose a folder
All favorites
Create new
Save
Fortune teller hands PNG Design
Premium
Multicolor bar graph with icons PNG Design
Choose a folder
All favorites
Create new
Save
Multicolor bar graph with icons PNG Design
Editable Template
Premium
Infographic abstract template
Choose a folder
All favorites
Create new
Save
Infographic abstract template
Editable text
Premium
Coffee infographic
Choose a folder
All favorites
Create new
Save
Coffee infographic
Growing graph bars stroke PNG Design
Choose a folder
All favorites
Create new
Save
Growing graph bars stroke PNG Design
Premium
Graph square infographic sticker PNG Design
Choose a folder
All favorites
Create new
Save
Graph square infographic sticker PNG Design
Colorful bar graph icon PNG Design
Choose a folder
All favorites
Create new
Save
Colorful bar graph icon PNG Design
Flat design stop GMO sign
Choose a folder
All favorites
Create new
Save
Flat design stop GMO sign
Premium
Aquarius sign in the horoscope PNG Design
Choose a folder
All favorites
Create new
Save
Aquarius sign in the horoscope PNG Design
Premium
Taurus sign in the horoscope PNG Design
Choose a folder
All favorites
Create new
Save
Taurus sign in the horoscope PNG Design
Premium
Stroke Hospital Elements Design Pack
Choose a folder
All favorites
Create new
Save
Stroke Hospital Elements Design Pack
Colorful 4 parts piechart PNG Design
Choose a folder
All favorites
Create new
Save
Colorful 4 parts piechart PNG Design
Vector Icons
Choose a folder
All favorites
Create new
Save
Vector Icons
Icon set
Choose a folder
All favorites
Create new
Save
Icon set
Premium
Esoteric moon card PNG Design
Choose a folder
All favorites
Create new
Save
Esoteric moon card PNG Design
Premium
The Hanged Man card in a skeleton-themed tarot PNG Design
Choose a folder
All favorites
Create new
Save
The Hanged Man card in a skeleton-themed tarot PNG Design
Graph presentation doodle PNG Design
Choose a folder
All favorites
Create new
Save
Graph presentation doodle PNG Design
Premium
Two sided colorful bar plot PNG Design
Choose a folder
All favorites
Create new
Save
Two sided colorful bar plot PNG Design
Premium
Virgo sign in the western horoscope PNG Design
Choose a folder
All favorites
Create new
Save
Virgo sign in the western horoscope PNG Design
Premium
Pisces sign in the horoscope PNG Design
Choose a folder
All favorites
Create new
Save
Pisces sign in the horoscope PNG Design
Premium
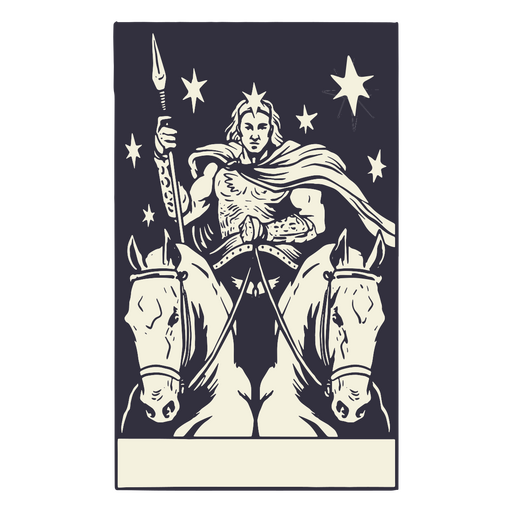
The chariot tarot card design PNG Design
Choose a folder
All favorites
Create new
Save
The chariot tarot card design PNG Design
Subscribe
To Get High-Quality Commercial Use Designs For Your Business
SEE PLANS
Next
of 11
prev page
next page