Design Library
New Merch Designs
T-Shirts
Vectors
Trending Merch Designs
PNGs & SVGs
Mockups
T-Shirt PSD Templates
Explore Designs
KDP Designs
Posters
Mugs
Phone Cases
Tote Bags
Pillows
Design Tools
Merch Designer
New!
Mockup Generator
AI Design Generator
Image Vectorizer
Quote Generator
T-Shirt Maker (Old)
Resources
Merch Digest
Blog
Help Center
Learn About Merch
Feedback
Corporate Solutions
Enterprise
API Access
Pricing
Loading...
Sign Up
Login
Merch Vectors
grafico
Design Library
New Merch Designs
T-Shirts
Vectors
Trending Merch Designs
PNGs & SVGs
Mockups
T-Shirt PSD Templates
Explore Designs
KDP Designs
Posters
Mugs
Phone Cases
Tote Bags
Pillows
Design Tools
Merch Designer
New!
Mockup Generator
AI Design Generator
Image Vectorizer
Quote Generator
T-Shirt Maker (Old)
Resources
Merch Digest
Blog
Help Center
Learn About Merch
Feedback
Corporate Solutions
Enterprise
API Access
PLANS
Merch Vectors
grafico
35988 grafico Vector Designs for T-Shirts and merch
Download & buy editable grafico AI Vector Graphics Designs for T shirts, Phone Cases, Book Covers and other Merch
Sort by
Most relevant
Sponsored results by
Get 15% off with code: VEXELS15
Show more
Editable text
Print ready
for Merch
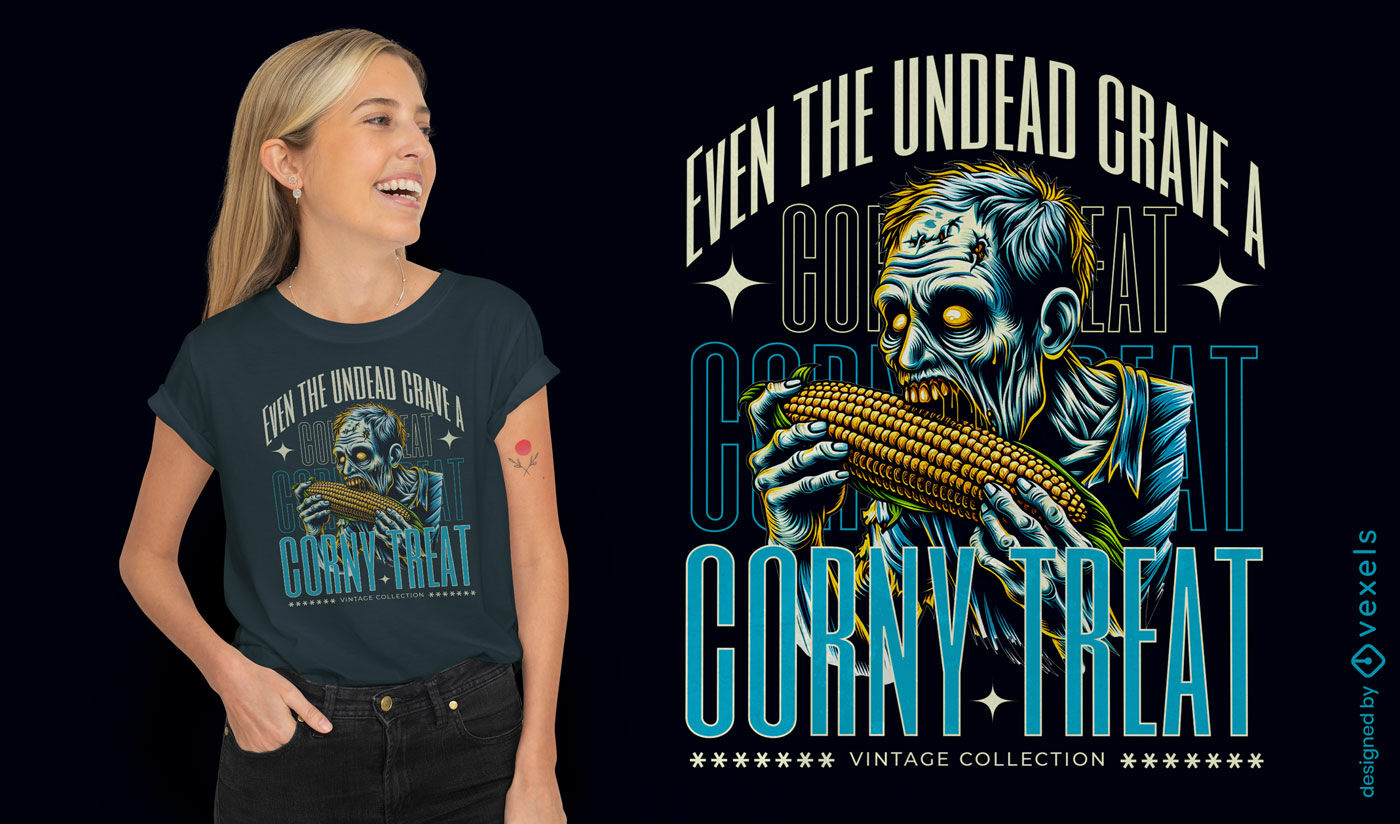
Zombie corn treat t-shirt design
Choose a folder
All favorites
Create new
Save
Zombie corn treat t-shirt design
Editable text
Print ready
for Merch
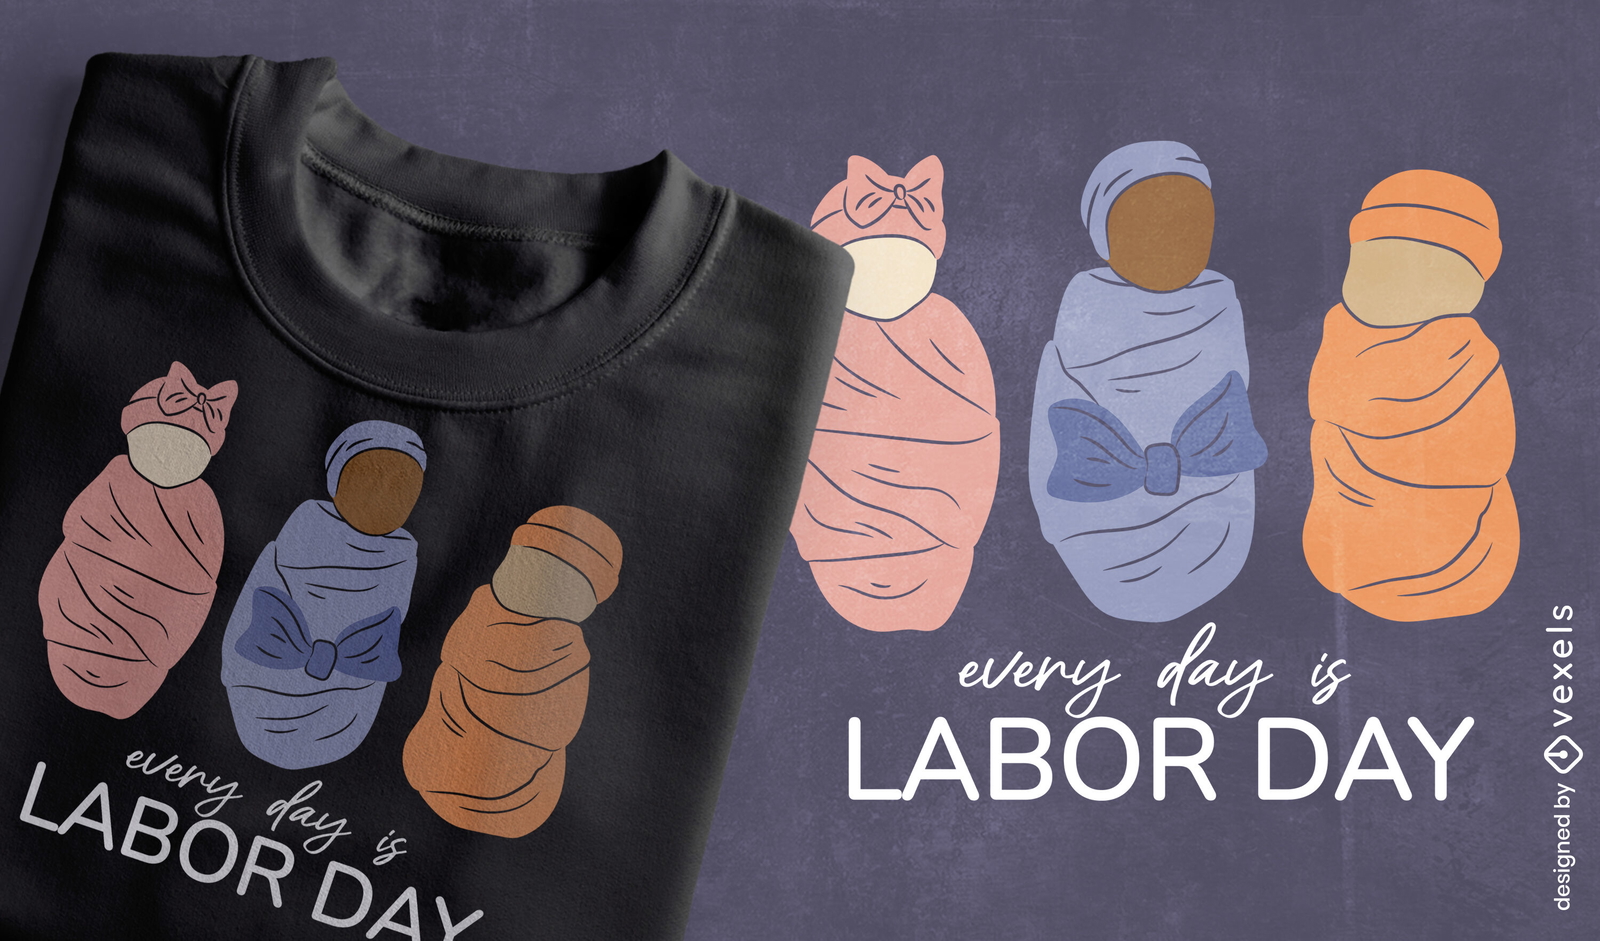
Thoughtful Labor Day quote t-shirt design
Choose a folder
All favorites
Create new
Save
Thoughtful Labor Day quote t-shirt design
Print ready
for Merch
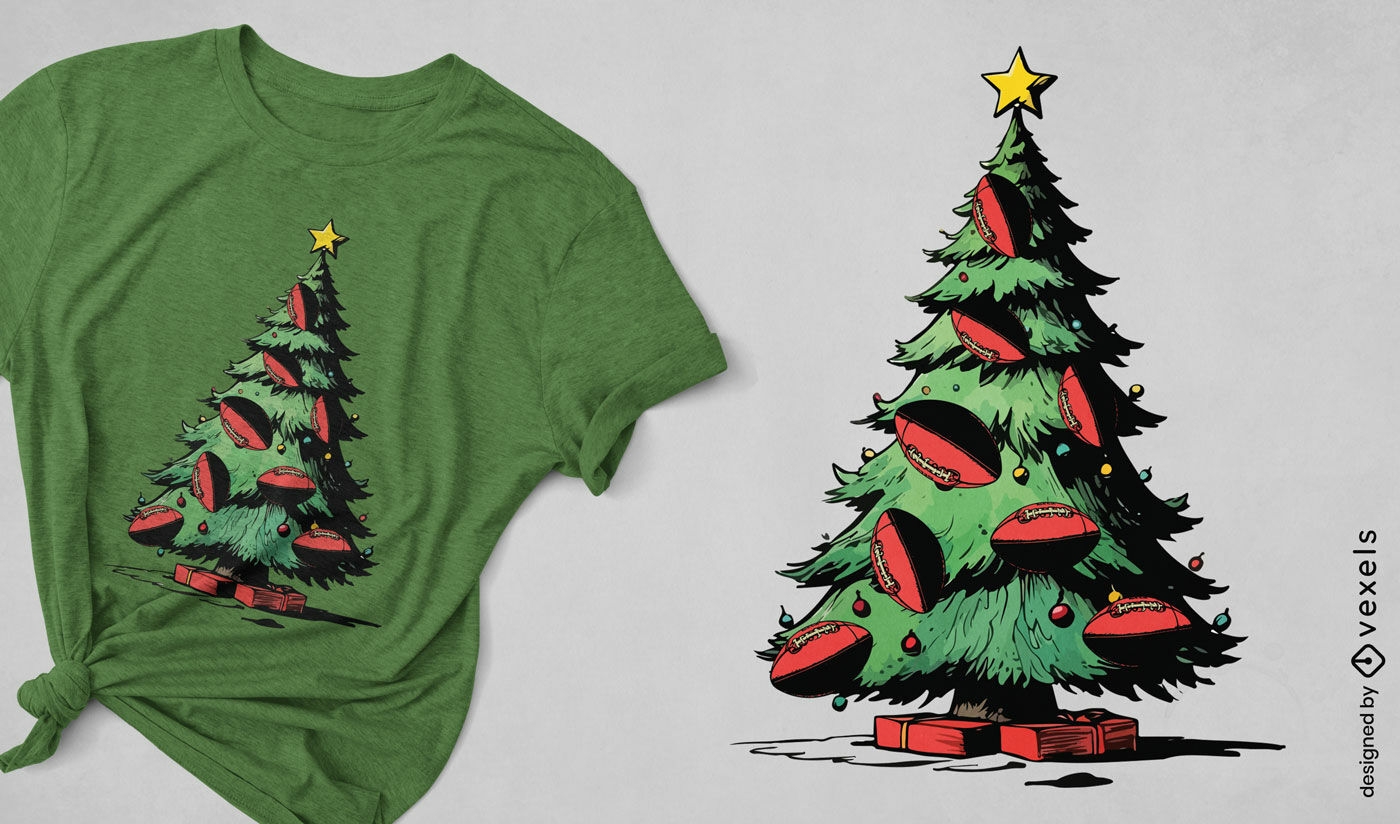
Decorated football Christmas tree t-shirt design
Choose a folder
All favorites
Create new
Save
Decorated football Christmas tree t-shirt design
Print ready
for Merch
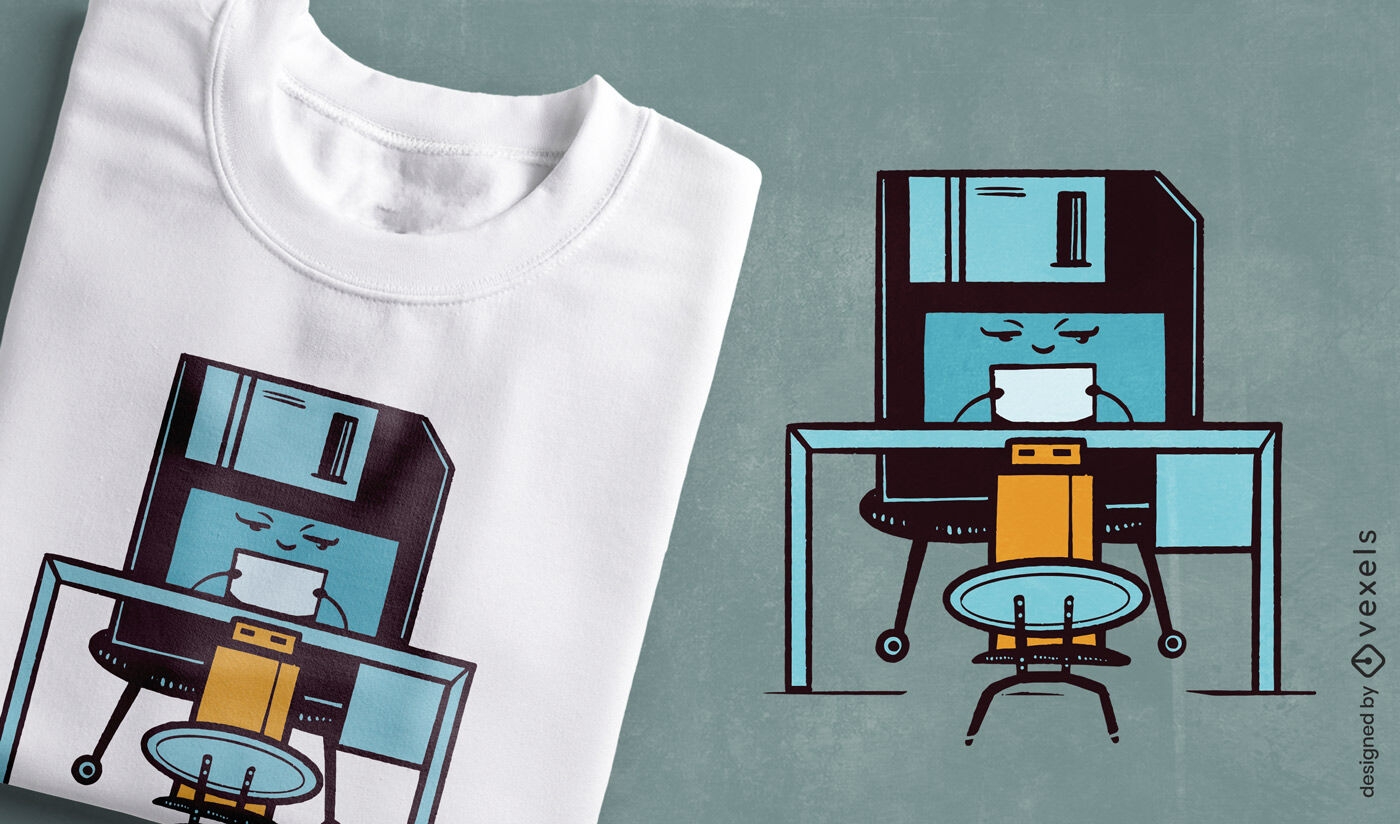
Retro floppy disk t-shirt design
Choose a folder
All favorites
Create new
Save
Retro floppy disk t-shirt design
Print ready
for Merch
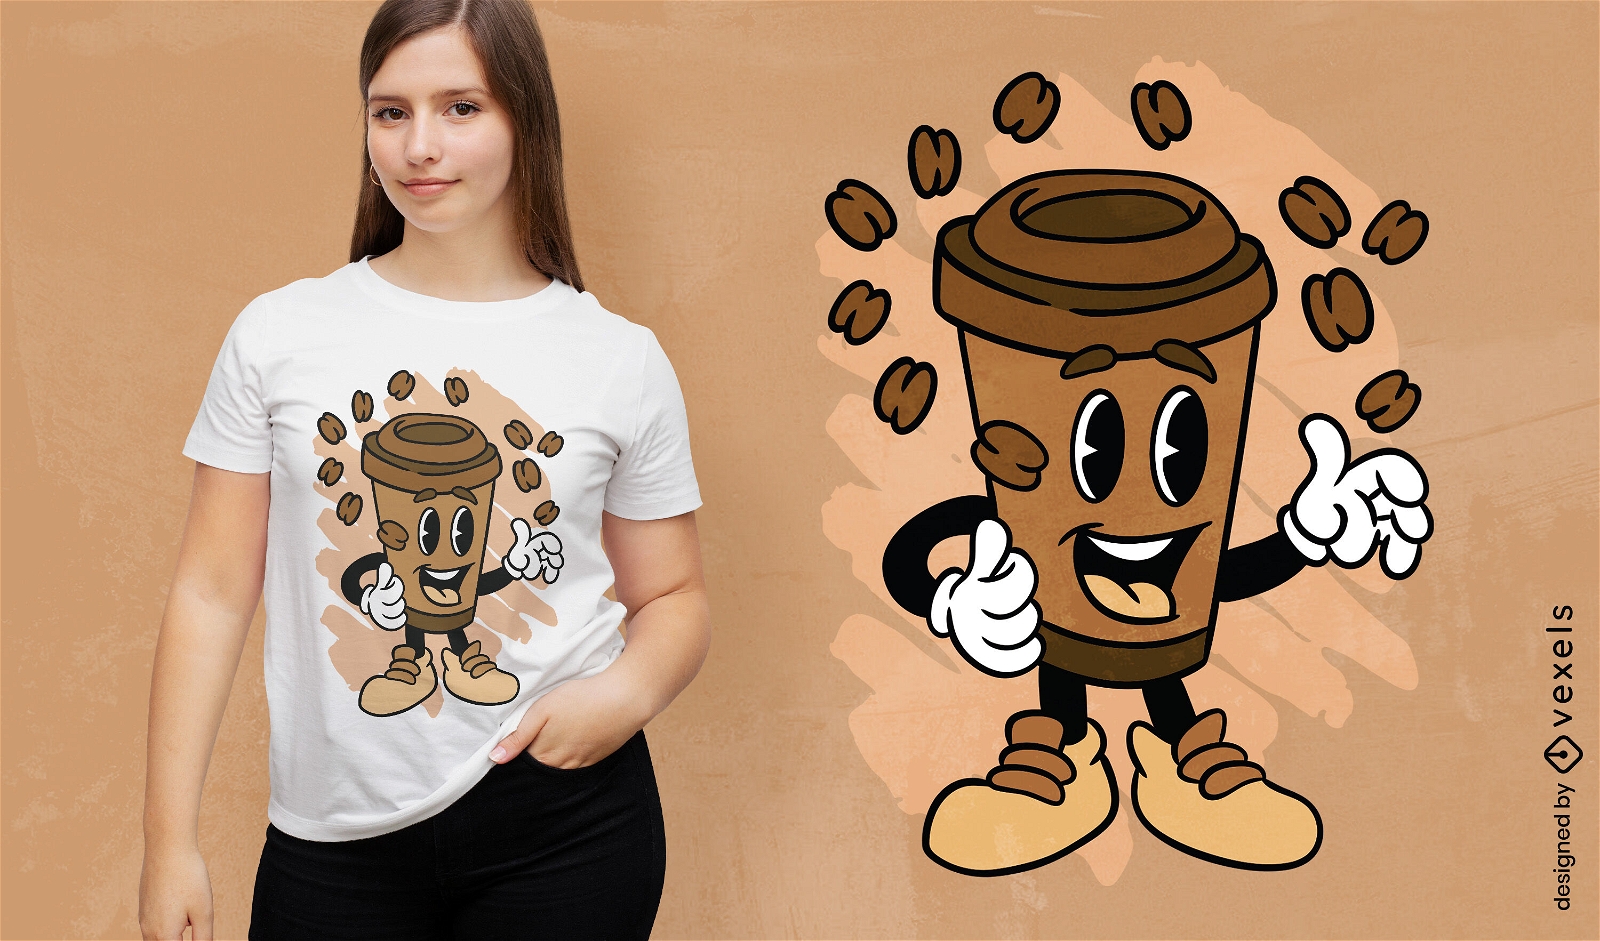
Coffee juggling t-shirt design
Choose a folder
All favorites
Create new
Save
Coffee juggling t-shirt design
Editable text
Print ready
for Merch
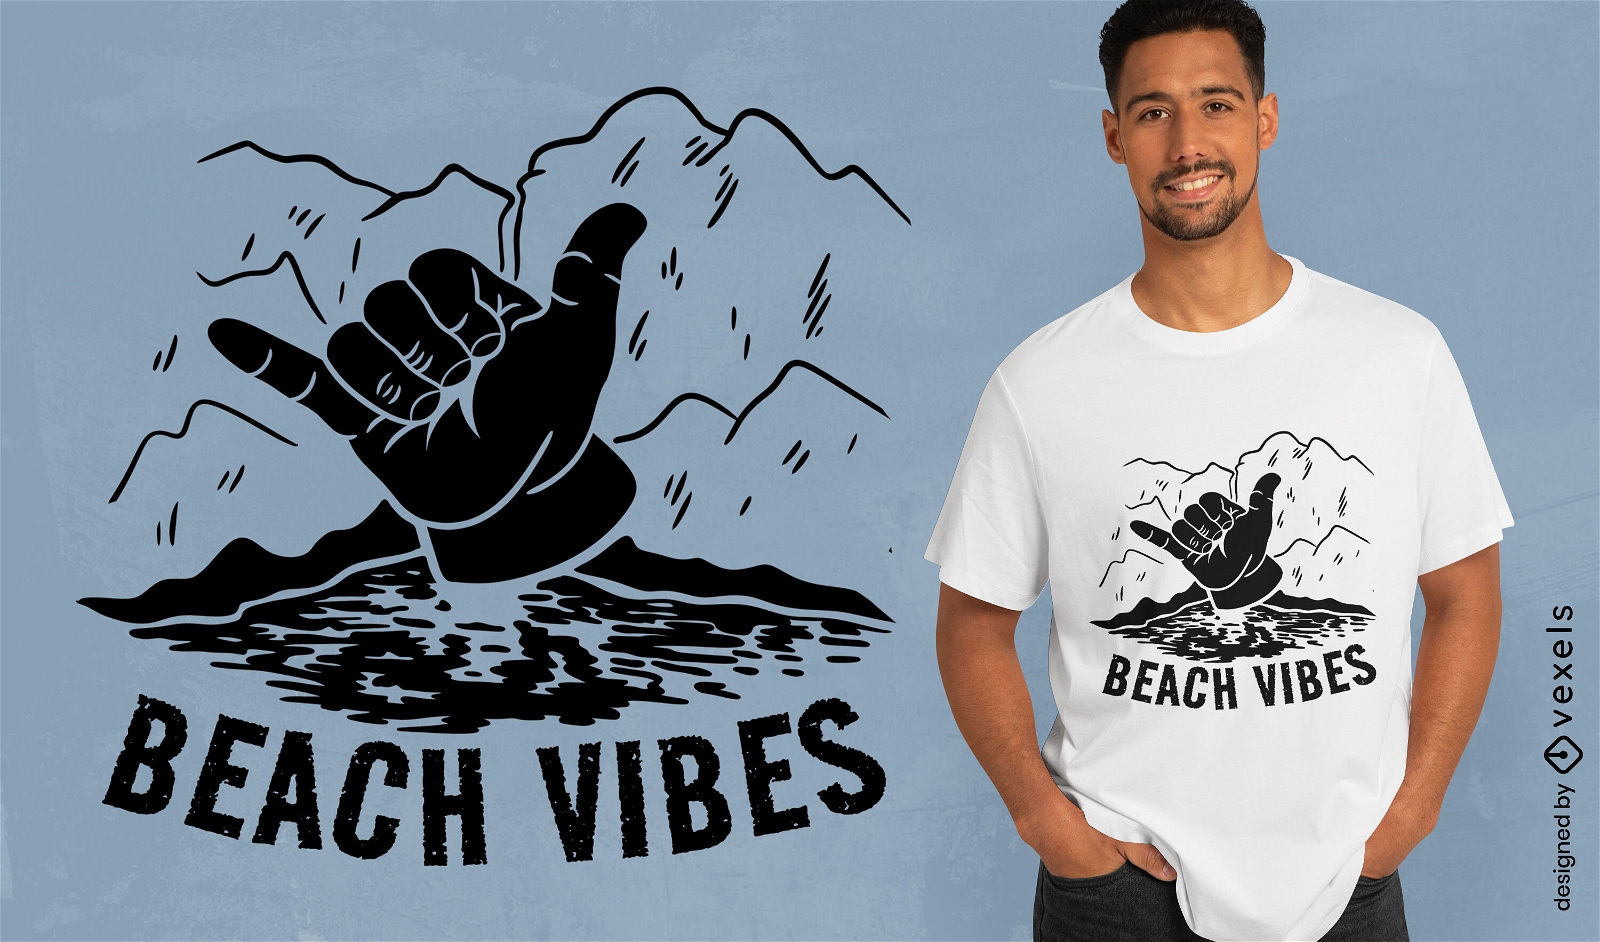
Beach vibes shaka hand t-shirt design
Choose a folder
All favorites
Create new
Save
Beach vibes shaka hand t-shirt design
Print ready
for Merch
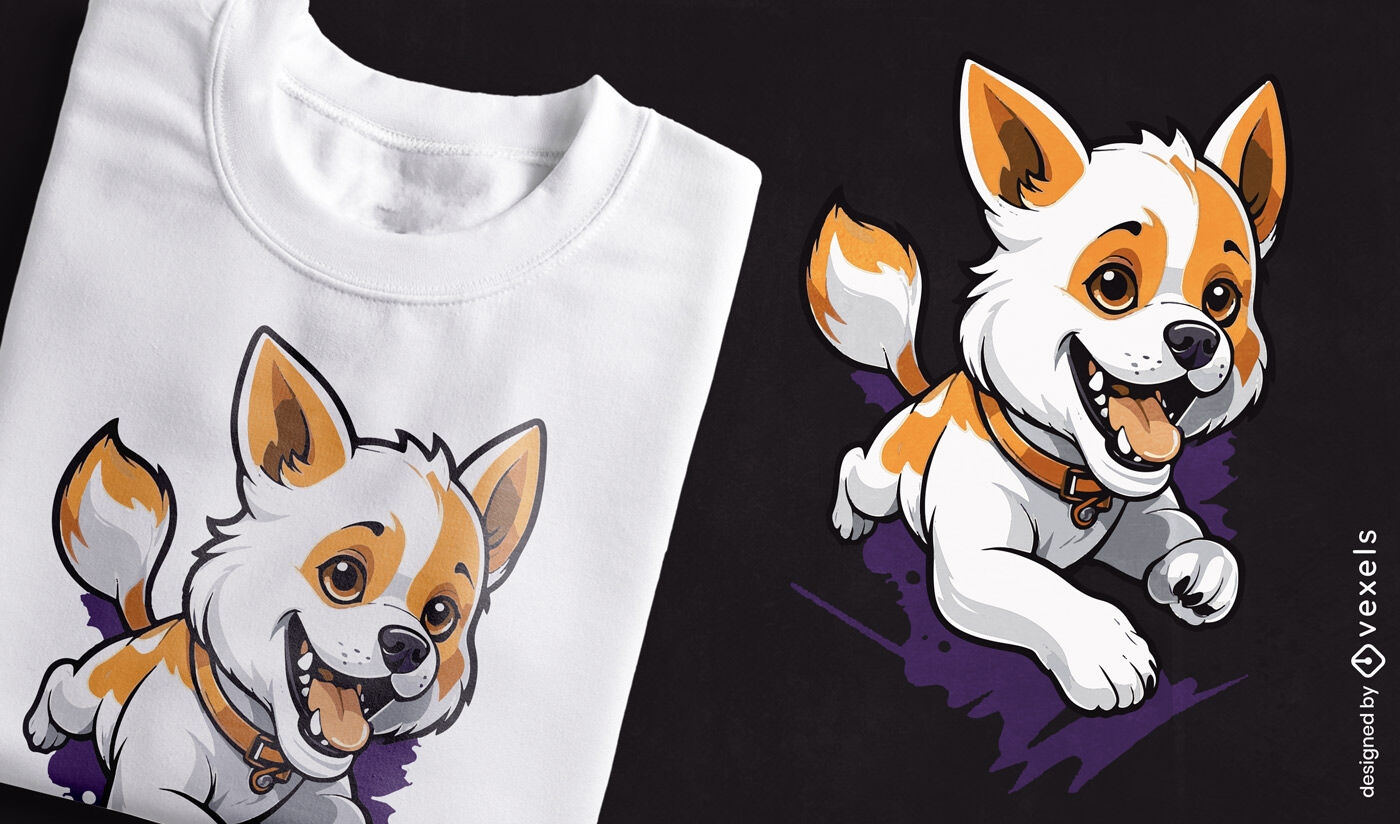
Playful corgi t-shirt design
Choose a folder
All favorites
Create new
Save
Playful corgi t-shirt design
Editable text
Print ready
for Merch
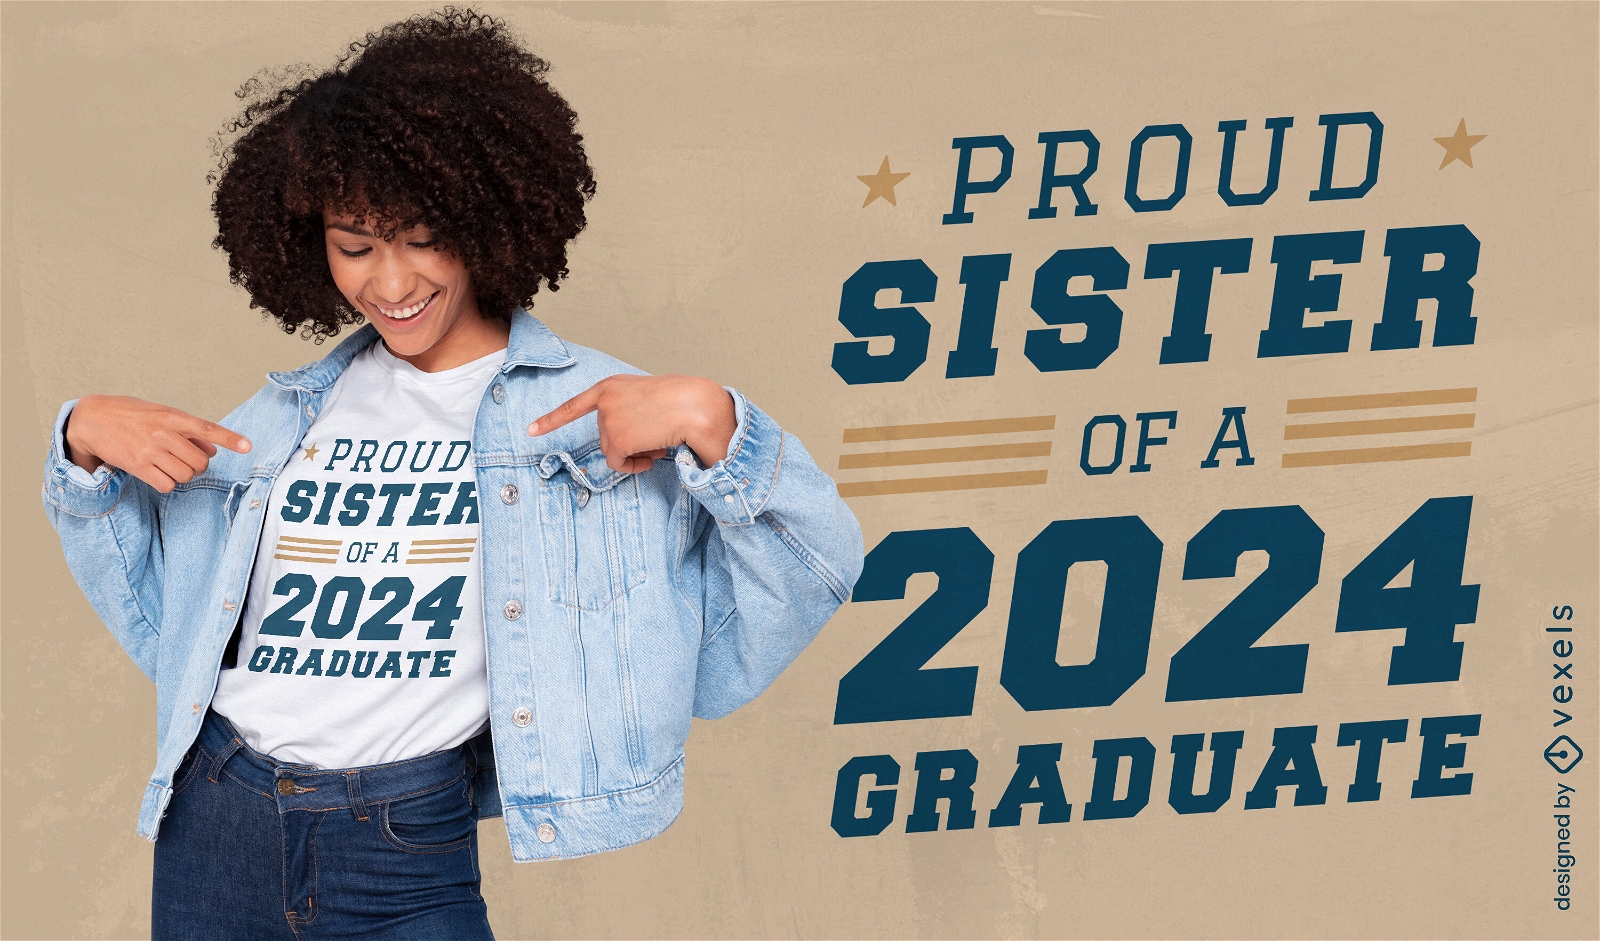
Proud sister of a graduate t-shirt design
Choose a folder
All favorites
Create new
Save
Proud sister of a graduate t-shirt design
Editable text
Print ready
for Merch
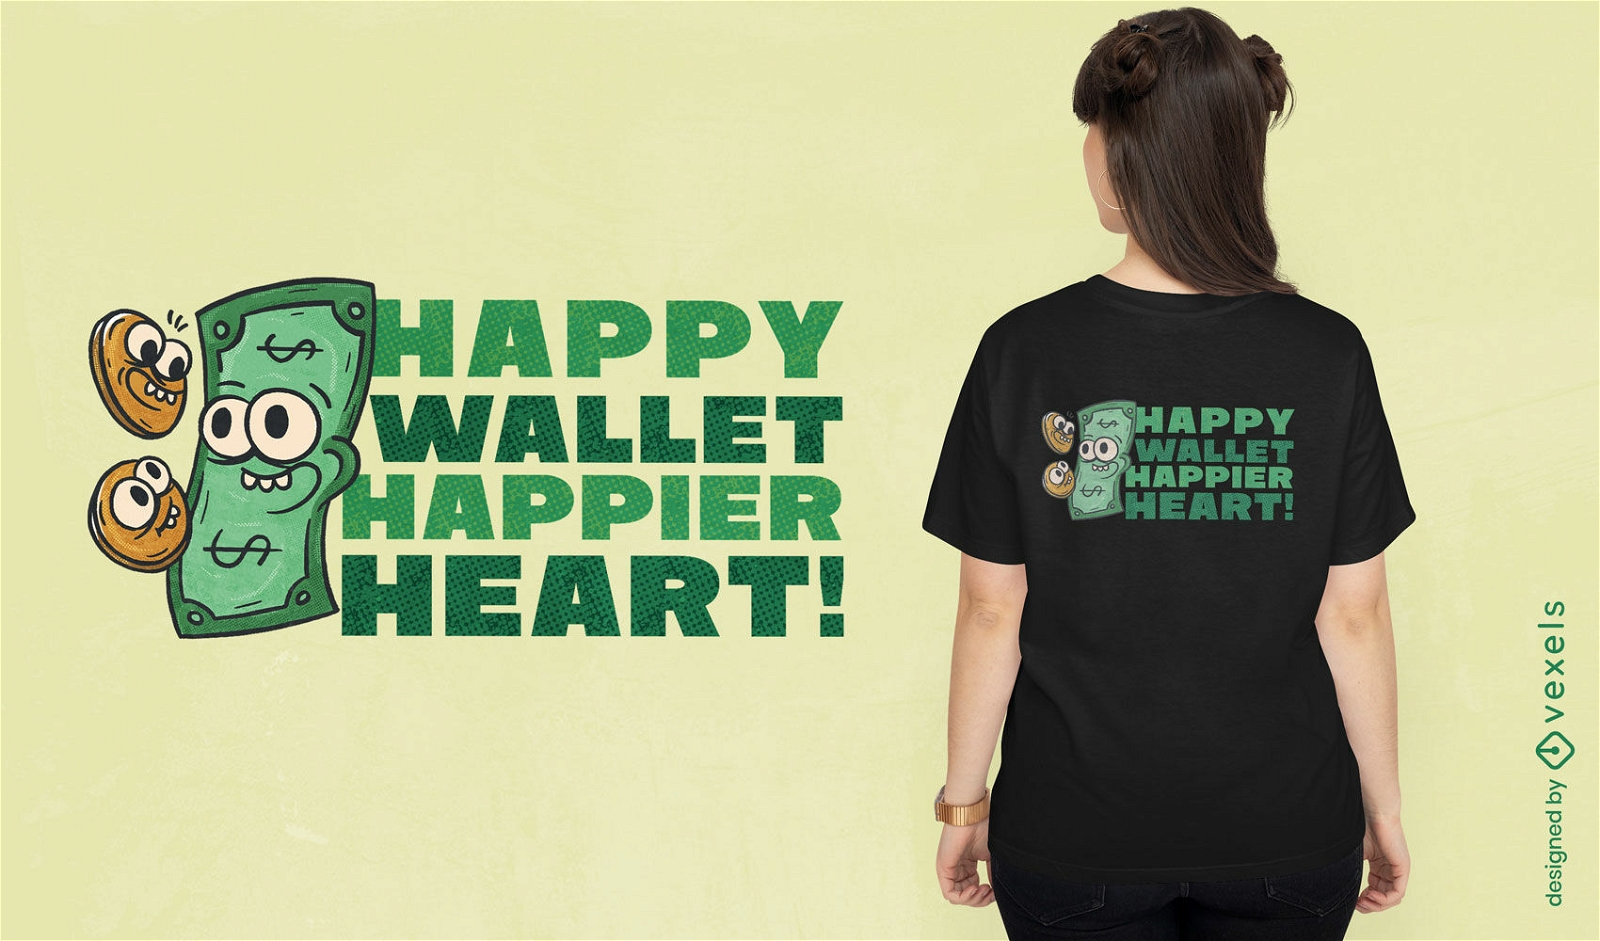
Happy wallet characters t-shirt design
Choose a folder
All favorites
Create new
Save
Happy wallet characters t-shirt design
Editable text
Print ready
for Merch
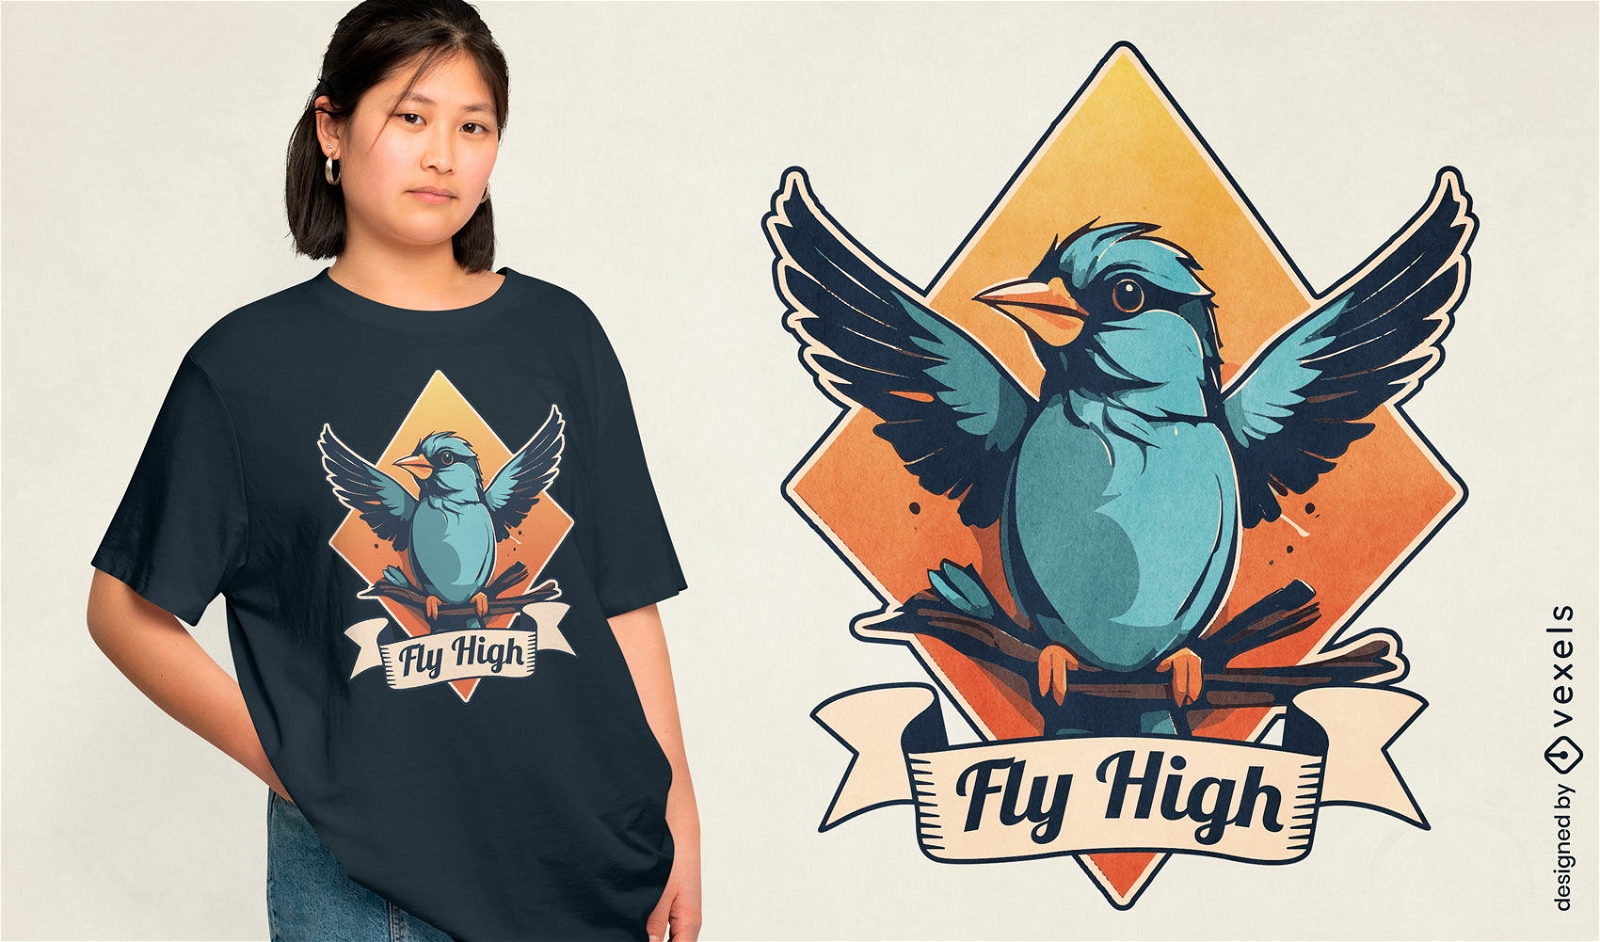
Soaring bird with ribbon t-shirt design
Choose a folder
All favorites
Create new
Save
Soaring bird with ribbon t-shirt design
Editable text
Print ready
for Merch
Love's scars t-shirt design
Choose a folder
All favorites
Create new
Save
Love's scars t-shirt design
Print ready
for Merch
Board games Christmas tree t-shirt design
Choose a folder
All favorites
Create new
Save
Board games Christmas tree t-shirt design
Editable text
Print ready
for Merch
Inspirational pencil quote t-shirt design
Choose a folder
All favorites
Create new
Save
Inspirational pencil quote t-shirt design
Print ready
for Merch
Strawberry with cream t-shirt design
Choose a folder
All favorites
Create new
Save
Strawberry with cream t-shirt design
Editable text
Print ready
for Merch
Mood swing warning t-shirt design
Choose a folder
All favorites
Create new
Save
Mood swing warning t-shirt design
Editable text
Print ready
for Merch
Can pun t-shirt design
Choose a folder
All favorites
Create new
Save
Can pun t-shirt design
Print ready
for Merch
Retro sunset landscape t-shirt design
Choose a folder
All favorites
Create new
Save
Retro sunset landscape t-shirt design
Editable text
Print ready
for Merch
Sunglasses tropical t-shirt design
Choose a folder
All favorites
Create new
Save
Sunglasses tropical t-shirt design
Print ready
for Merch
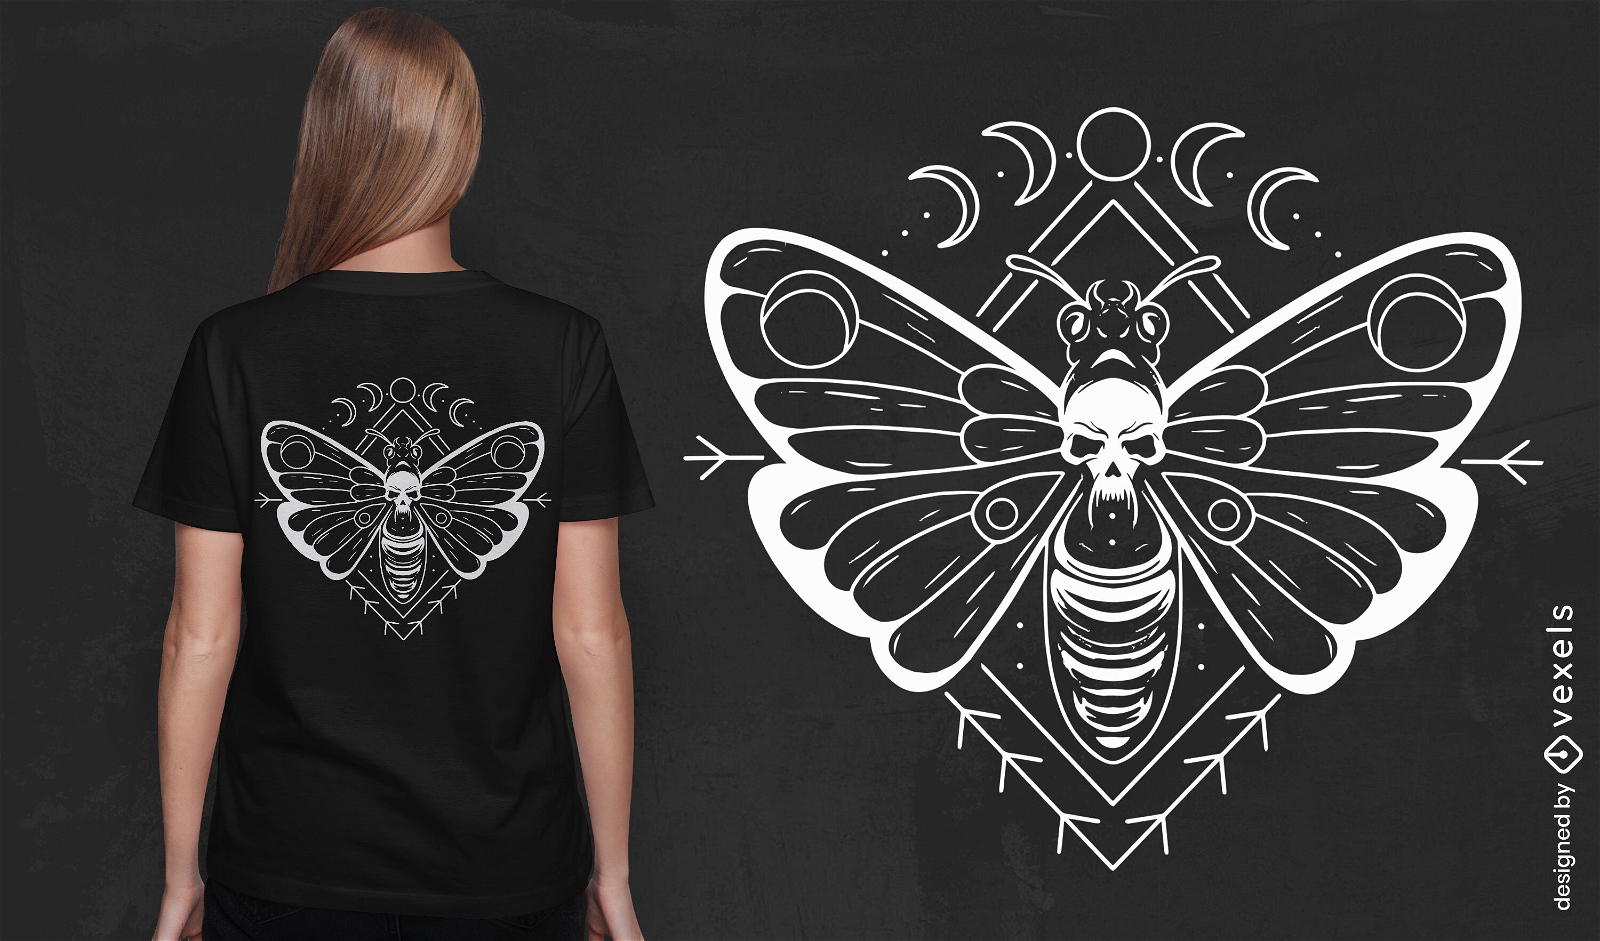
Goth night moth t-shirt design
Choose a folder
All favorites
Create new
Save
Goth night moth t-shirt design
Print ready
for Merch
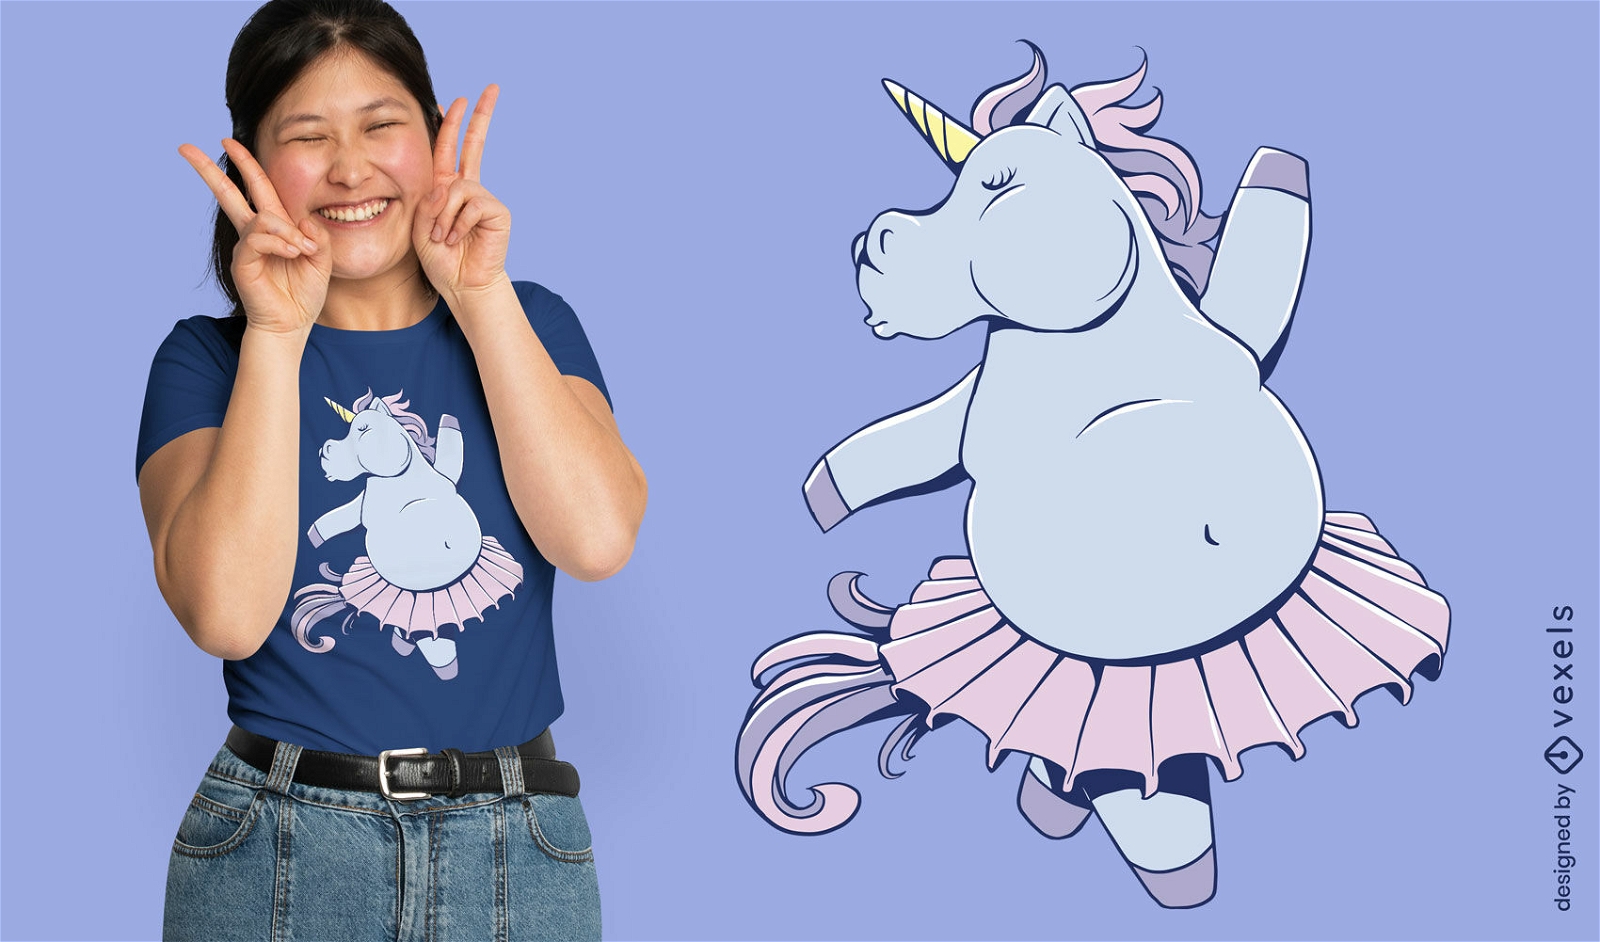
Chubby unicorn ballet t-shirt design
Choose a folder
All favorites
Create new
Save
Chubby unicorn ballet t-shirt design
Print ready
for Merch
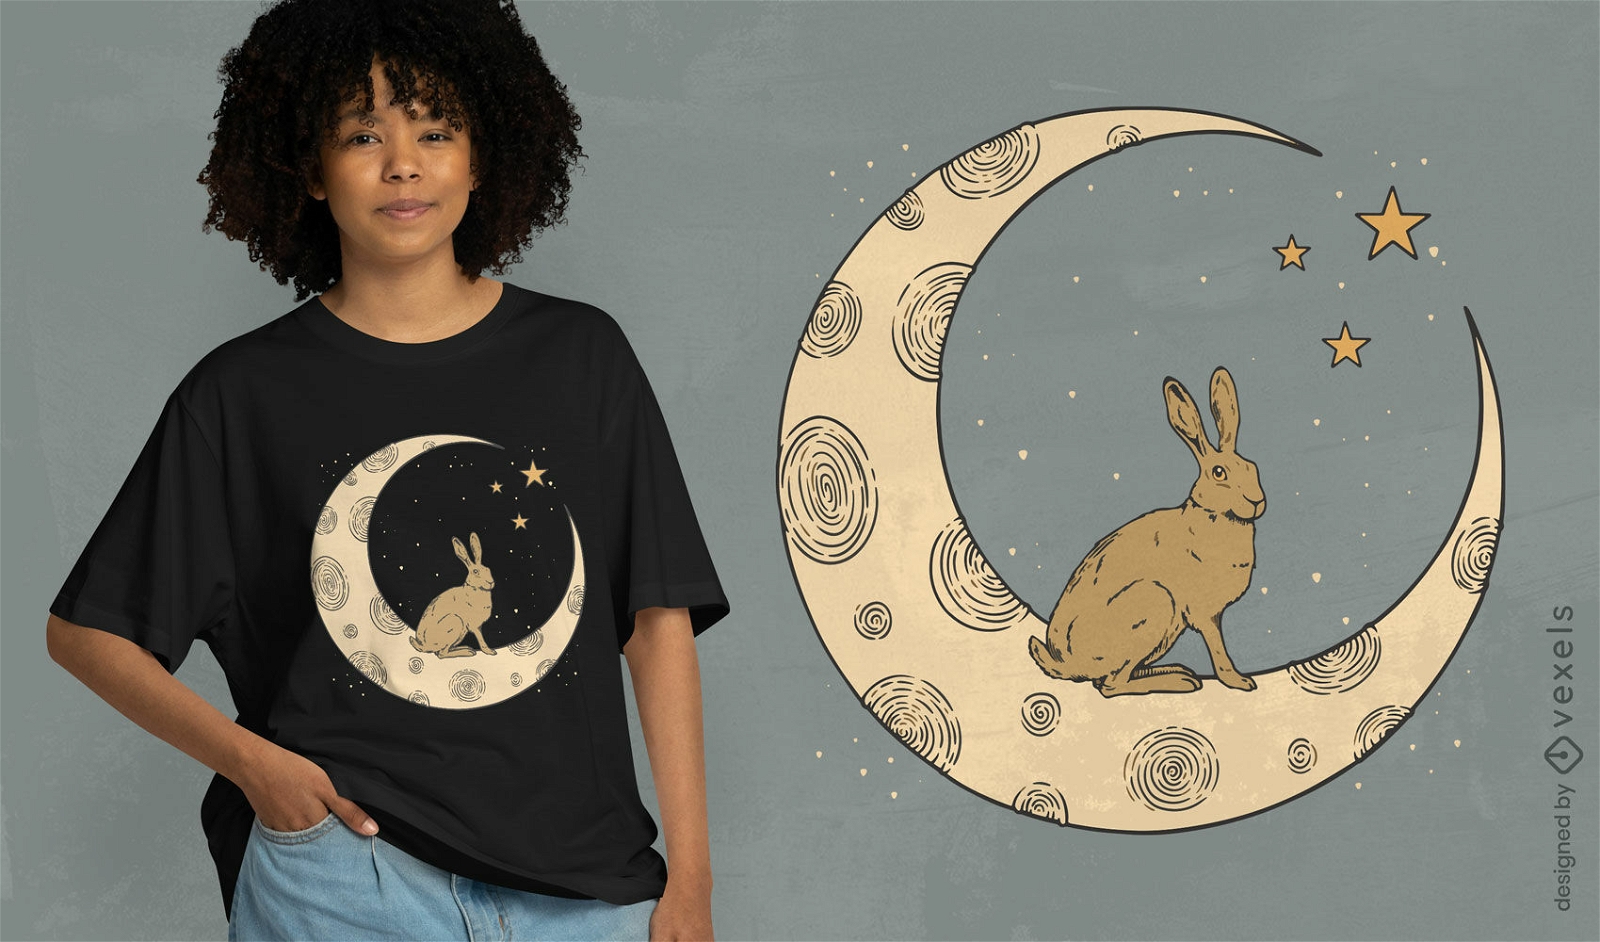
Rabbit animal on the moon t-shirt design
Choose a folder
All favorites
Create new
Save
Rabbit animal on the moon t-shirt design
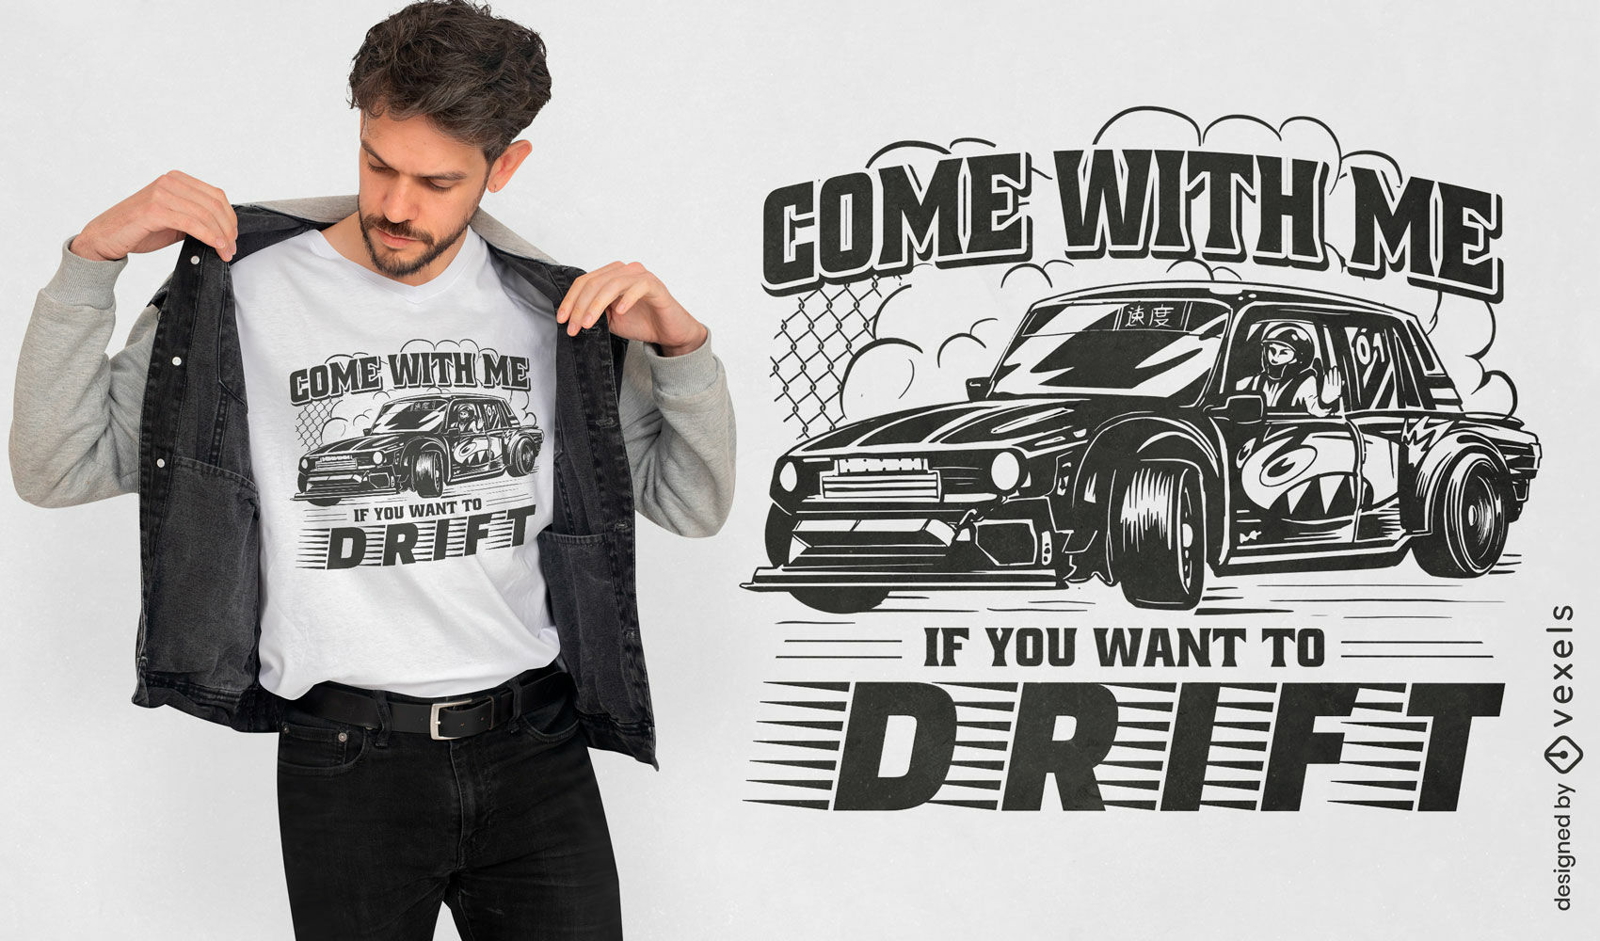
Editable text
Print ready
for Merch
Race car vehicle hobby t-shirt design
Choose a folder
All favorites
Create new
Save
Race car vehicle hobby t-shirt design
Print ready
for Merch
Drunk pickle cartoon t-shirt design
Choose a folder
All favorites
Create new
Save
Drunk pickle cartoon t-shirt design
Print ready
for Merch
Hermit crab cute animal t-shirt design
Choose a folder
All favorites
Create new
Save
Hermit crab cute animal t-shirt design
Print ready
for Merch
Gardening tools hobby t-shirt design
Choose a folder
All favorites
Create new
Save
Gardening tools hobby t-shirt design
Print ready
for Merch
2023 trippy t-shirt design
Choose a folder
All favorites
Create new
Save
2023 trippy t-shirt design
Print ready
for Merch
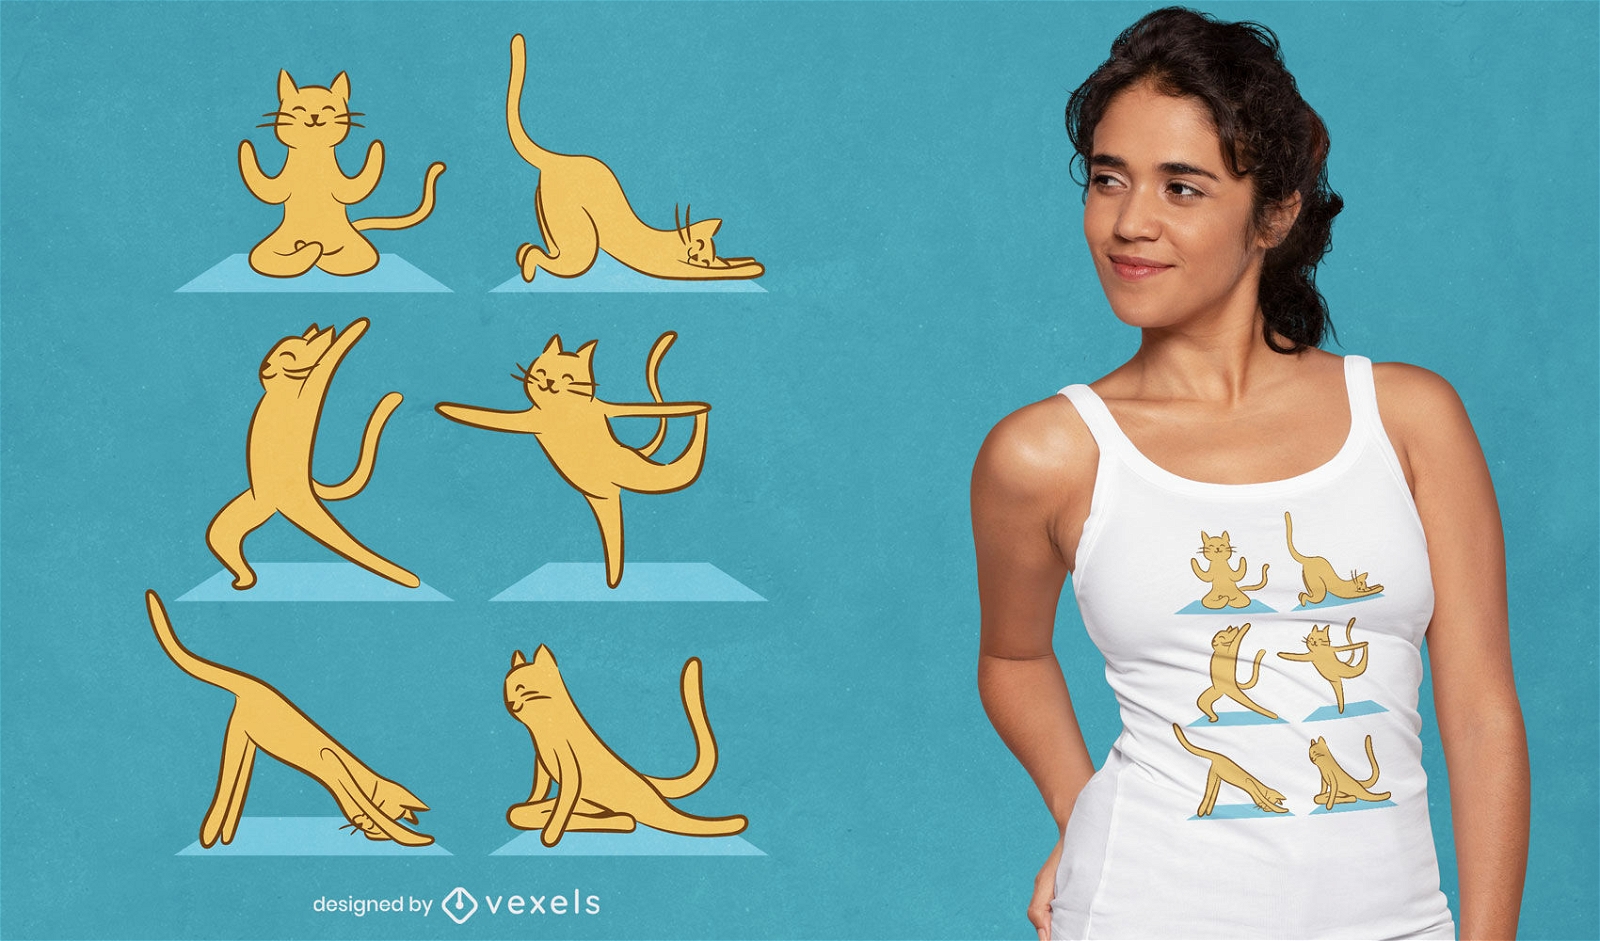
Cat doing yoga t-shirt design
Choose a folder
All favorites
Create new
Save
Cat doing yoga t-shirt design
Print ready
for Merch
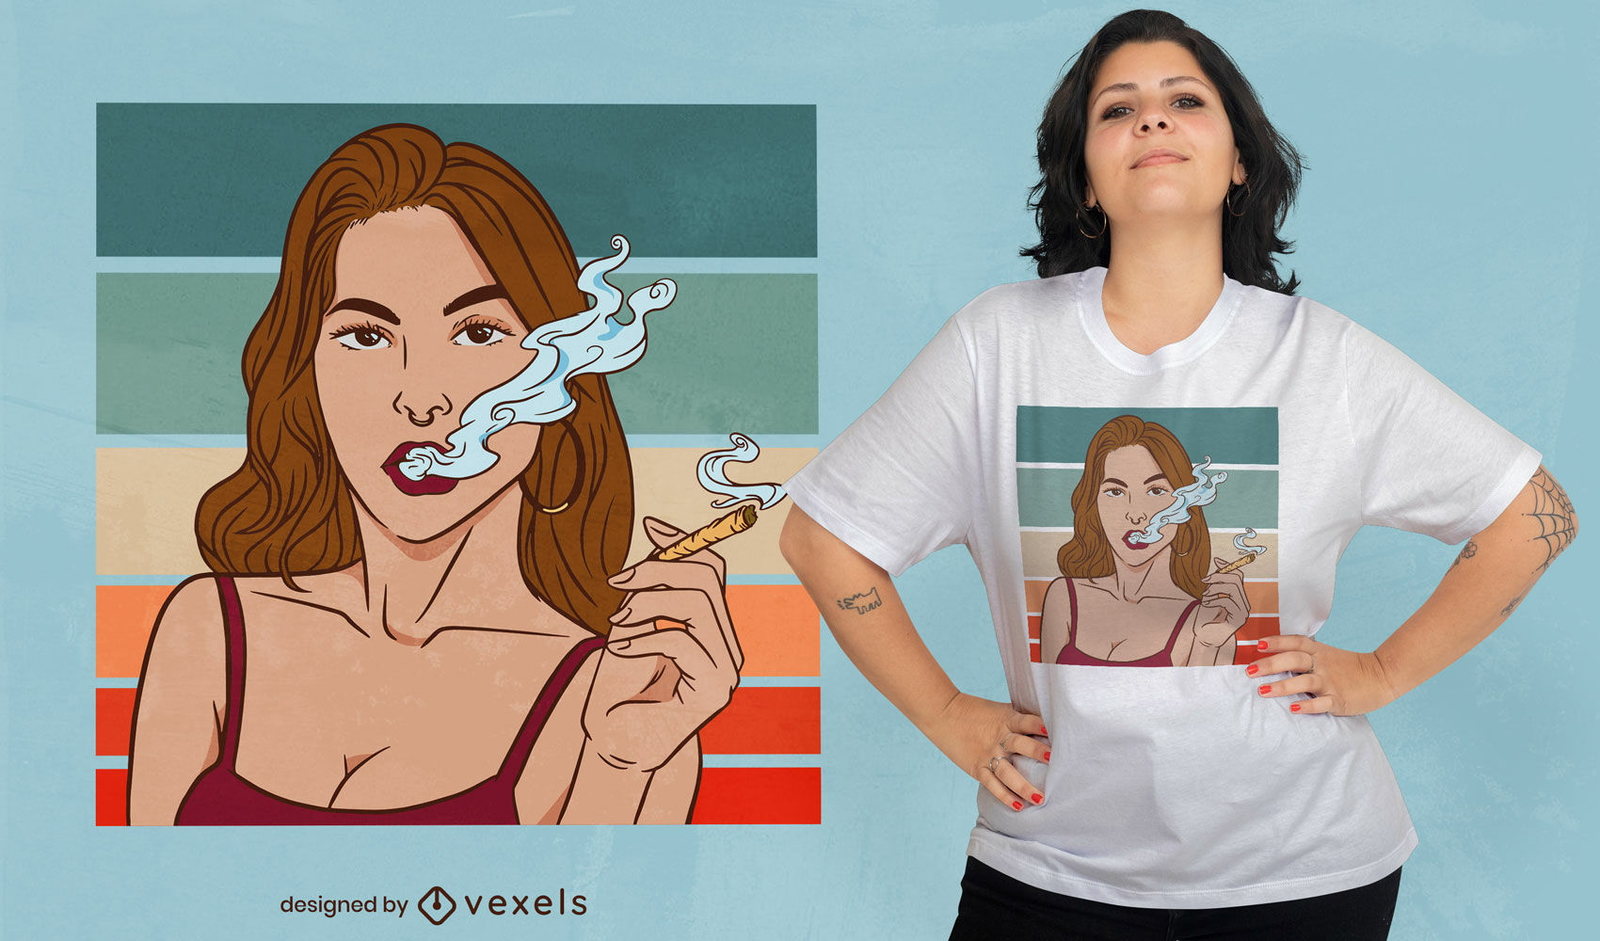
Smoking woman weed t-shirt design
Choose a folder
All favorites
Create new
Save
Smoking woman weed t-shirt design
Print ready
for Merch
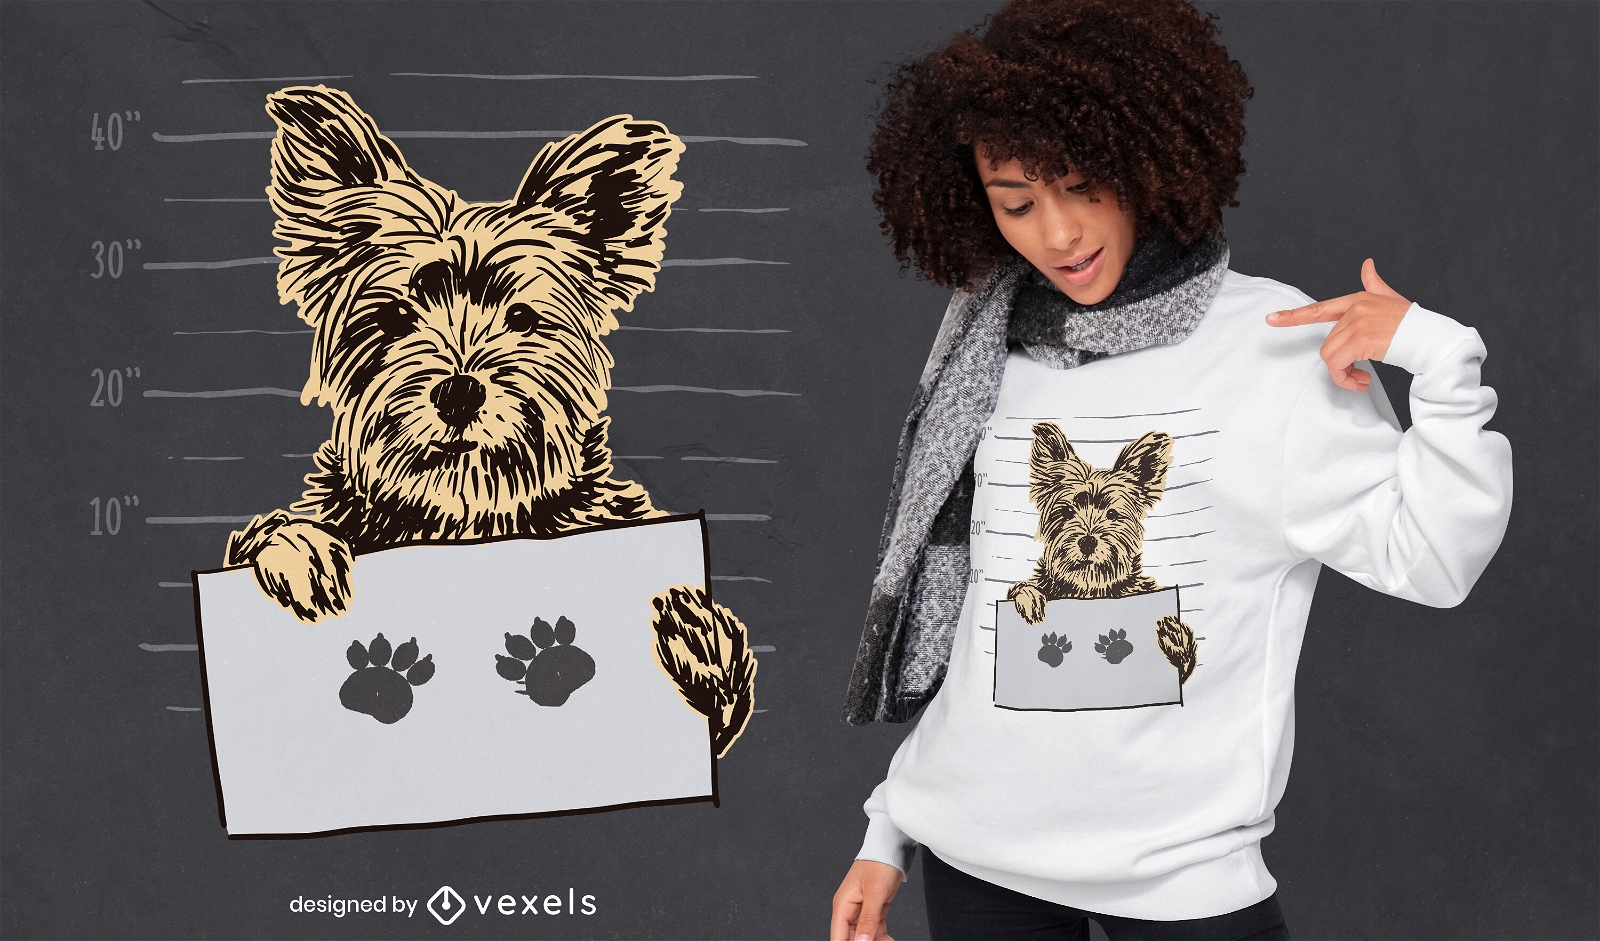
Yorkshire dog mugshot t-shirt design
Choose a folder
All favorites
Create new
Save
Yorkshire dog mugshot t-shirt design
Print ready
for Merch
Magical fairy in nature t-shirt design
Choose a folder
All favorites
Create new
Save
Magical fairy in nature t-shirt design
Print ready
for Merch
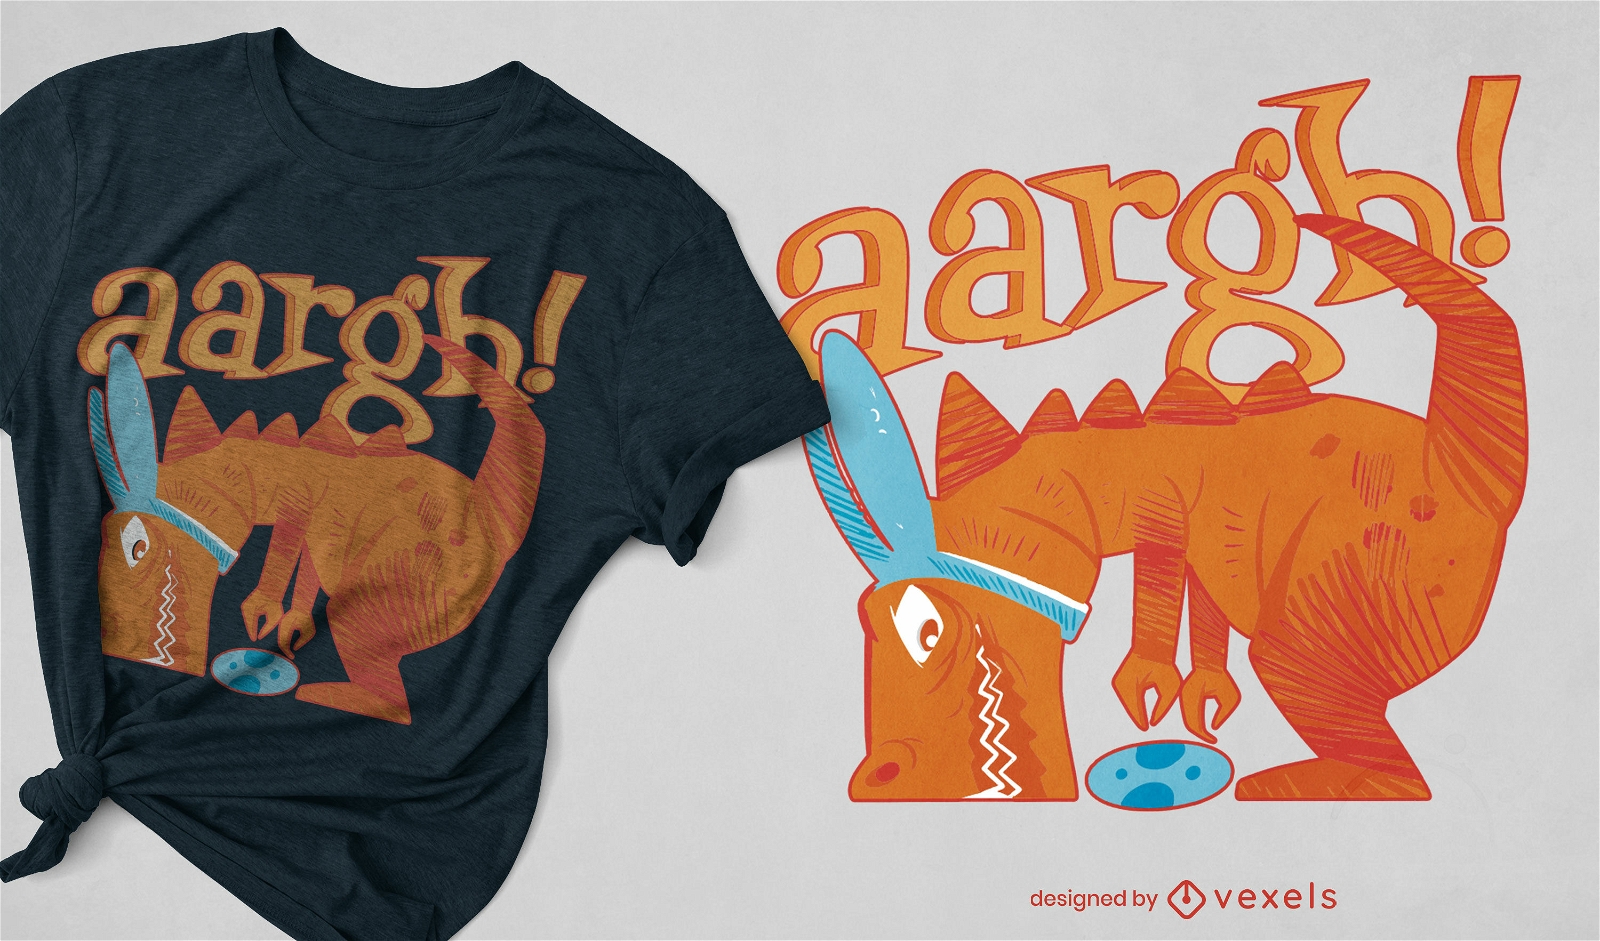
T-rex dinosaur with easter egg t-shirt design
Choose a folder
All favorites
Create new
Save
T-rex dinosaur with easter egg t-shirt design
Print ready
for Merch
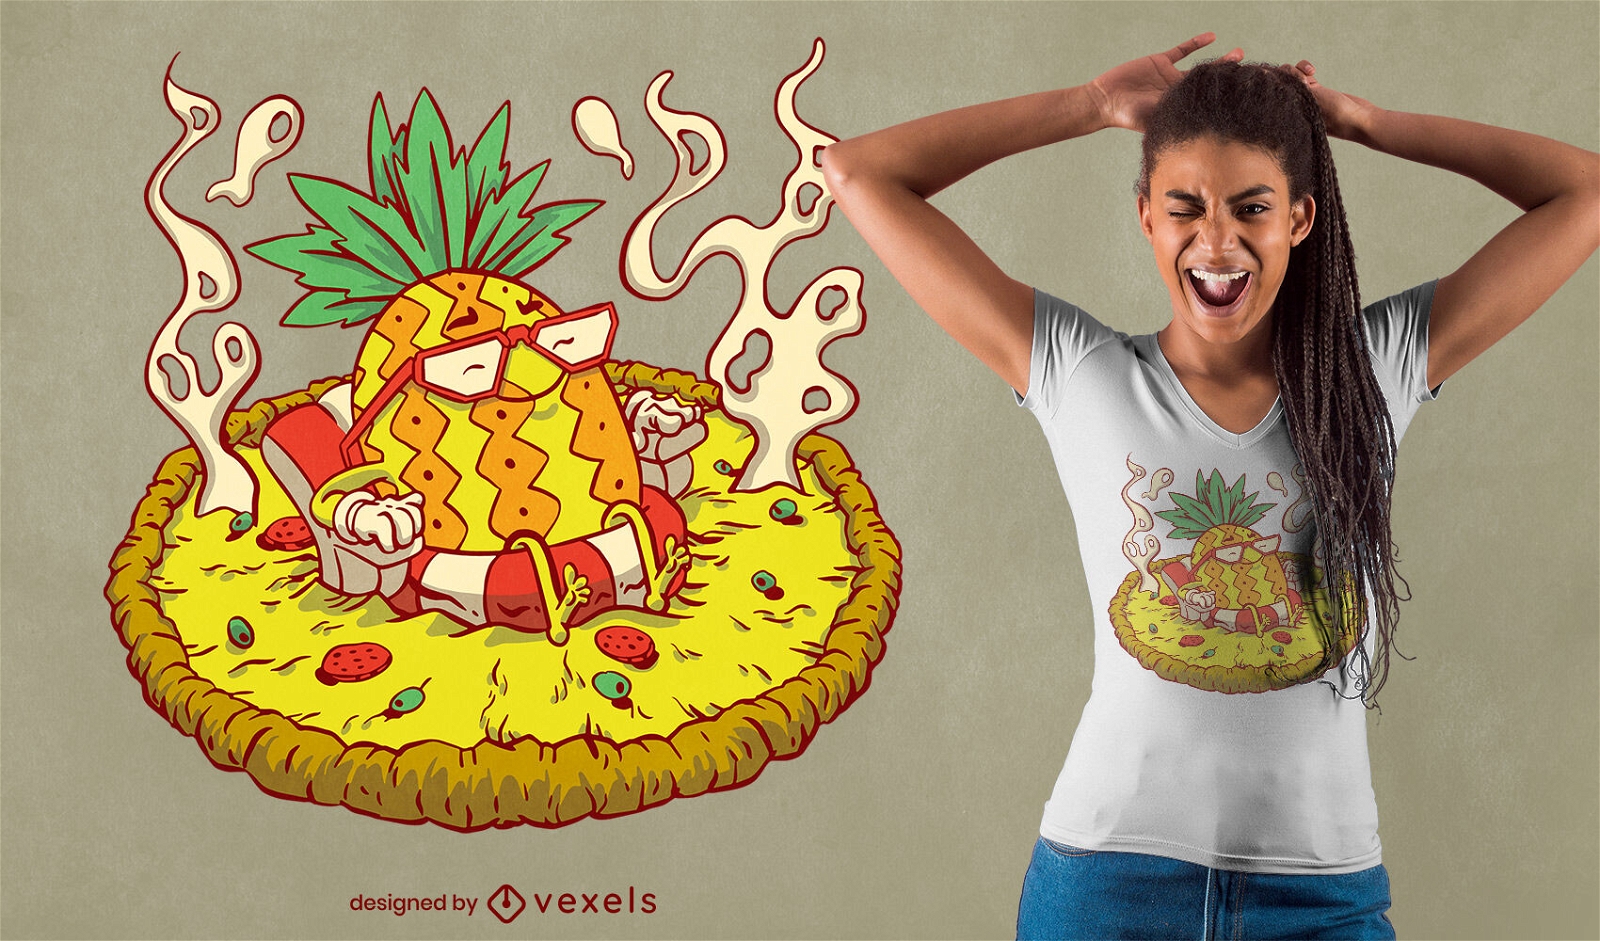
Pineapple chilling on pizza t-shirt design
Choose a folder
All favorites
Create new
Save
Pineapple chilling on pizza t-shirt design
Print ready
for Merch
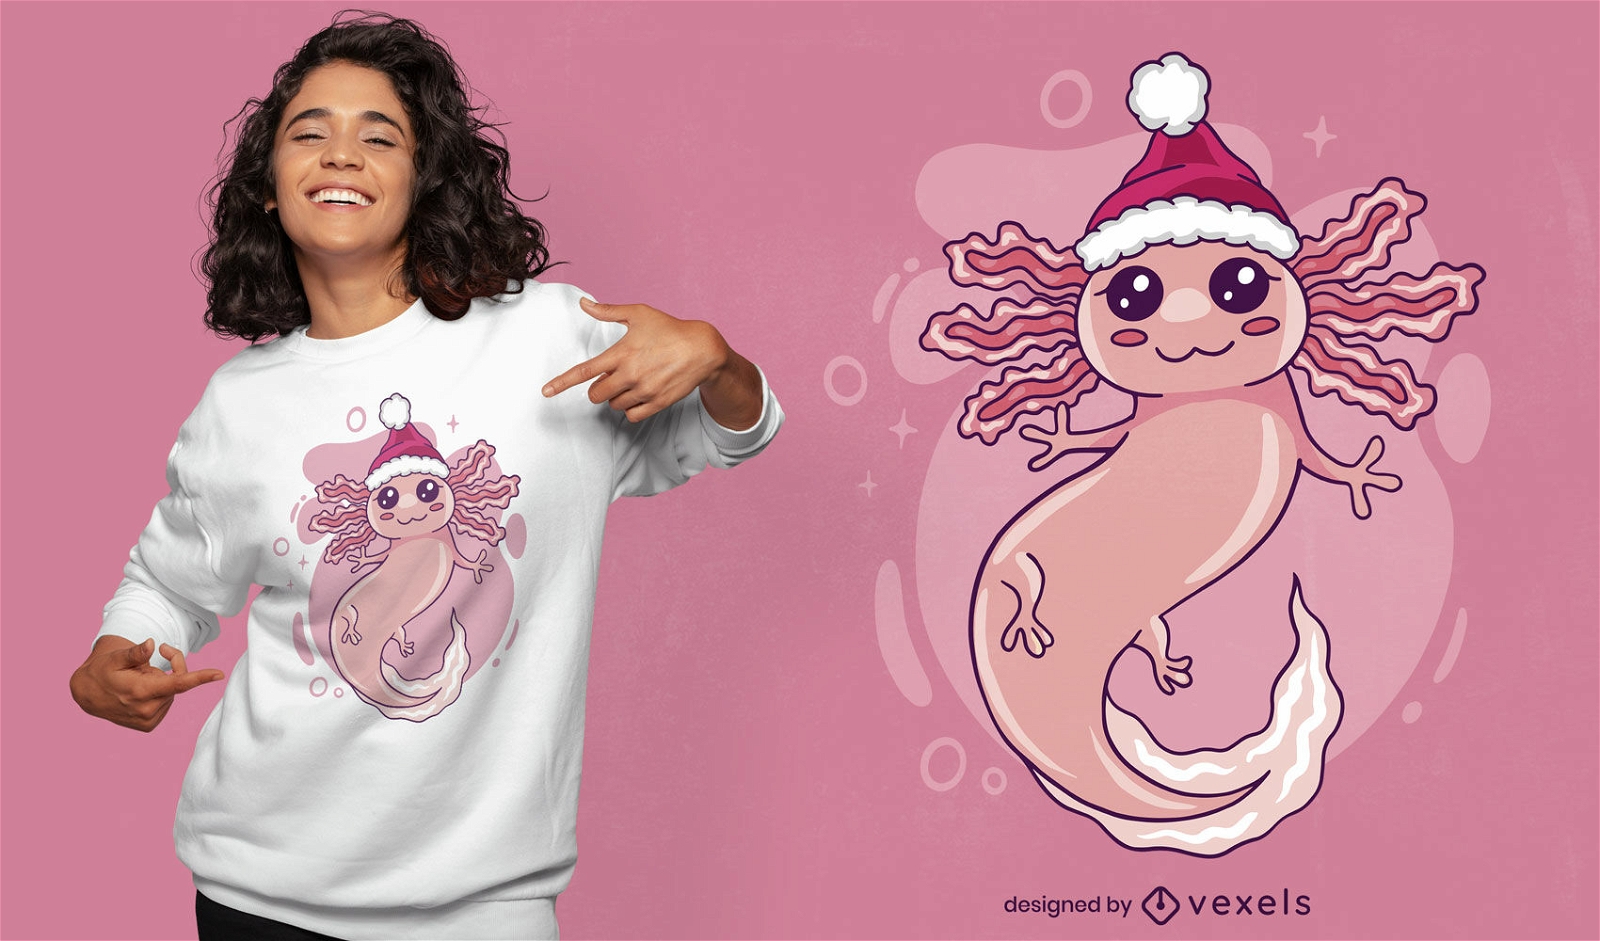
Axolotl in christmas hat t-shirt design
Choose a folder
All favorites
Create new
Save
Axolotl in christmas hat t-shirt design
Print ready
for Merch
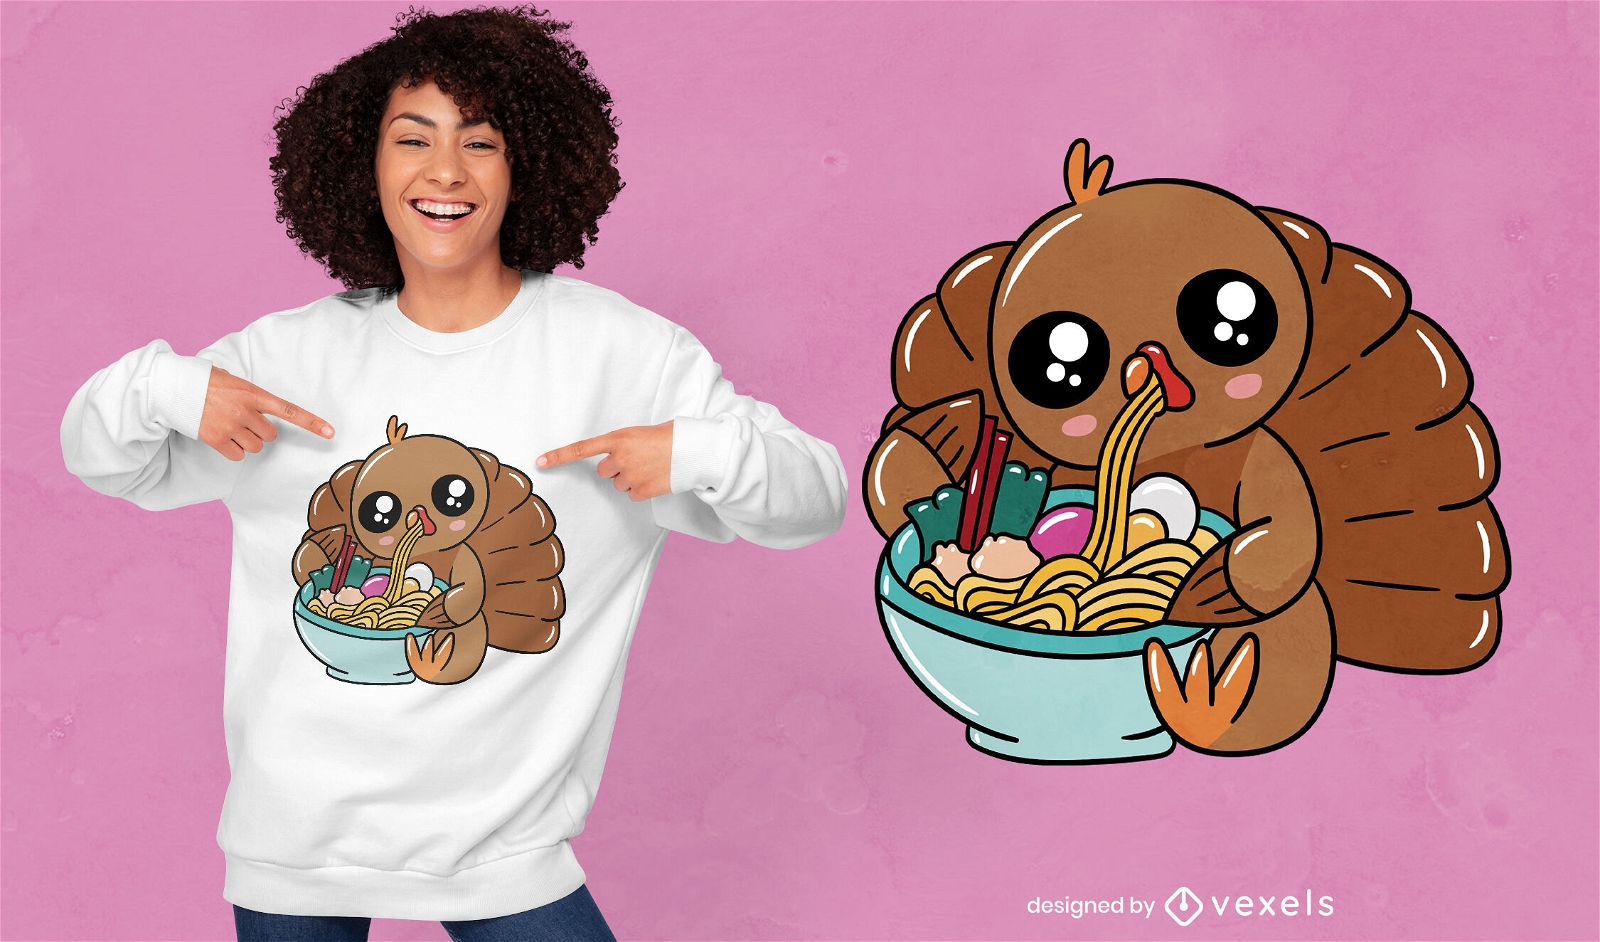
Kawaii turkey animal eating ramen t-shirt design
Choose a folder
All favorites
Create new
Save
Kawaii turkey animal eating ramen t-shirt design
Print ready
for Merch
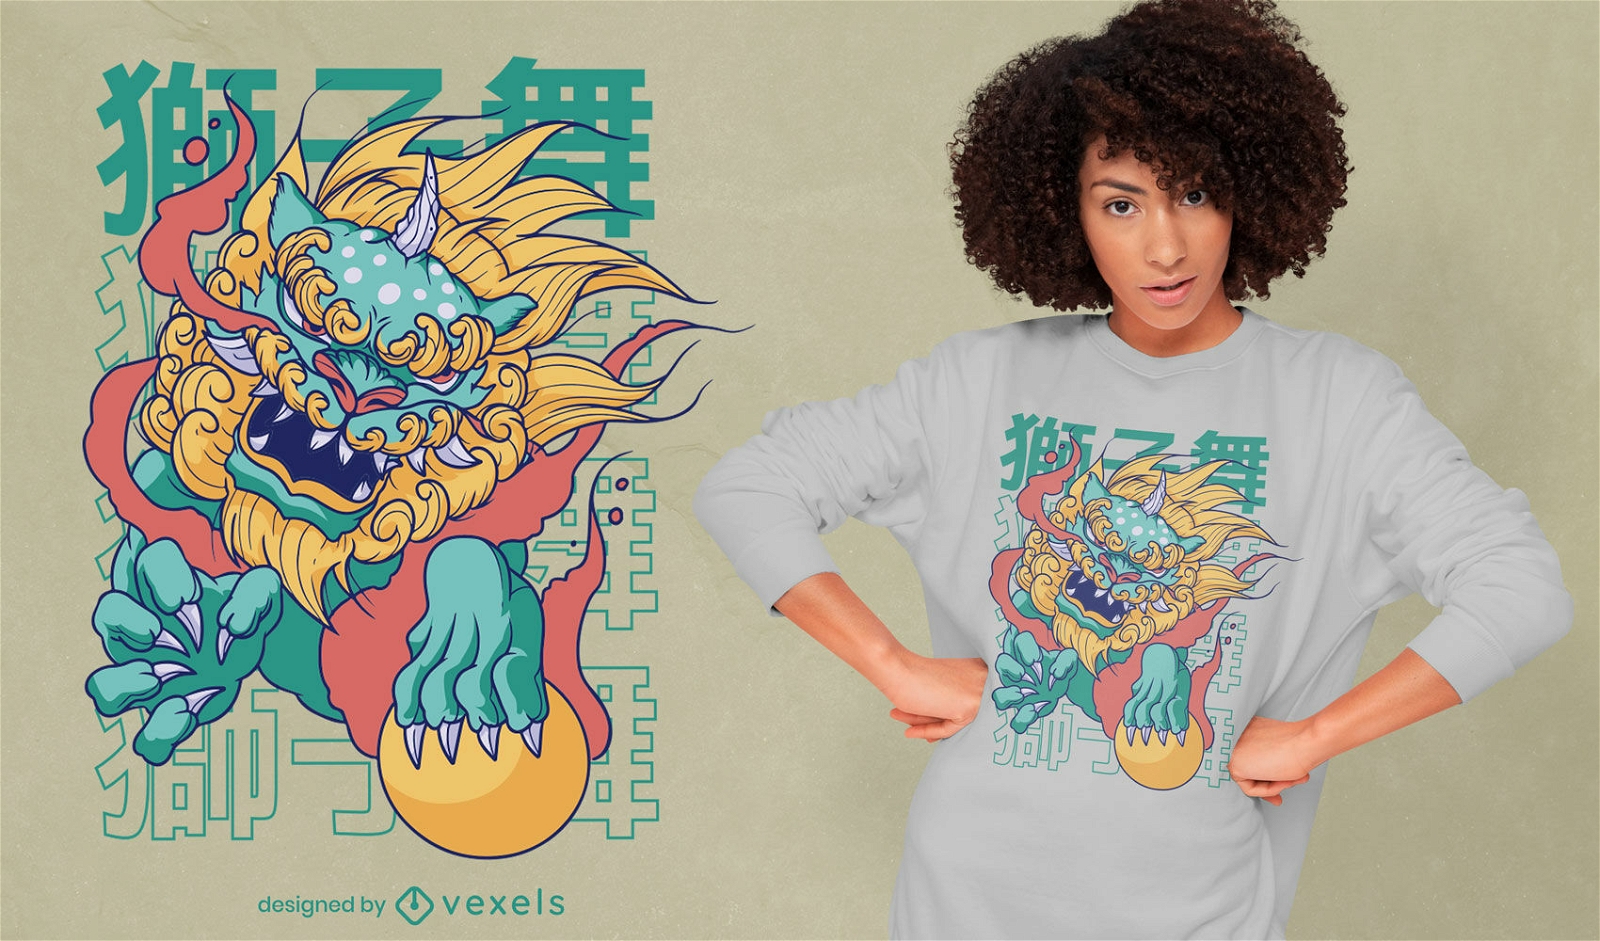
Chinese dog dragon t-shirt design
Choose a folder
All favorites
Create new
Save
Chinese dog dragon t-shirt design
Print ready
for Merch
Drone crashing quote t-shirt design
Choose a folder
All favorites
Create new
Save
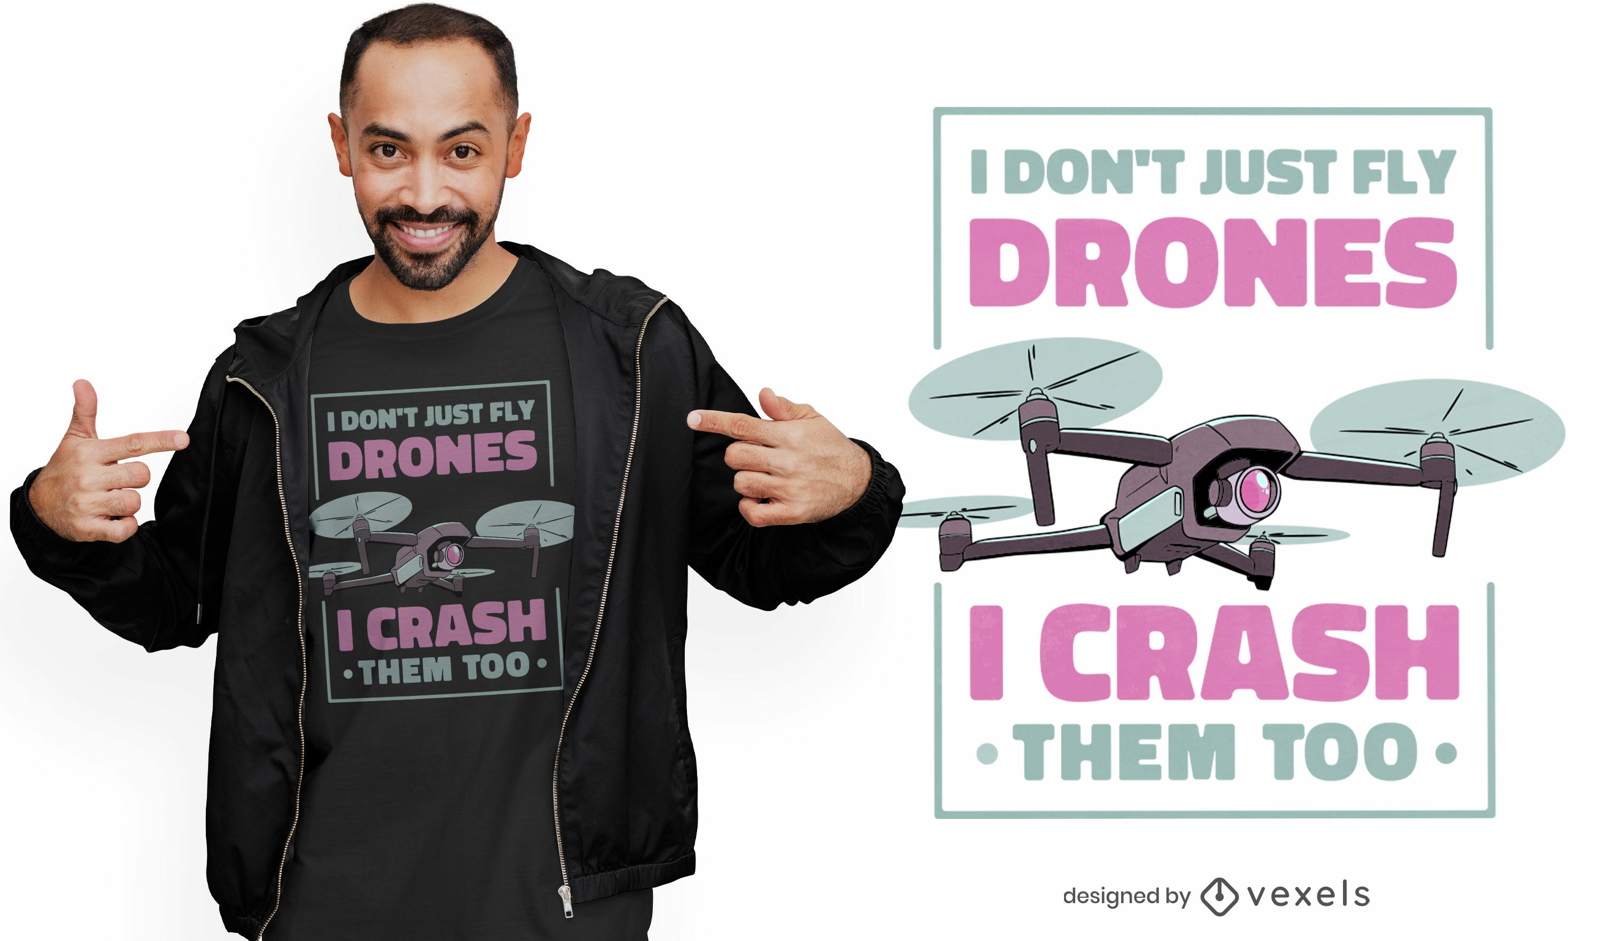
Drone crashing quote t-shirt design
Print ready
for Merch
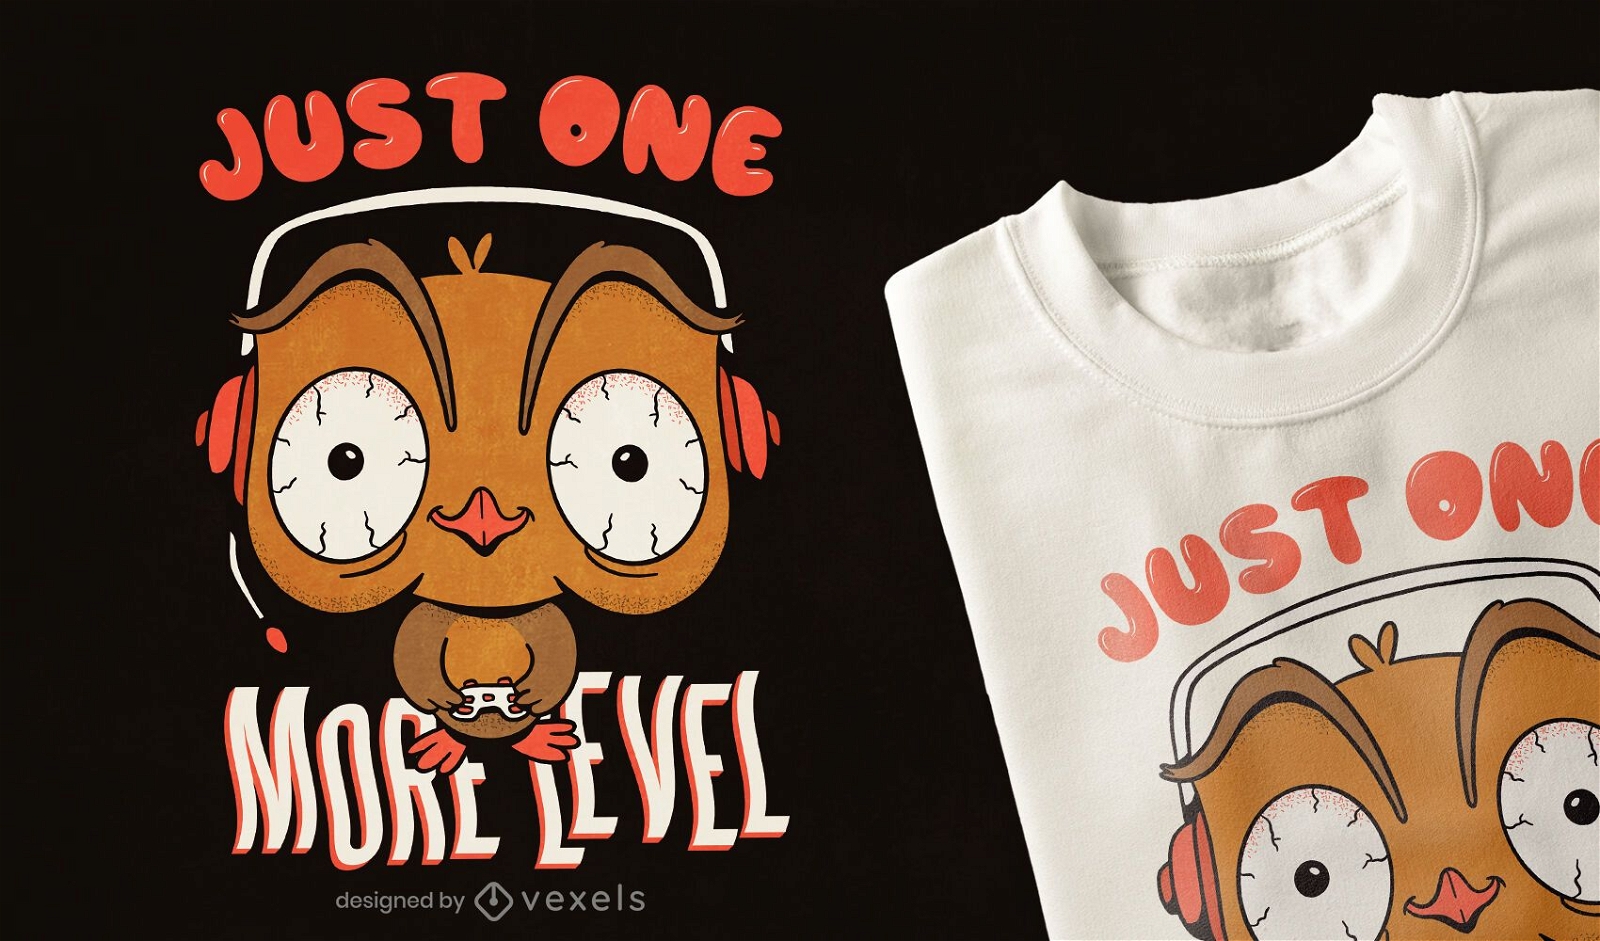
One more level t-shirt design
Choose a folder
All favorites
Create new
Save
One more level t-shirt design
Editable text
Print ready
for Merch
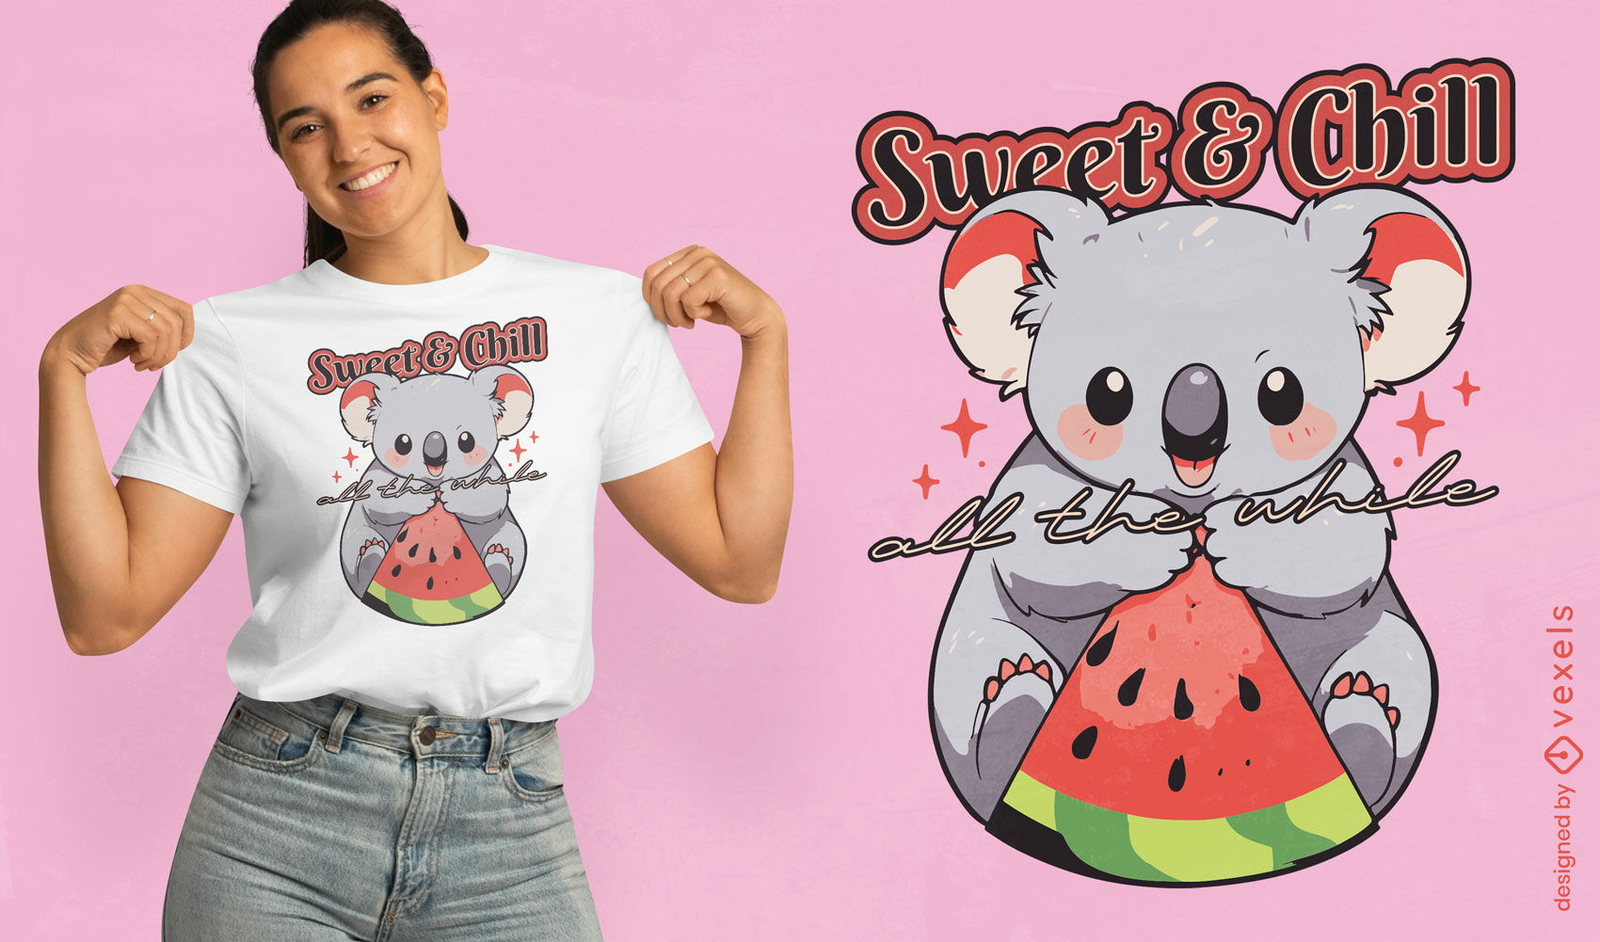
Sweet & Chill koala t-shirt design
Choose a folder
All favorites
Create new
Save
Sweet & Chill koala t-shirt design
Editable text
Print ready
for Merch
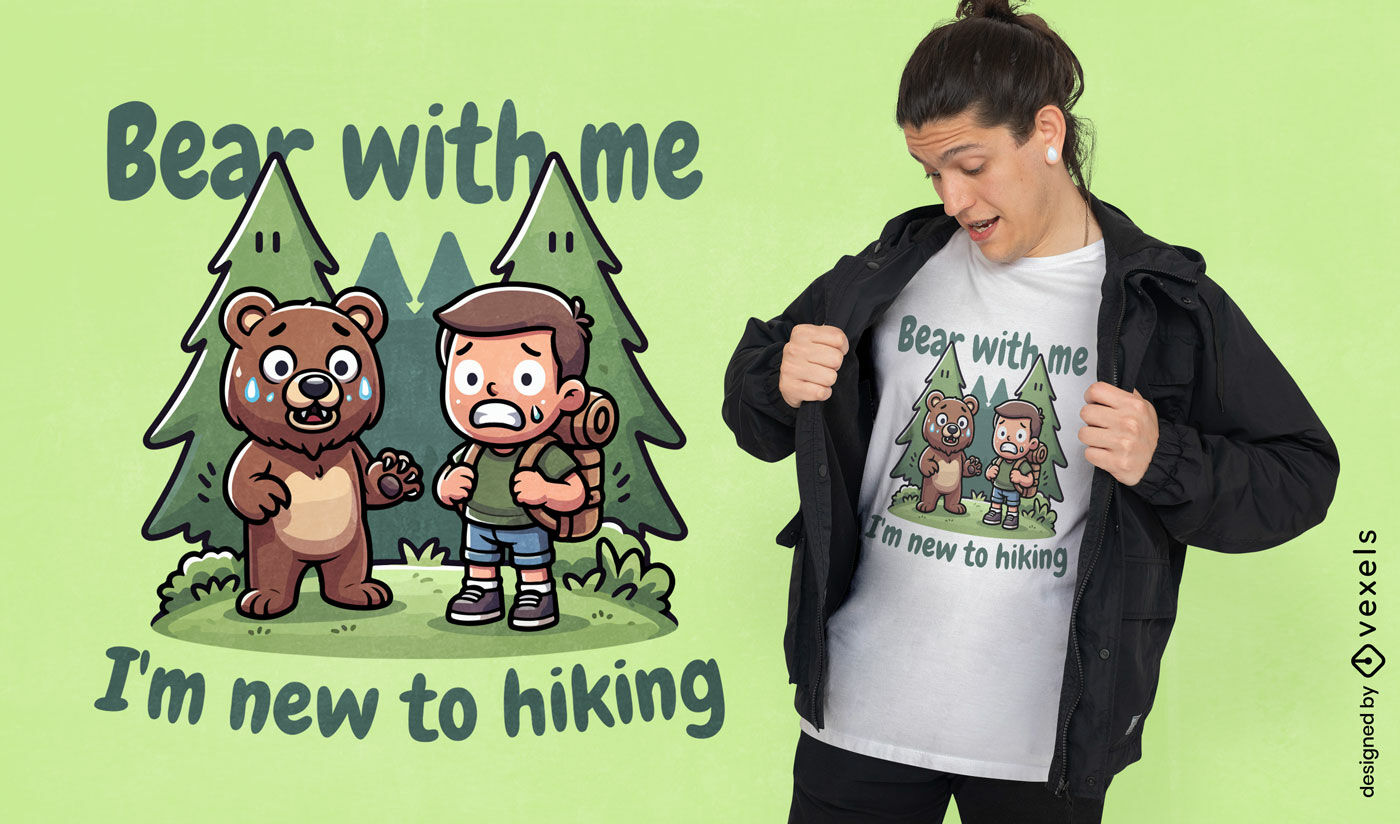
Hiking bear pun t-shirt design
Choose a folder
All favorites
Create new
Save
Hiking bear pun t-shirt design
Print ready
for Merch
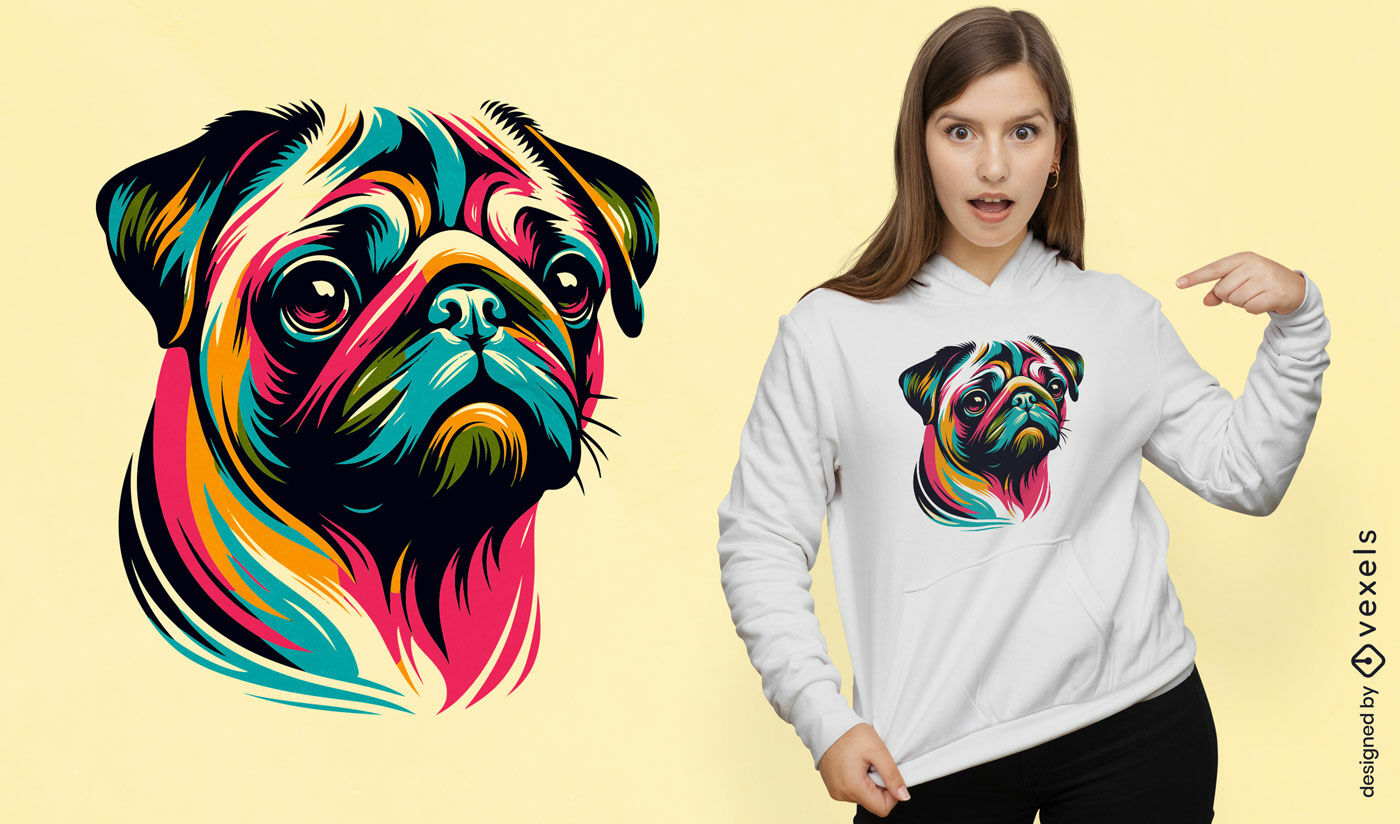
Pop art pug t-shirt design
Choose a folder
All favorites
Create new
Save
Pop art pug t-shirt design
Print ready
for Merch
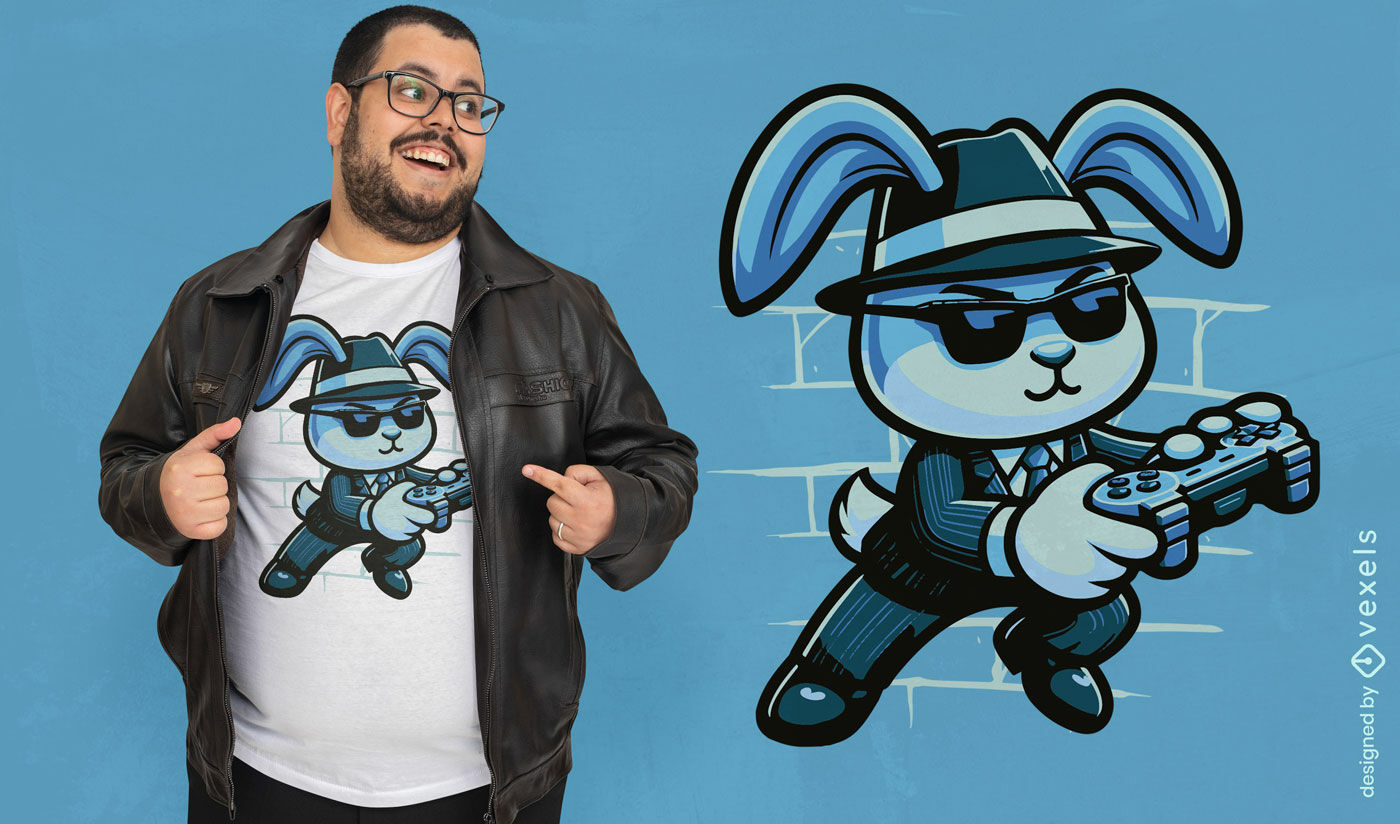
Gamer bunny cartoon t-shirt design
Choose a folder
All favorites
Create new
Save
Gamer bunny cartoon t-shirt design
Print ready
for Merch
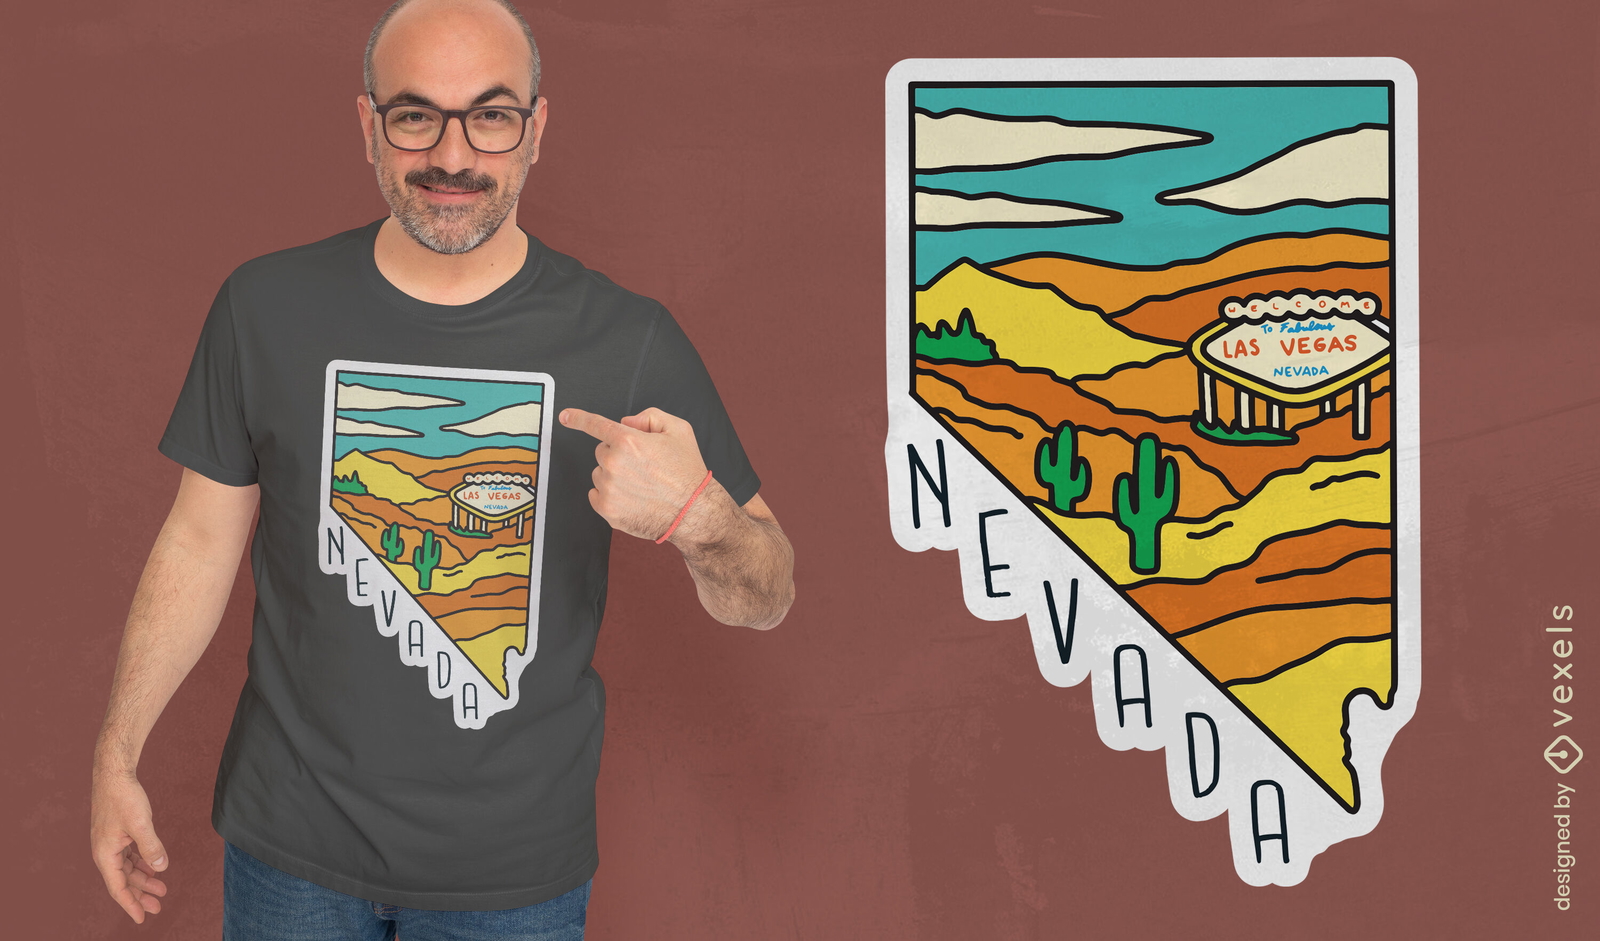
Nevada state t-shirt design
Choose a folder
All favorites
Create new
Save
Nevada state t-shirt design
Print ready
for Merch
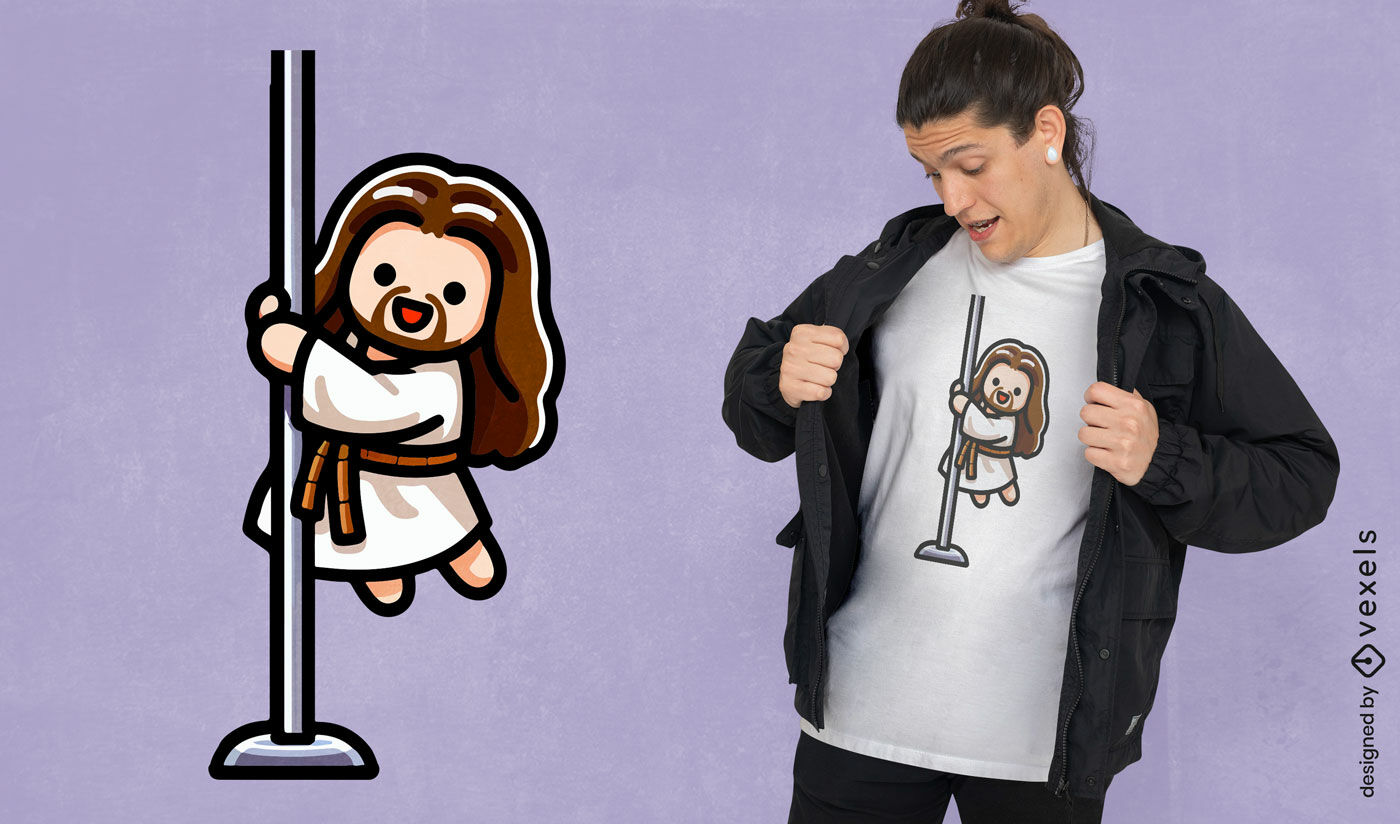
Cute Jesus pole dancing t-shirt design
Choose a folder
All favorites
Create new
Save
Cute Jesus pole dancing t-shirt design
Editable text
Print ready
for Merch
Spooky baseball mummy t-shirt design
Choose a folder
All favorites
Create new
Save
Spooky baseball mummy t-shirt design
Editable text
Print ready
for Merch
Smile monster t-shirt design
Choose a folder
All favorites
Create new
Save
Smile monster t-shirt design
Print ready
for Merch
Tiger camouglage foliage t-shirt design
Choose a folder
All favorites
Create new
Save
Tiger camouglage foliage t-shirt design
Print ready
for Merch
Festive Christmas tree pole dance t-shirt design
Choose a folder
All favorites
Create new
Save
Festive Christmas tree pole dance t-shirt design
Editable text
Print ready
for Merch
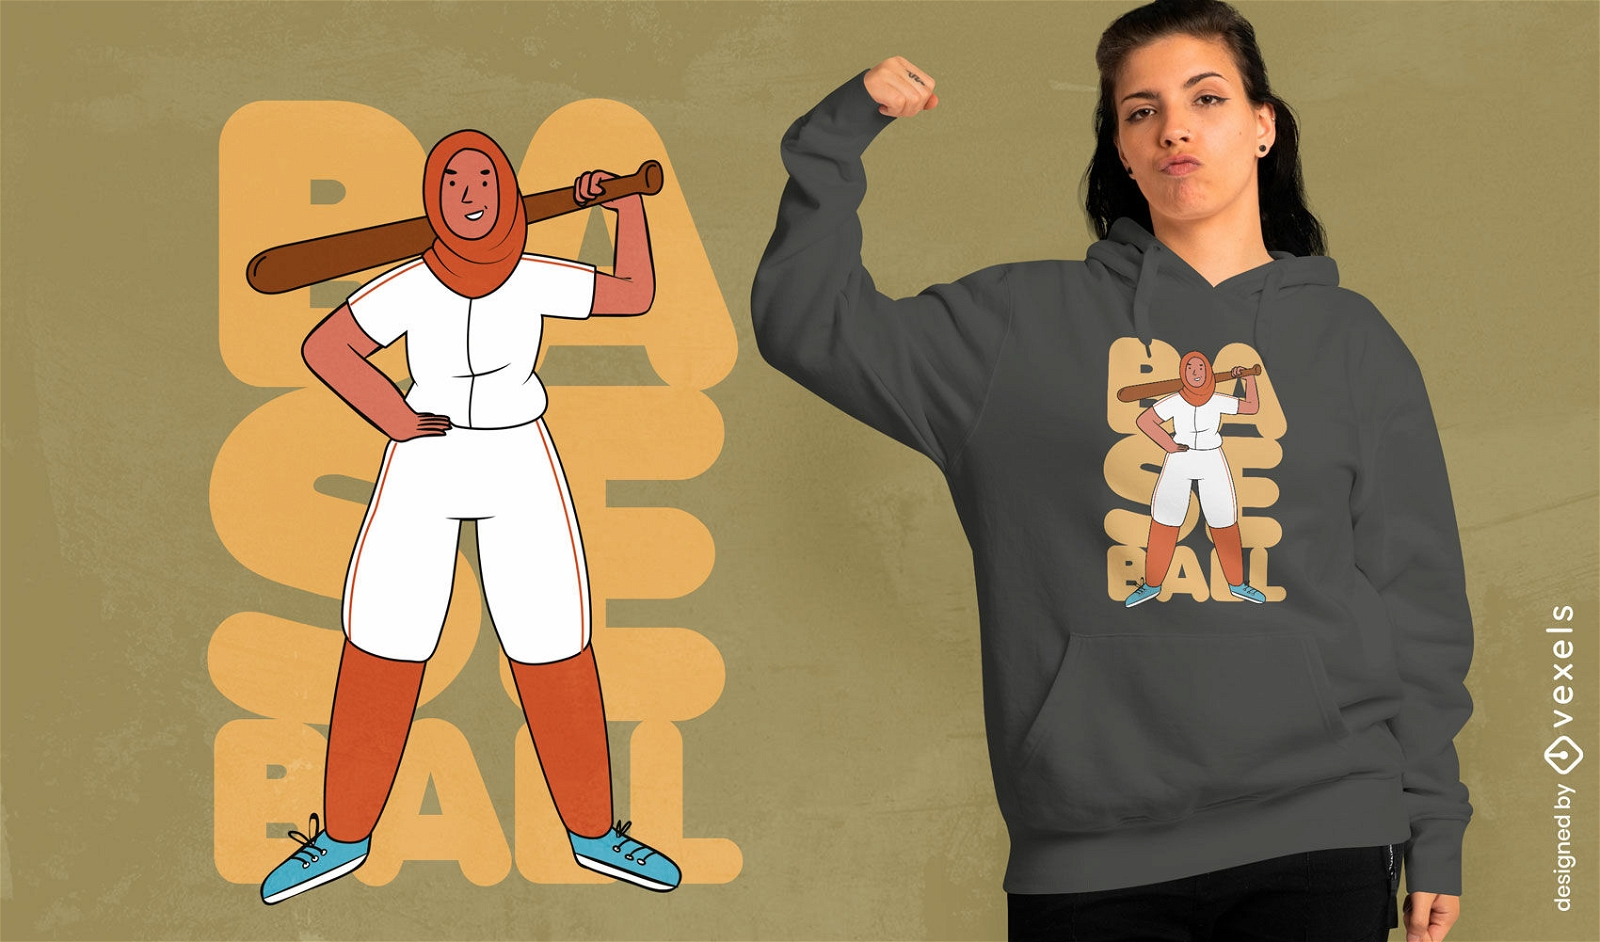
Baseball hijab girl t-shirt design
Choose a folder
All favorites
Create new
Save
Baseball hijab girl t-shirt design
Print ready
for Merch
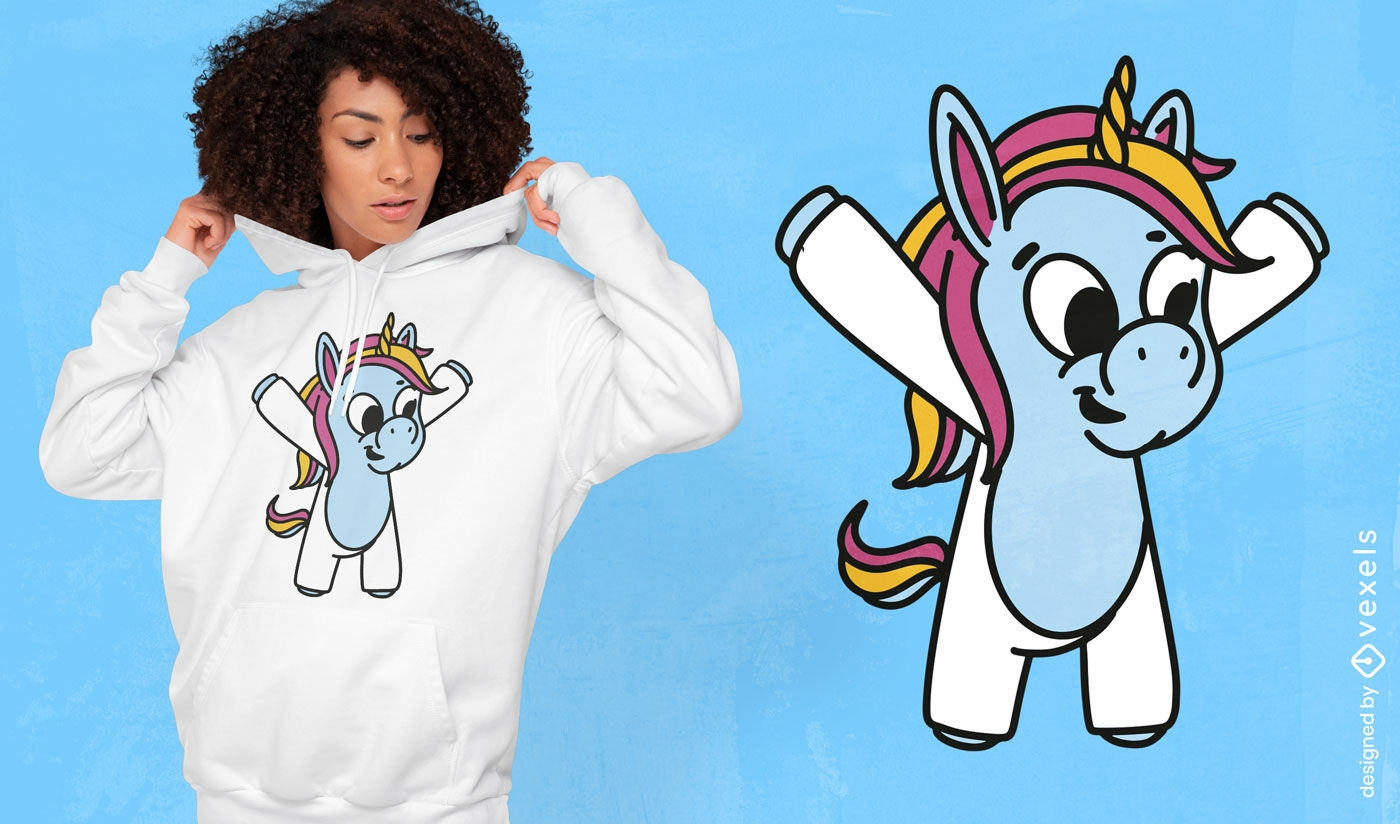
Unicorn with arms up t-shirt design
Choose a folder
All favorites
Create new
Save
Unicorn with arms up t-shirt design
Print ready
for Merch
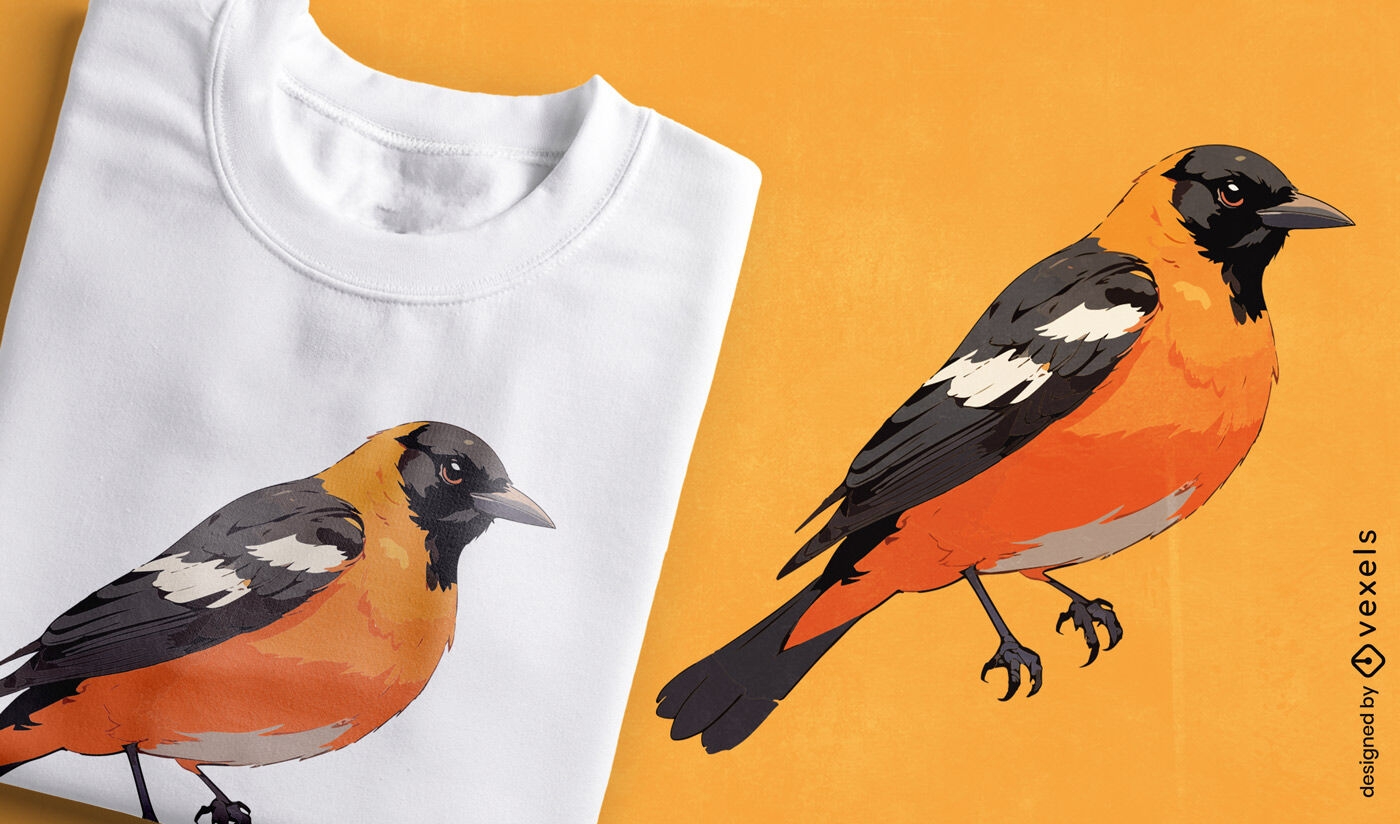
Orange bird t-shirt design
Choose a folder
All favorites
Create new
Save
Orange bird t-shirt design
Boost Your Business
With The Leading Graphic Platform For Merch.
SEE PLANS
Next
of 720
prev page
next page