Design Library
New Merch Designs
T-Shirts
Vectors
Trending Merch Designs
PNGs & SVGs
Mockups
T-Shirt PSD Templates
Explore Designs
KDP Designs
Posters
Mugs
Phone Cases
Tote Bags
Pillows
Design Tools
Merch Designer
New!
Mockup Generator
AI Design Generator
Image Vectorizer
Quote Generator
T-Shirt Maker (Old)
Resources
Merch Digest
Blog
Help Center
Learn About Merch
Feedback
Corporate Solutions
Enterprise
API Access
Pricing
Loading...
Sign Up
Login
Merch Vectors
grafico
Design Library
New Merch Designs
T-Shirts
Vectors
Trending Merch Designs
PNGs & SVGs
Mockups
T-Shirt PSD Templates
Explore Designs
KDP Designs
Posters
Mugs
Phone Cases
Tote Bags
Pillows
Design Tools
Merch Designer
New!
Mockup Generator
AI Design Generator
Image Vectorizer
Quote Generator
T-Shirt Maker (Old)
Resources
Merch Digest
Blog
Help Center
Learn About Merch
Feedback
Corporate Solutions
Enterprise
API Access
PLANS
Merch Vectors
grafico
35988 grafico Vector Designs for T-Shirts and merch
Download & buy editable grafico AI Vector Graphics Designs for T shirts, Phone Cases, Book Covers and other Merch
Sort by
Most relevant
Sponsored results by
Get 15% off with code: VEXELS15
Show more
Editable text
Print ready
for Merch
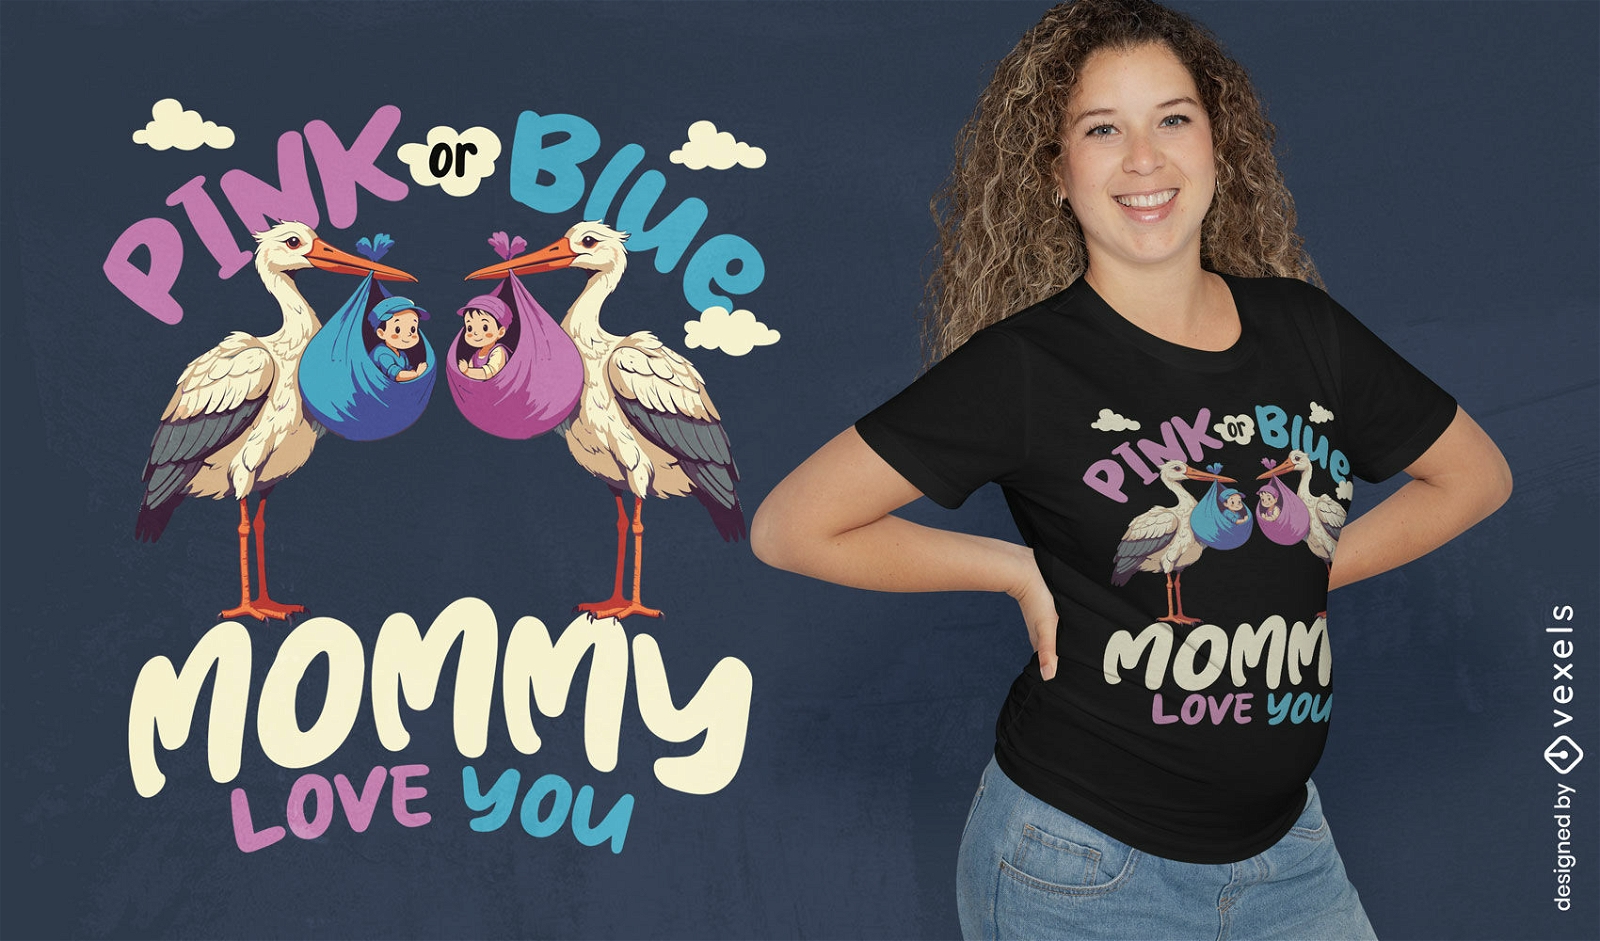
Pink or blue stork cartoon t-shirt design
Choose a folder
All favorites
Create new
Save
Pink or blue stork cartoon t-shirt design
Print ready
for Merch
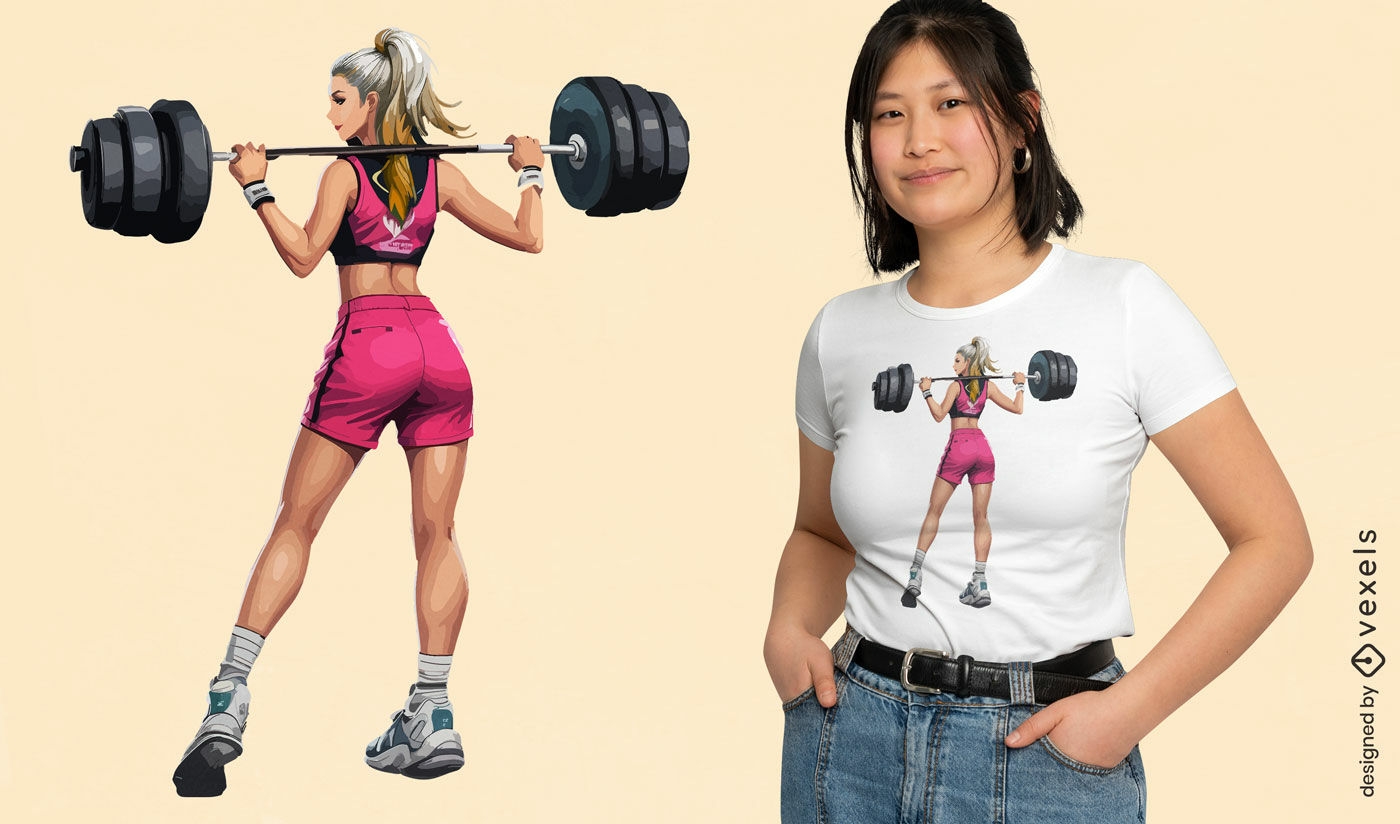
Athletic woman lifting weights t-shirt design
Choose a folder
All favorites
Create new
Save
Athletic woman lifting weights t-shirt design
Print ready
for Merch
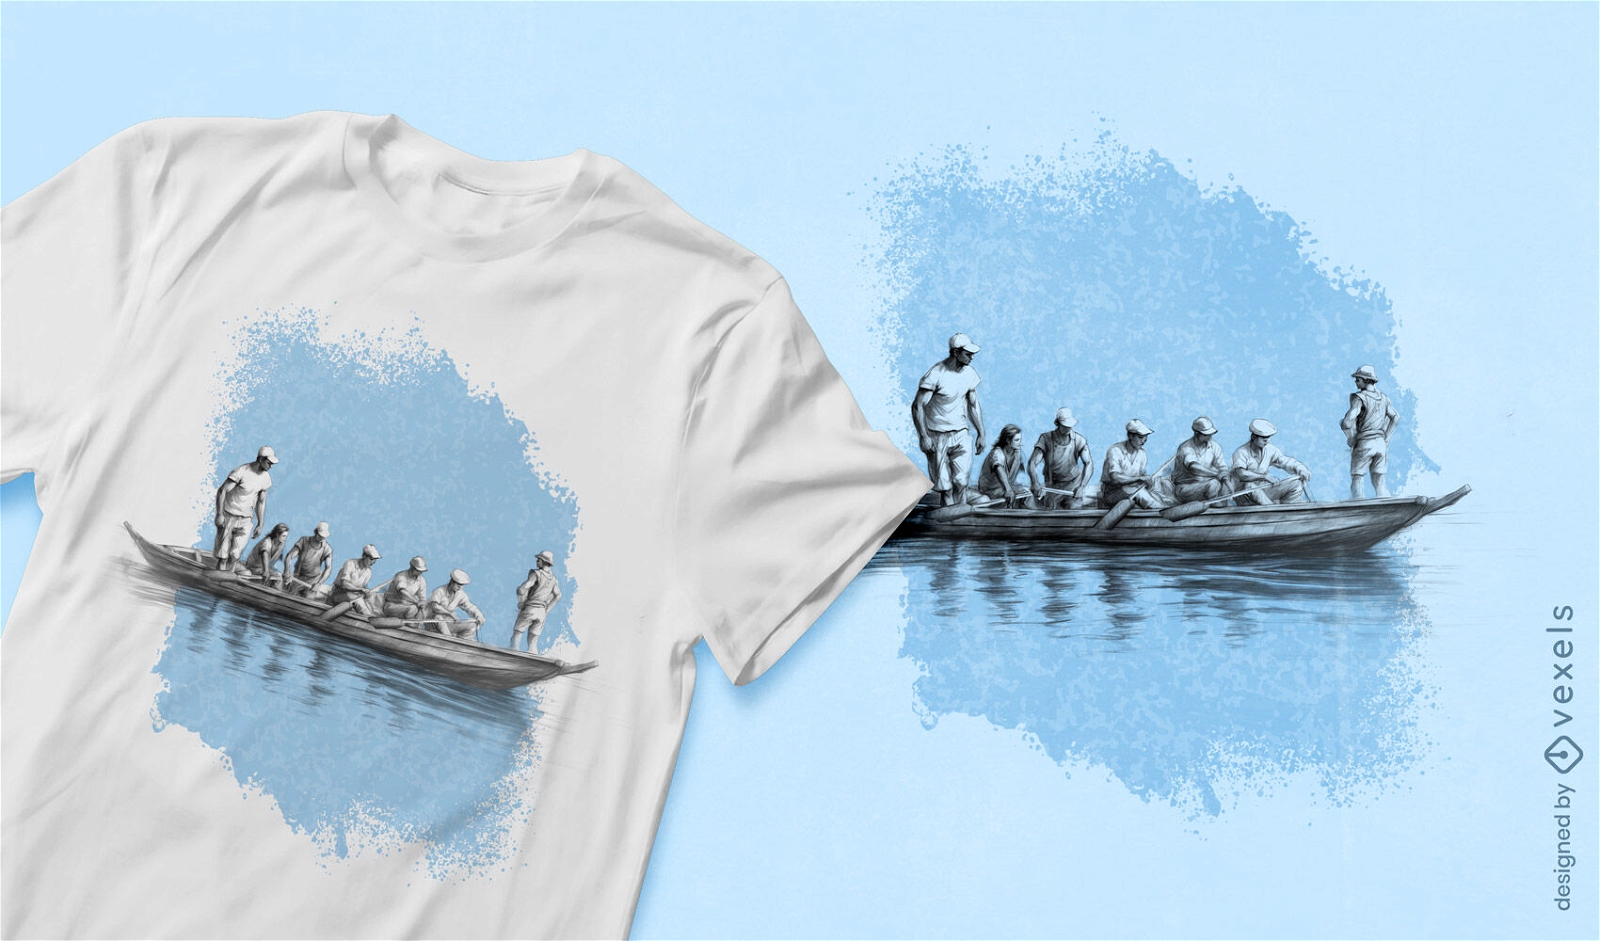
Boat sketch on t-shirt design
Choose a folder
All favorites
Create new
Save
Boat sketch on t-shirt design
Print ready
for Merch
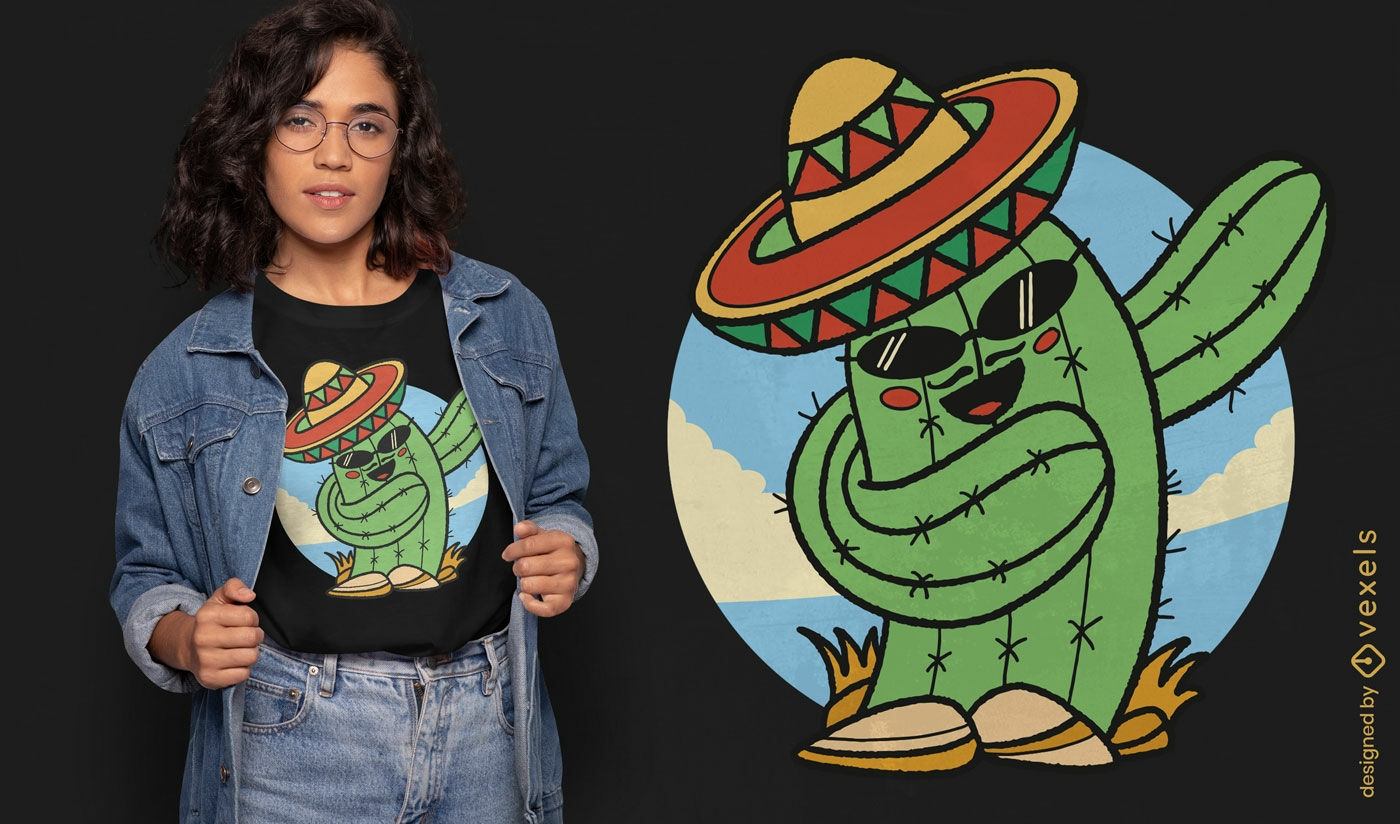
Cactus with sombrero t-shirt design
Choose a folder
All favorites
Create new
Save
Cactus with sombrero t-shirt design
Print ready
for Merch
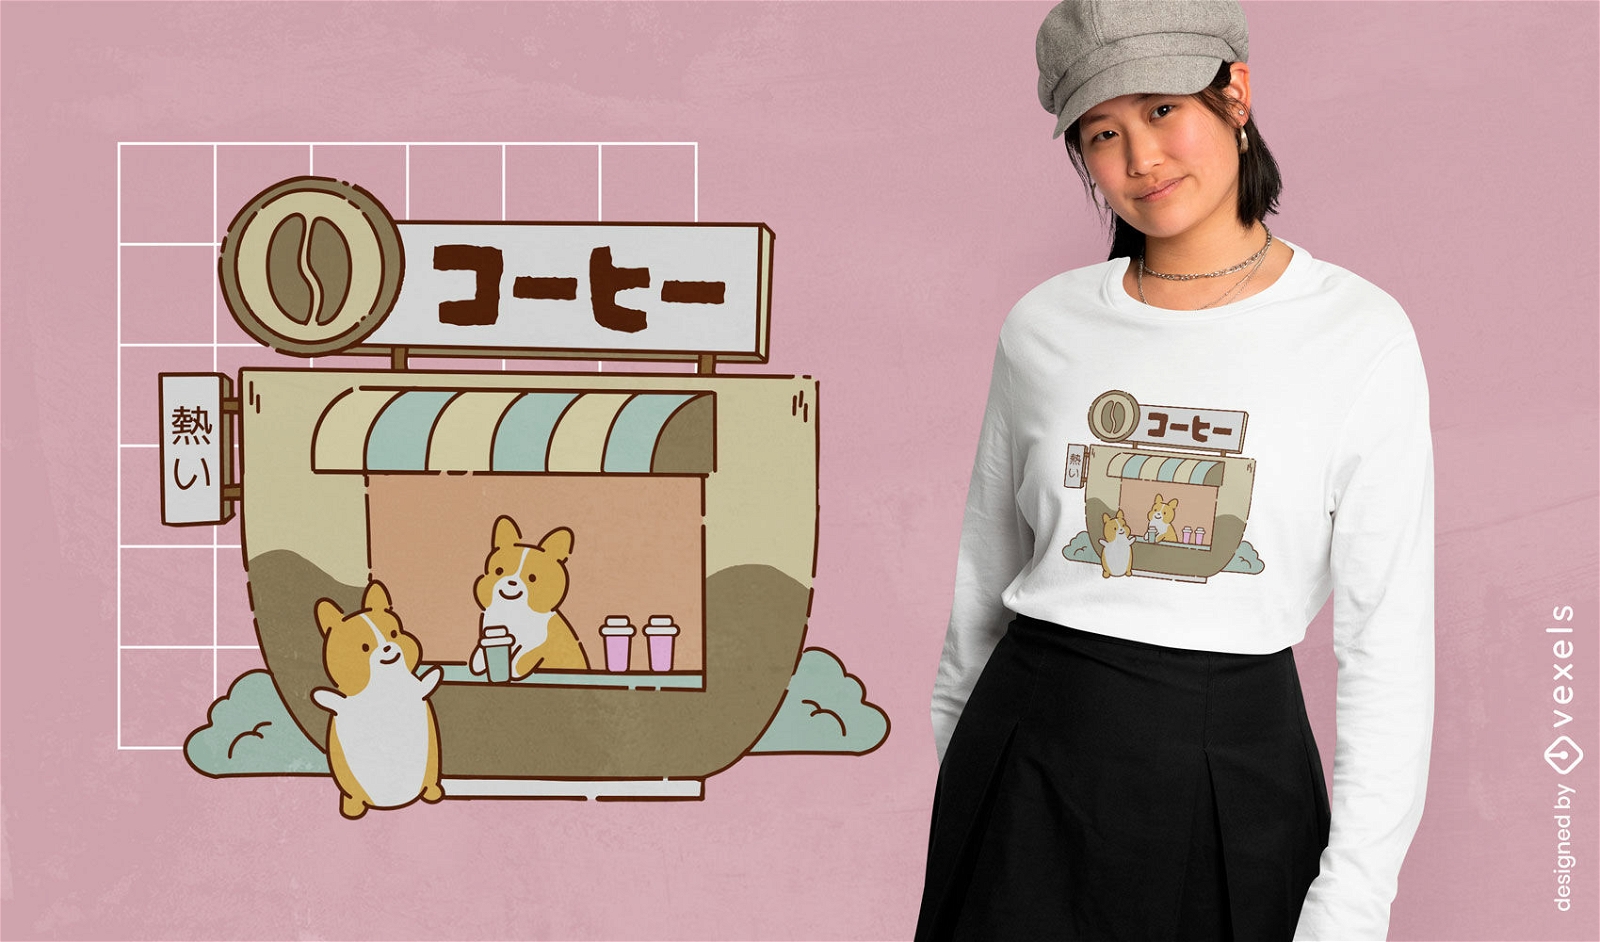
Corgi coffee shop t-shirt design
Choose a folder
All favorites
Create new
Save
Corgi coffee shop t-shirt design
Print ready
for Merch
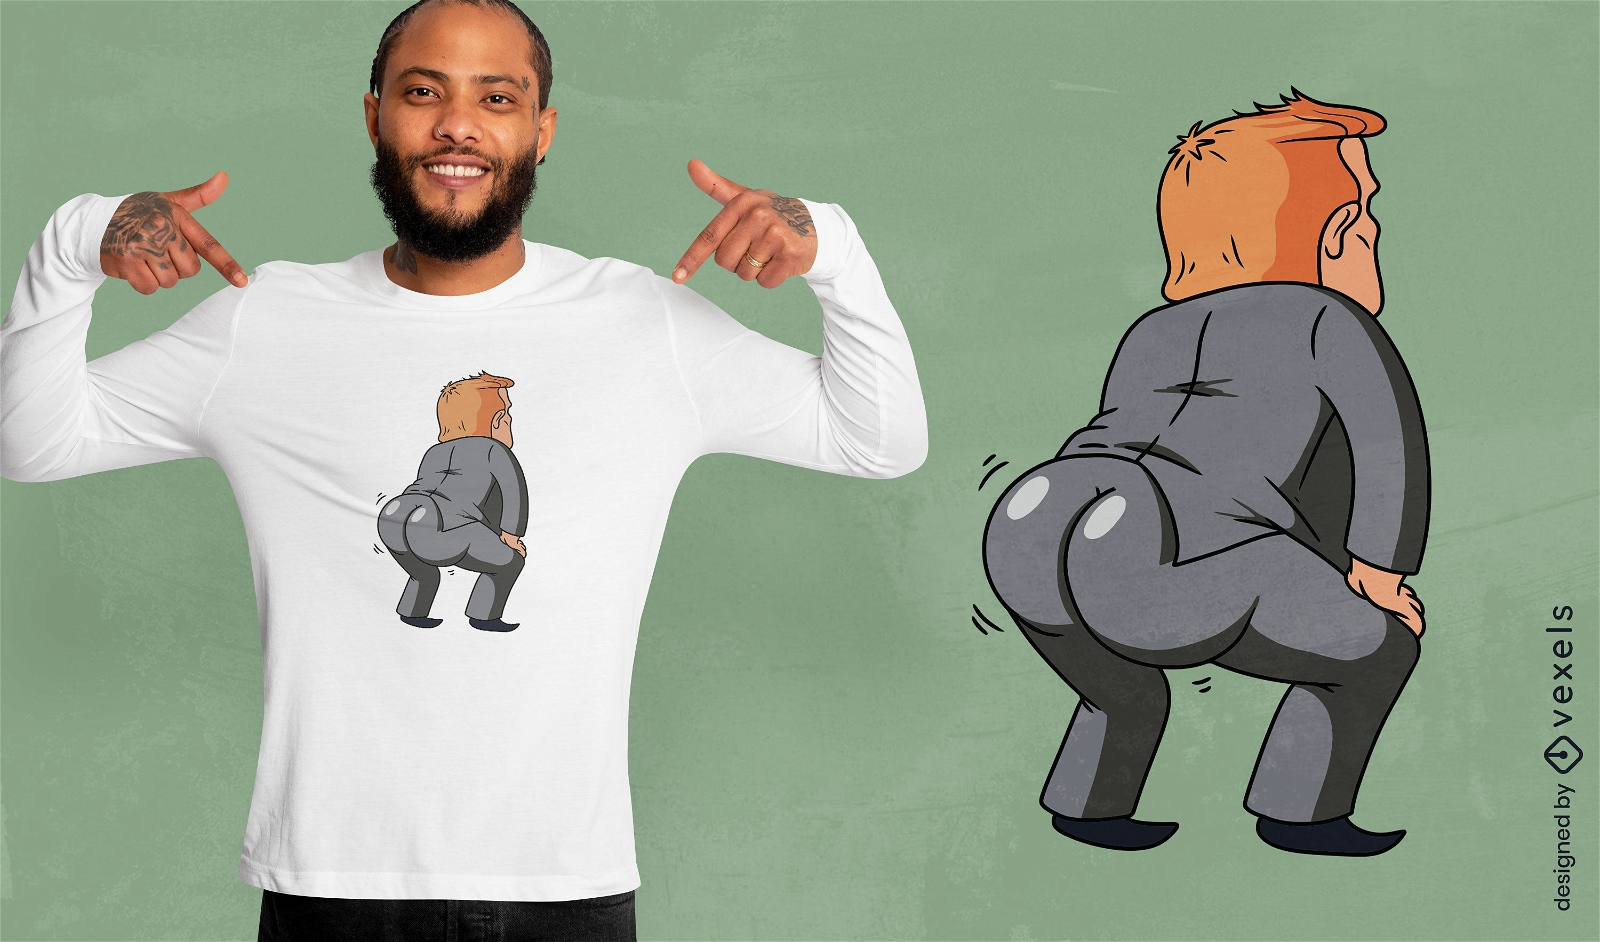
Political twerk t-shirt design
Choose a folder
All favorites
Create new
Save
Political twerk t-shirt design
Print ready
for Merch
Firefighter mouse t-shirt design
Choose a folder
All favorites
Create new
Save
Firefighter mouse t-shirt design
Print ready
for Merch
Cozy cookie and coffee t-shirt design
Choose a folder
All favorites
Create new
Save
Cozy cookie and coffee t-shirt design
Editable text
Print ready
for Merch
Soul collector grim reaper t-shirt design
Choose a folder
All favorites
Create new
Save
Soul collector grim reaper t-shirt design
Print ready
for Merch
Geometric mountain landscape t-shirt design
Choose a folder
All favorites
Create new
Save
Geometric mountain landscape t-shirt design
Editable text
Print ready
for Merch
A good day to read quote t-shirt design
Choose a folder
All favorites
Create new
Save
A good day to read quote t-shirt design
Editable text
Print ready
for Merch
Catfish fishing bade t-shirt design
Choose a folder
All favorites
Create new
Save
Catfish fishing bade t-shirt design
Editable text
Print ready
for Merch
Faith floral cross t-shirt design
Choose a folder
All favorites
Create new
Save
Faith floral cross t-shirt design
Editable text
Print ready
for Merch
Cruise ship in ocean watercolor t-shirt design
Choose a folder
All favorites
Create new
Save
Cruise ship in ocean watercolor t-shirt design
Print ready
for Merch
Welder man on fire working t-shirt design
Choose a folder
All favorites
Create new
Save
Welder man on fire working t-shirt design
Editable text
Print ready
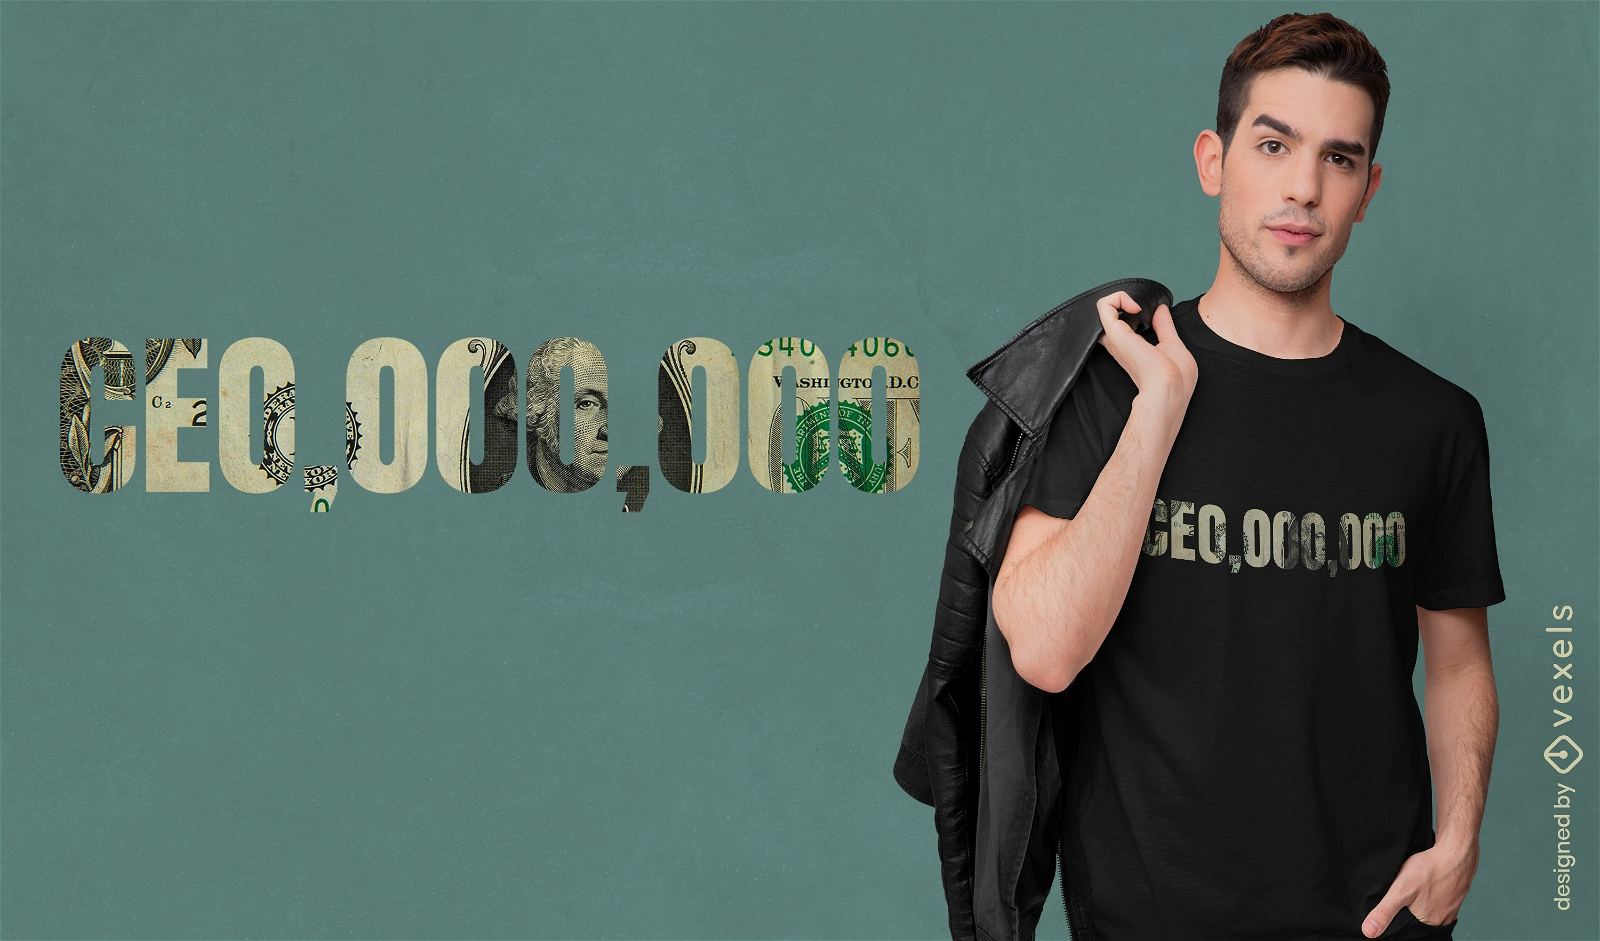
for Merch
CEO money t-shirt design
Choose a folder
All favorites
Create new
Save
CEO money t-shirt design
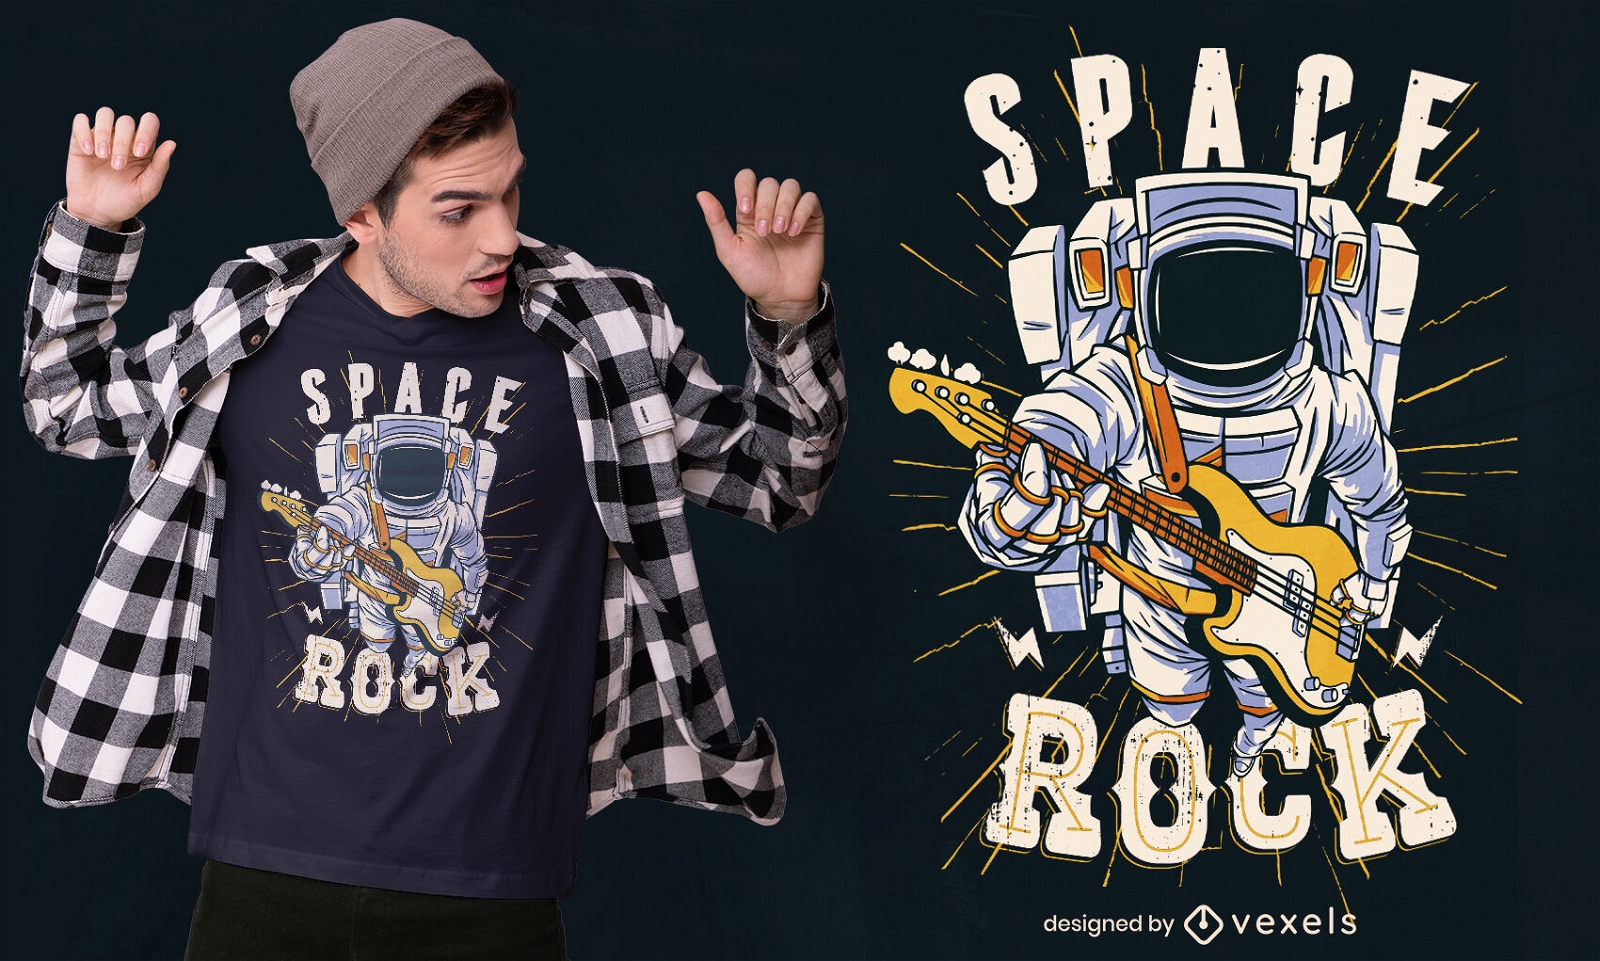
Print ready
for Merch
Rocker astronaut t-shirt design
Choose a folder
All favorites
Create new
Save
Rocker astronaut t-shirt design
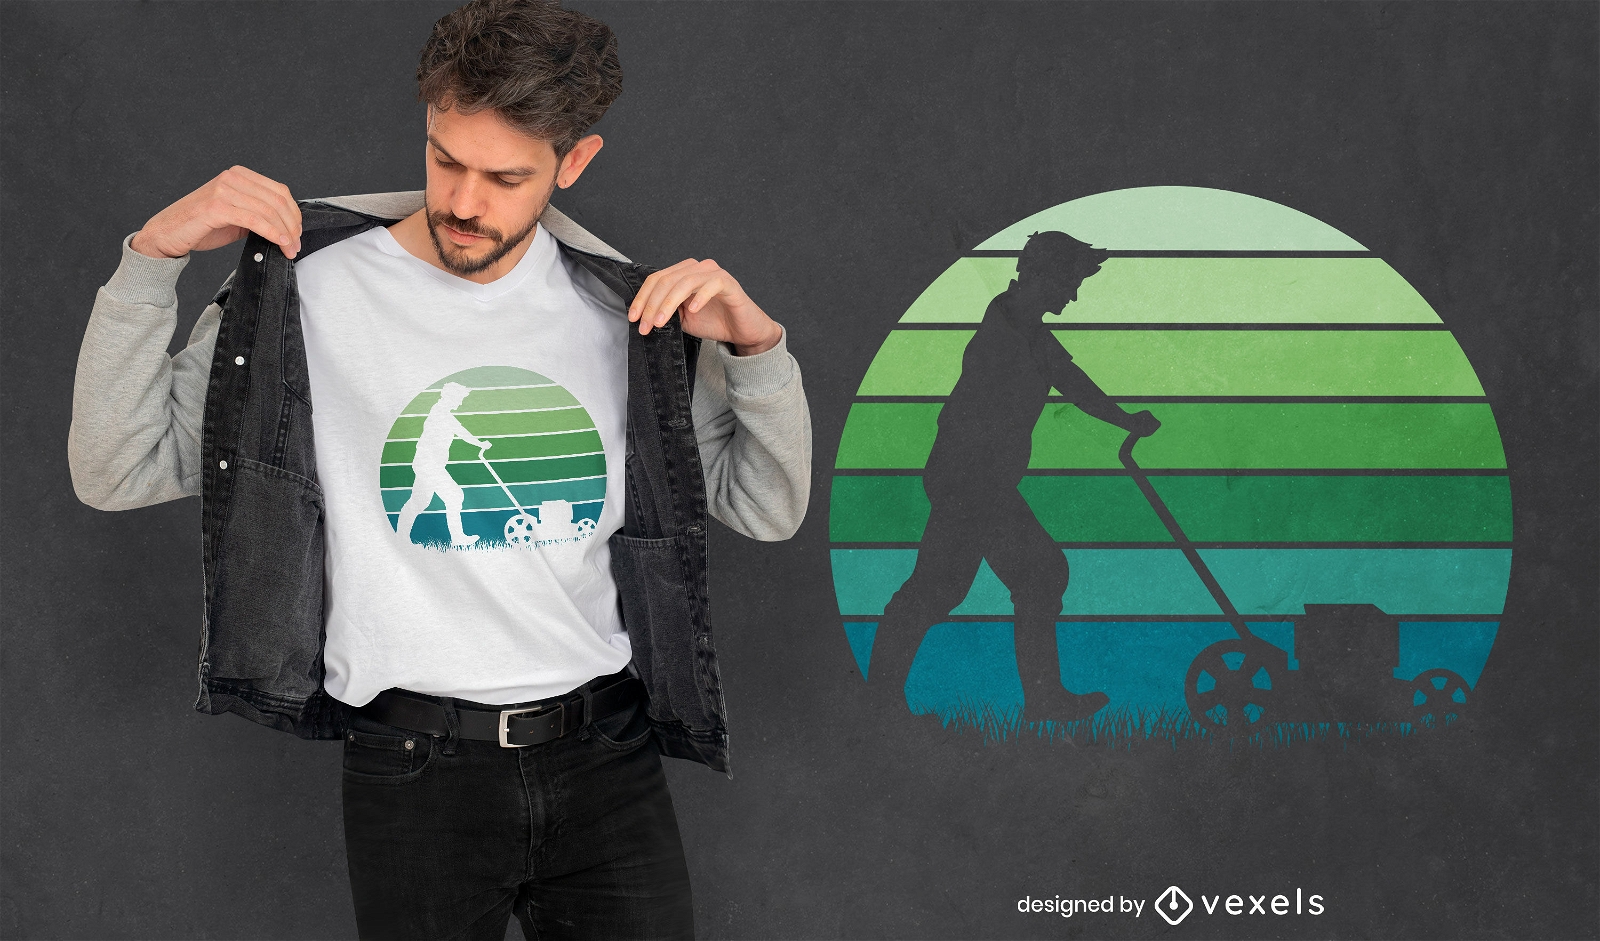
Print ready
for Merch
Mower silhouette t-shirt design
Choose a folder
All favorites
Create new
Save
Mower silhouette t-shirt design
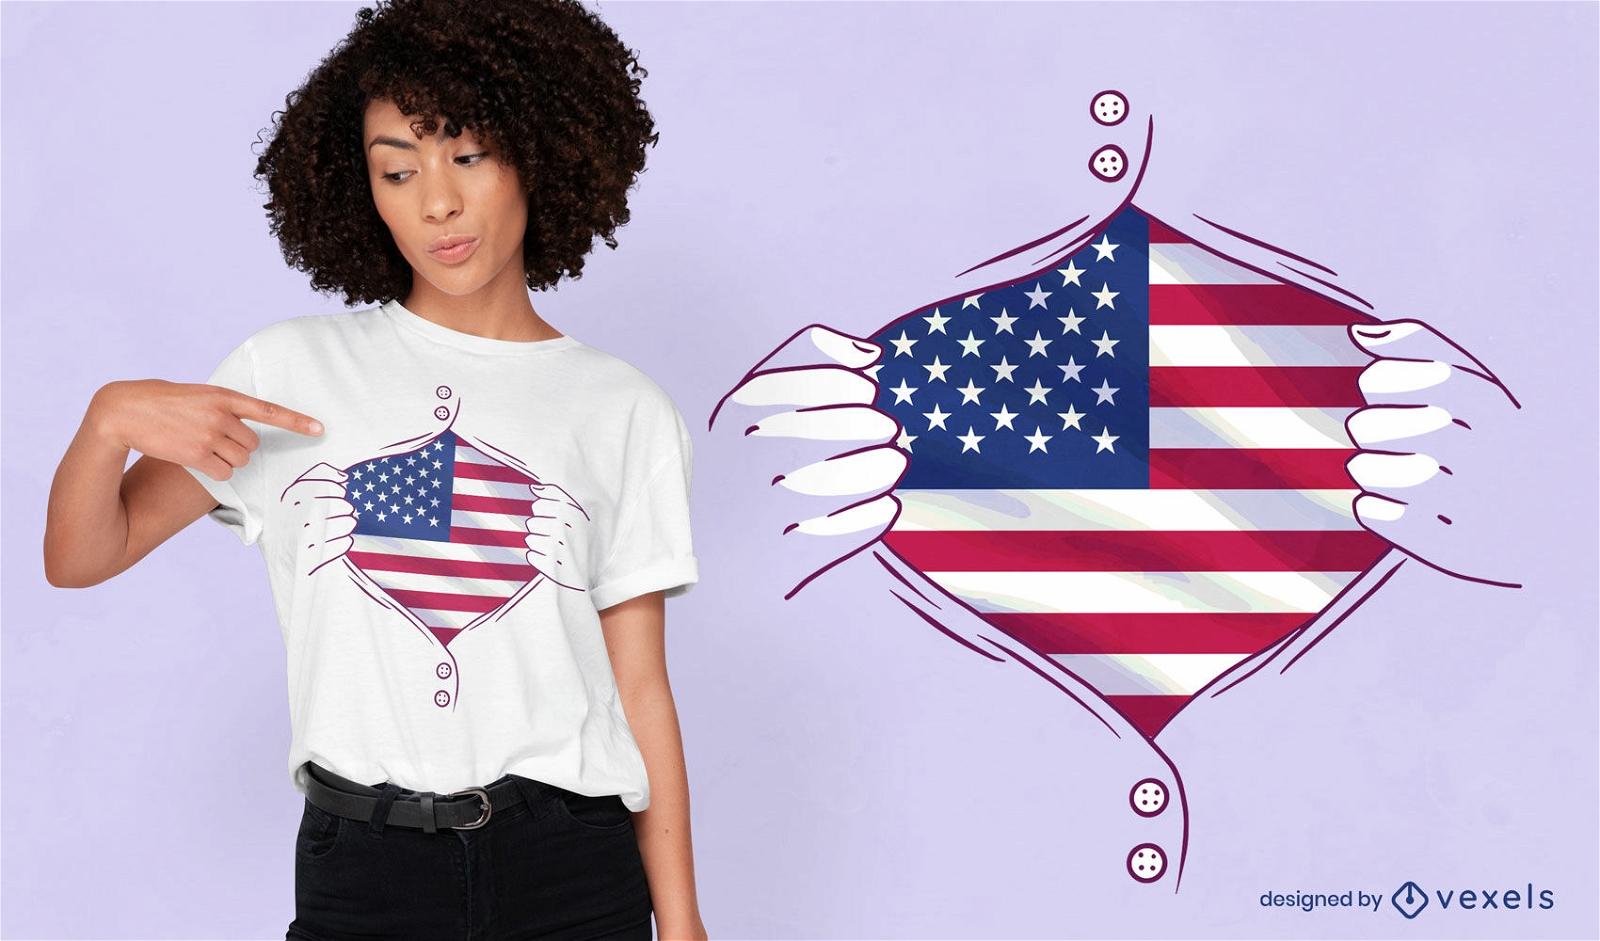
Print ready
for Merch
USA country flag shirt t-shirt design
Choose a folder
All favorites
Create new
Save
USA country flag shirt t-shirt design
Print ready
for Merch
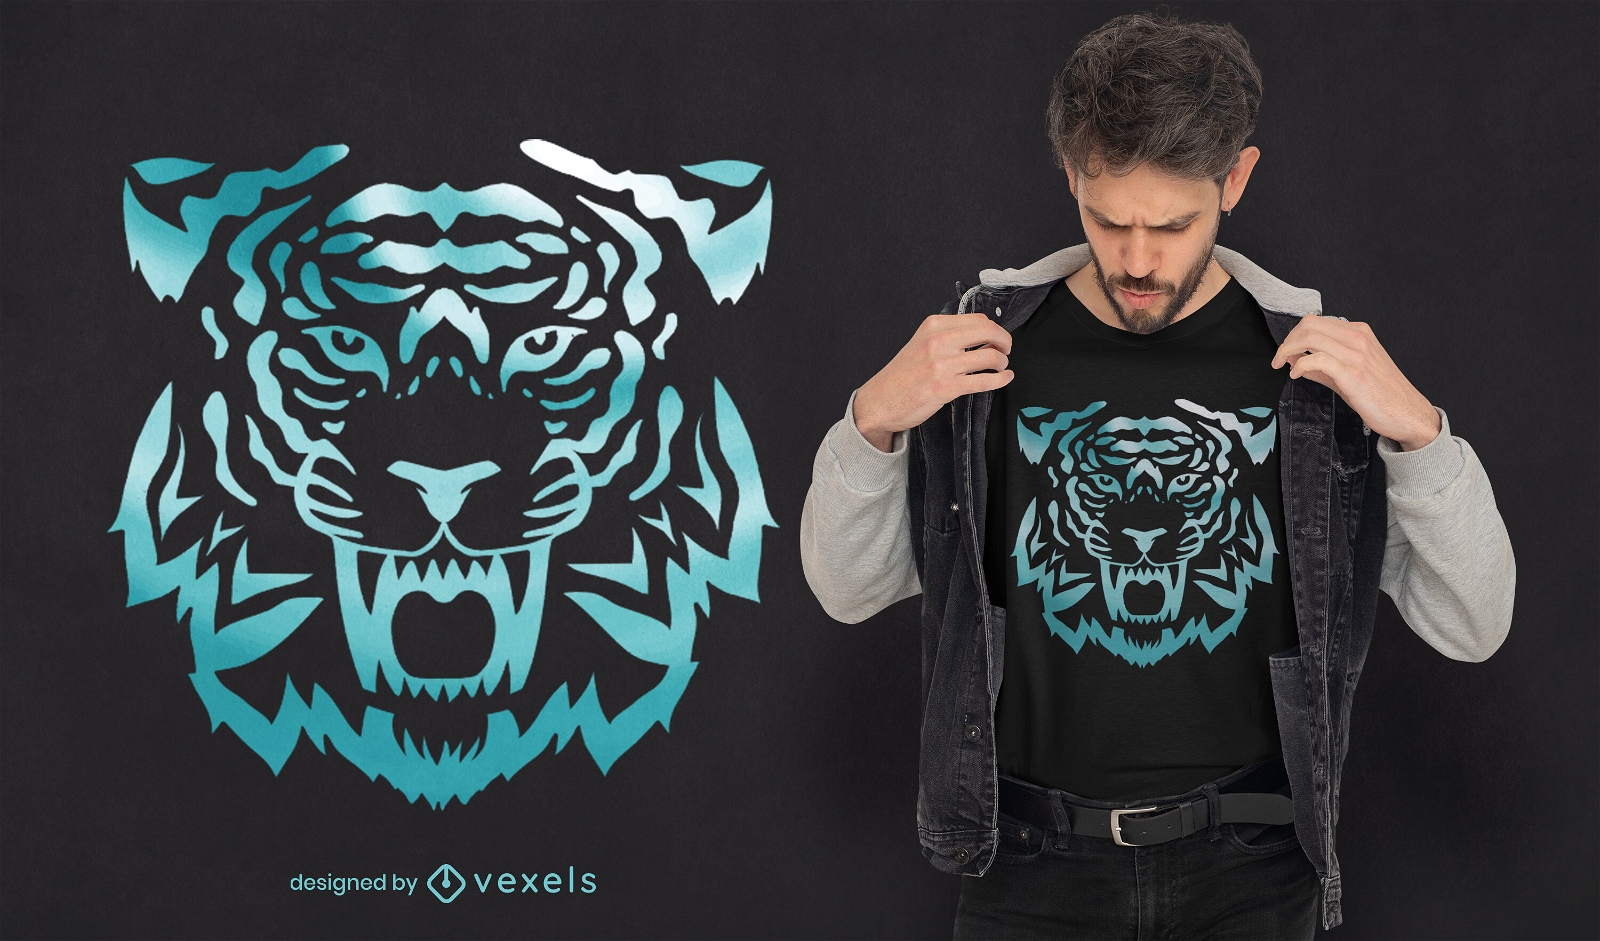
Blue tiger wild animal t-shirt design
Choose a folder
All favorites
Create new
Save
Blue tiger wild animal t-shirt design
Print ready
for Merch
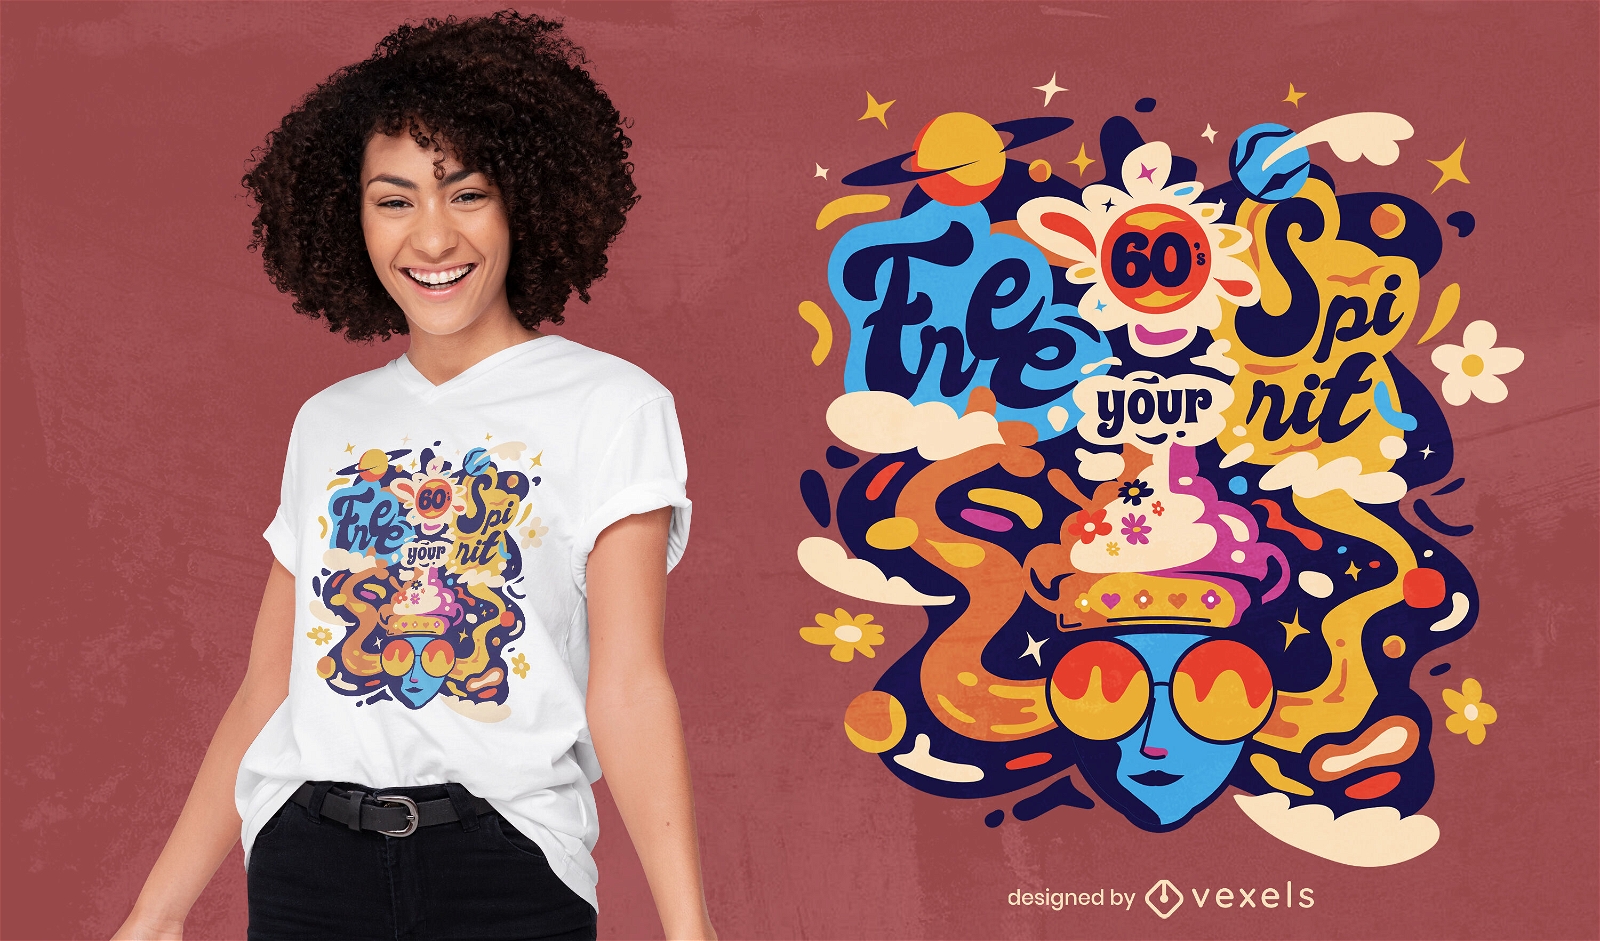
Sixties groovy freedom t-shirt design
Choose a folder
All favorites
Create new
Save
Sixties groovy freedom t-shirt design
Print ready
for Merch
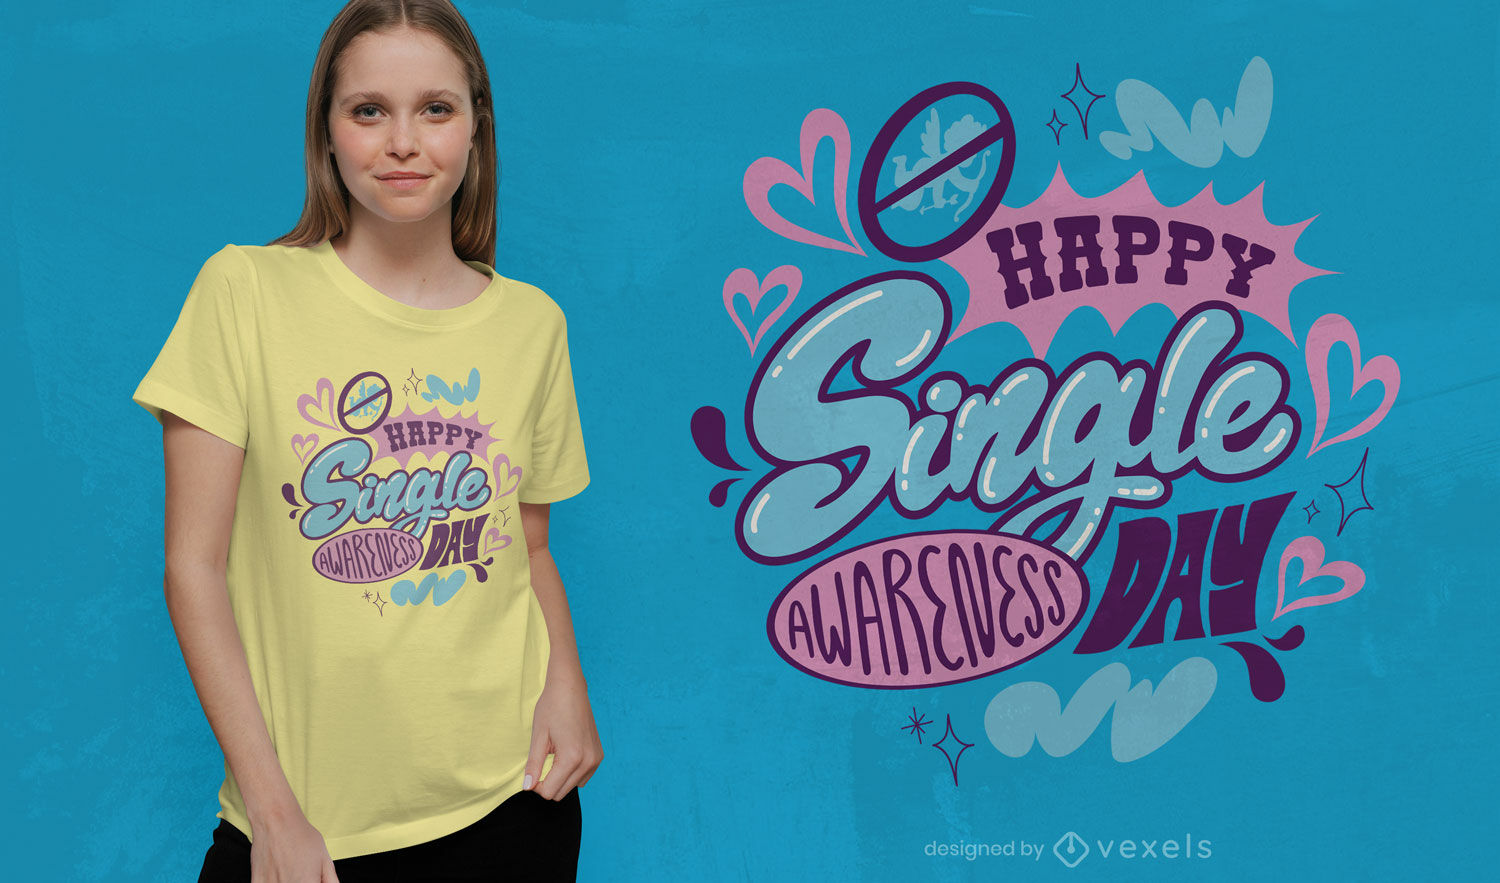
Funny single anti-valentine's t-shirt design
Choose a folder
All favorites
Create new
Save
Funny single anti-valentine's t-shirt design
Print ready
for Merch
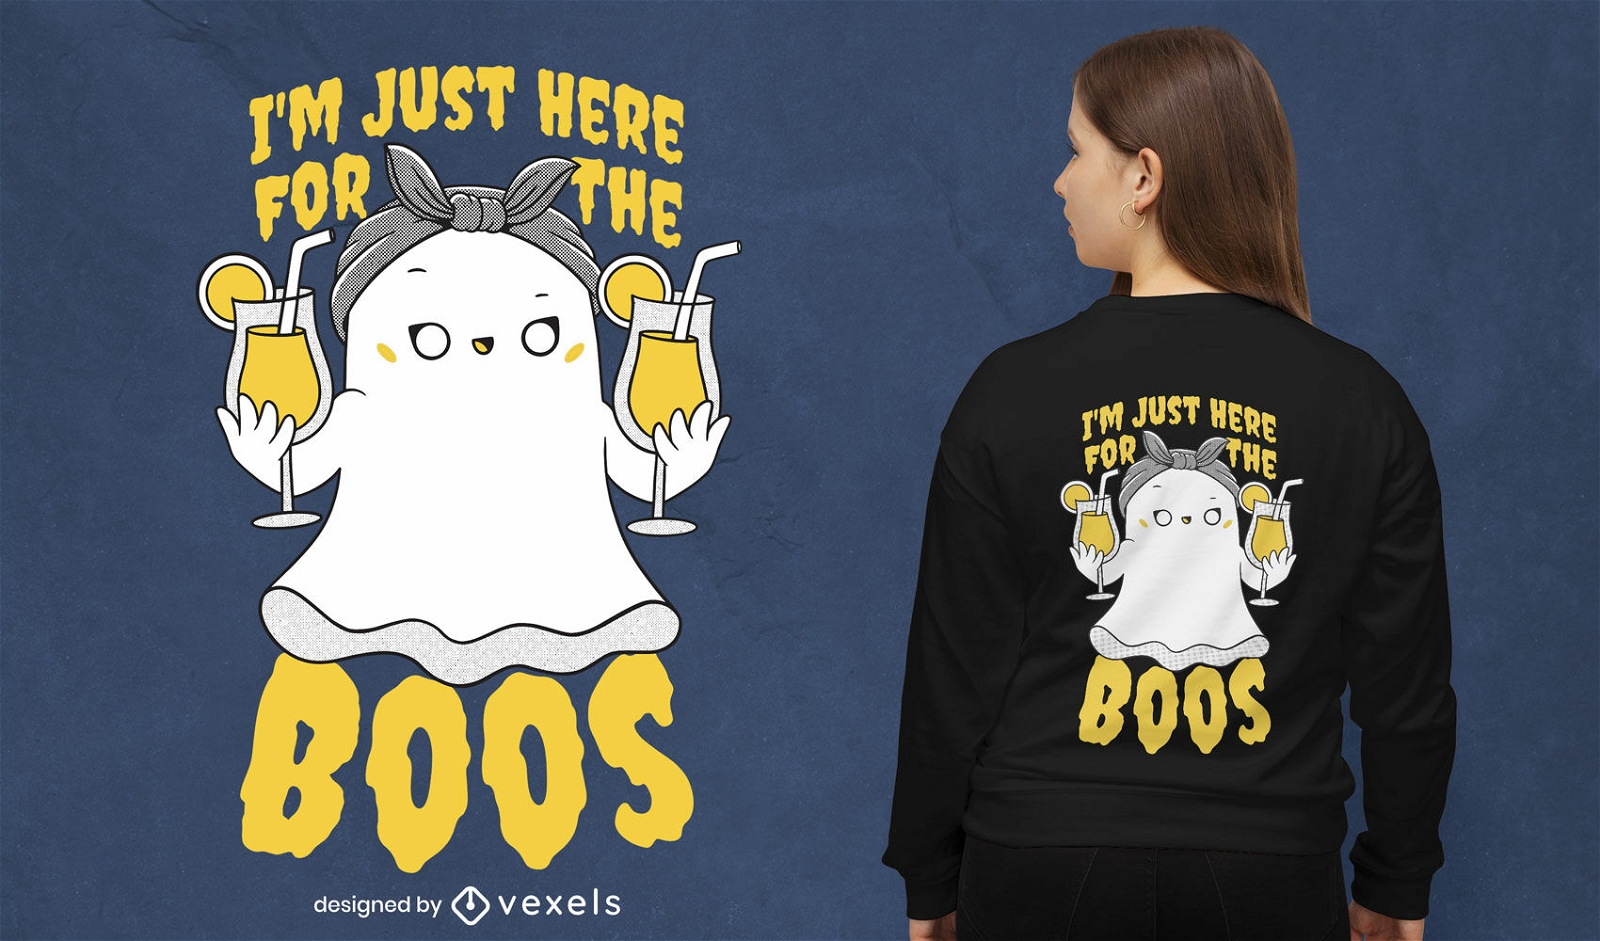
Funny ghost t-shirt design
Choose a folder
All favorites
Create new
Save
Funny ghost t-shirt design
Print ready
for Merch
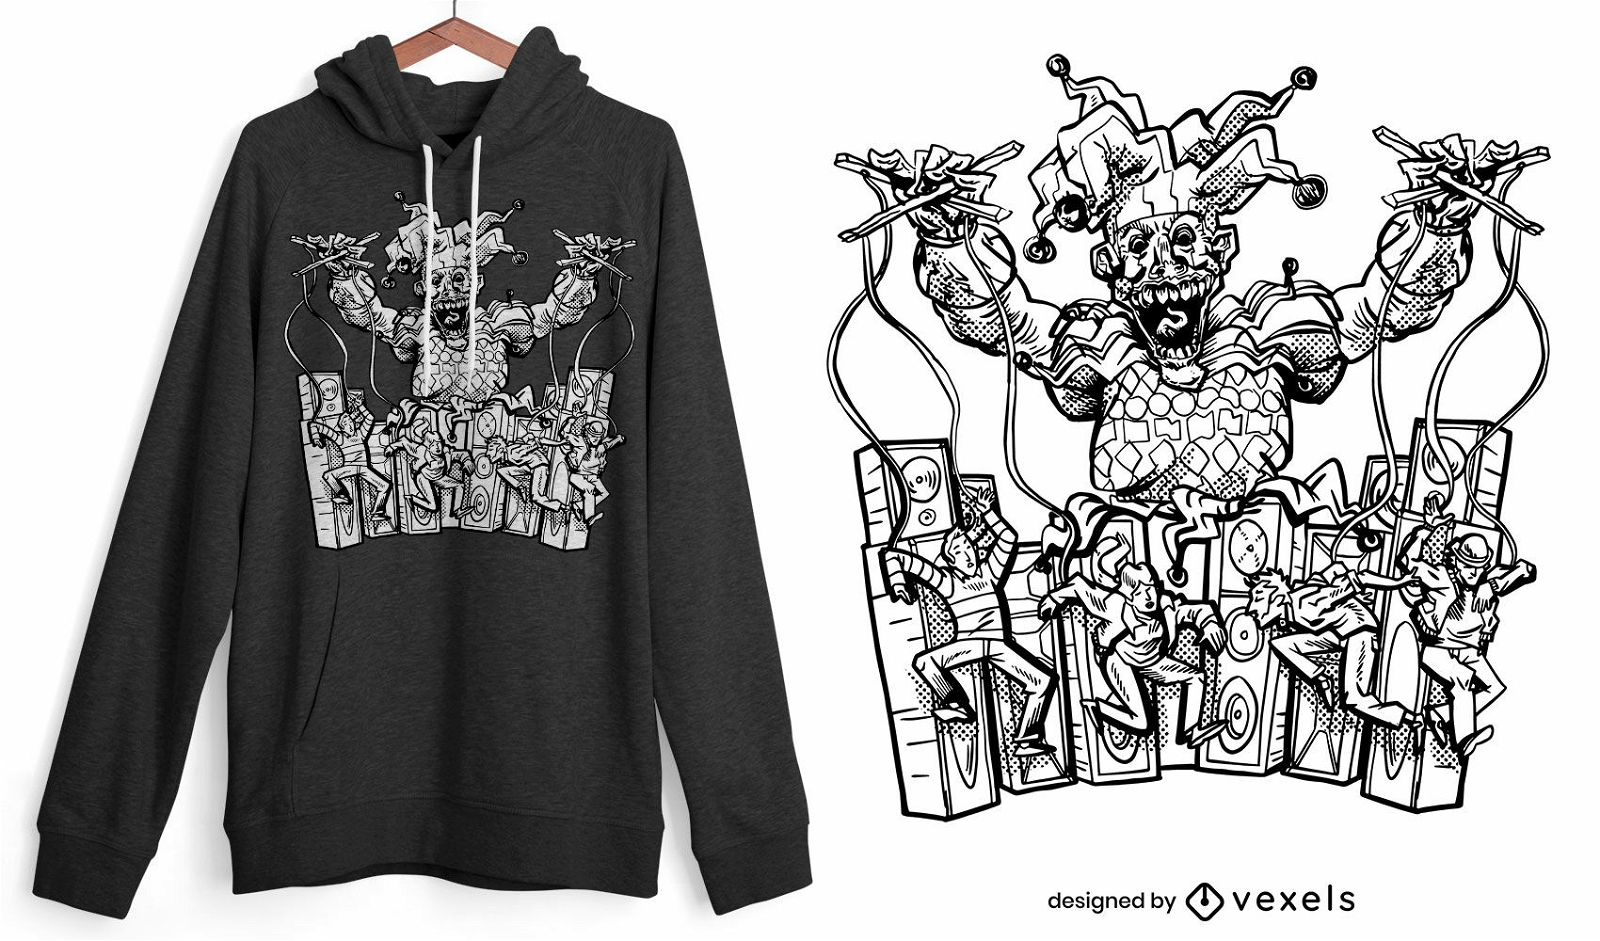
Scary clown and puppets t-shirt design
Choose a folder
All favorites
Create new
Save
Scary clown and puppets t-shirt design
Print ready
for Merch
Gorilla playing drums music t-shirt design
Choose a folder
All favorites
Create new
Save
Gorilla playing drums music t-shirt design
Print ready
for Merch
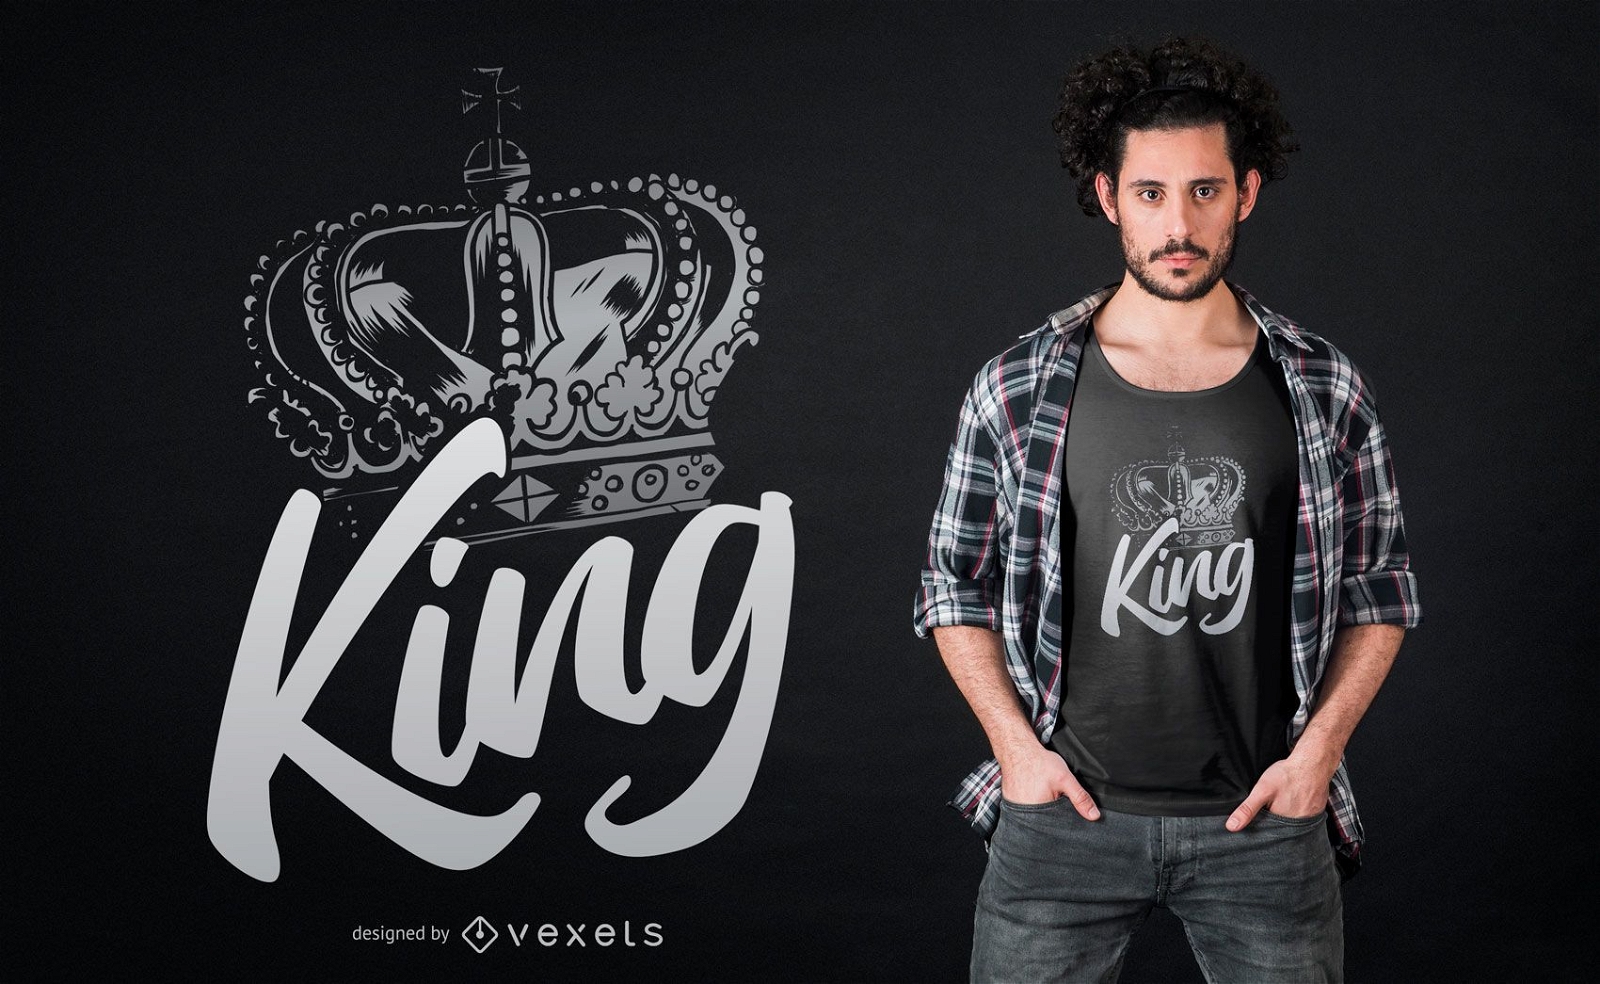
Royal crown for a king t-shirt design
Choose a folder
All favorites
Create new
Save
Royal crown for a king t-shirt design
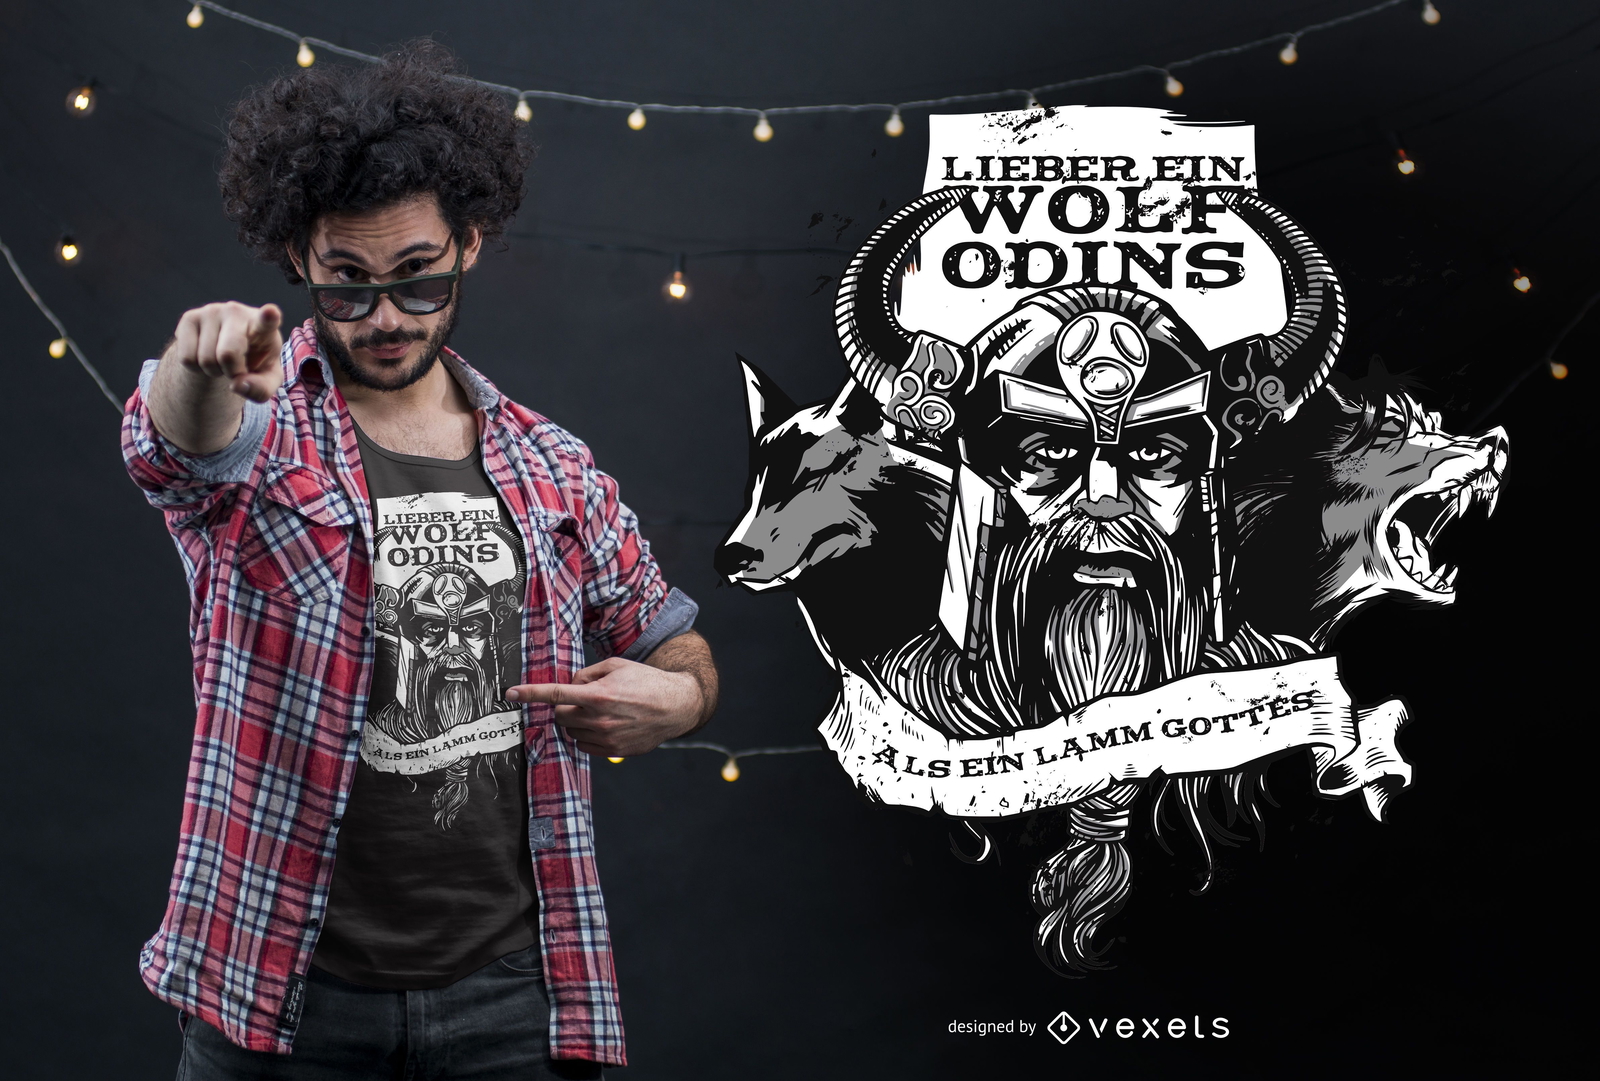
German Content
Print ready
for Merch
Odin's Wolf German Quote T-shirt Design
Choose a folder
All favorites
Create new
Save
Odin's Wolf German Quote T-shirt Design
Print ready
for Merch
Steampunk octopus t-shirt design
Choose a folder
All favorites
Create new
Save
Steampunk octopus t-shirt design
Editable text
Print ready
for Merch
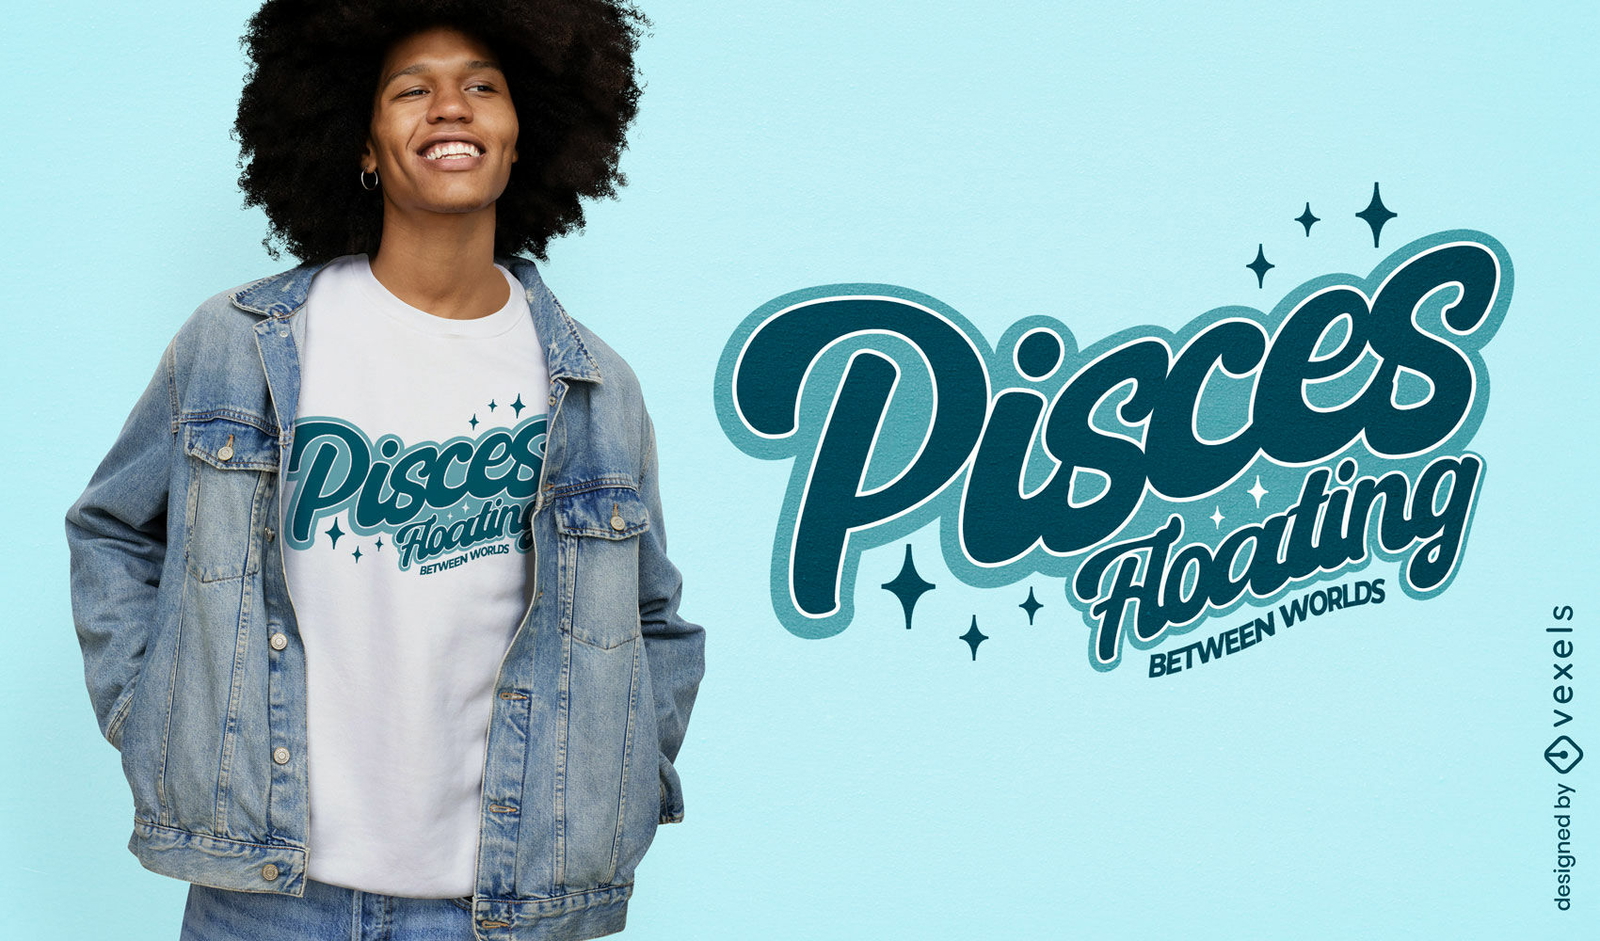
Pisces floating zodiac t-shirt design
Choose a folder
All favorites
Create new
Save
Pisces floating zodiac t-shirt design
Editable text
Print ready
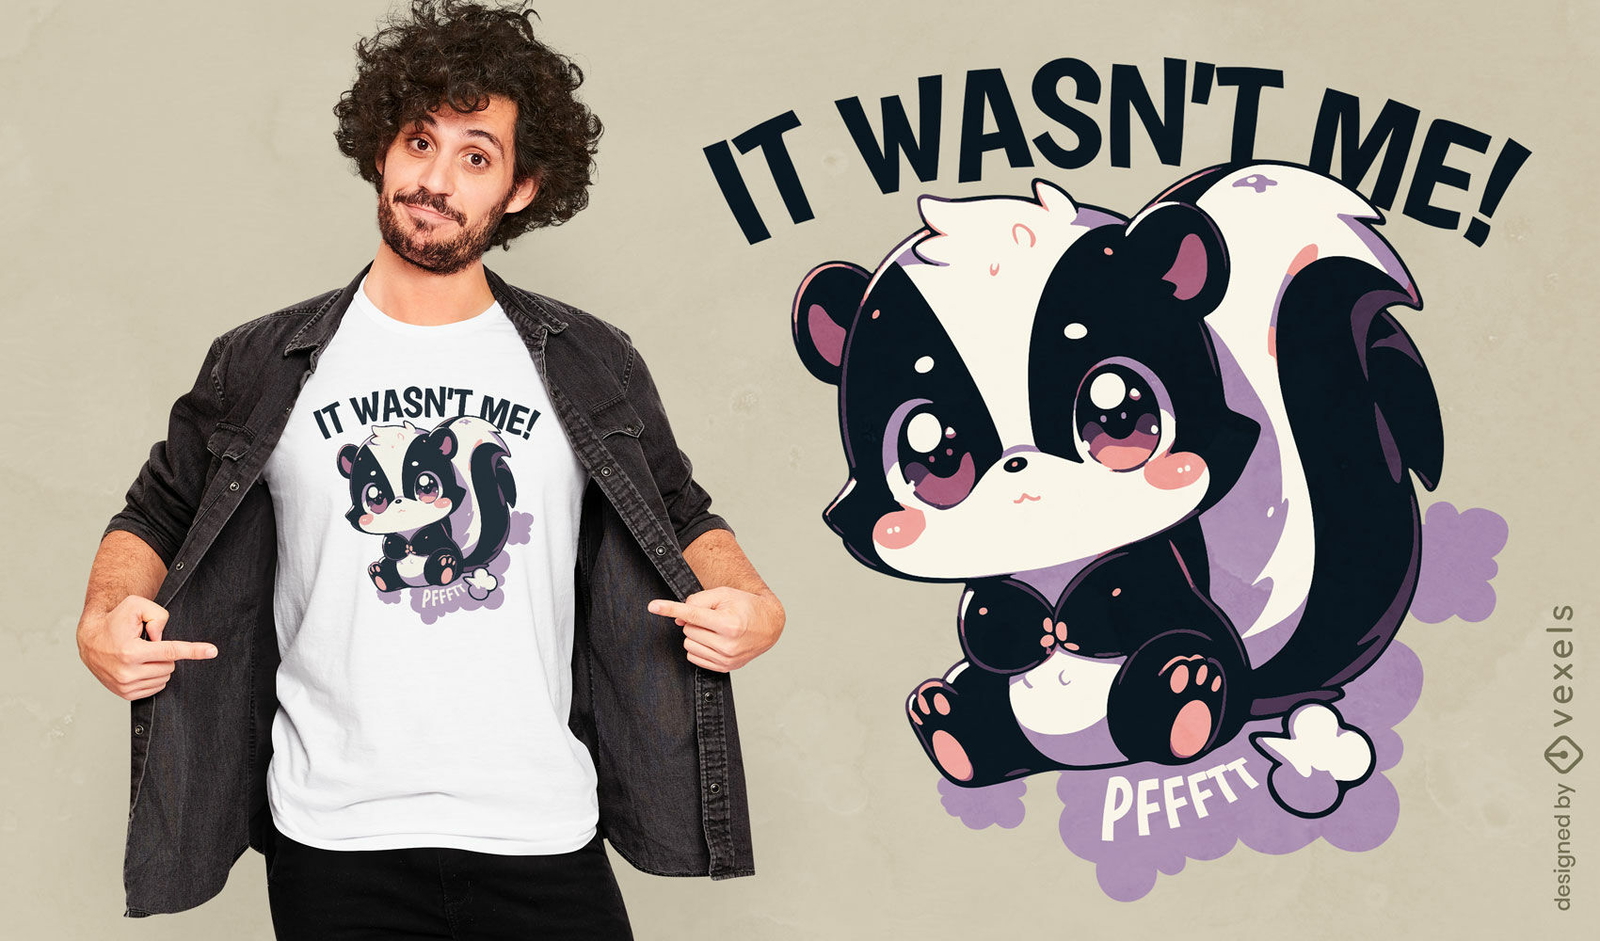
for Merch
Cute skunk farting t-shirt design
Choose a folder
All favorites
Create new
Save
Cute skunk farting t-shirt design
Editable text
Print ready
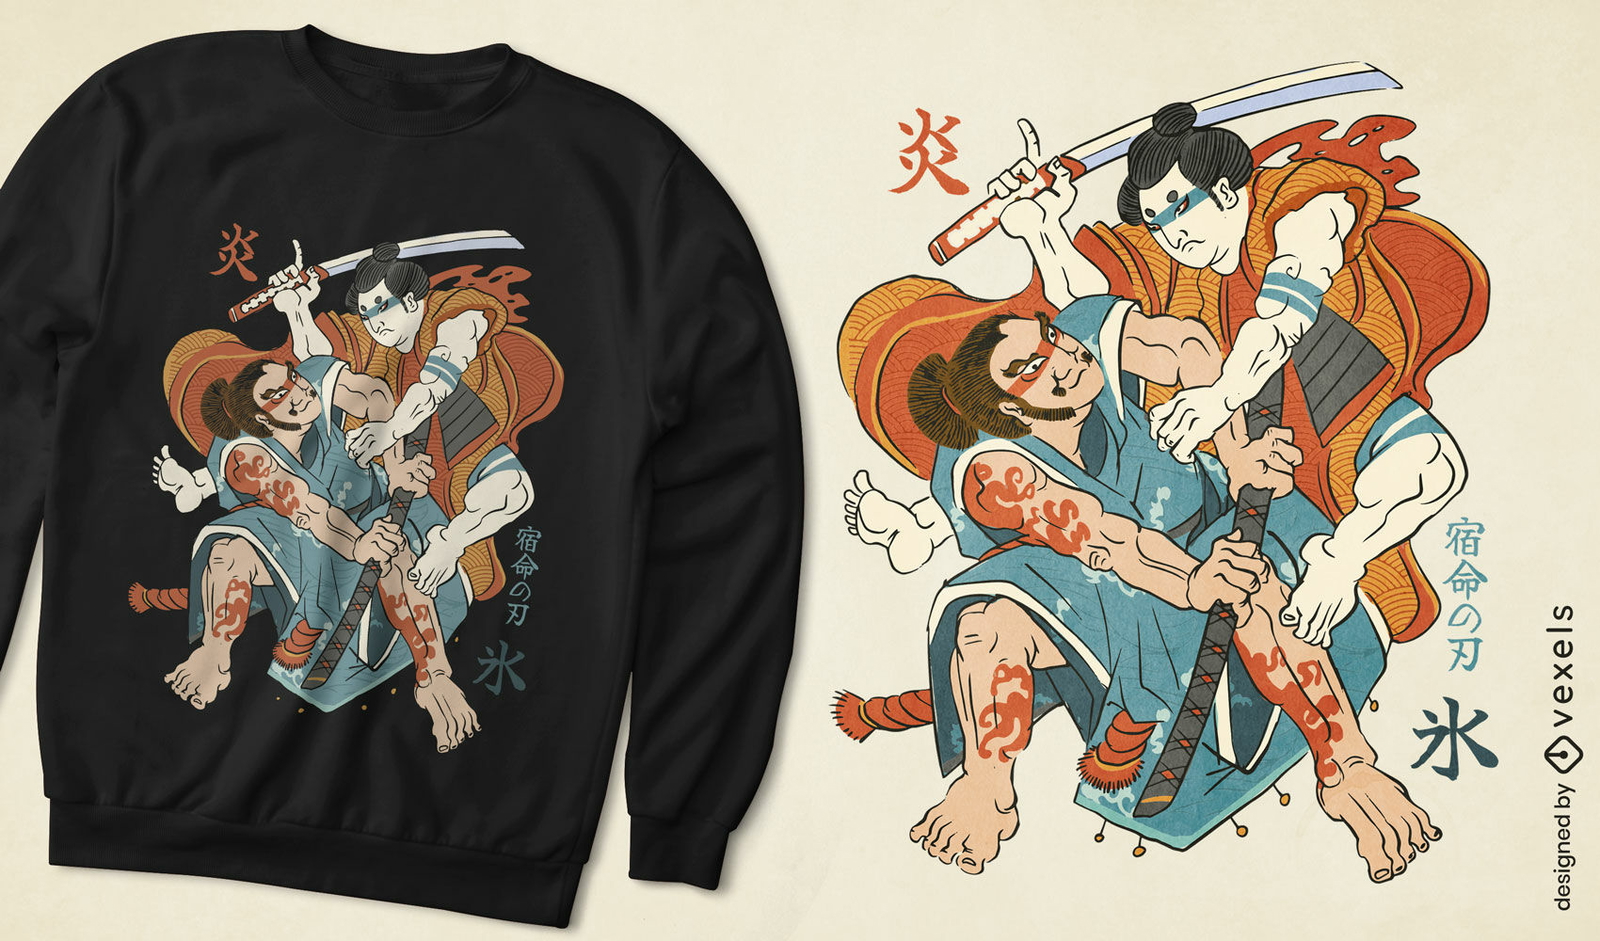
for Merch
Japanese traditional samurai battle t-shirt design
Choose a folder
All favorites
Create new
Save
Japanese traditional samurai battle t-shirt design
Print ready
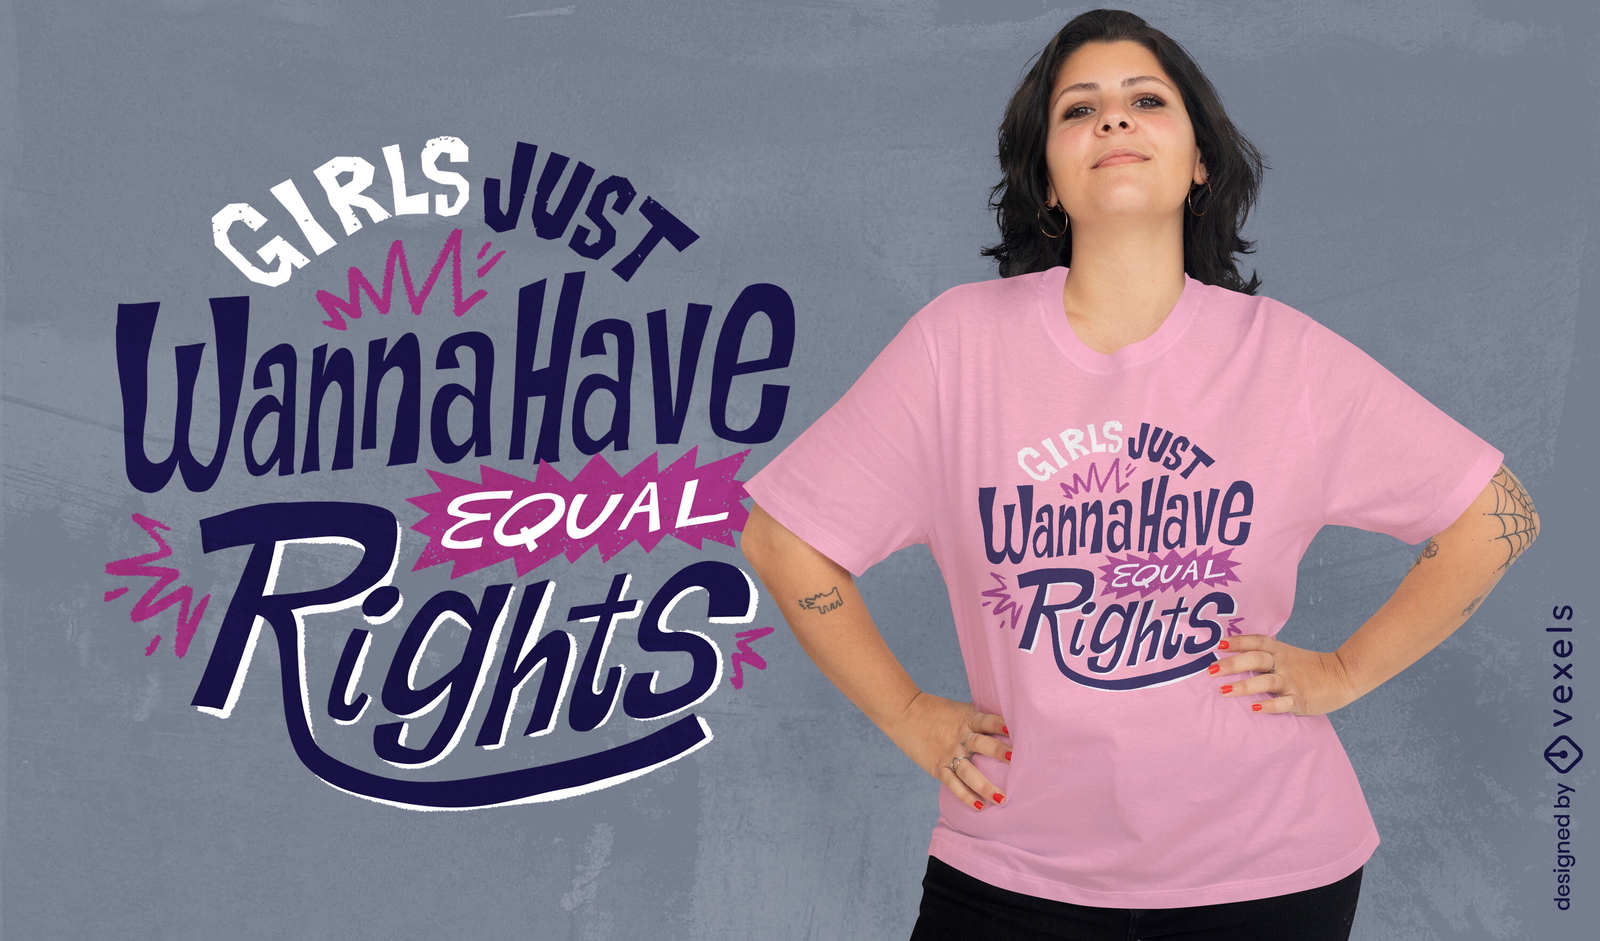
for Merch
Girls just wanna have equal rights t-shirt design
Choose a folder
All favorites
Create new
Save
Girls just wanna have equal rights t-shirt design
Editable text
Print ready
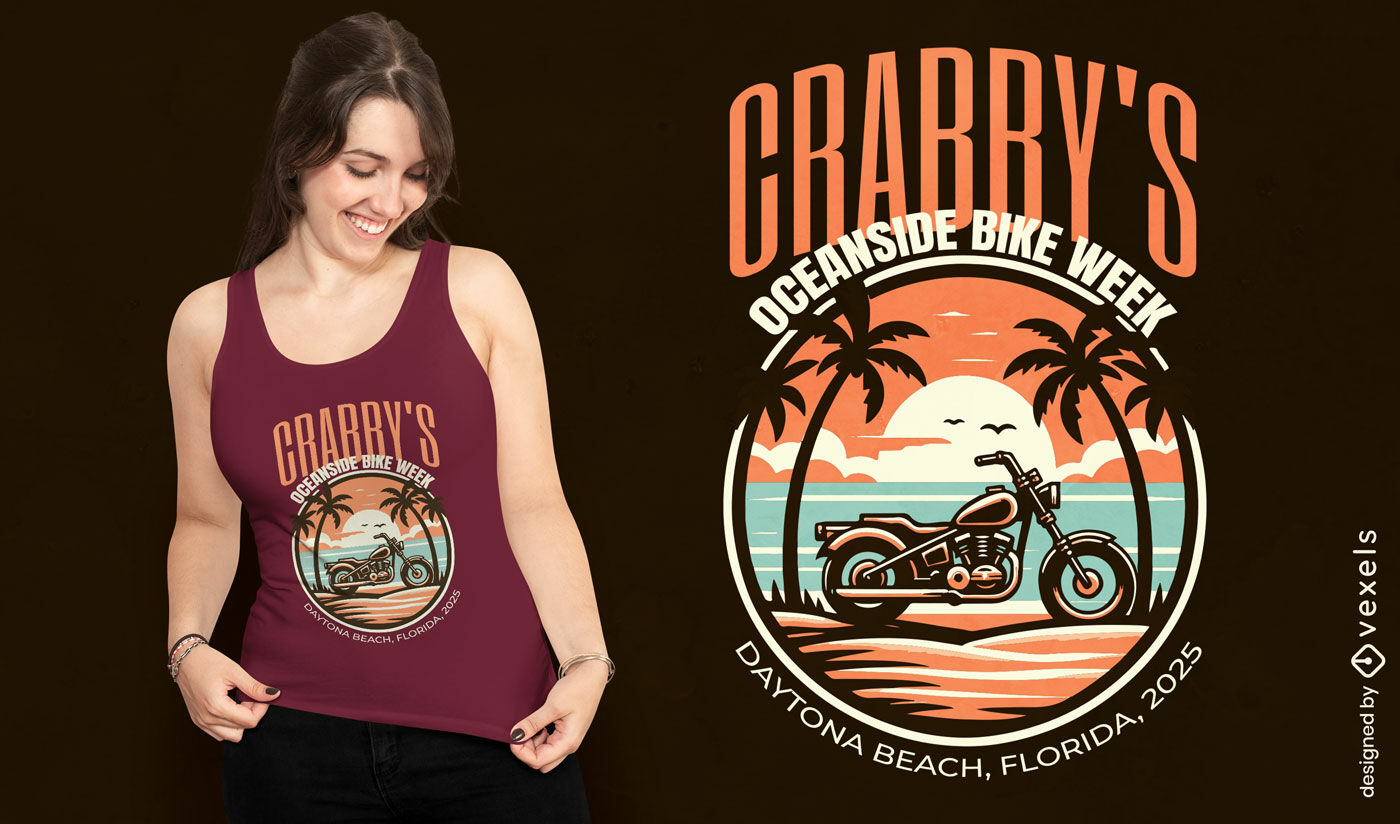
for Merch
Bike week event t-shirt design
Choose a folder
All favorites
Create new
Save
Bike week event t-shirt design
Print ready
for Merch
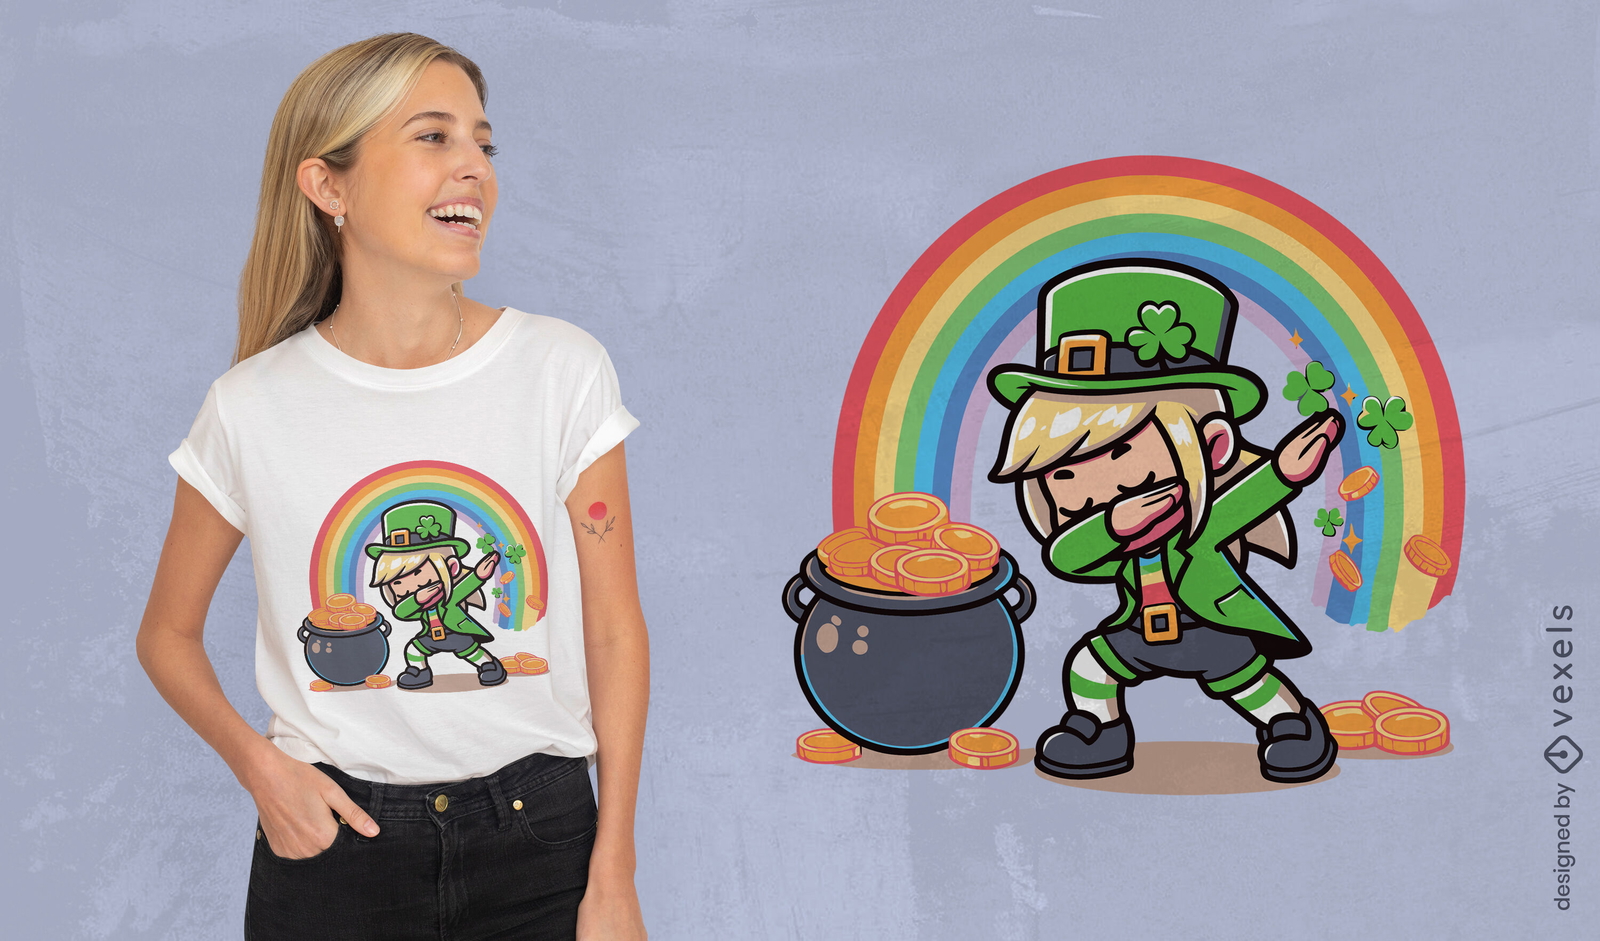
Dabbing leprechaun girl t-shirt design
Choose a folder
All favorites
Create new
Save
Dabbing leprechaun girl t-shirt design
Editable text
Print ready
for Merch
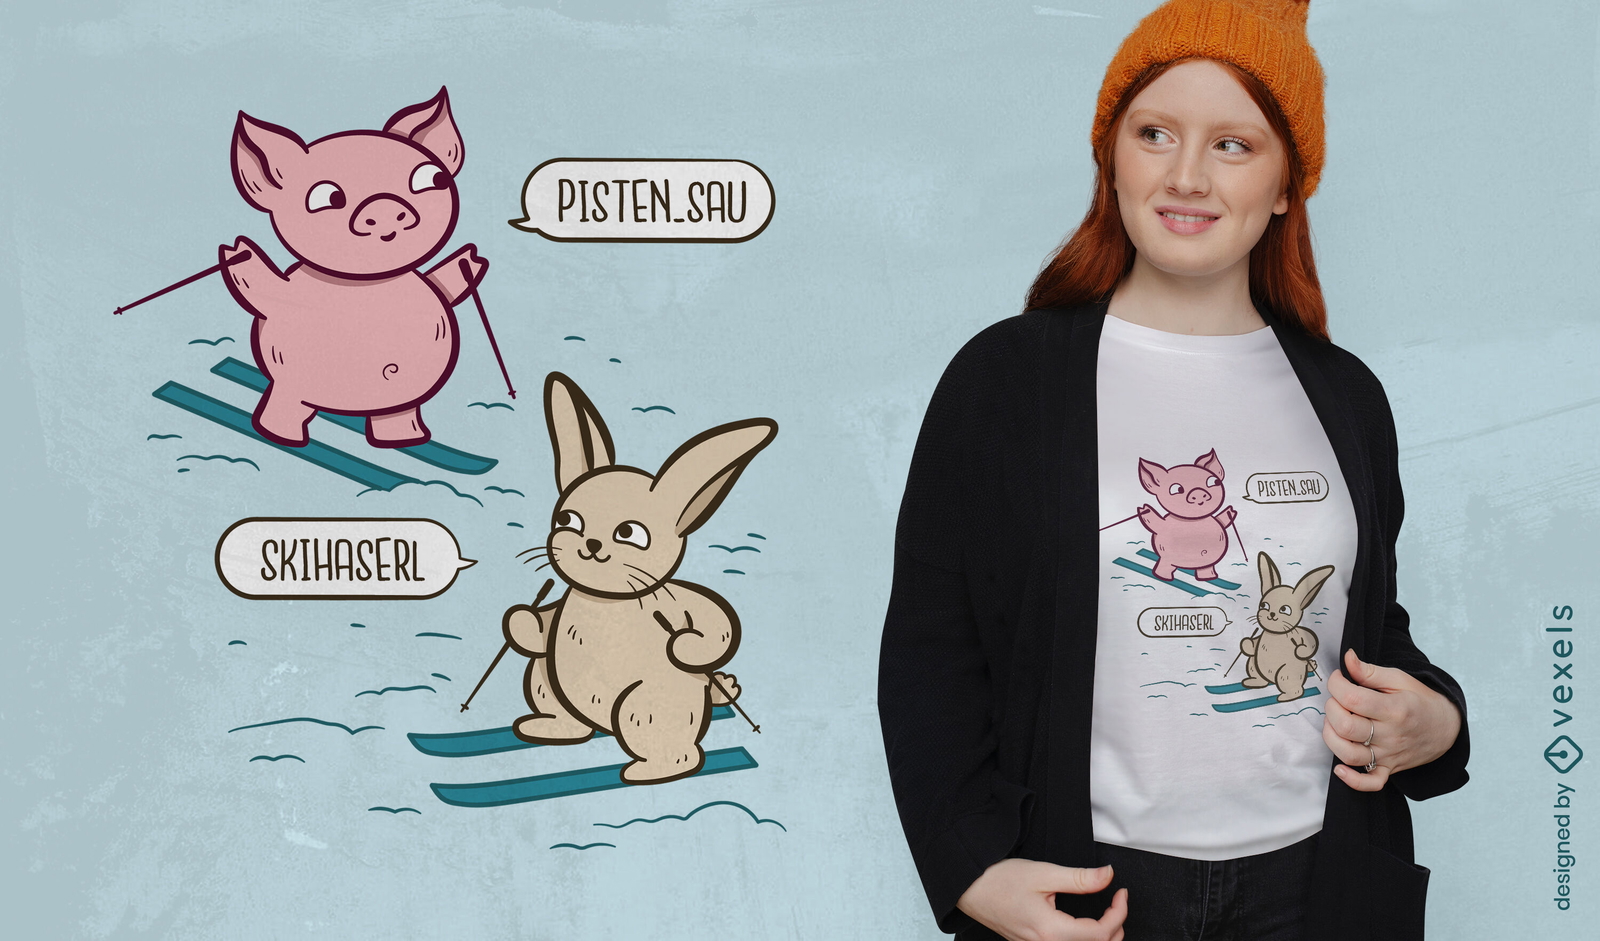
Skiing animals pun t-shirt design
Choose a folder
All favorites
Create new
Save
Skiing animals pun t-shirt design
Editable text
Print ready
for Merch
Children and flowers recognition quote t-shirt design
Choose a folder
All favorites
Create new
Save
Children and flowers recognition quote t-shirt design
Print ready
for Merch
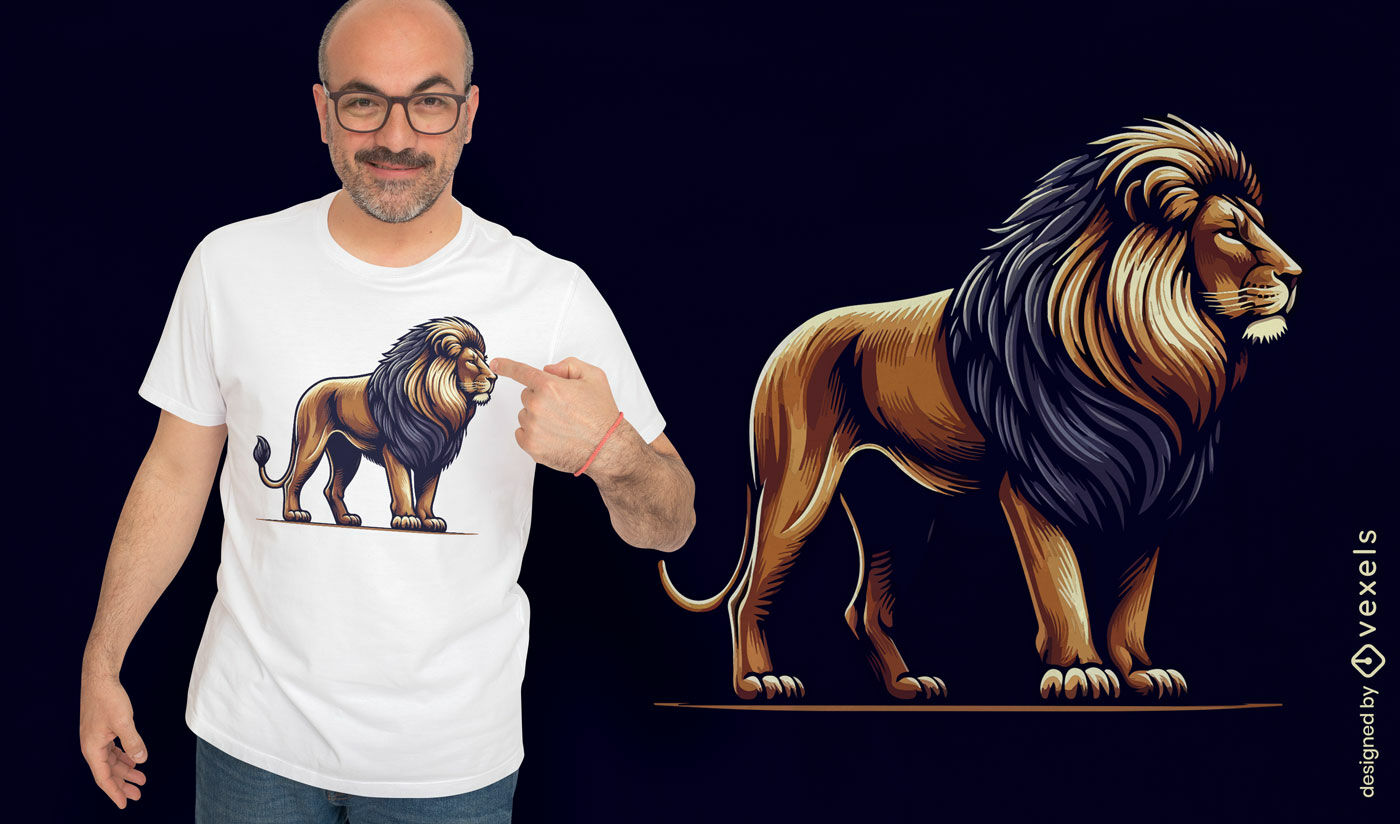
Majestic lion portrait t-shirt design
Choose a folder
All favorites
Create new
Save
Majestic lion portrait t-shirt design
Print ready
for Merch
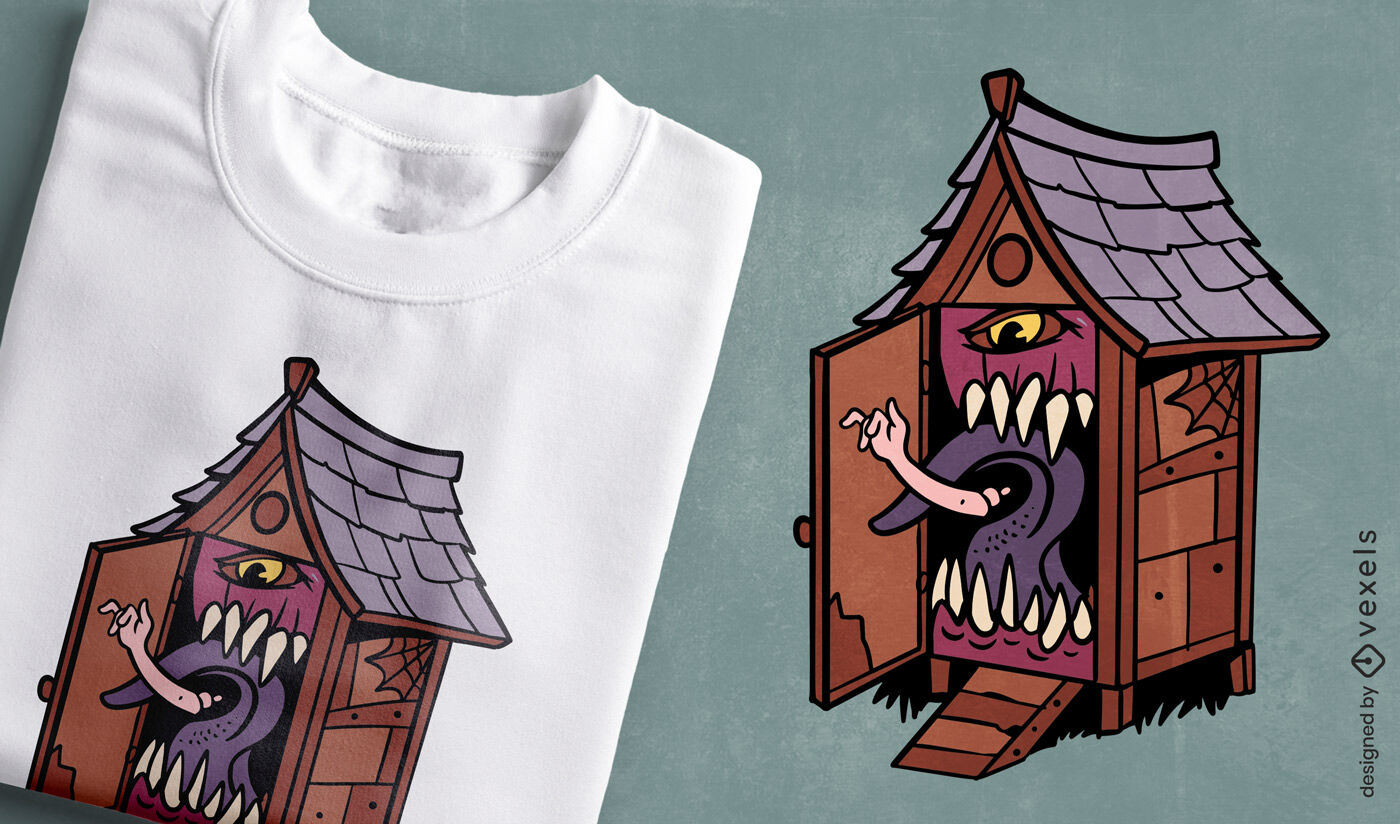
Monster house t-shirt design
Choose a folder
All favorites
Create new
Save
Monster house t-shirt design
Editable text
Print ready
for Merch
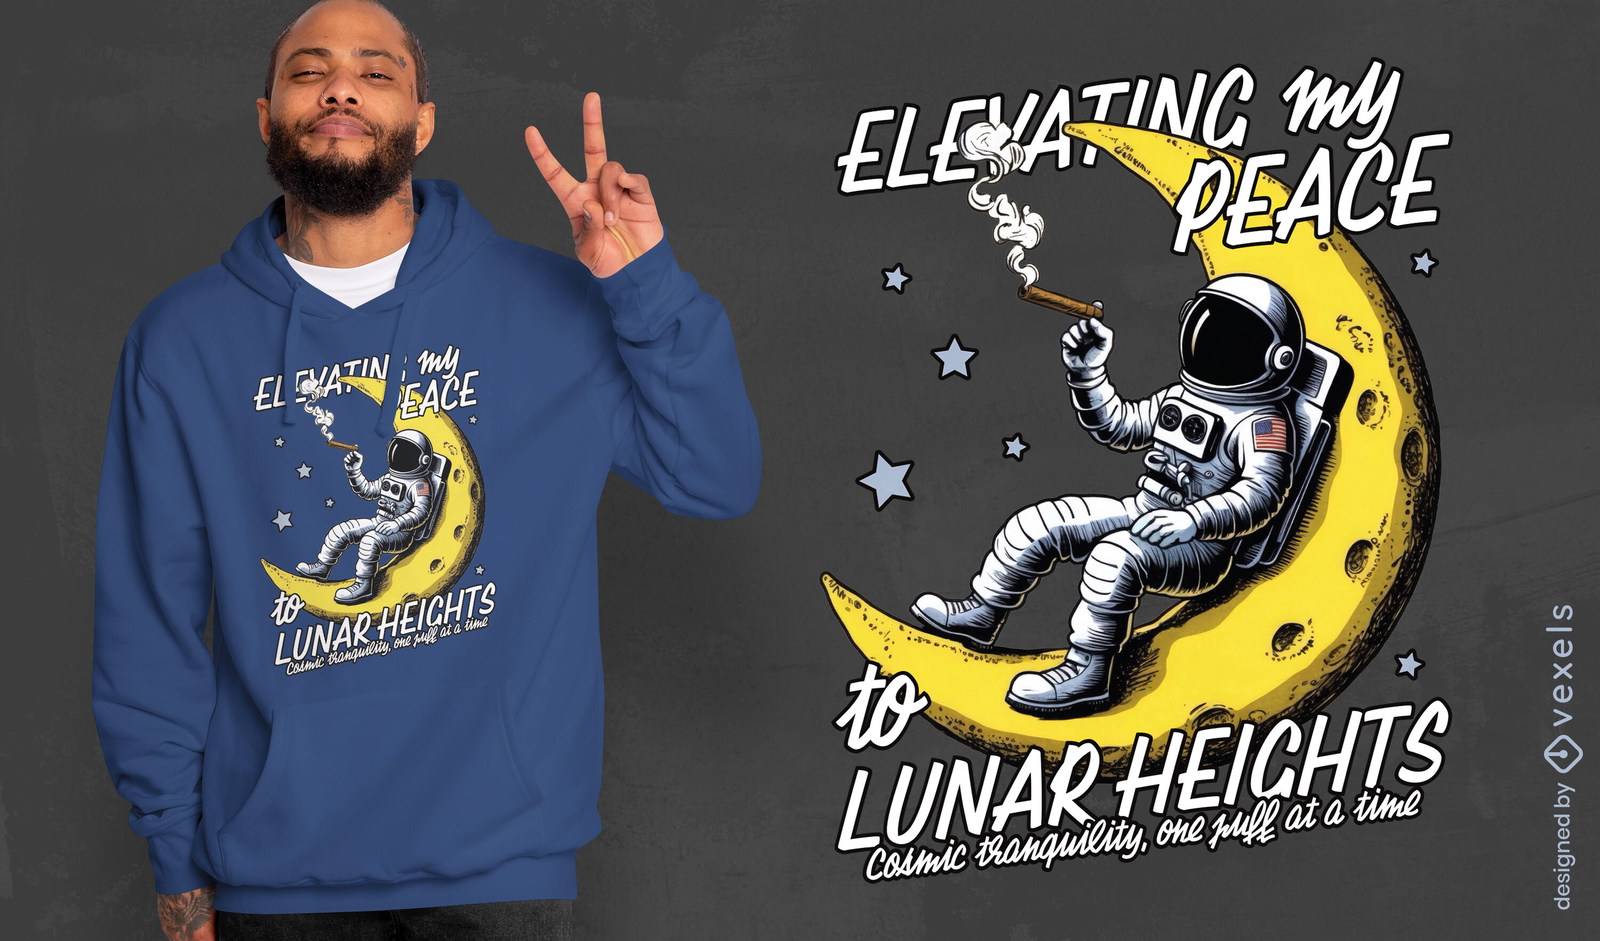
Elevating peace to lunar heights t-shirt design
Choose a folder
All favorites
Create new
Save
Elevating peace to lunar heights t-shirt design
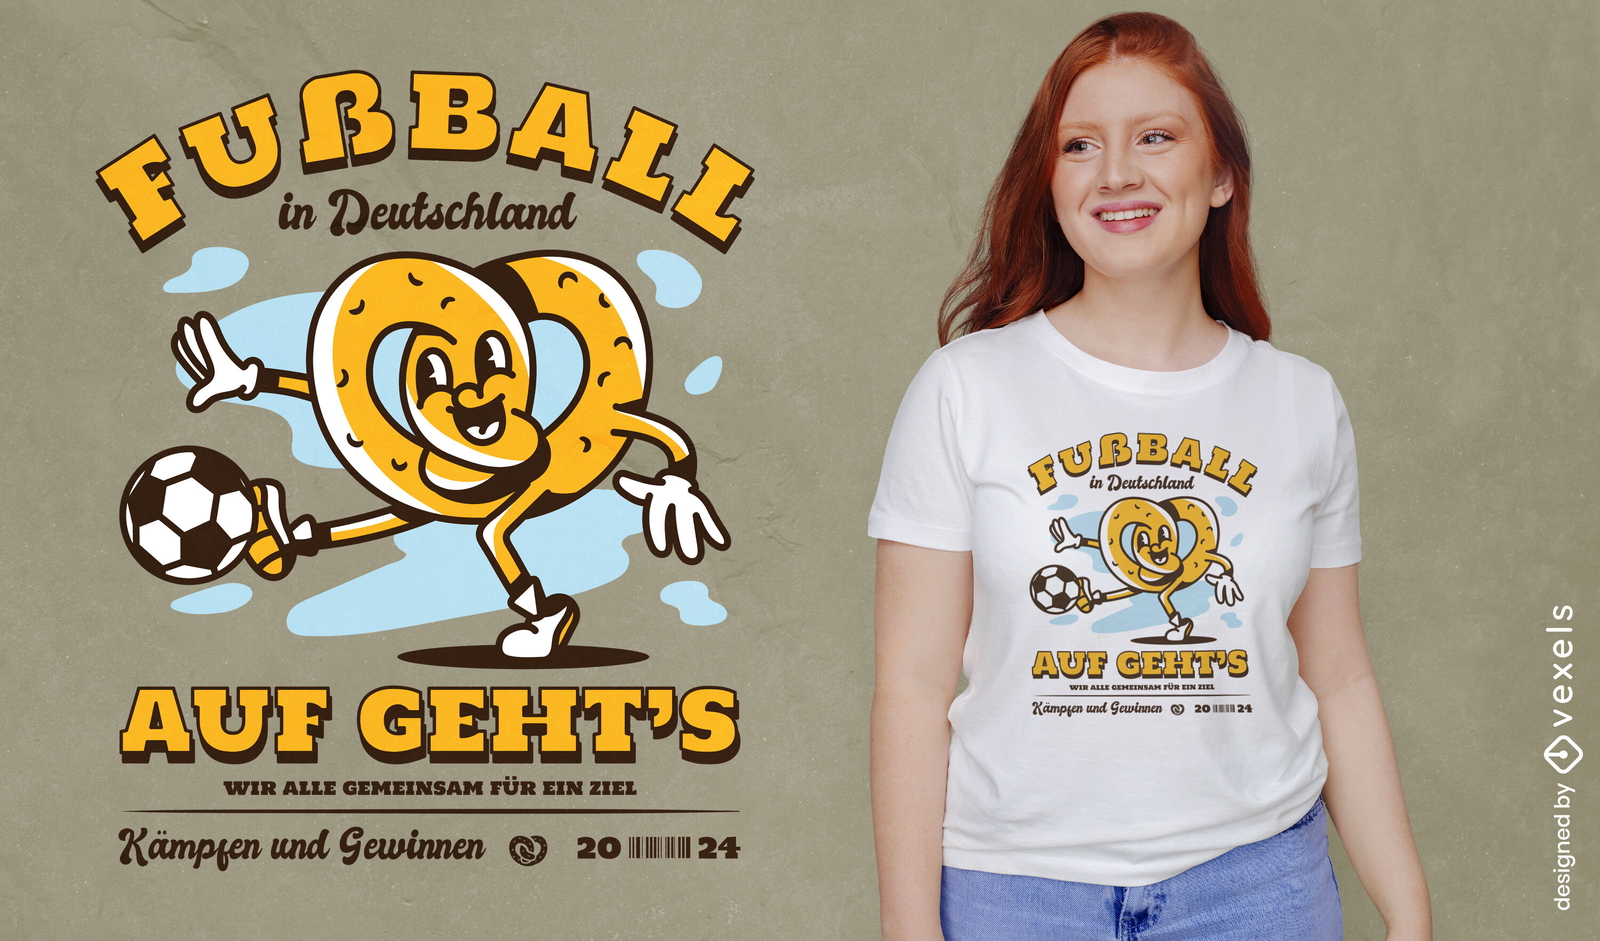
German Content
Print ready
for Merch
Germany soccer fun t-shirt design
Choose a folder
All favorites
Create new
Save
Germany soccer fun t-shirt design
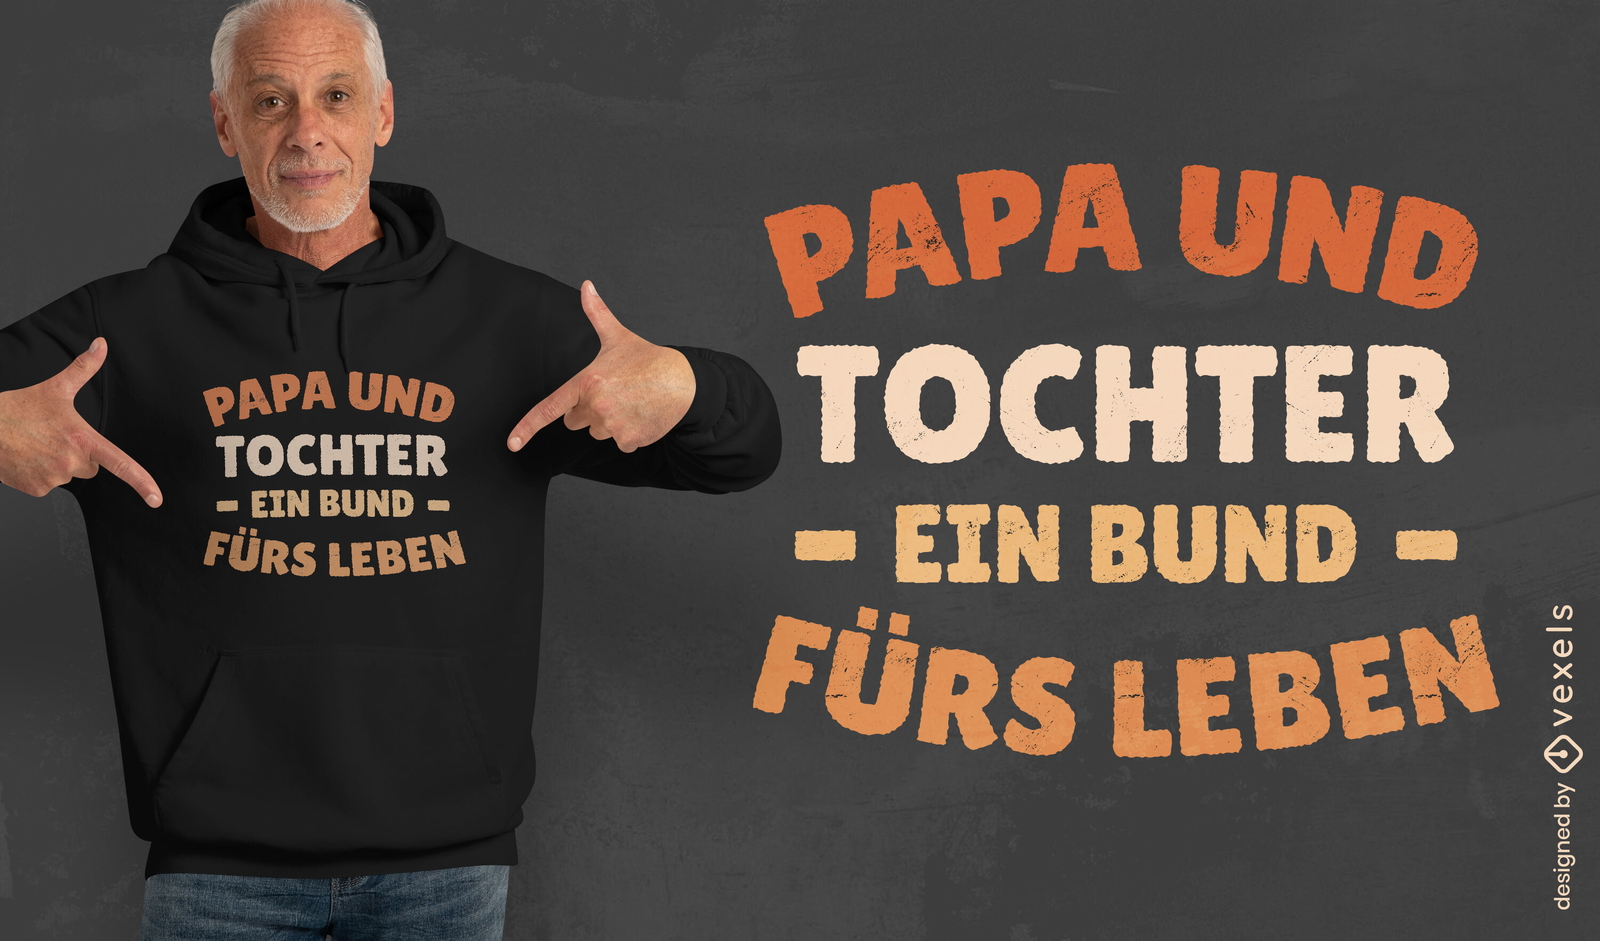
Editable text
Print ready
for Merch
Dad and daughter bond quote t-shirt design
Choose a folder
All favorites
Create new
Save
Dad and daughter bond quote t-shirt design
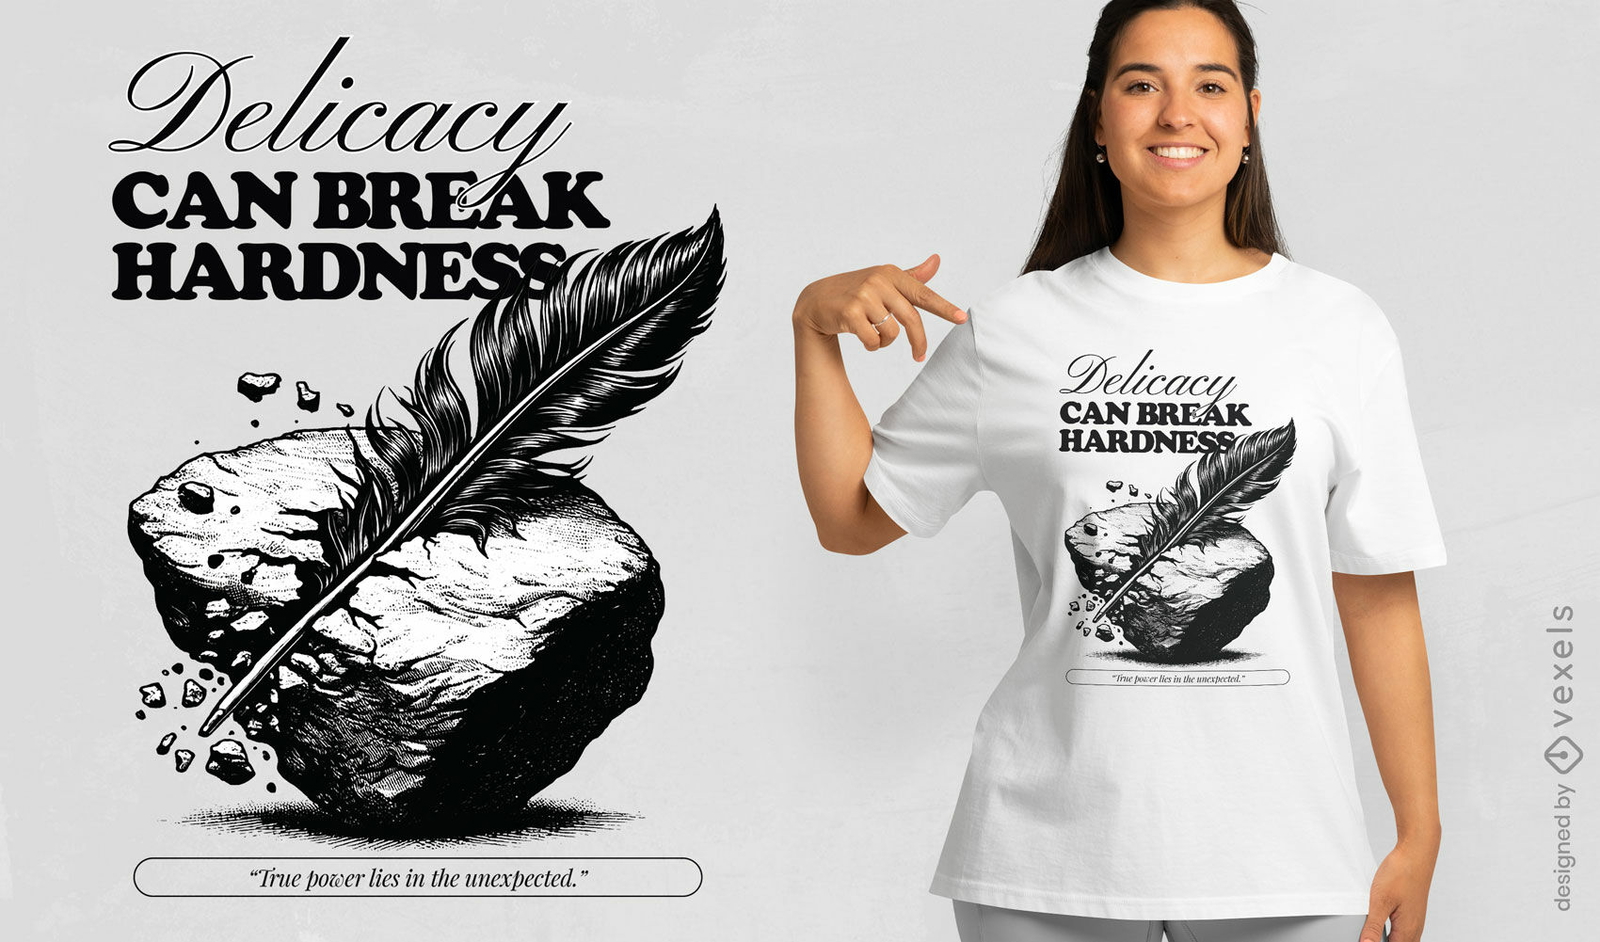
Editable text
Print ready
for Merch
Delicacy-hardness quote t-shirt design
Choose a folder
All favorites
Create new
Save
Delicacy-hardness quote t-shirt design
Print ready
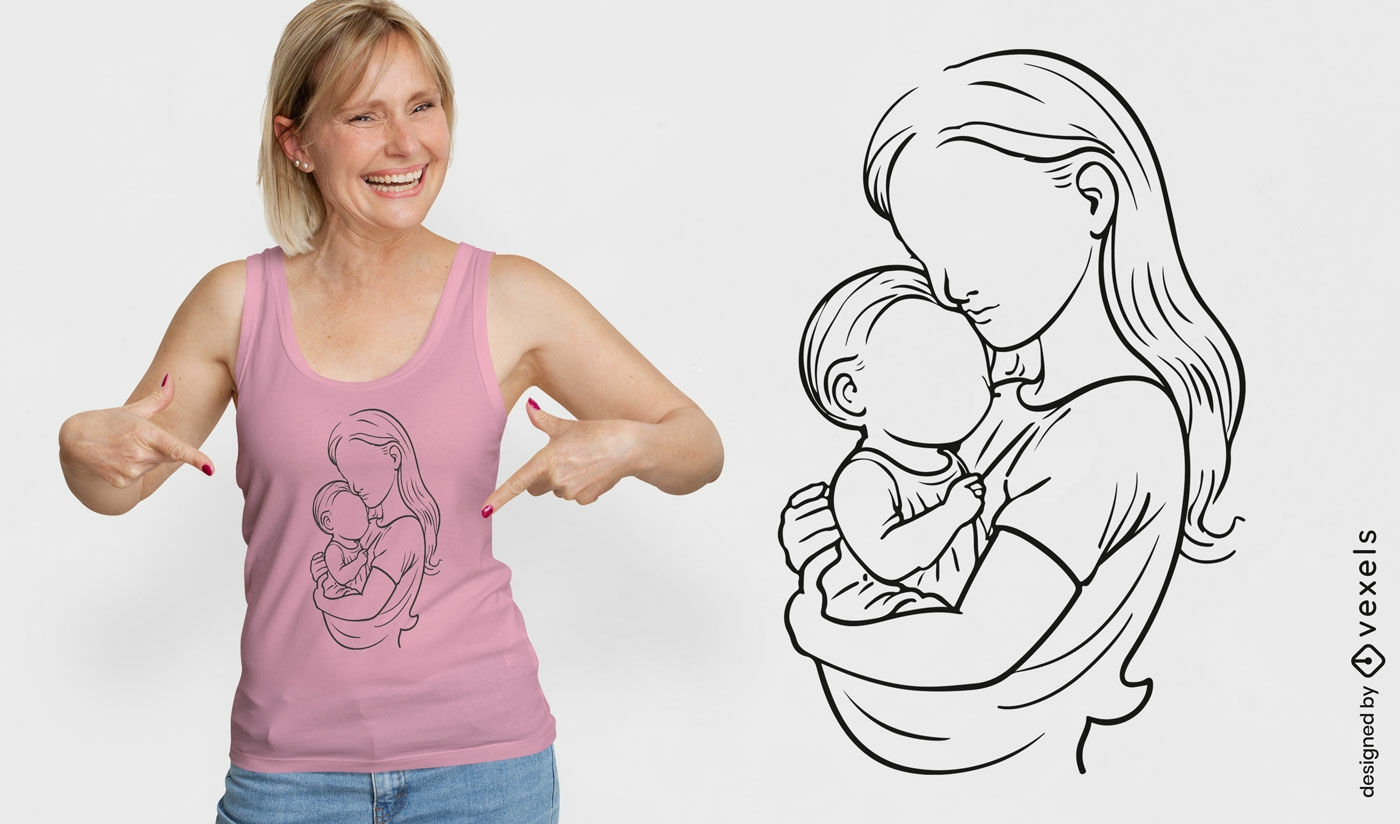
for Merch
Motherhood sketch t-shirt design
Choose a folder
All favorites
Create new
Save
Motherhood sketch t-shirt design
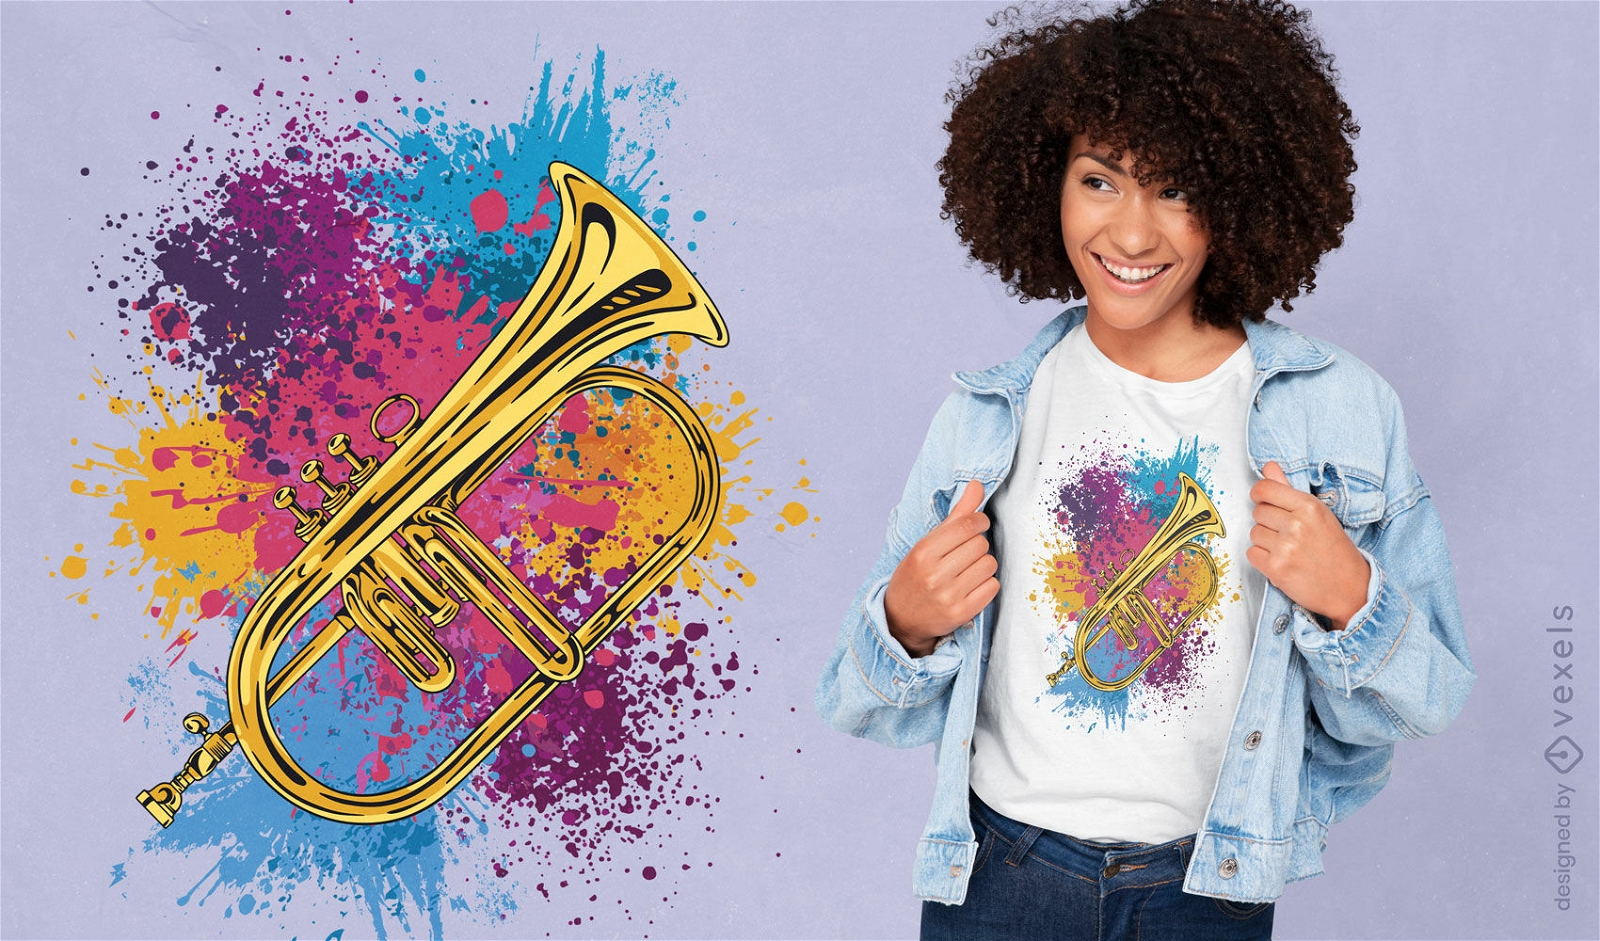
Print ready
for Merch
Musical trumpet splatter t-shirt design
Choose a folder
All favorites
Create new
Save
Musical trumpet splatter t-shirt design
Editable text
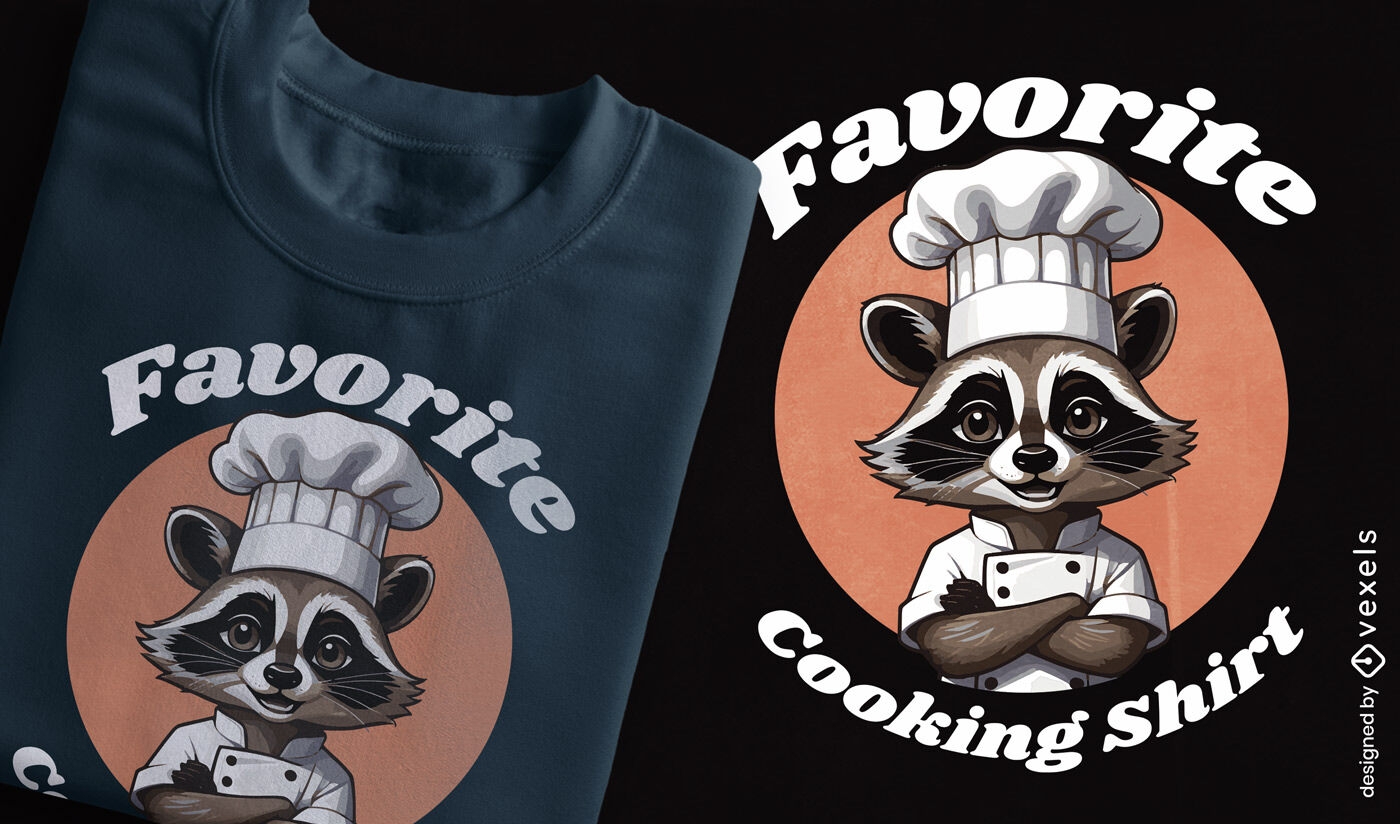
Print ready
for Merch
Favorite cooking raccoon t-shirt design
Choose a folder
All favorites
Create new
Save
Favorite cooking raccoon t-shirt design
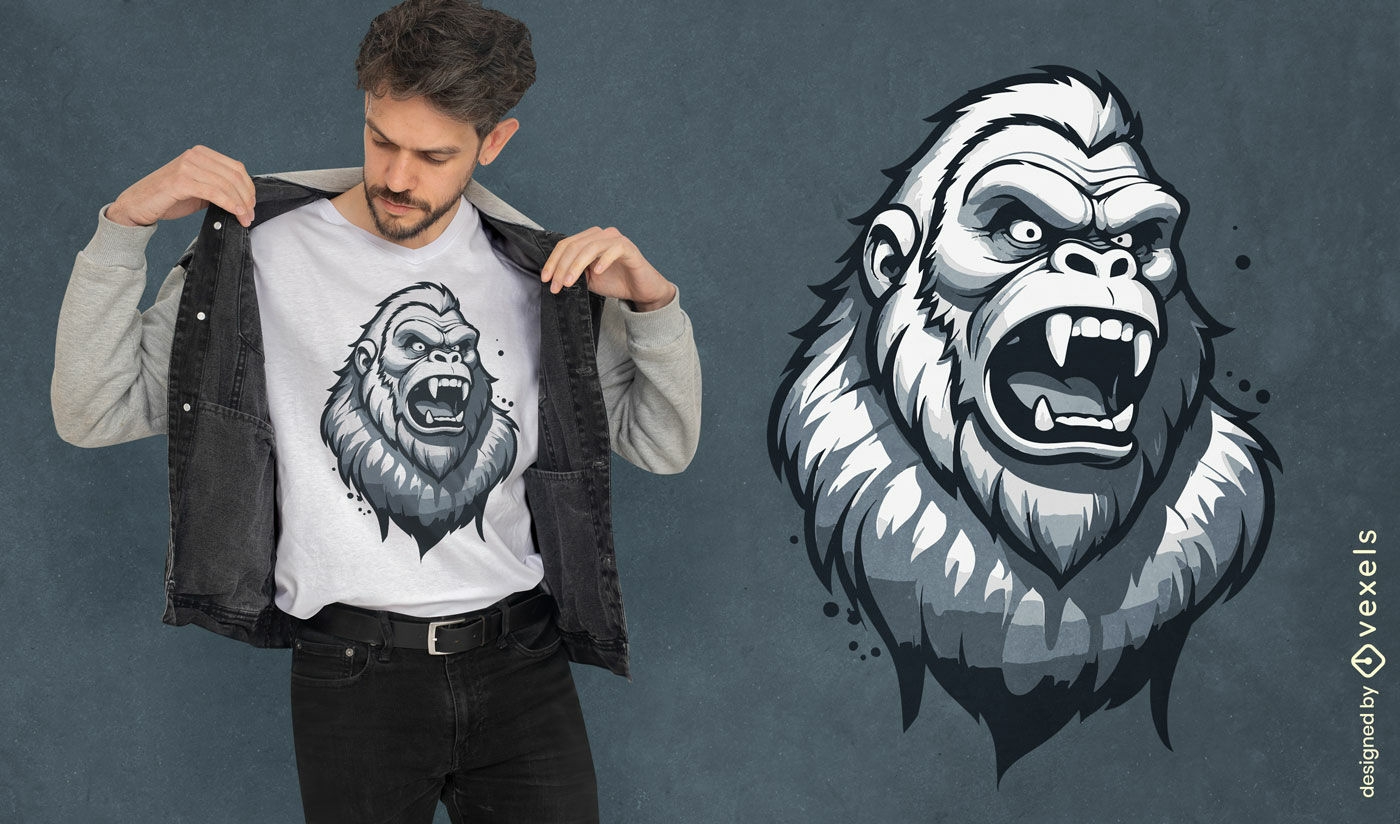
Print ready
for Merch
Aggressive gorilla t-shirt design
Choose a folder
All favorites
Create new
Save
Aggressive gorilla t-shirt design
Print ready
for Merch
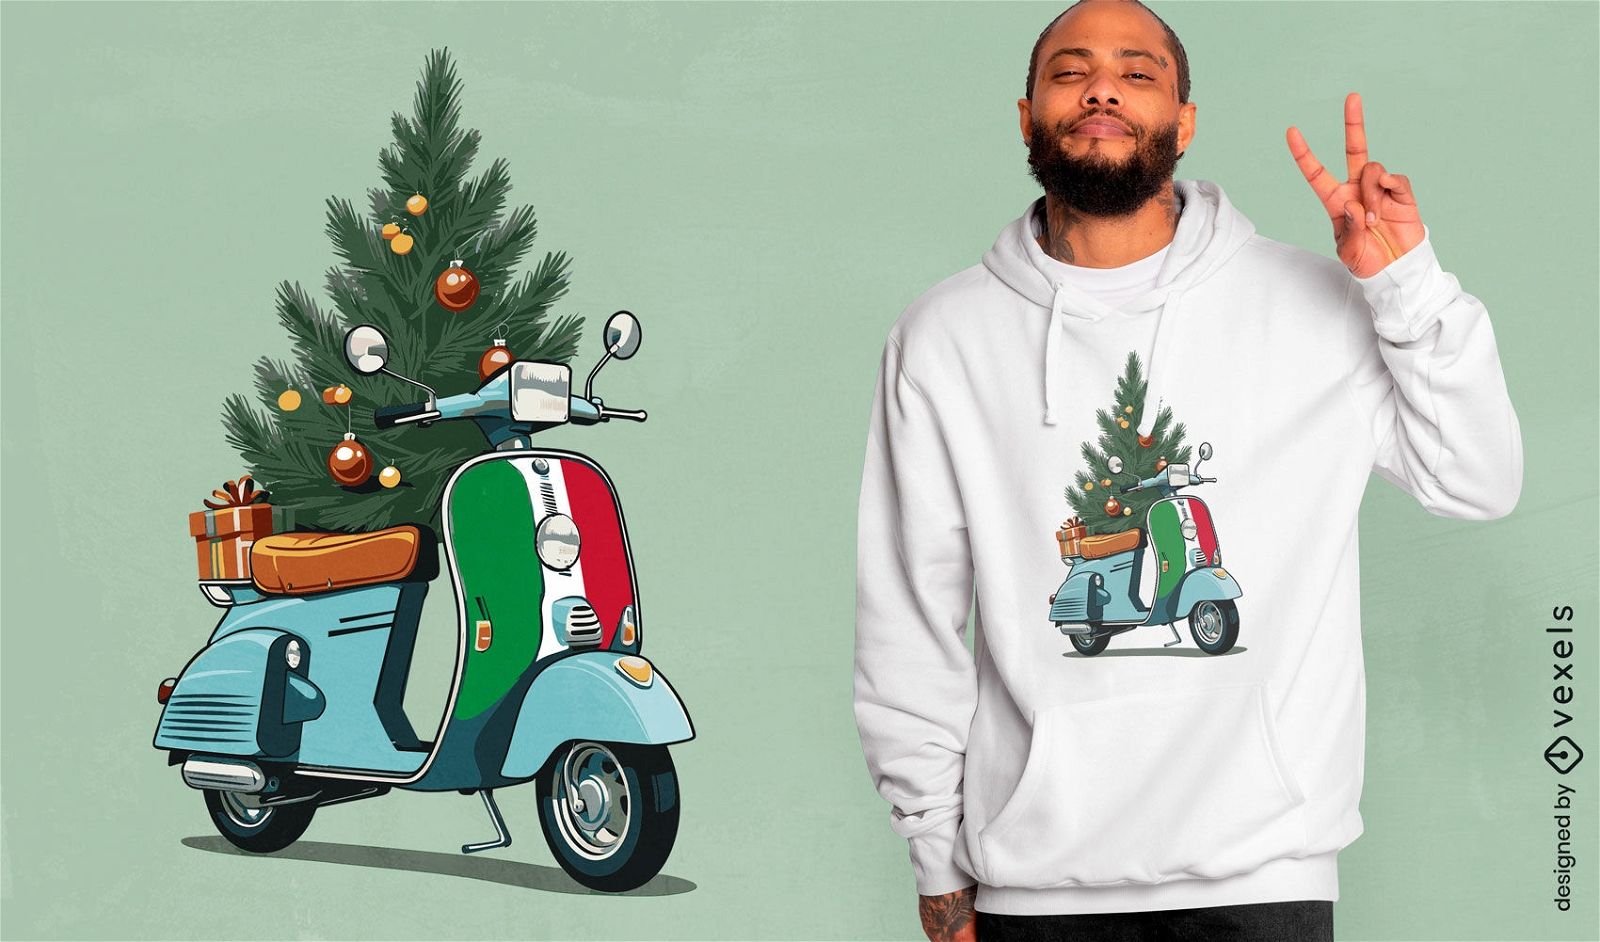
Scooter Christmas tree t-shirt design
Choose a folder
All favorites
Create new
Save
Scooter Christmas tree t-shirt design
Editable text
Print ready
for Merch
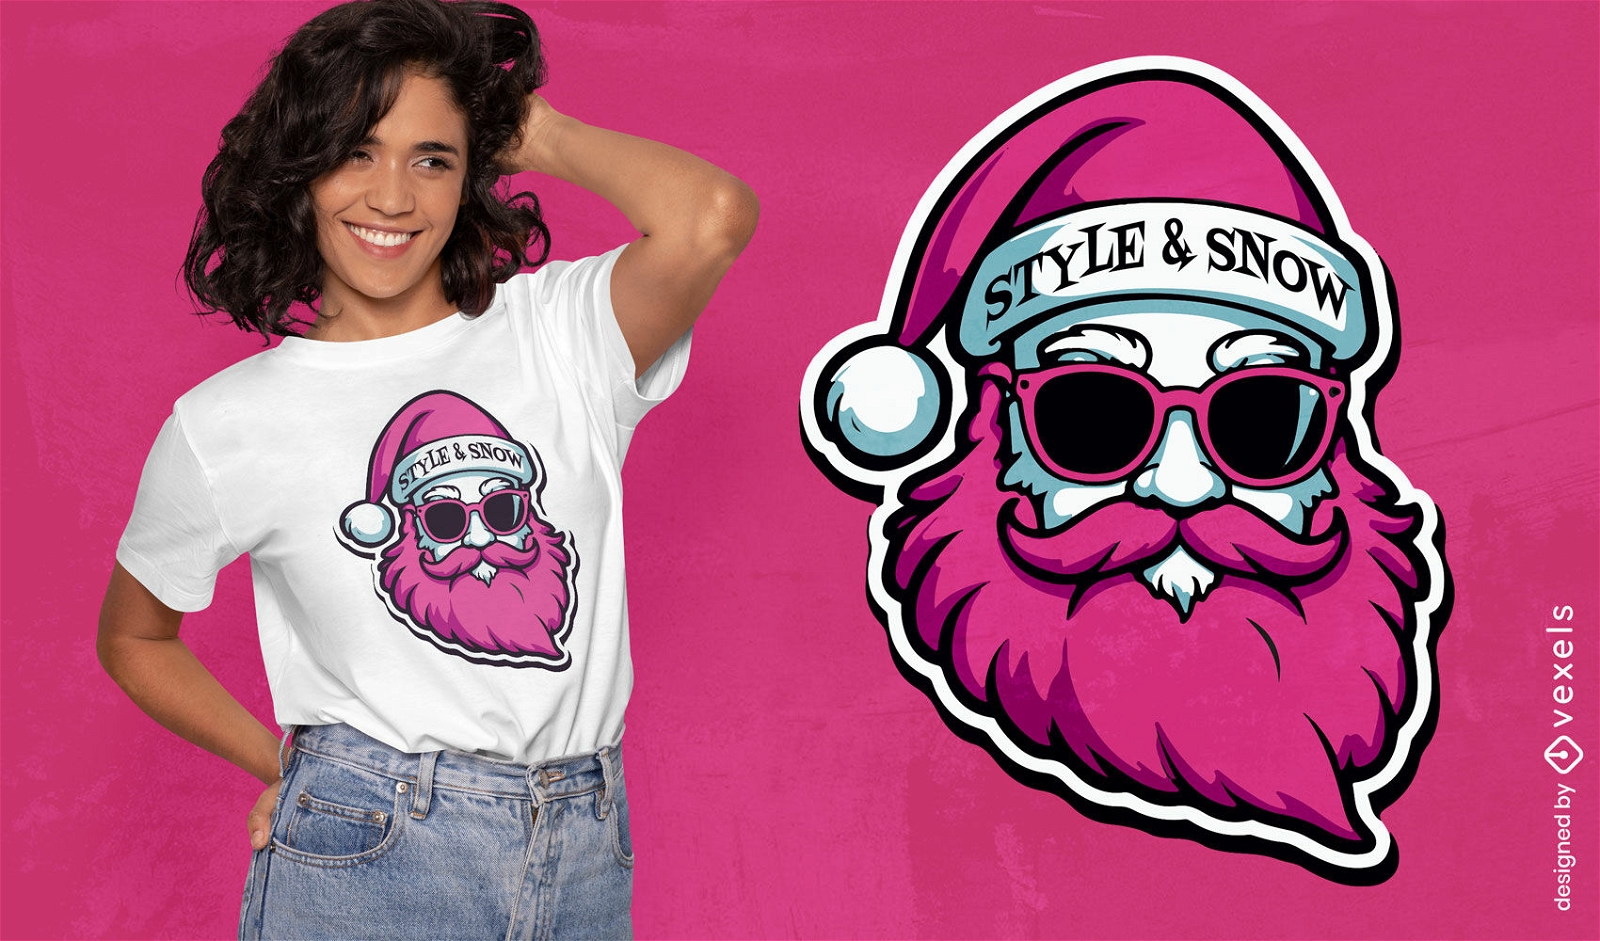
Santa Claus style t-shirt design
Choose a folder
All favorites
Create new
Save
Santa Claus style t-shirt design
Print ready
for Merch
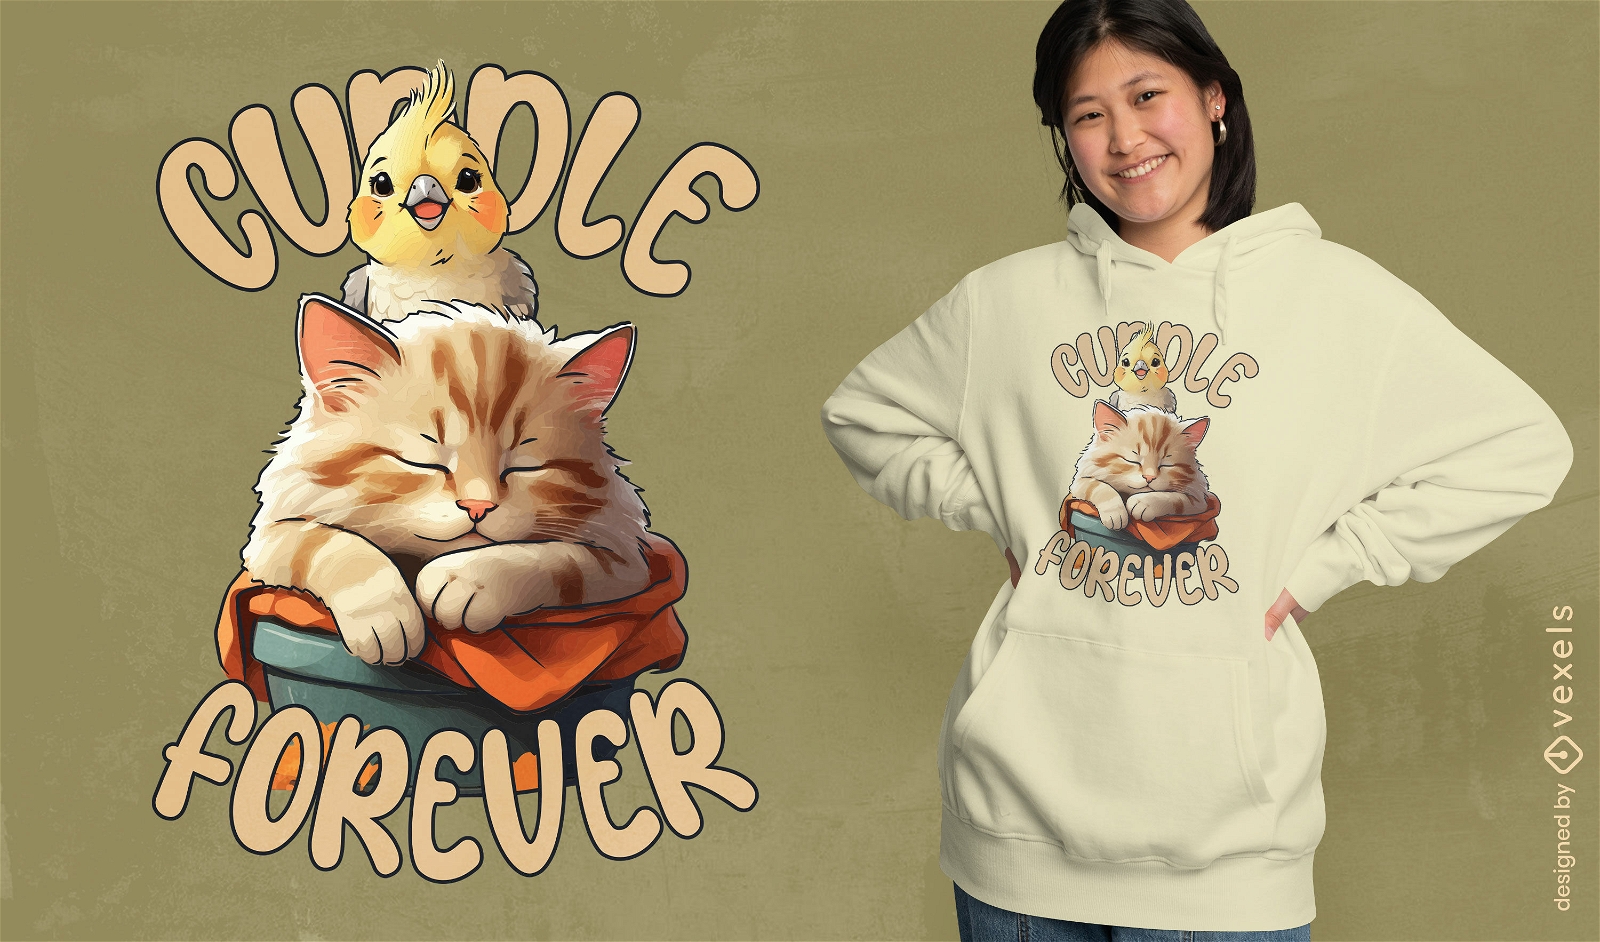
Cute cuddle t-shirt design
Choose a folder
All favorites
Create new
Save
Cute cuddle t-shirt design
Print ready
for Merch
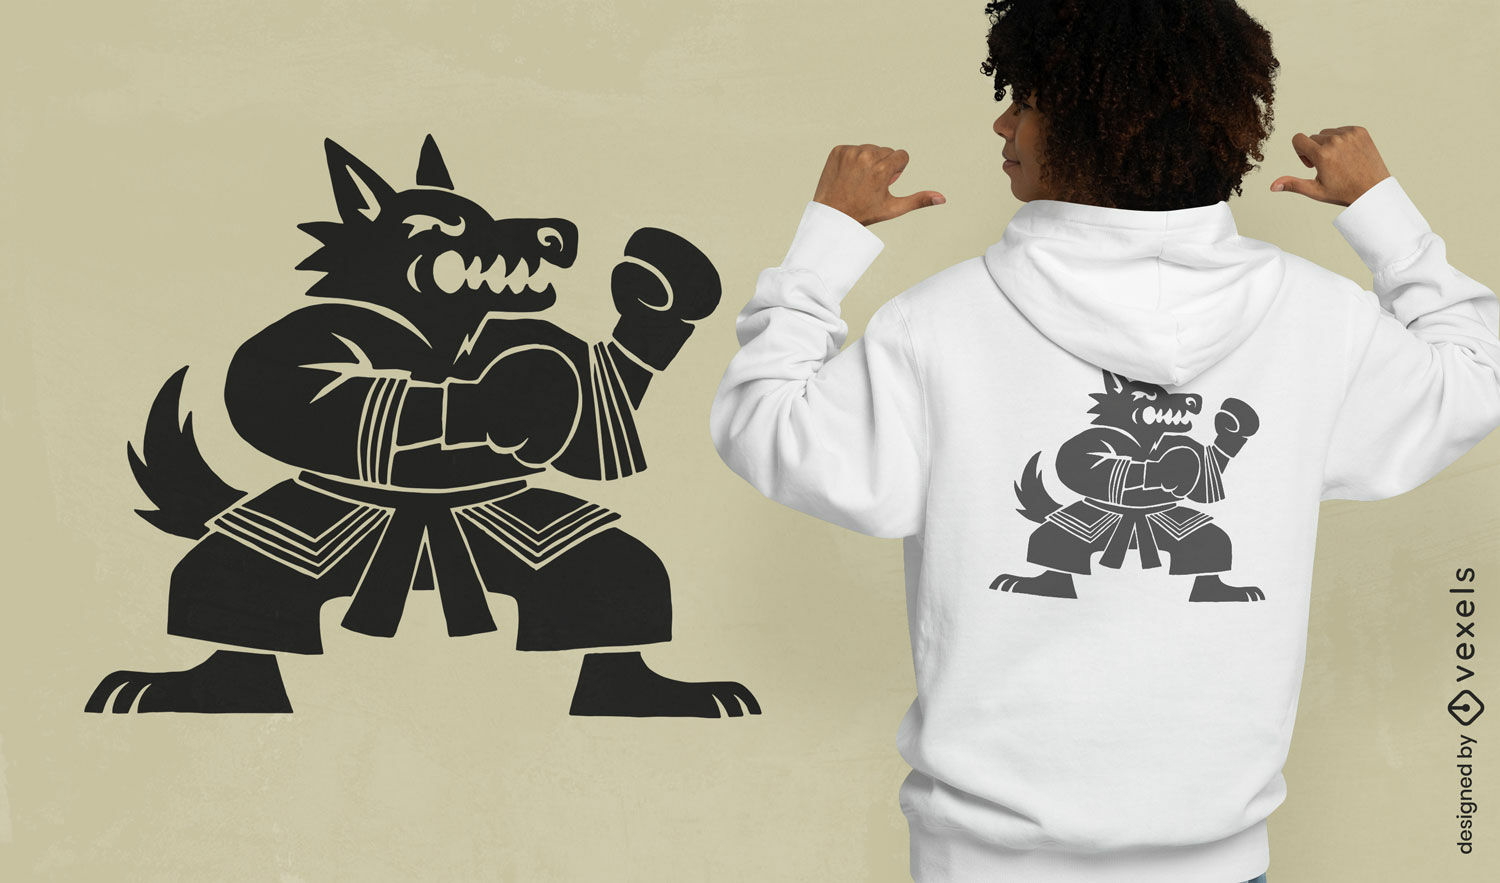
Boxing wolf t-shirt design
Choose a folder
All favorites
Create new
Save
Boxing wolf t-shirt design
Boost Your Business
With The Leading Graphic Platform For Merch.
SEE PLANS
Next
of 720
prev page
next page