Design Library
New Merch Designs
T-Shirts
Vectors
Trending Merch Designs
PNGs & SVGs
Mockups
T-Shirt PSD Templates
Explore Designs
KDP Designs
Posters
Mugs
Phone Cases
Tote Bags
Pillows
Design Tools
Merch Designer
New!
Mockup Generator
AI Design Generator
Image Vectorizer
Quote Generator
T-Shirt Maker (Old)
Resources
Merch Digest
Blog
Help Center
Learn About Merch
Feedback
Corporate Solutions
Enterprise
API Access
Pricing
Loading...
Sign Up
Login
Merch Vectors
grafico
Design Library
New Merch Designs
T-Shirts
Vectors
Trending Merch Designs
PNGs & SVGs
Mockups
T-Shirt PSD Templates
Explore Designs
KDP Designs
Posters
Mugs
Phone Cases
Tote Bags
Pillows
Design Tools
Merch Designer
New!
Mockup Generator
AI Design Generator
Image Vectorizer
Quote Generator
T-Shirt Maker (Old)
Resources
Merch Digest
Blog
Help Center
Learn About Merch
Feedback
Corporate Solutions
Enterprise
API Access
PLANS
Merch Vectors
grafico
35988 grafico Vector Designs for T-Shirts and merch
Download & buy editable grafico AI Vector Graphics Designs for T shirts, Phone Cases, Book Covers and other Merch
Sort by
Most relevant
Sponsored results by
Get 15% off with code: VEXELS15
Show more
Print ready
for Merch
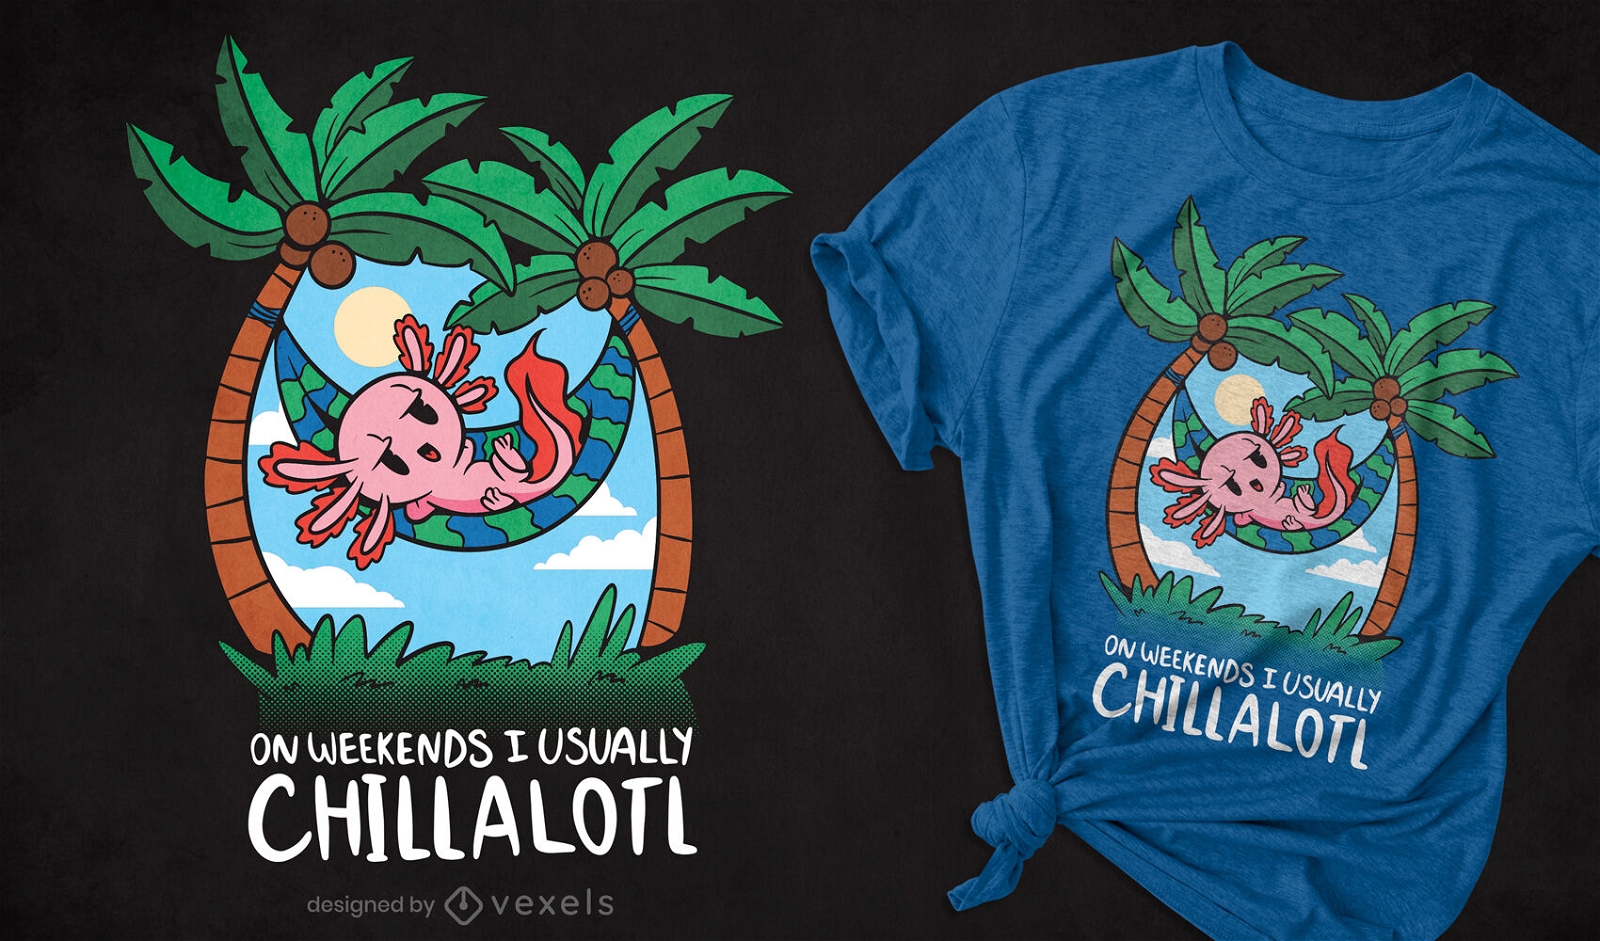
Chilling axolotl cartoon t-shirt design
Choose a folder
All favorites
Create new
Save
Chilling axolotl cartoon t-shirt design
Print ready
for Merch
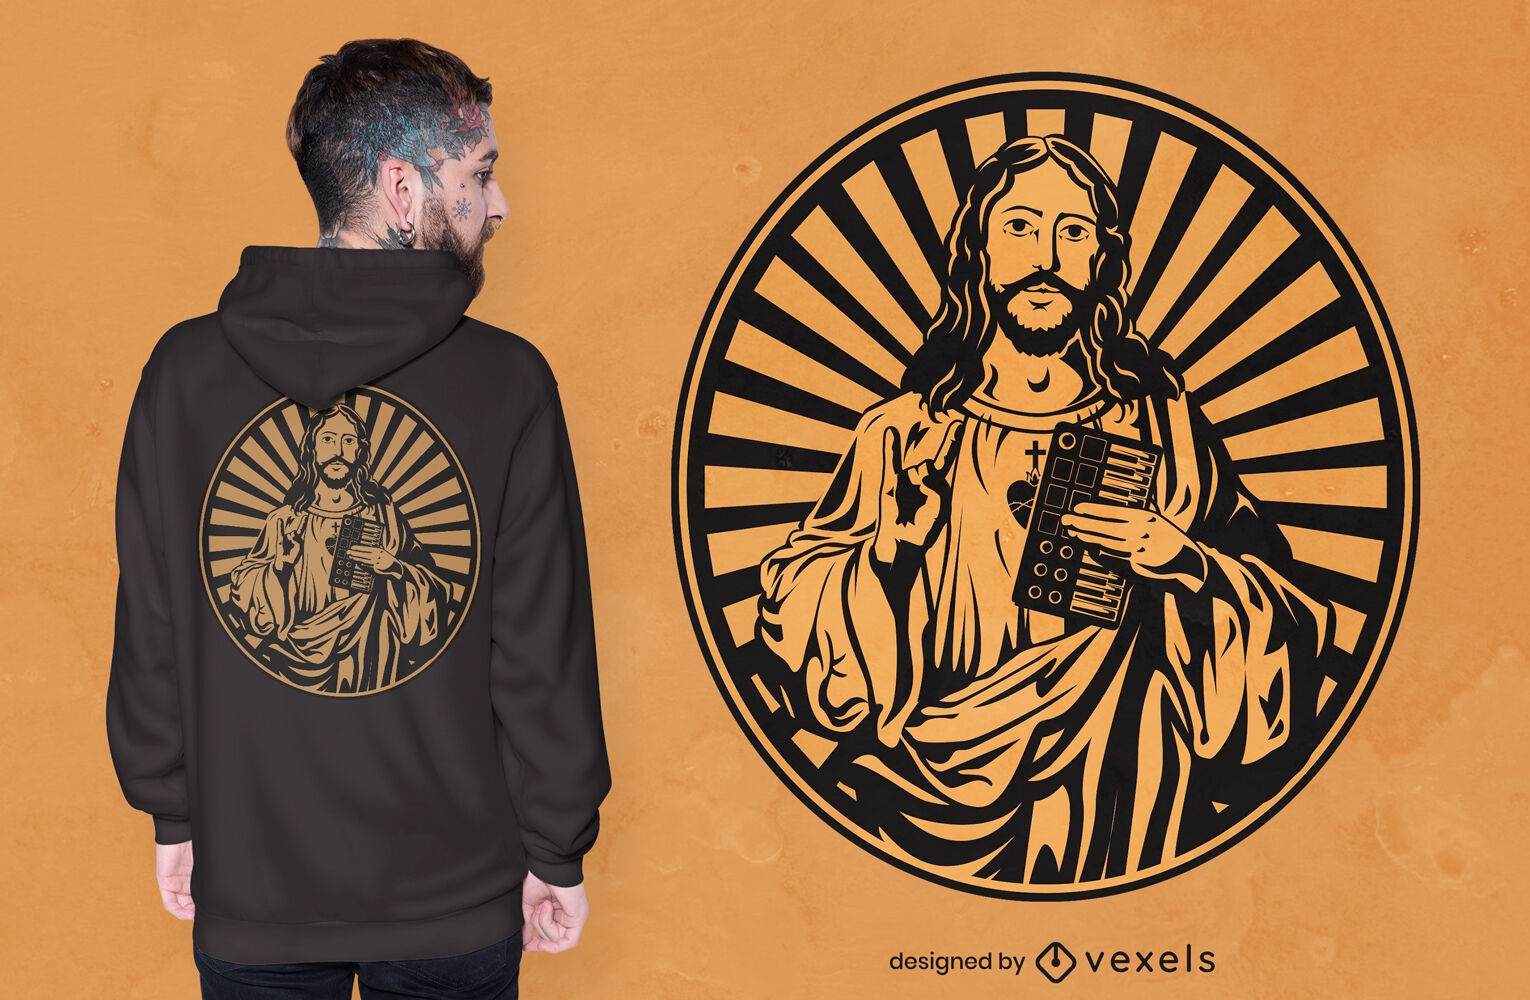
Jesus with synthesizer t-shirt design
Choose a folder
All favorites
Create new
Save
Jesus with synthesizer t-shirt design
Print ready
for Merch
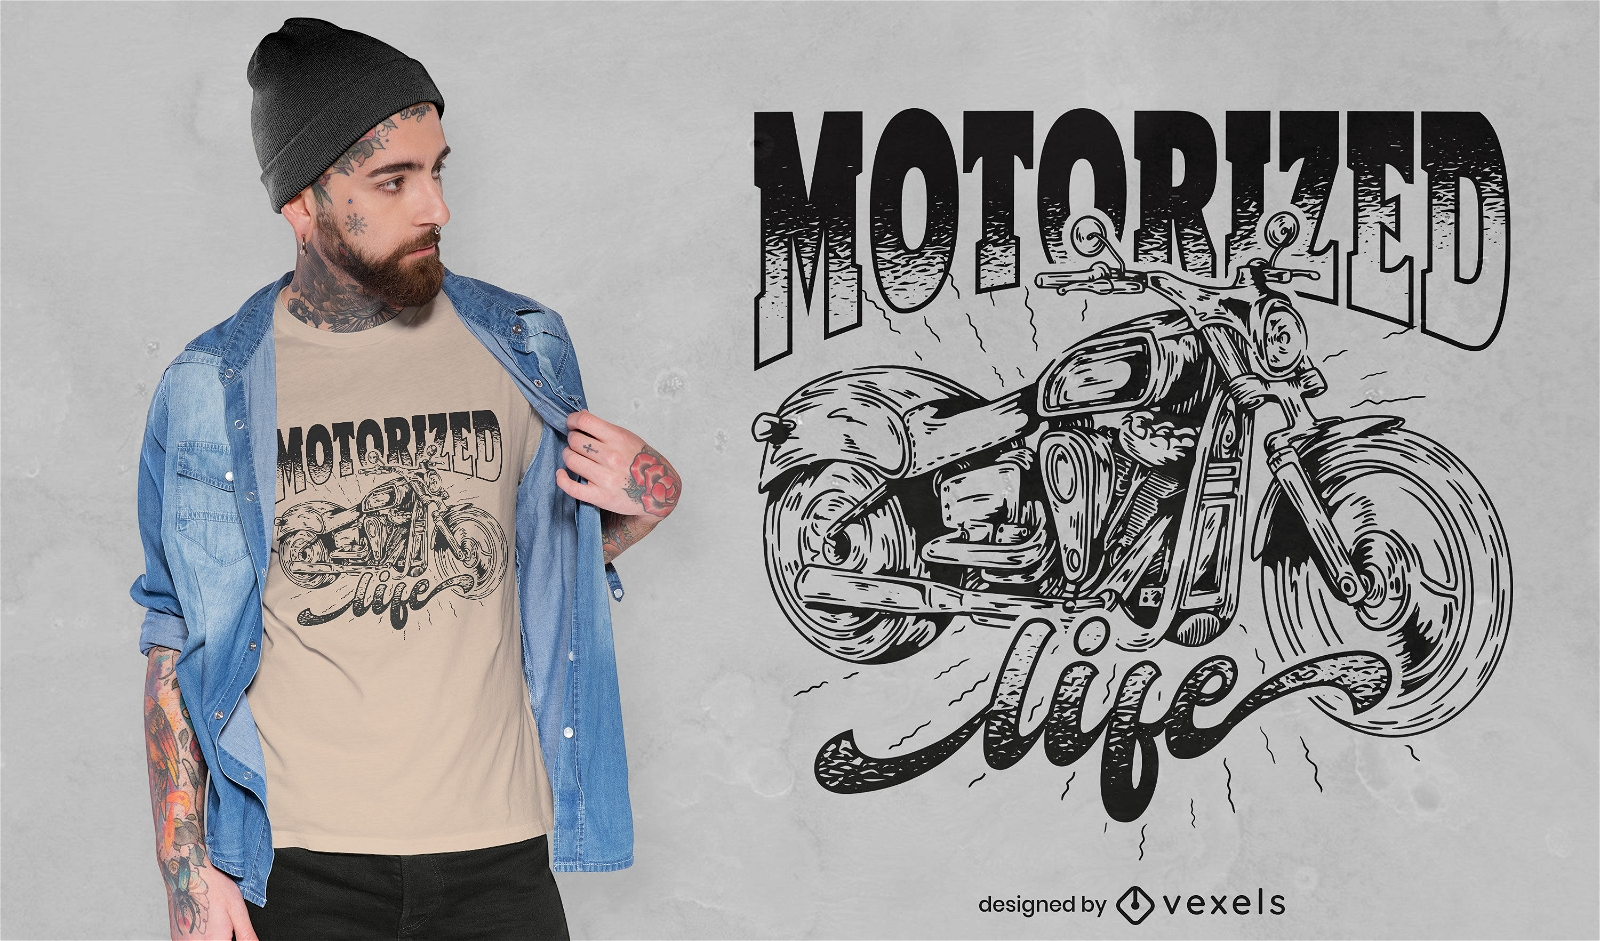
Hand drawn motorcycle t-shirt design
Choose a folder
All favorites
Create new
Save
Hand drawn motorcycle t-shirt design
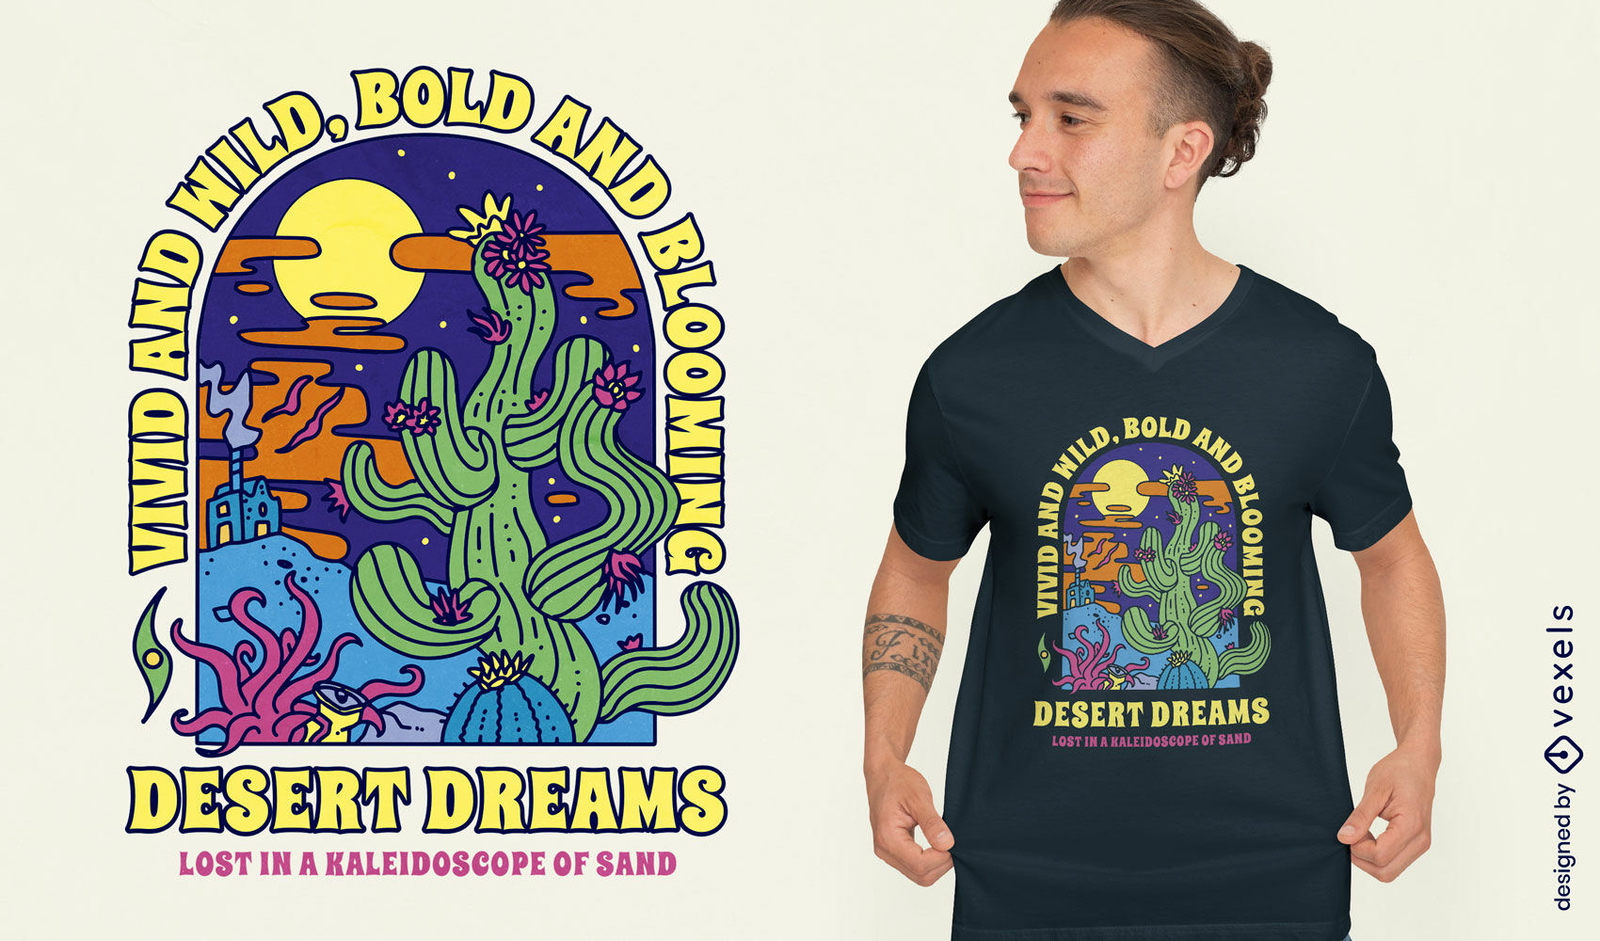
Editable text
Print ready
for Merch
Artistic chaos t-shirt design
Choose a folder
All favorites
Create new
Save
Artistic chaos t-shirt design
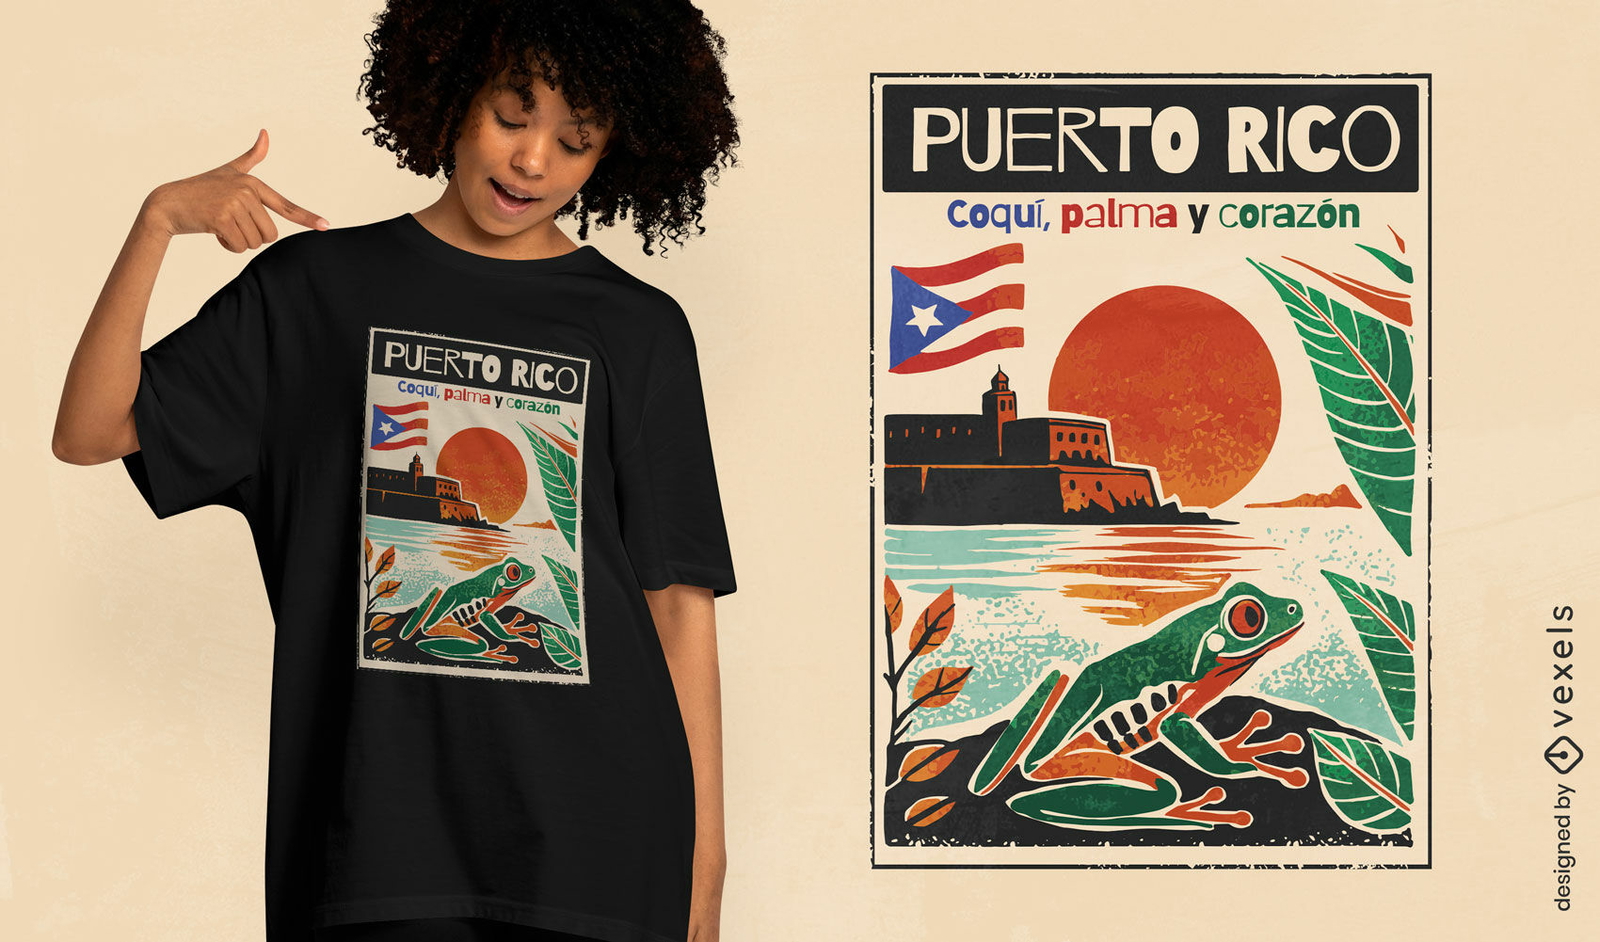
Editable text
Print ready
for Merch
Puerto Rico travel poster t-shirt design
Choose a folder
All favorites
Create new
Save
Puerto Rico travel poster t-shirt design
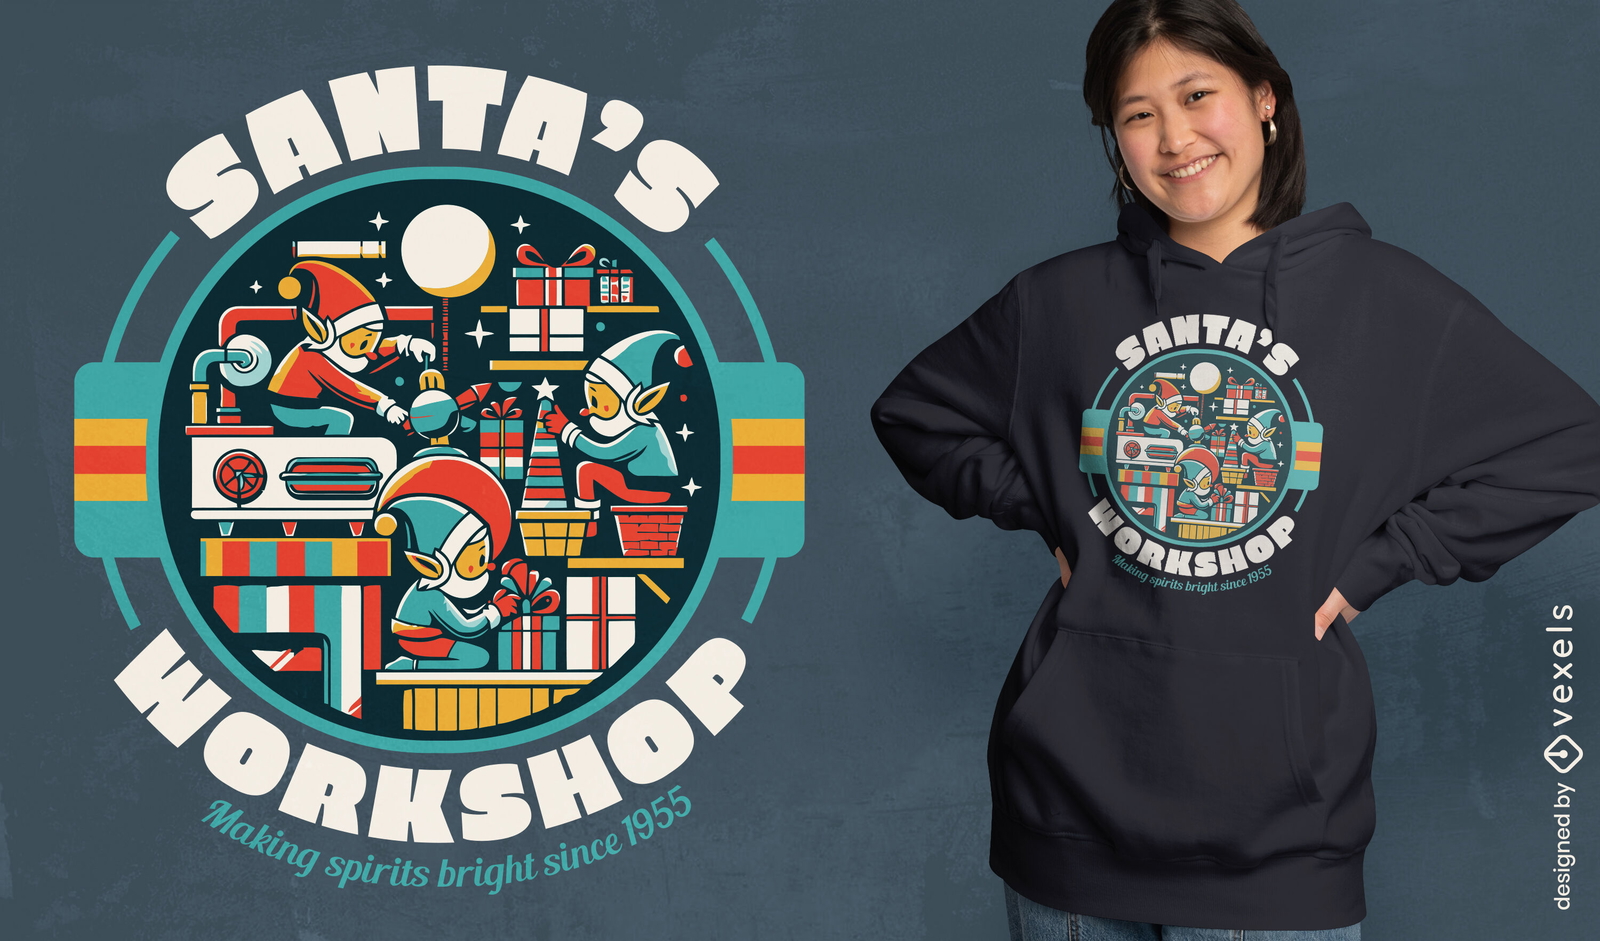
Editable text
Print ready
for Merch
Santa's workshop t-shirt design
Choose a folder
All favorites
Create new
Save
Santa's workshop t-shirt design
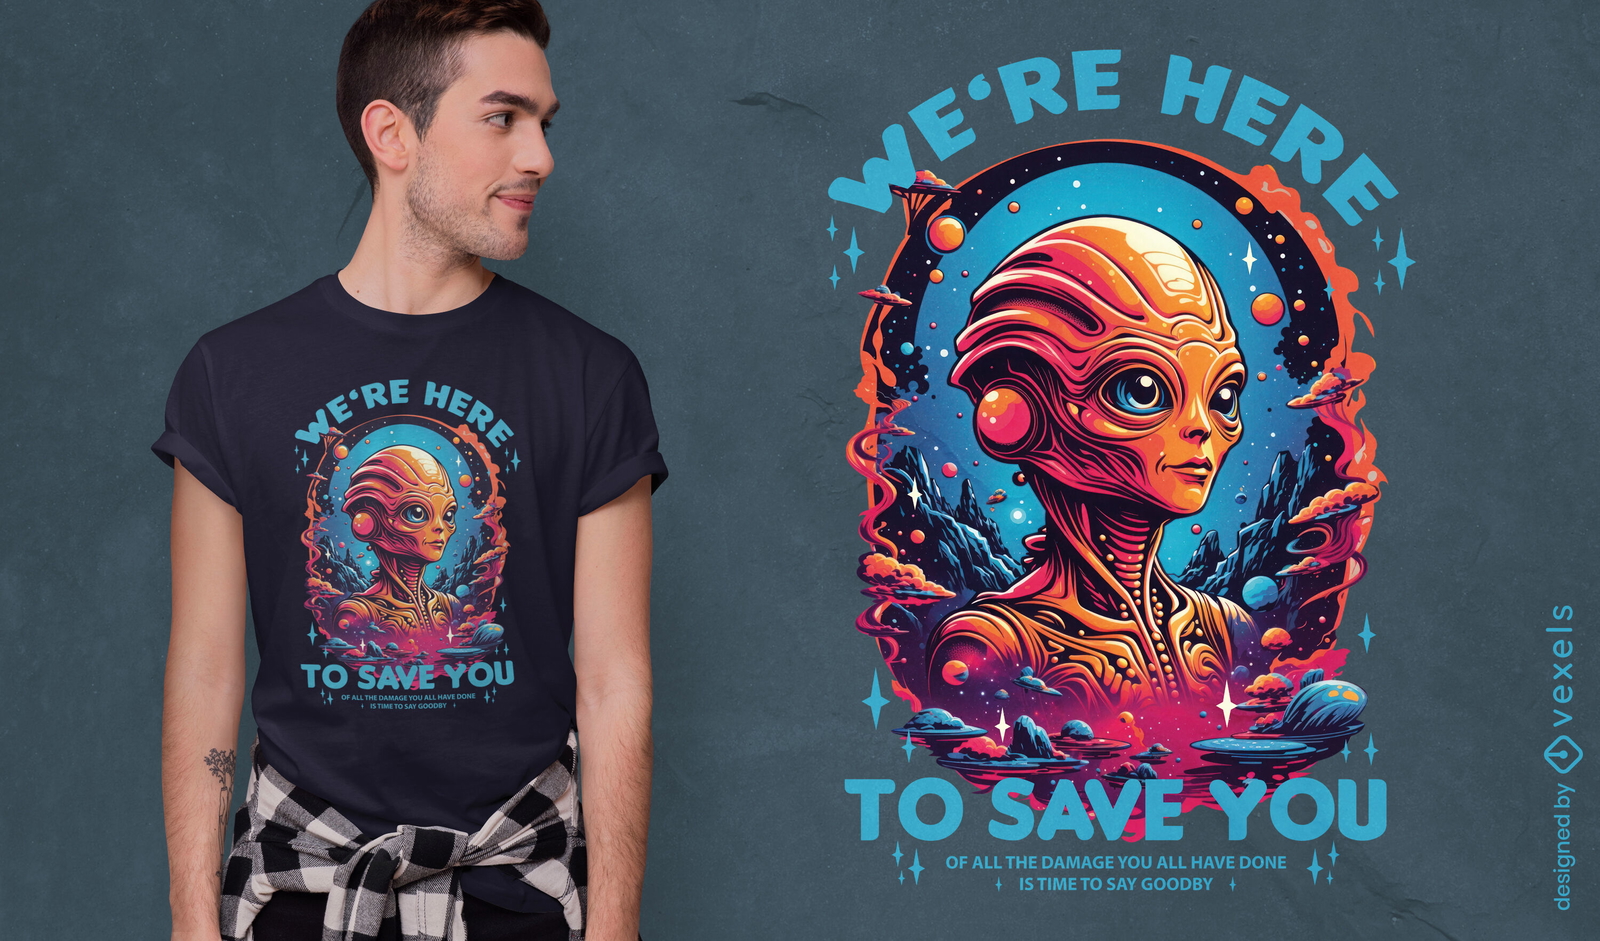
Editable text
Print ready
for Merch
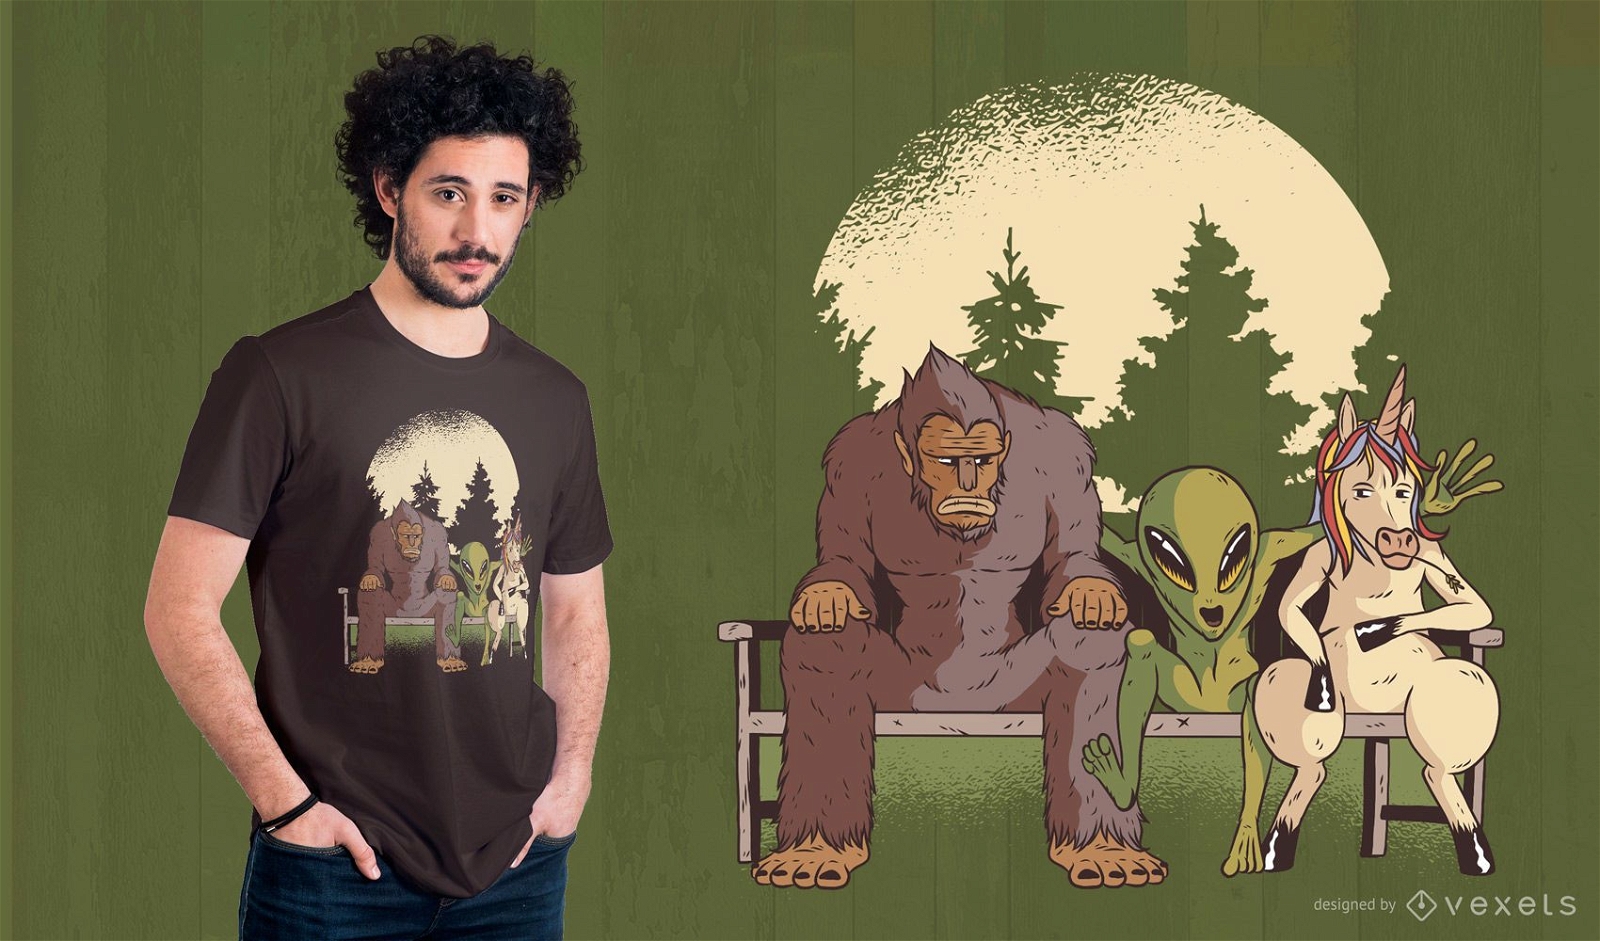
Alien savior t-shirt design
Choose a folder
All favorites
Create new
Save
Alien savior t-shirt design
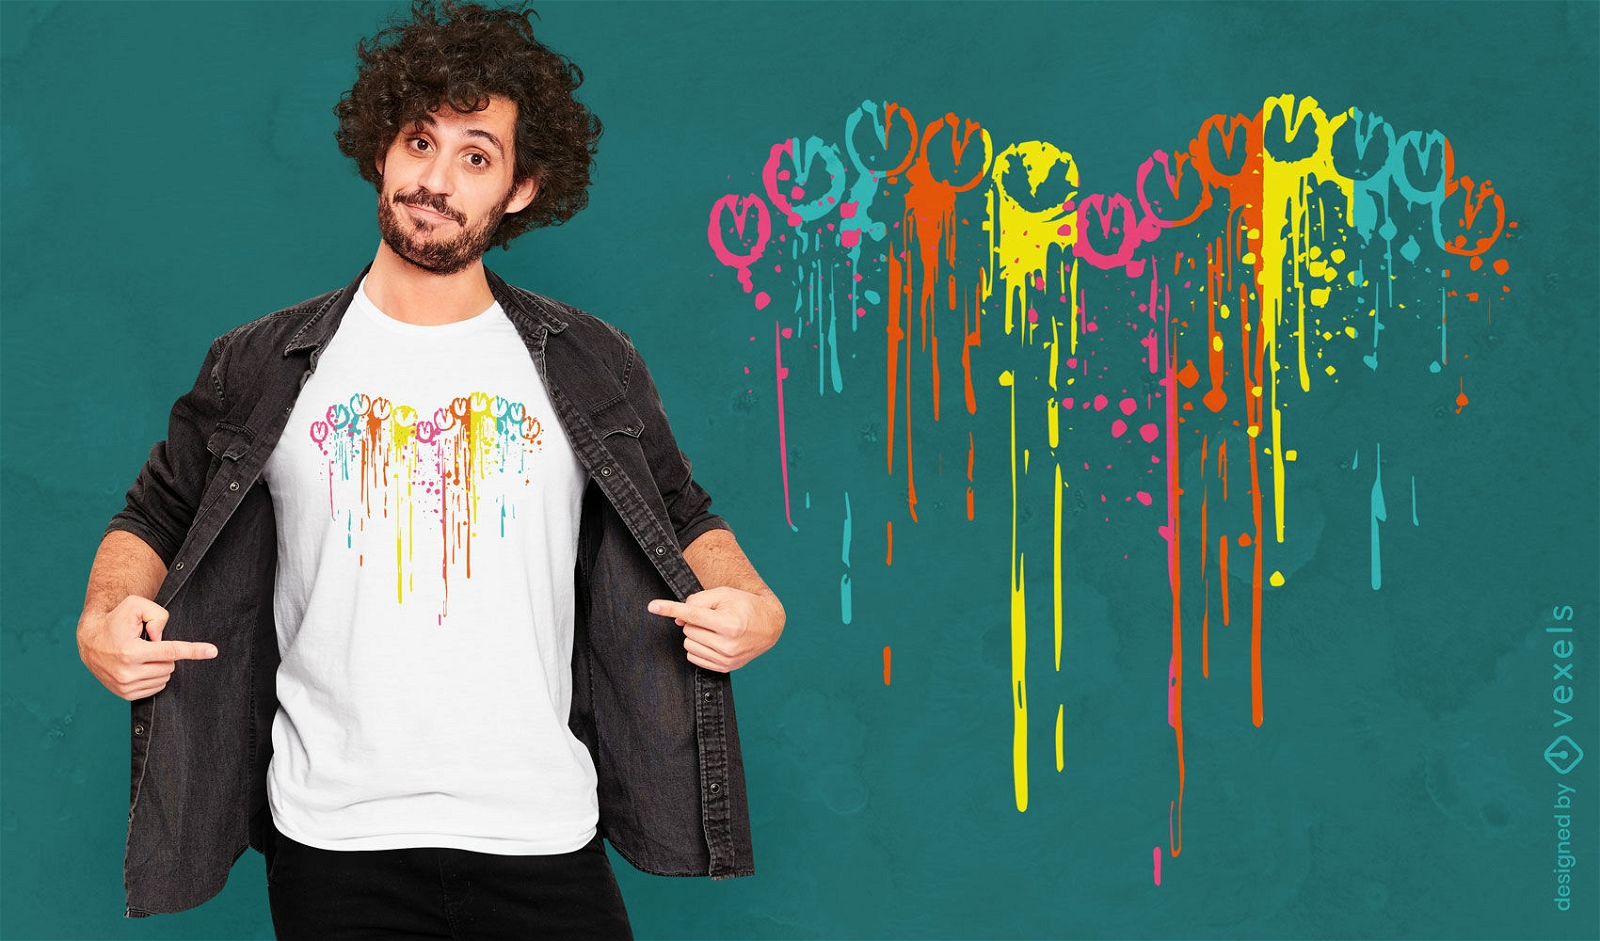
Print ready
for Merch
Hearts to horse abstract t-shirt design
Choose a folder
All favorites
Create new
Save
Hearts to horse abstract t-shirt design
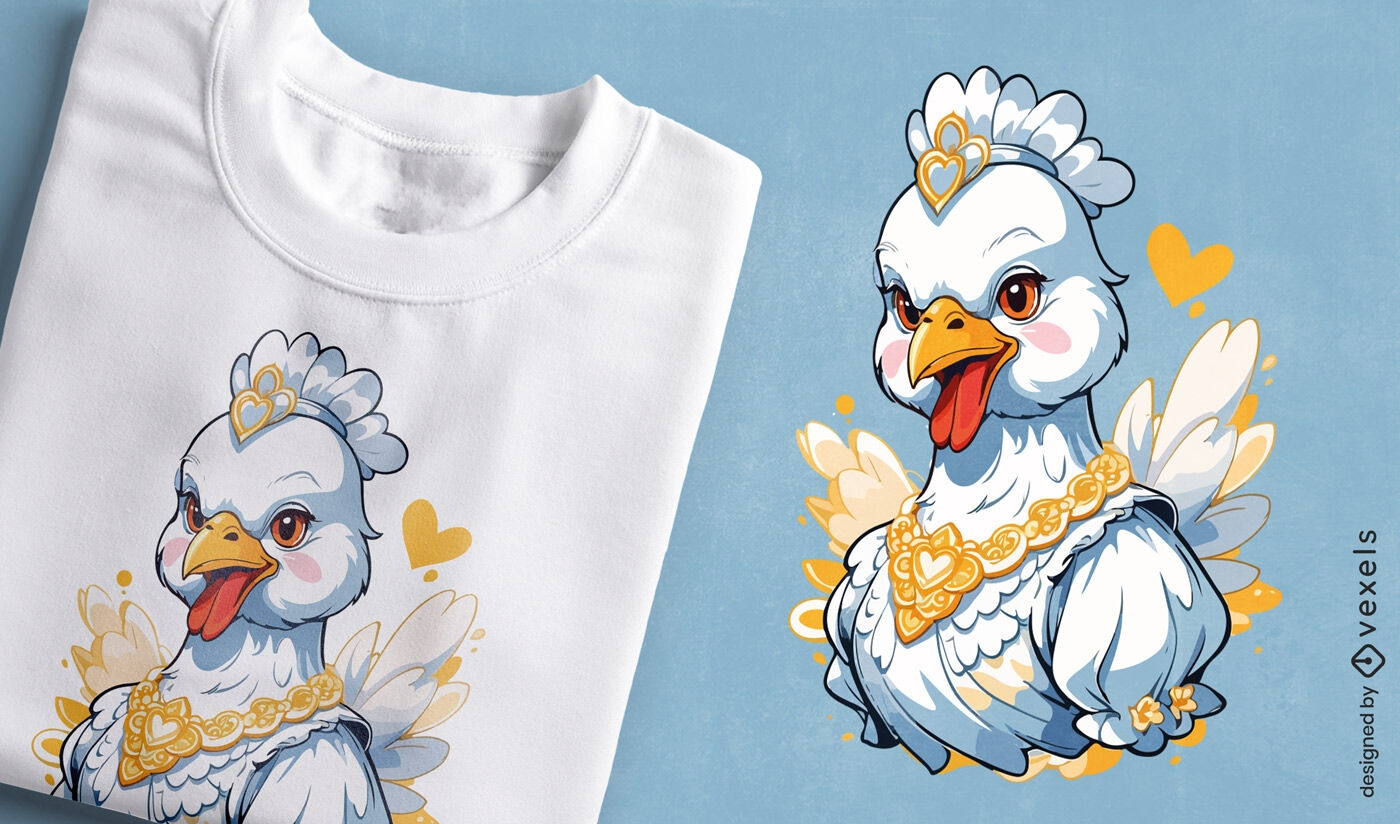
Print ready
for Merch
Luxurious jeweled chicken t-shirt design
Choose a folder
All favorites
Create new
Save
Luxurious jeweled chicken t-shirt design
Editable text
Print ready
for Merch
Graduation mom celebration t-shirt design
Choose a folder
All favorites
Create new
Save
Graduation mom celebration t-shirt design
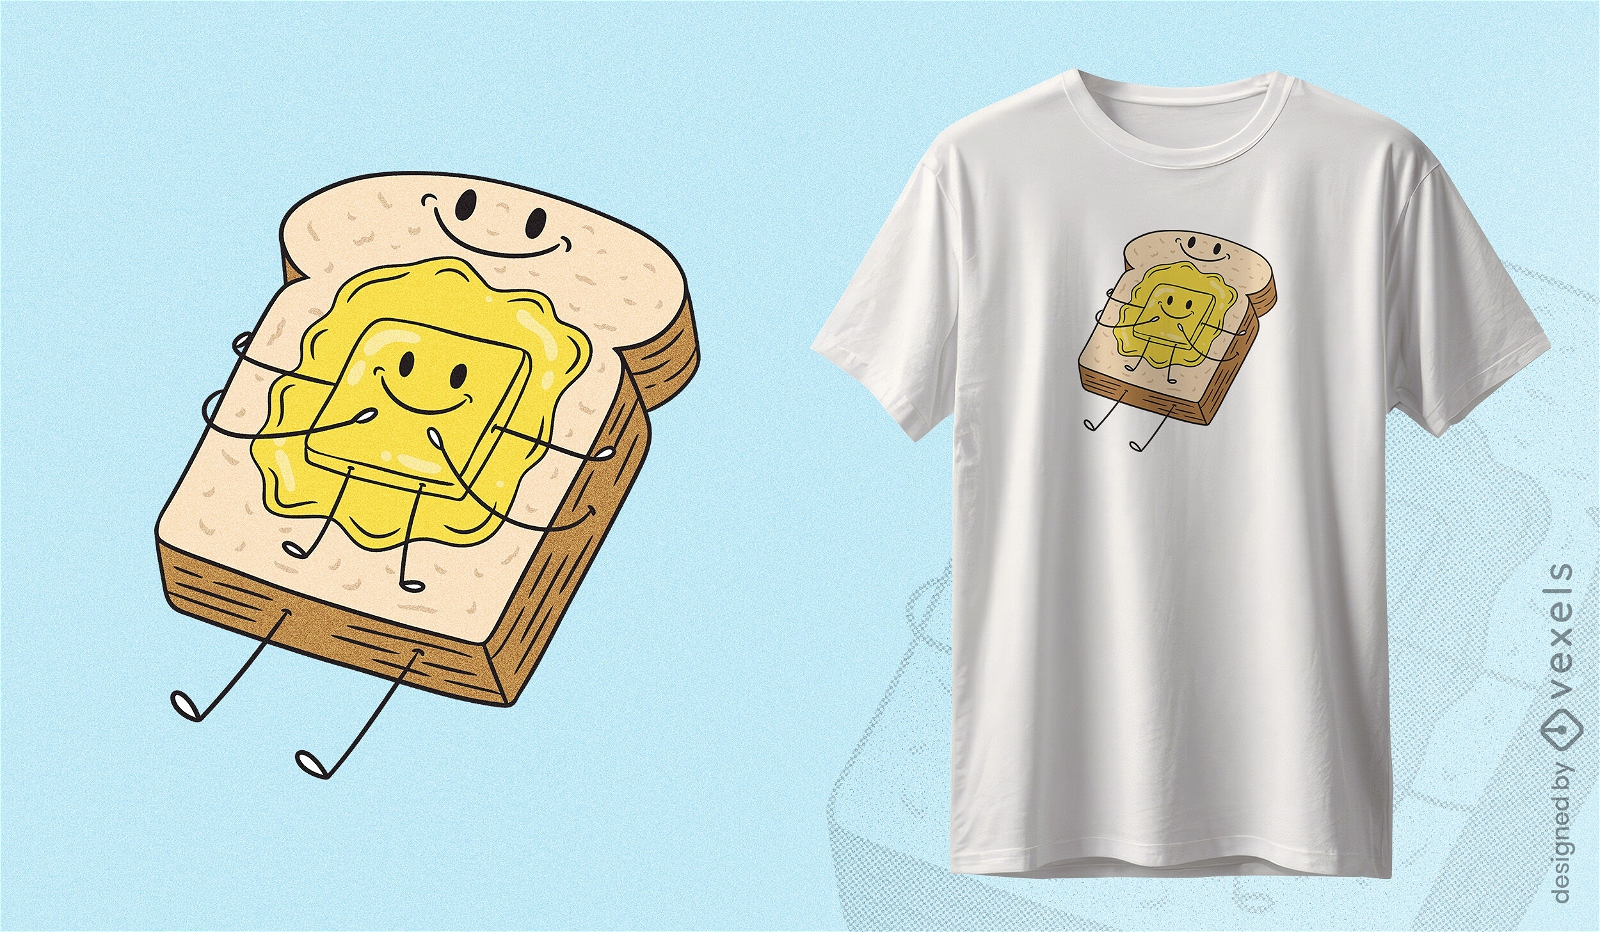
Print ready
for Merch
Toast and butter cute t-shirt design
Choose a folder
All favorites
Create new
Save
Toast and butter cute t-shirt design
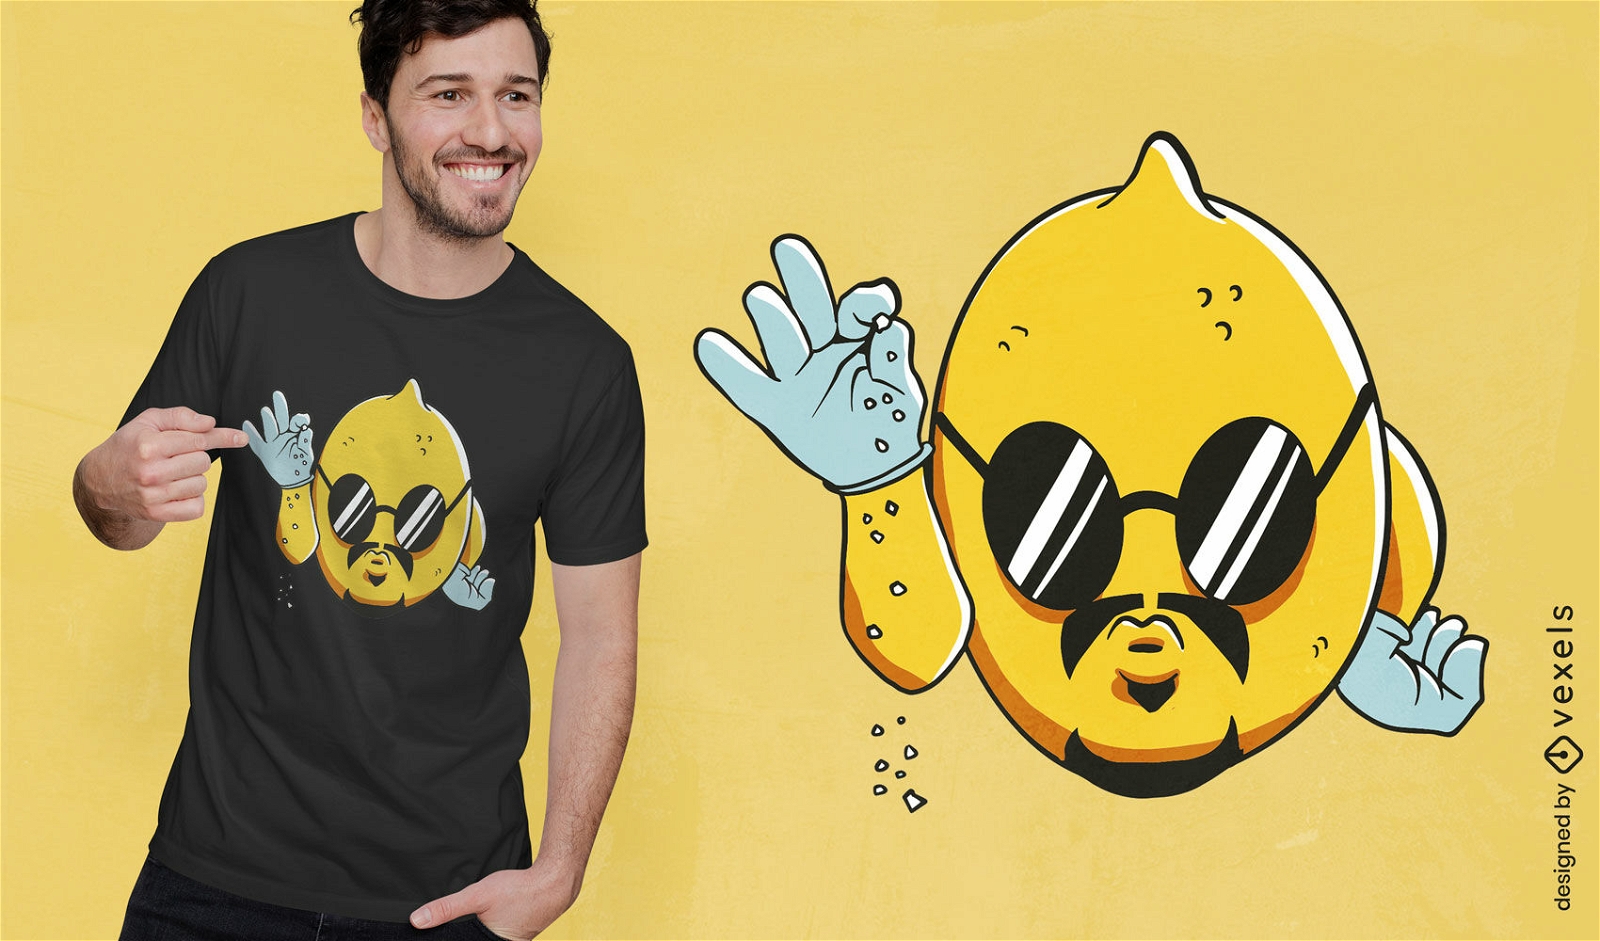
Print ready
for Merch
Salt and lemon parody t-shirt design
Choose a folder
All favorites
Create new
Save
Salt and lemon parody t-shirt design
Editable text
Print ready
for Merch
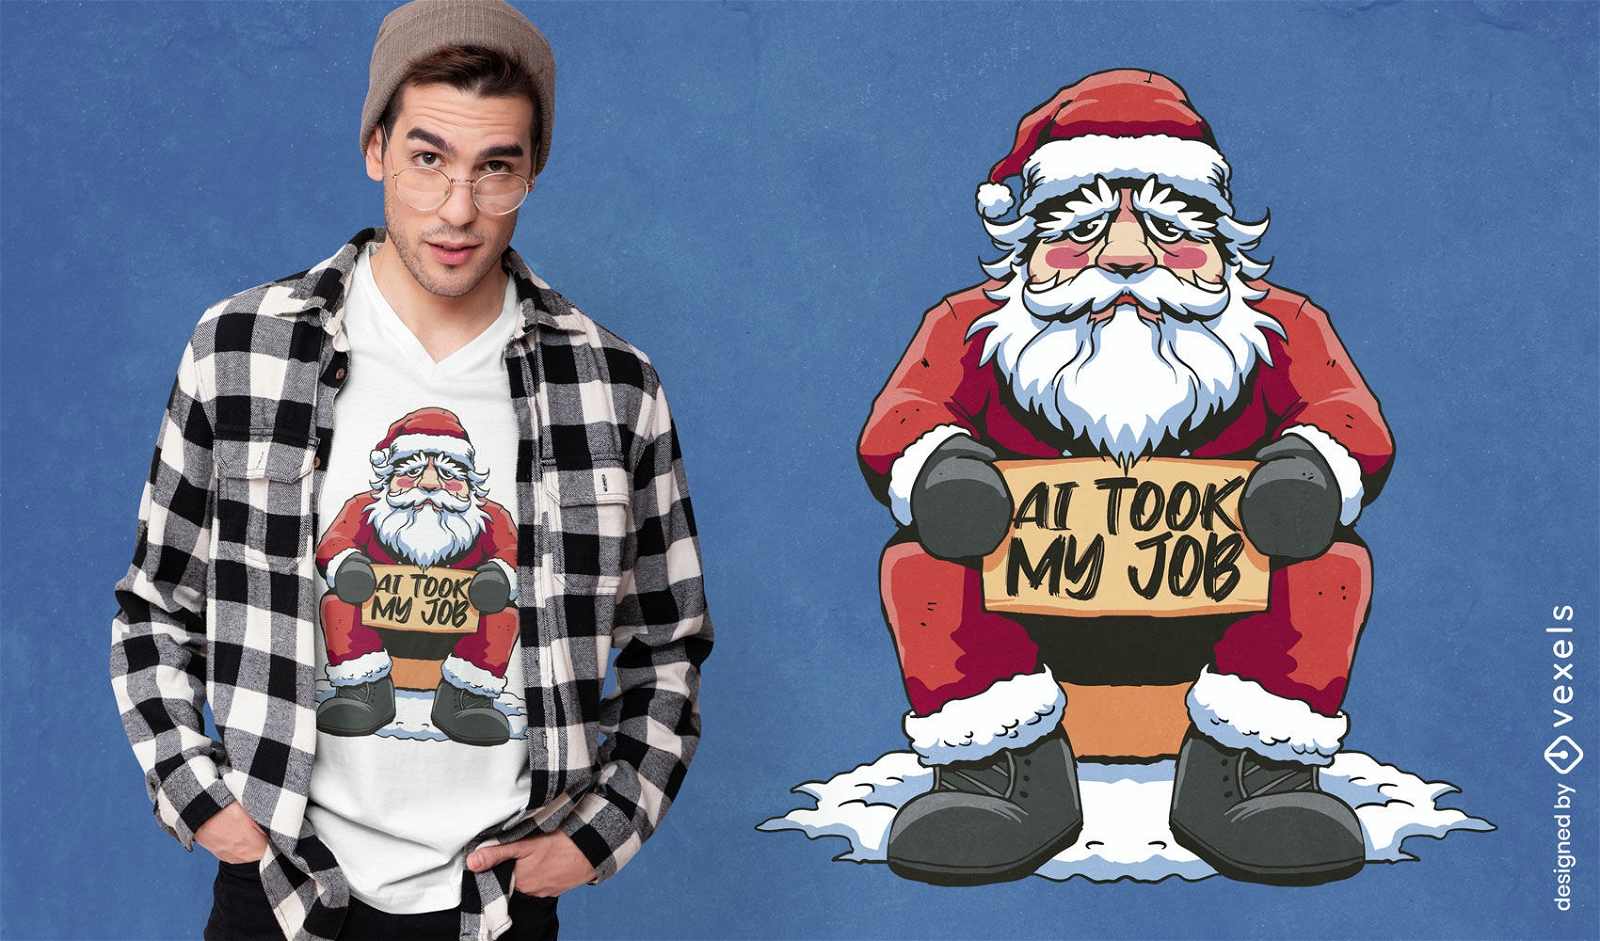
Holiday humor t-shirt design
Choose a folder
All favorites
Create new
Save
Holiday humor t-shirt design
Print ready
for Merch
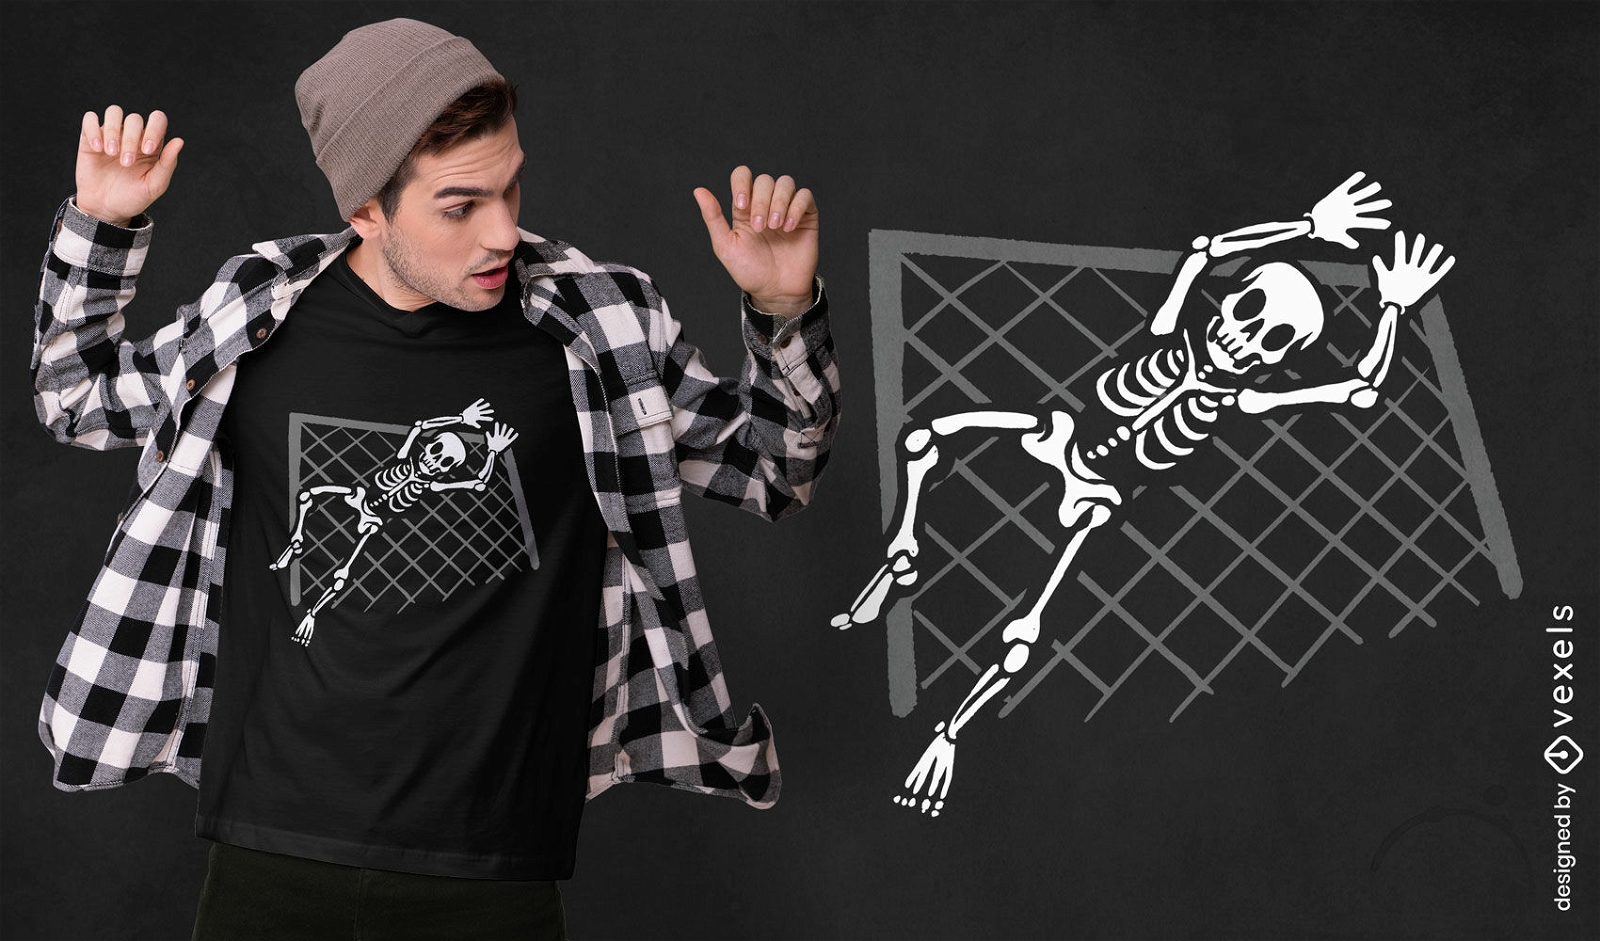
Skeleton goalkeeper t-shirt design
Choose a folder
All favorites
Create new
Save
Skeleton goalkeeper t-shirt design
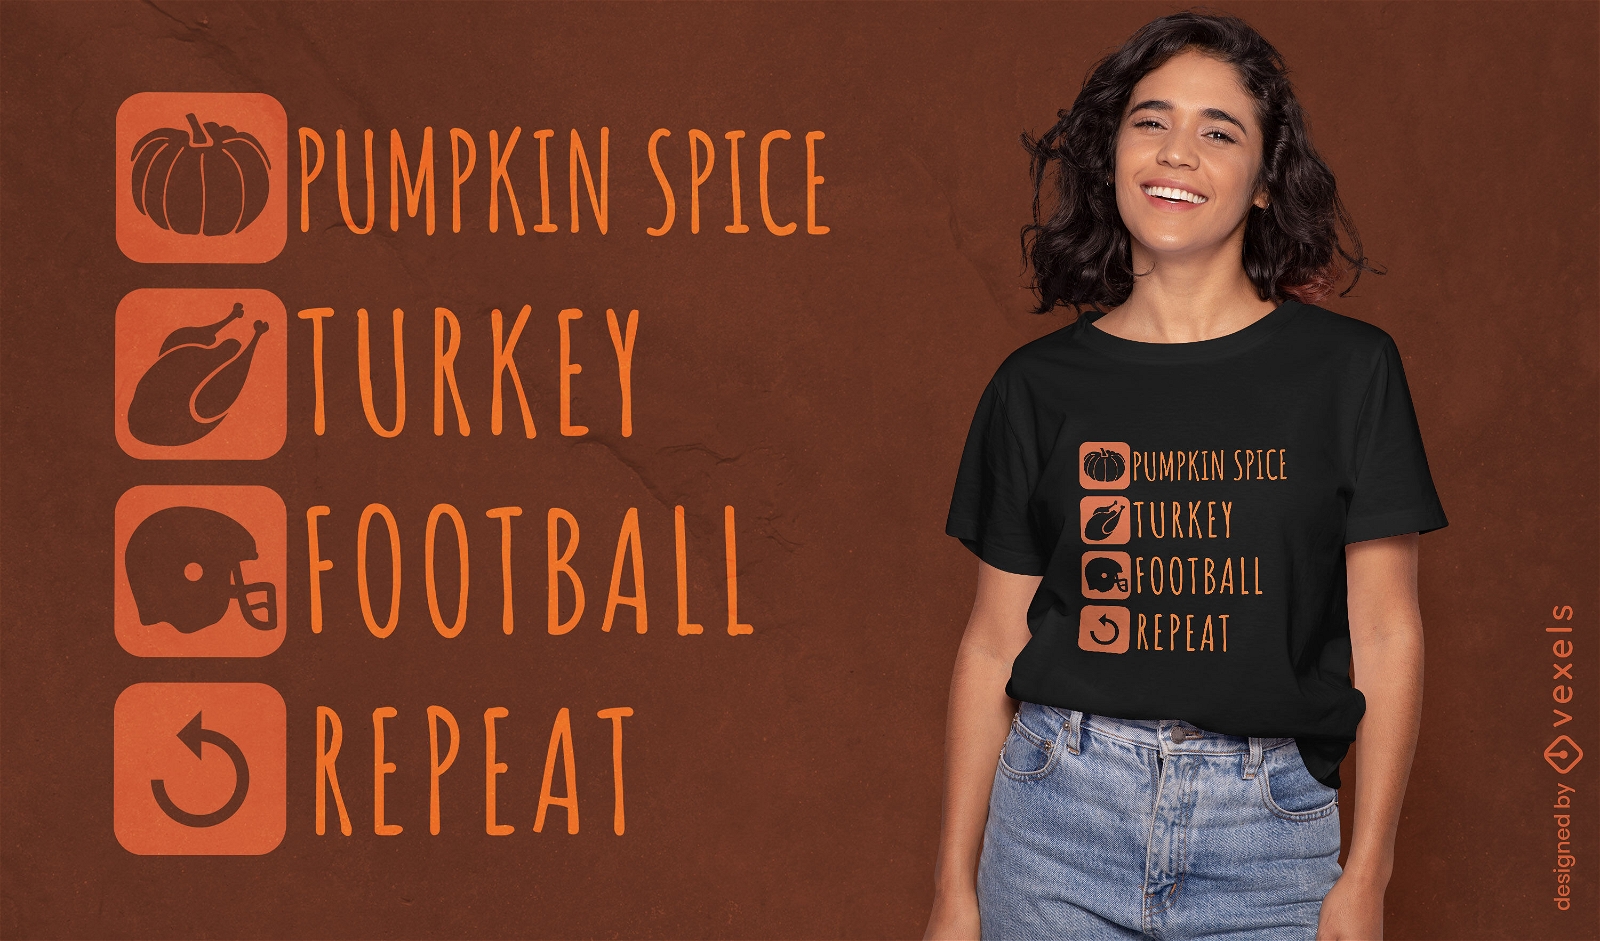
Editable text
Print ready
for Merch
Thanksgiving routine t-shirt design
Choose a folder
All favorites
Create new
Save
Thanksgiving routine t-shirt design
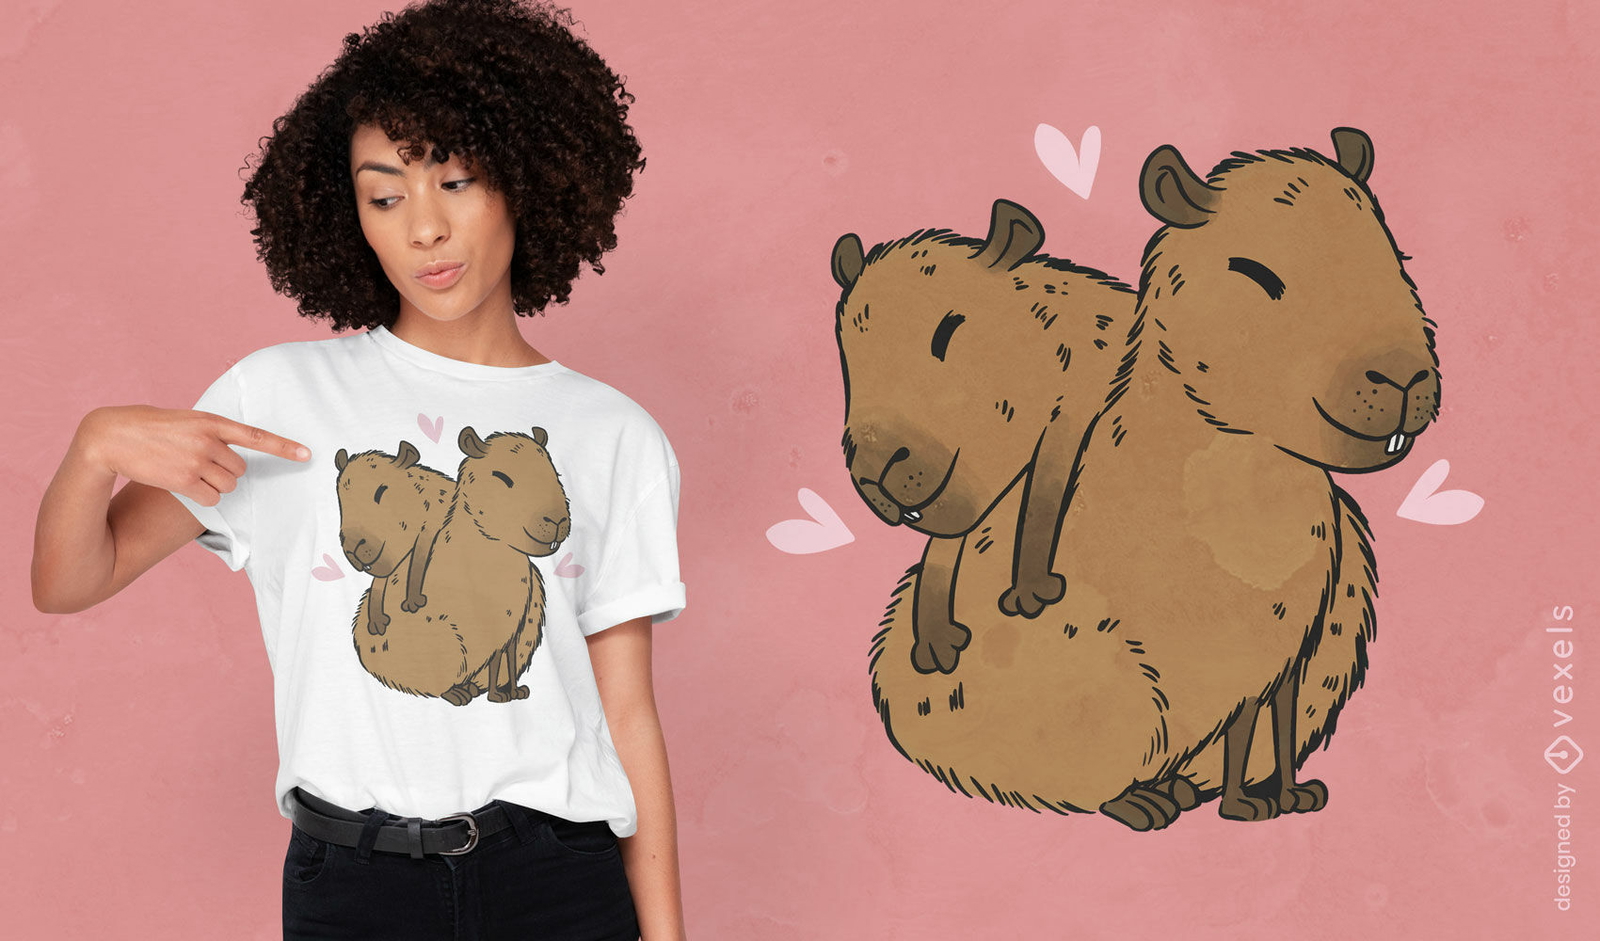
Print ready
for Merch
Capybara babies animals t-shirt design
Choose a folder
All favorites
Create new
Save
Capybara babies animals t-shirt design
Editable text
Print ready
for Merch
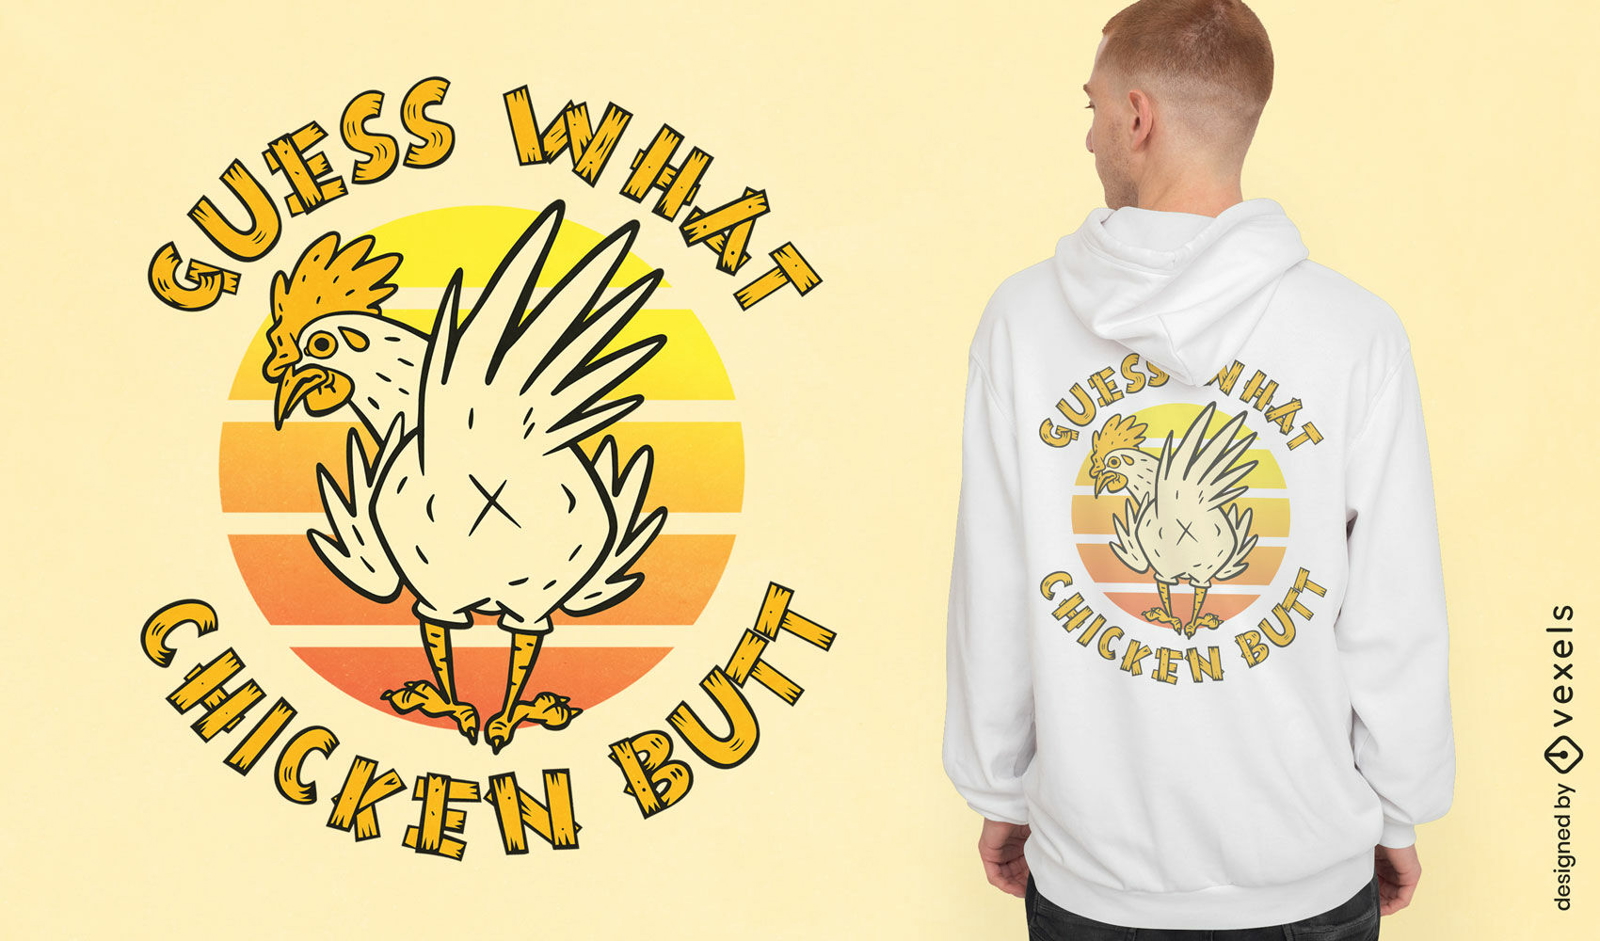
Funny chicken retro sunset t-shirt design
Choose a folder
All favorites
Create new
Save
Funny chicken retro sunset t-shirt design
Print ready
for Merch
Gemini zodiac steampunk girls t-shirt design
Choose a folder
All favorites
Create new
Save
Gemini zodiac steampunk girls t-shirt design
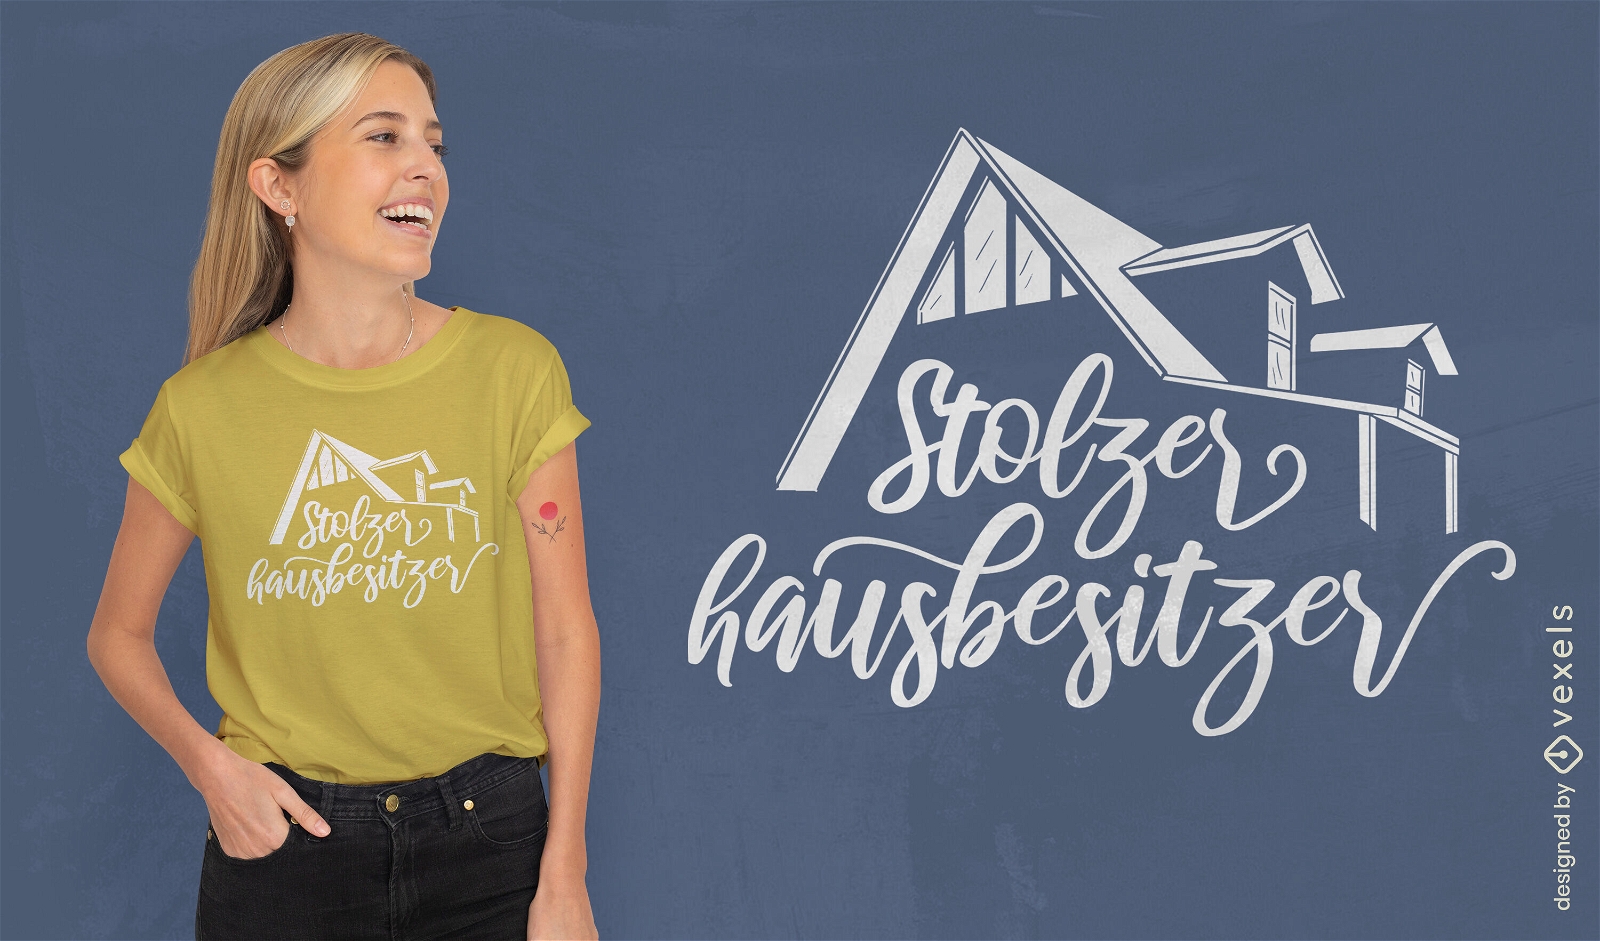
German Content
Print ready
for Merch
Traditional house roof t-shirt design
Choose a folder
All favorites
Create new
Save
Traditional house roof t-shirt design
Print ready
for Merch
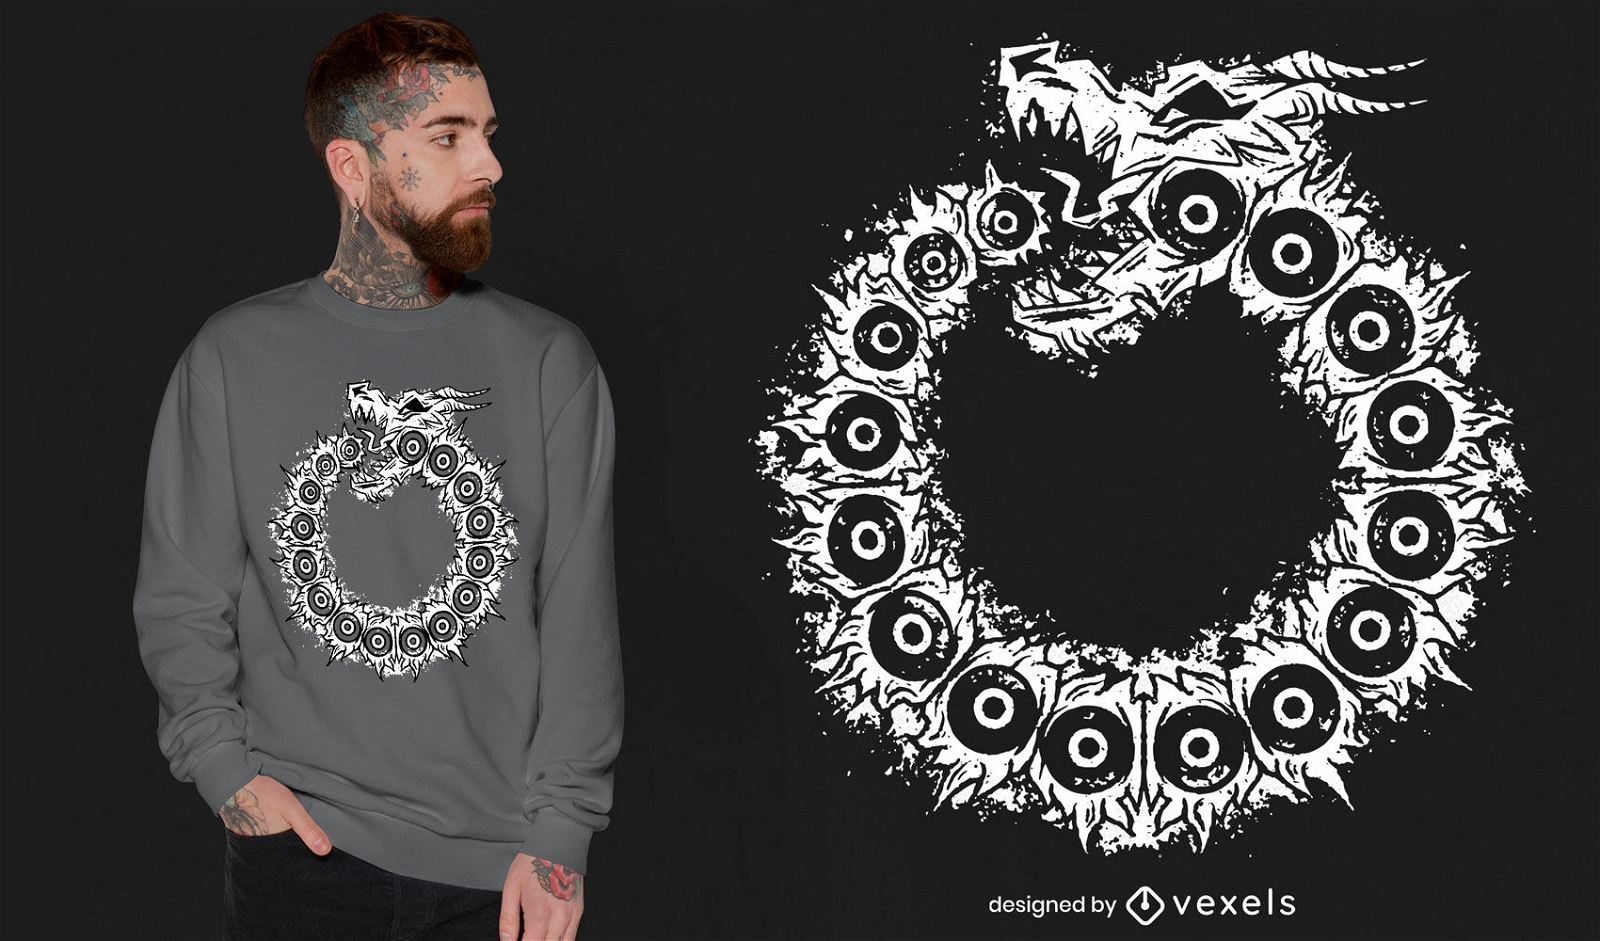
Grunge dragon symbol t-shirt design
Choose a folder
All favorites
Create new
Save
Grunge dragon symbol t-shirt design
Print ready
for Merch
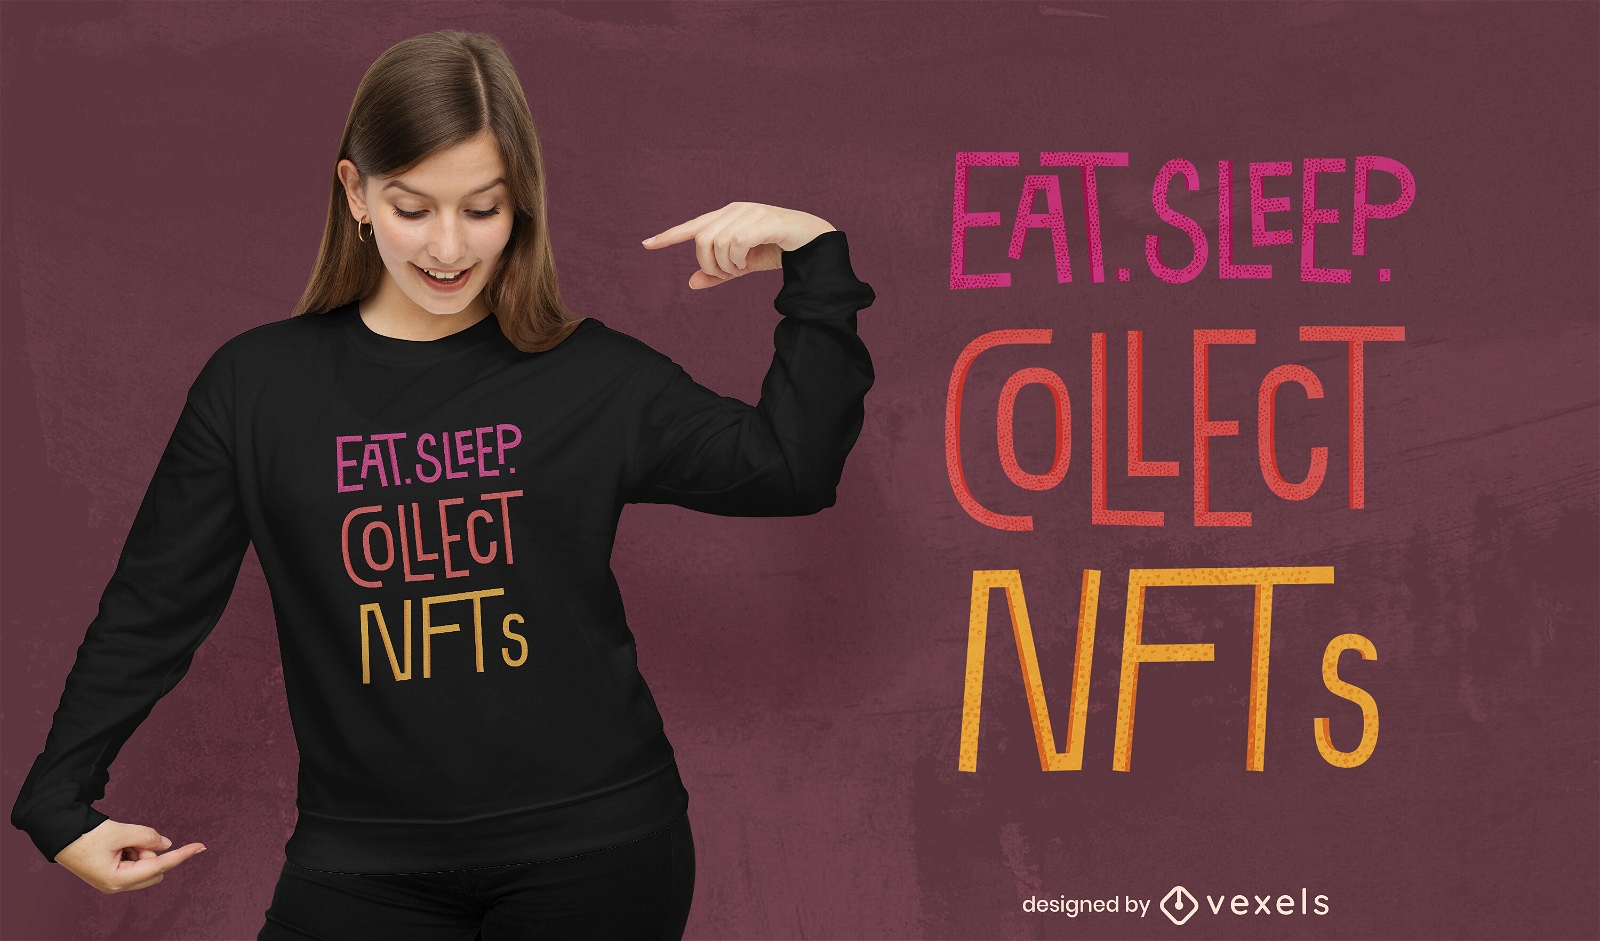
Eat sleep and collect nft t-shirt design
Choose a folder
All favorites
Create new
Save
Eat sleep and collect nft t-shirt design
Print ready
for Merch
Mythological Creatures T-Shirt Design
Choose a folder
All favorites
Create new
Save
Mythological Creatures T-Shirt Design
Editable text
Print ready
for Merch
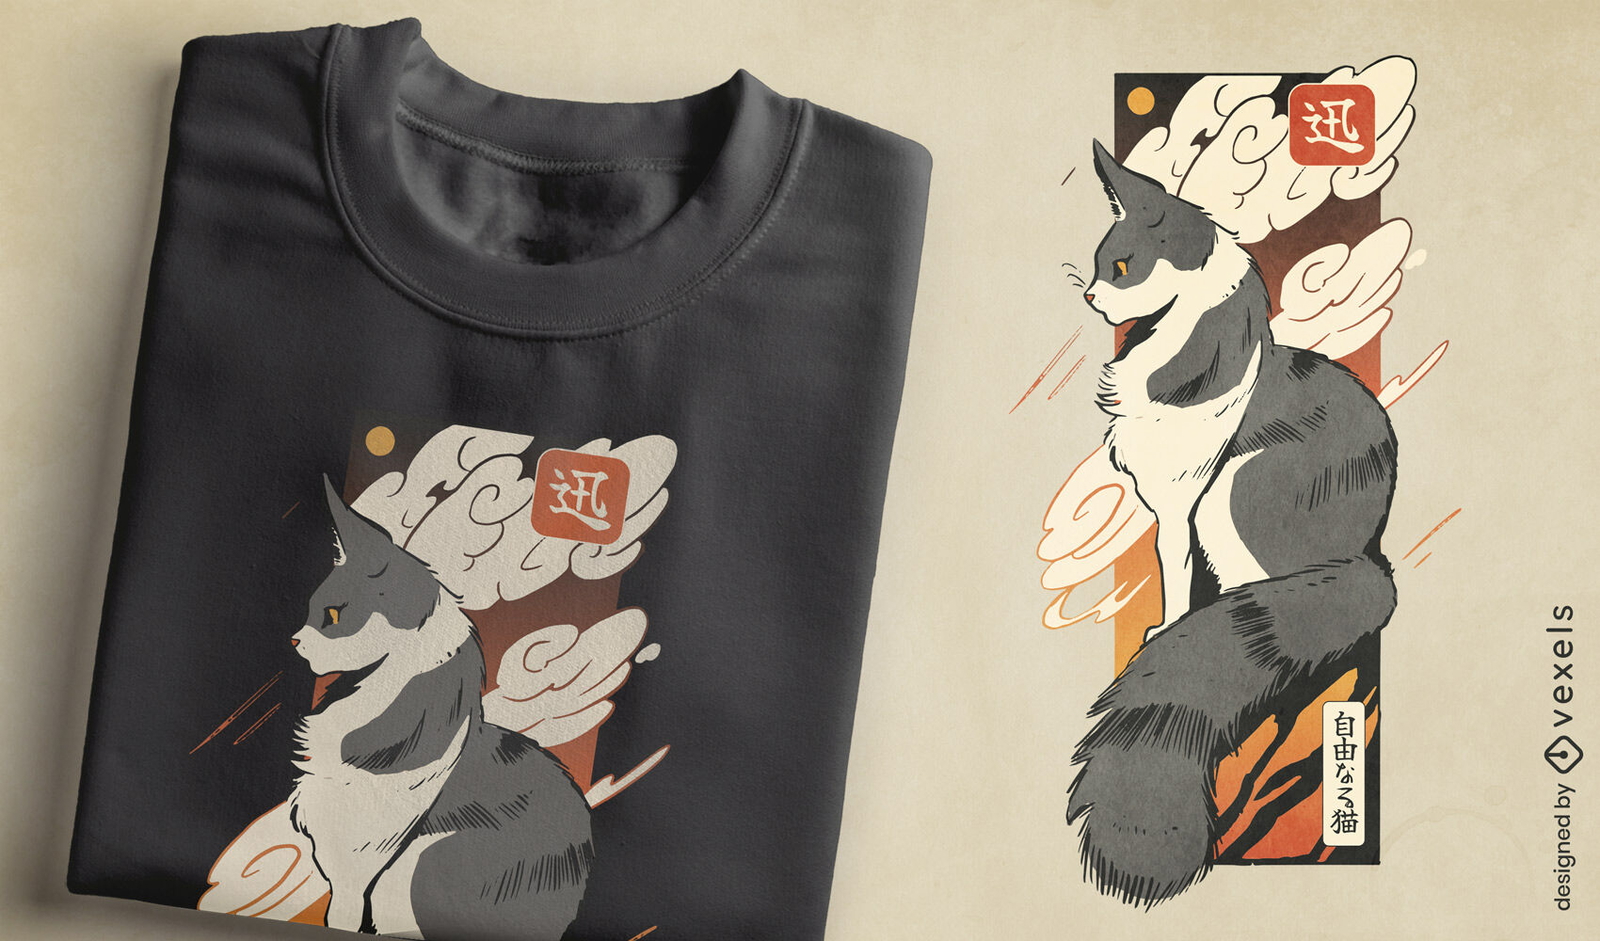
Cat sunset Japanese t-shirt design
Choose a folder
All favorites
Create new
Save
Cat sunset Japanese t-shirt design
Editable text
Print ready
for Merch
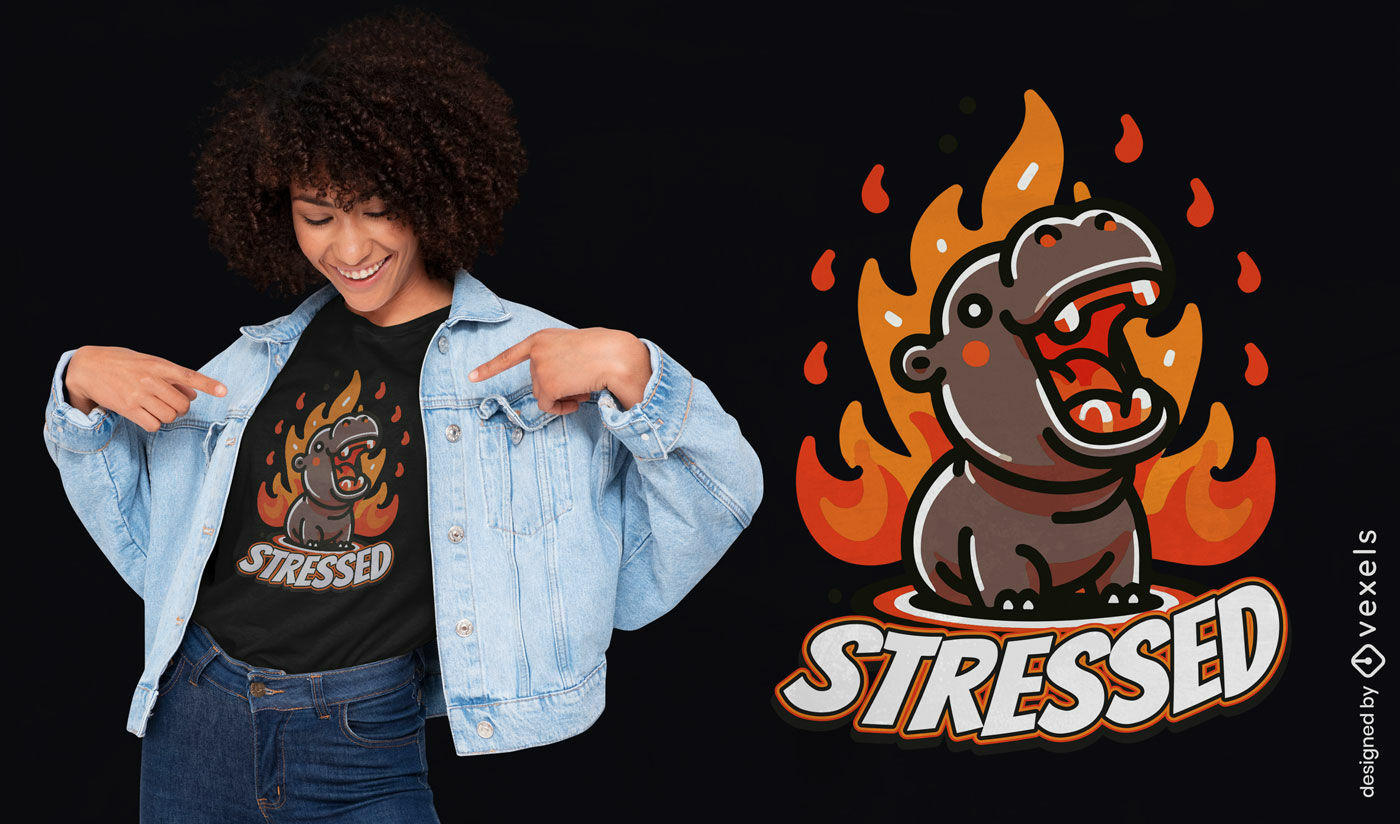
Stressed hippo t-shirt design
Choose a folder
All favorites
Create new
Save
Stressed hippo t-shirt design
Editable text
Print ready
for Merch
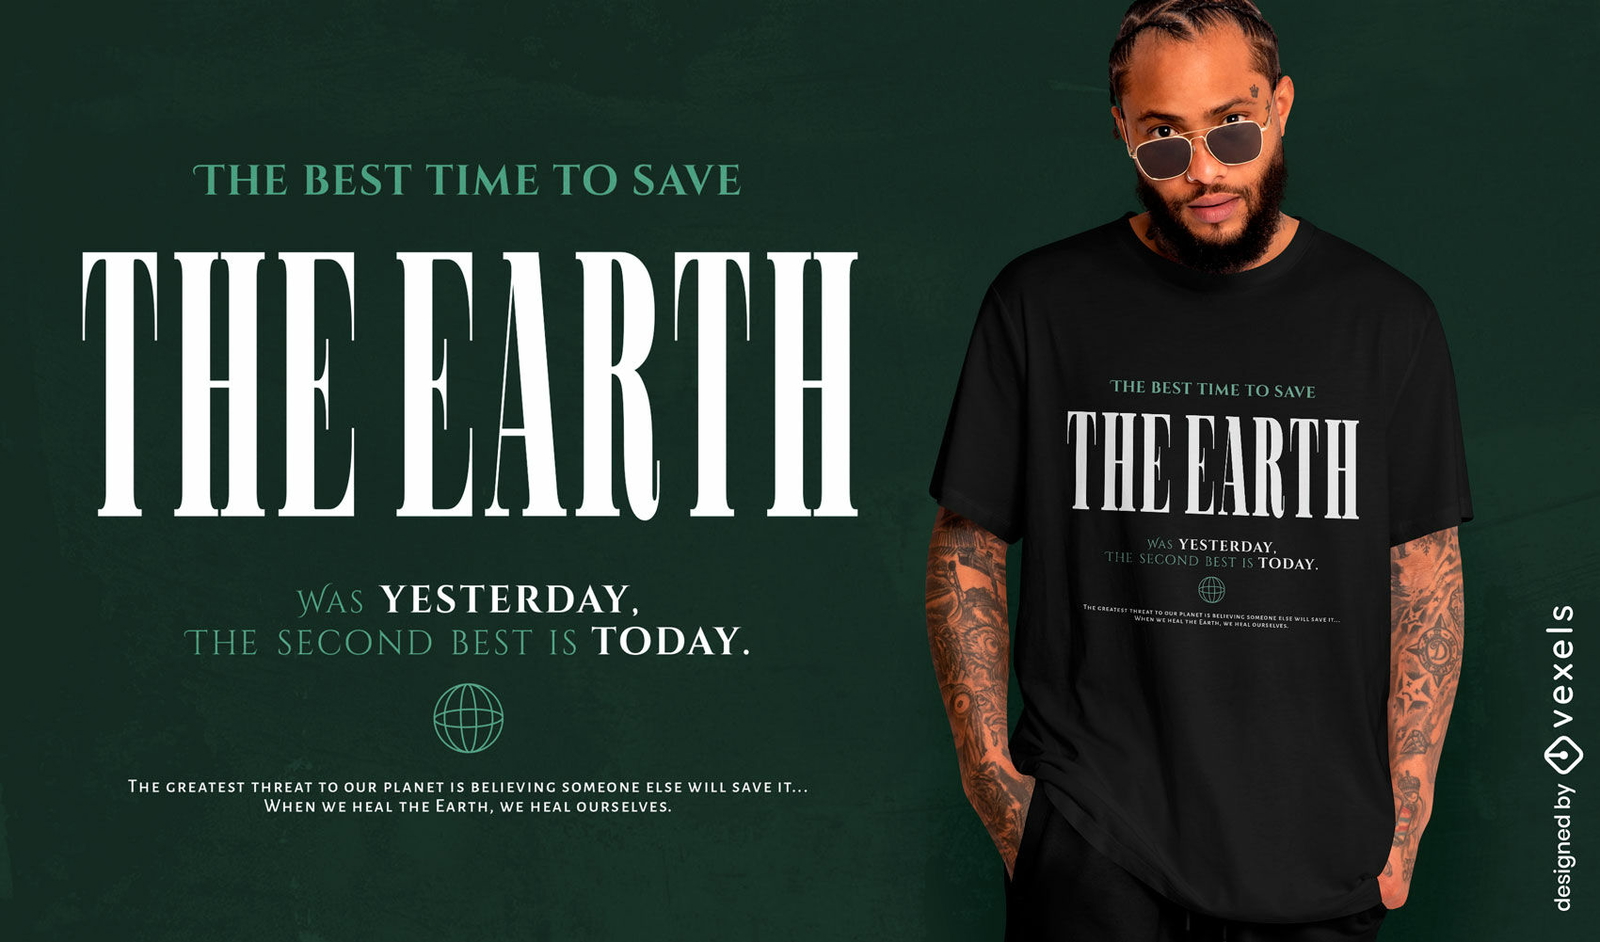
Enviromental save the Earth quote t-shirt design
Choose a folder
All favorites
Create new
Save
Enviromental save the Earth quote t-shirt design
Editable text
Print ready
for Merch
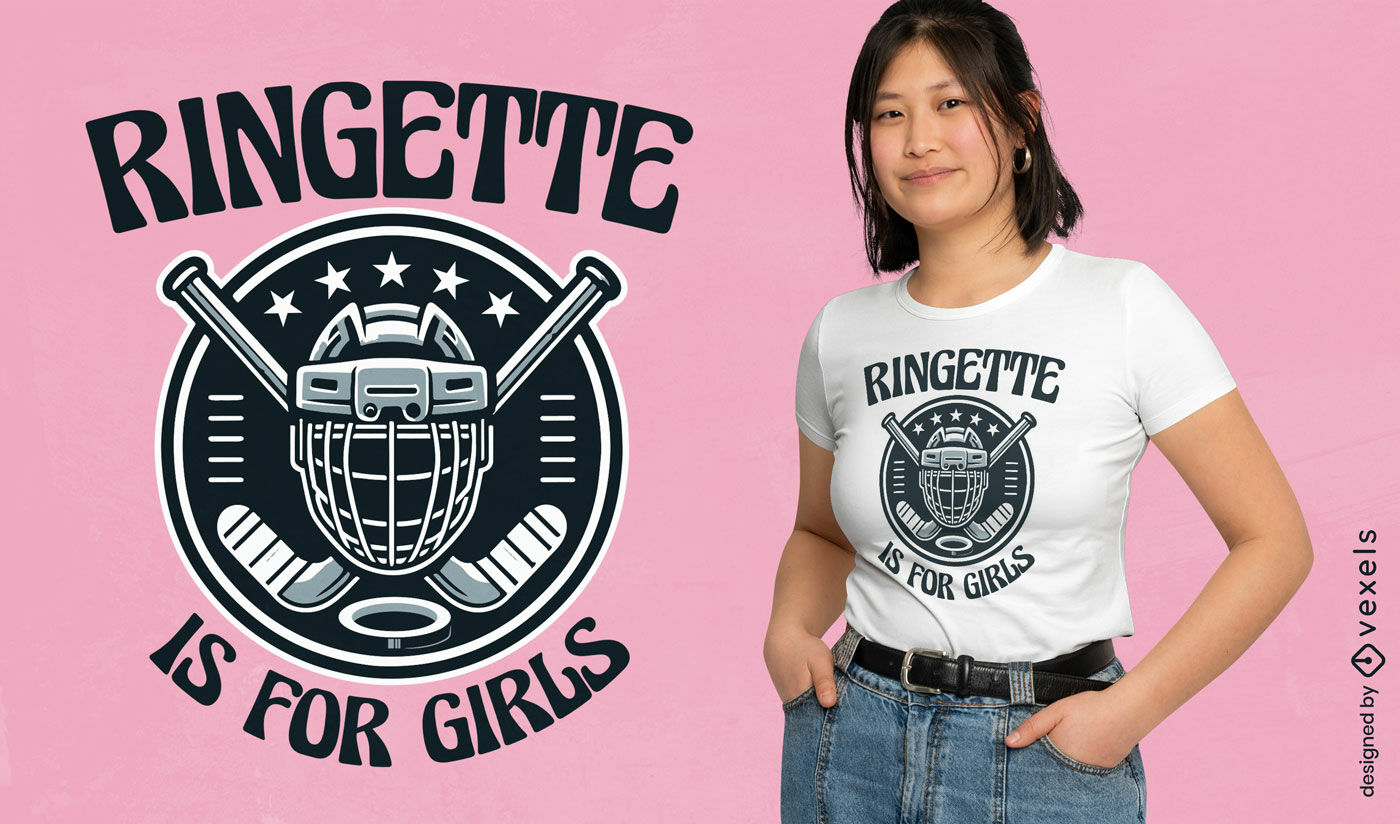
Girls sport emblem t-shirt design
Choose a folder
All favorites
Create new
Save
Girls sport emblem t-shirt design
Editable text
Print ready
for Merch
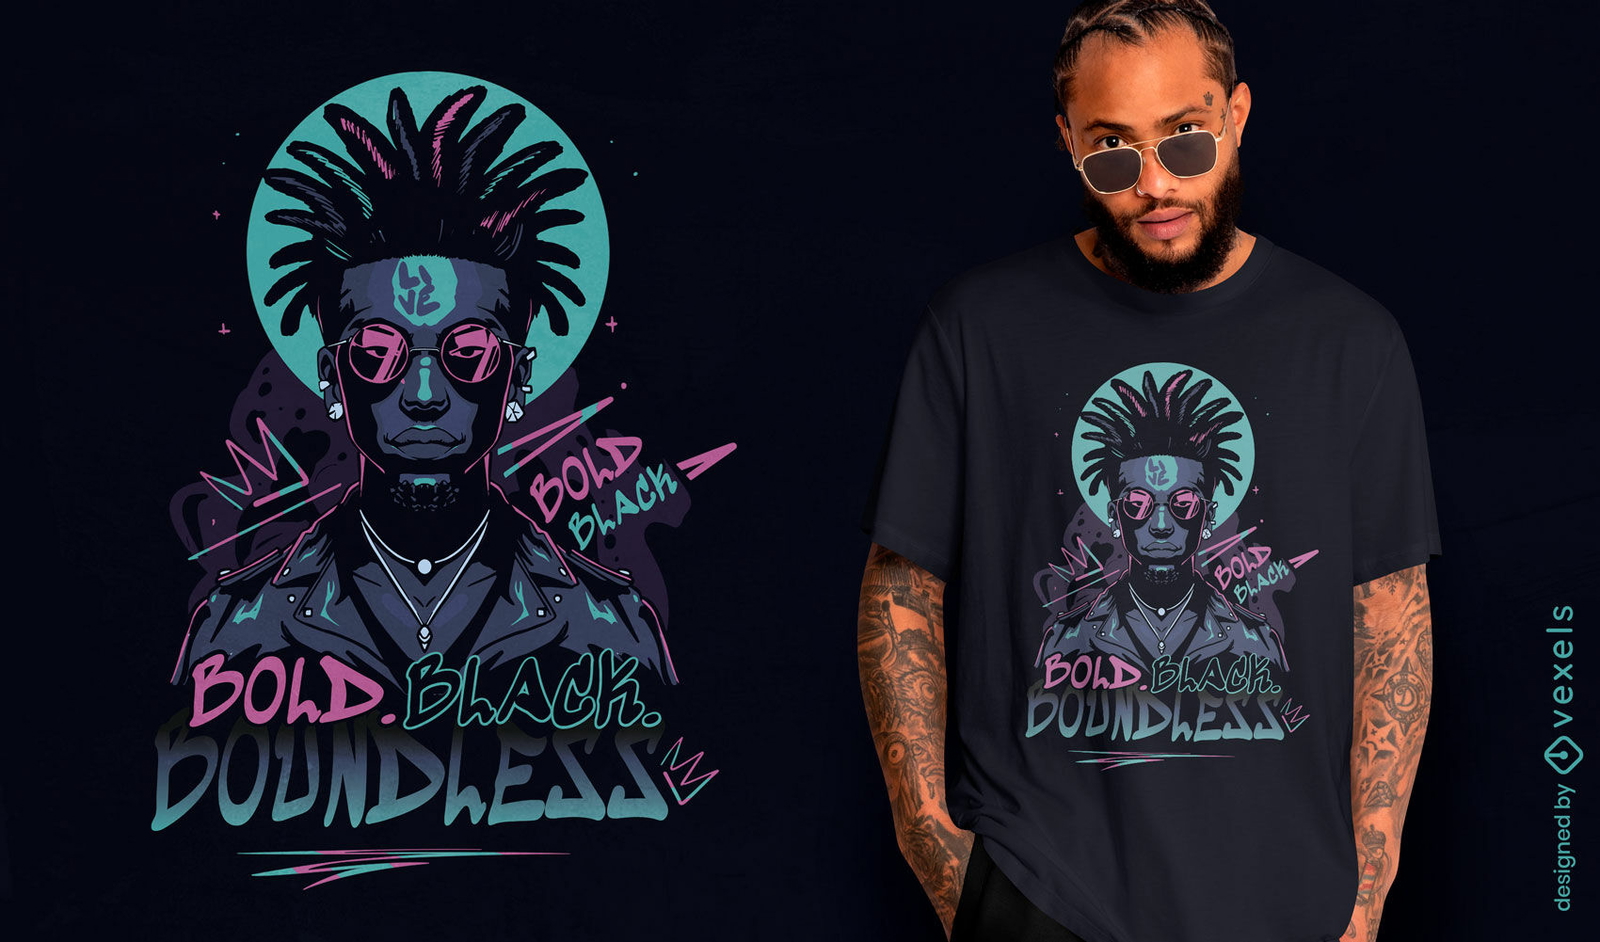
Neon afro soundhead t-shirt design
Choose a folder
All favorites
Create new
Save
Neon afro soundhead t-shirt design
Print ready
for Merch
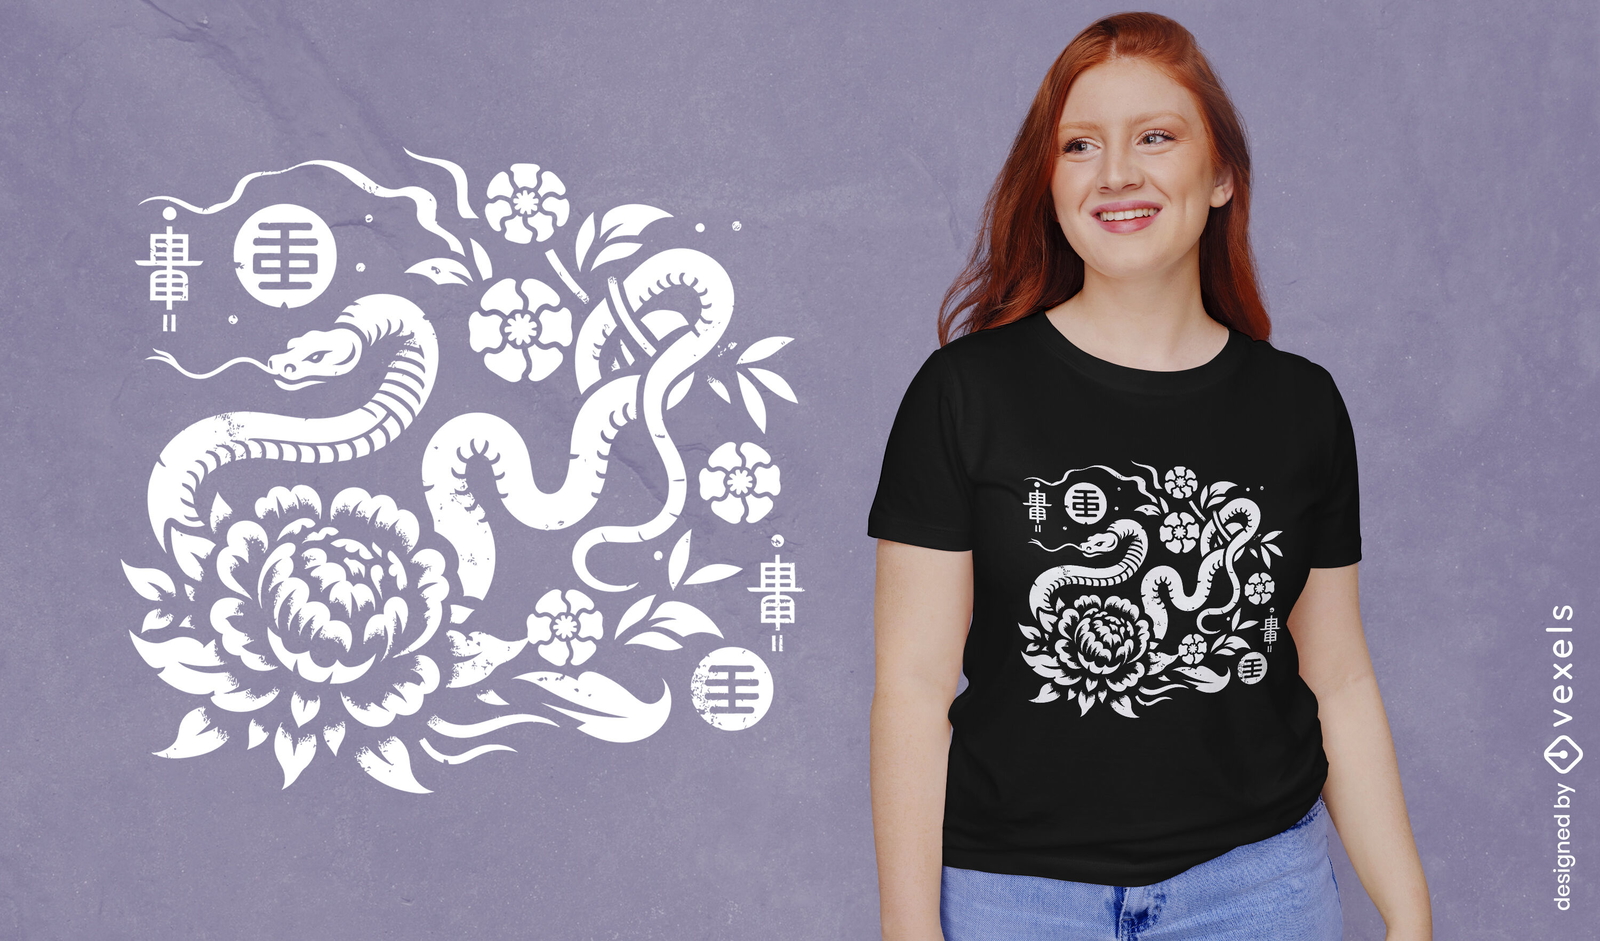
Chinese zodiac snake t-shirt design
Choose a folder
All favorites
Create new
Save
Chinese zodiac snake t-shirt design
Print ready
for Merch
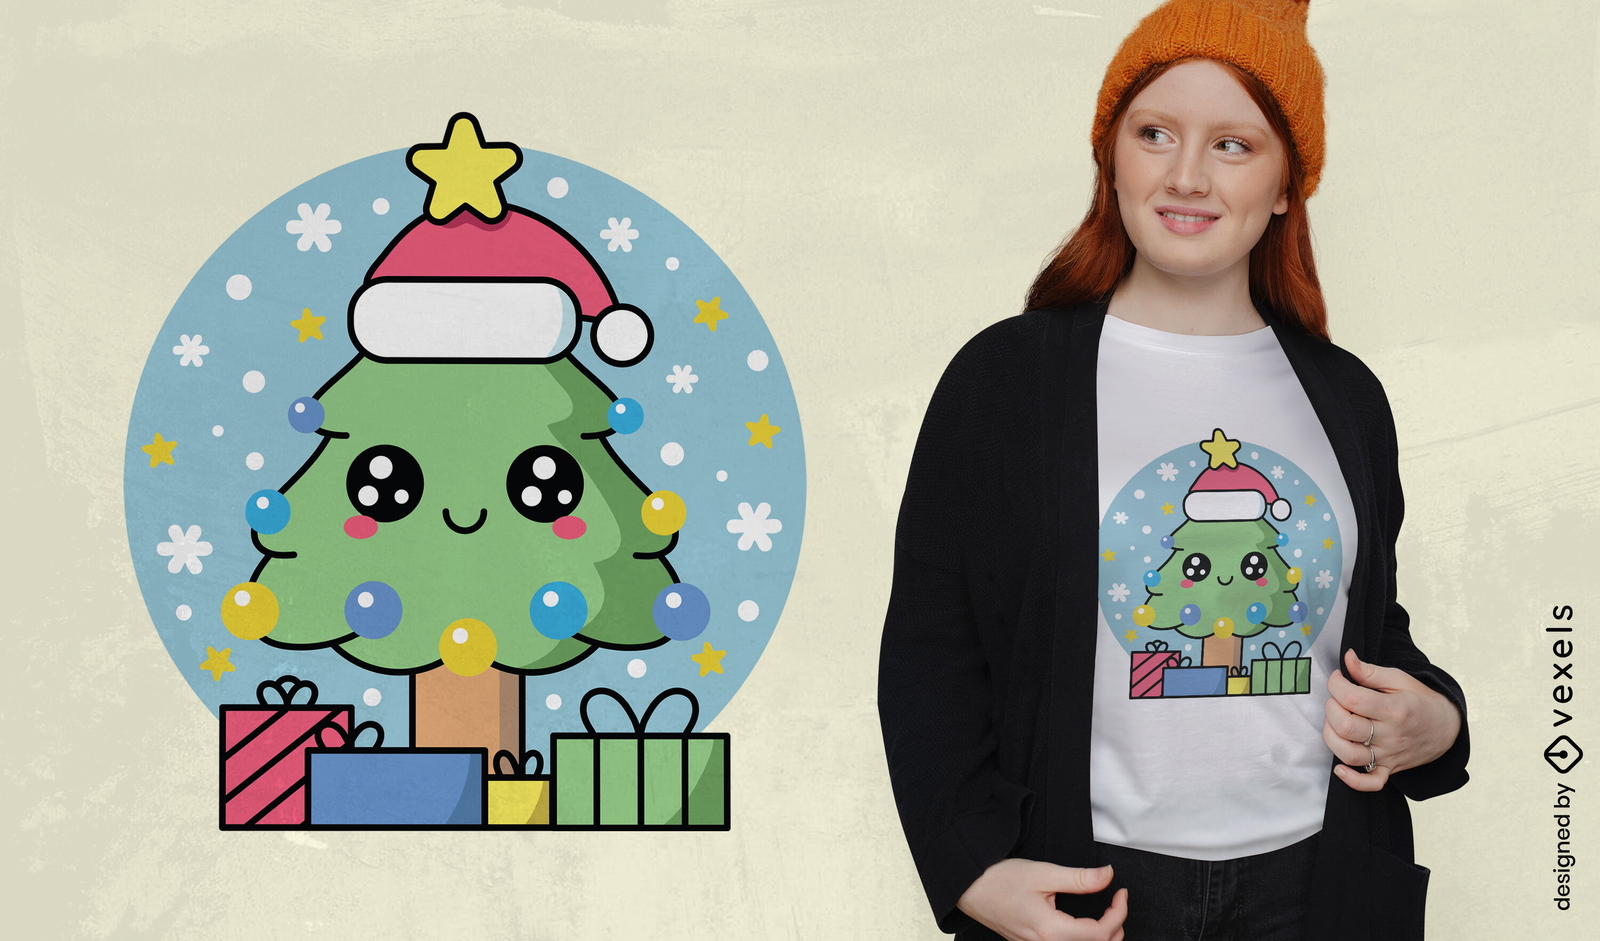
Kawaii Christmas tree t-shirt design
Choose a folder
All favorites
Create new
Save
Kawaii Christmas tree t-shirt design
Print ready
for Merch
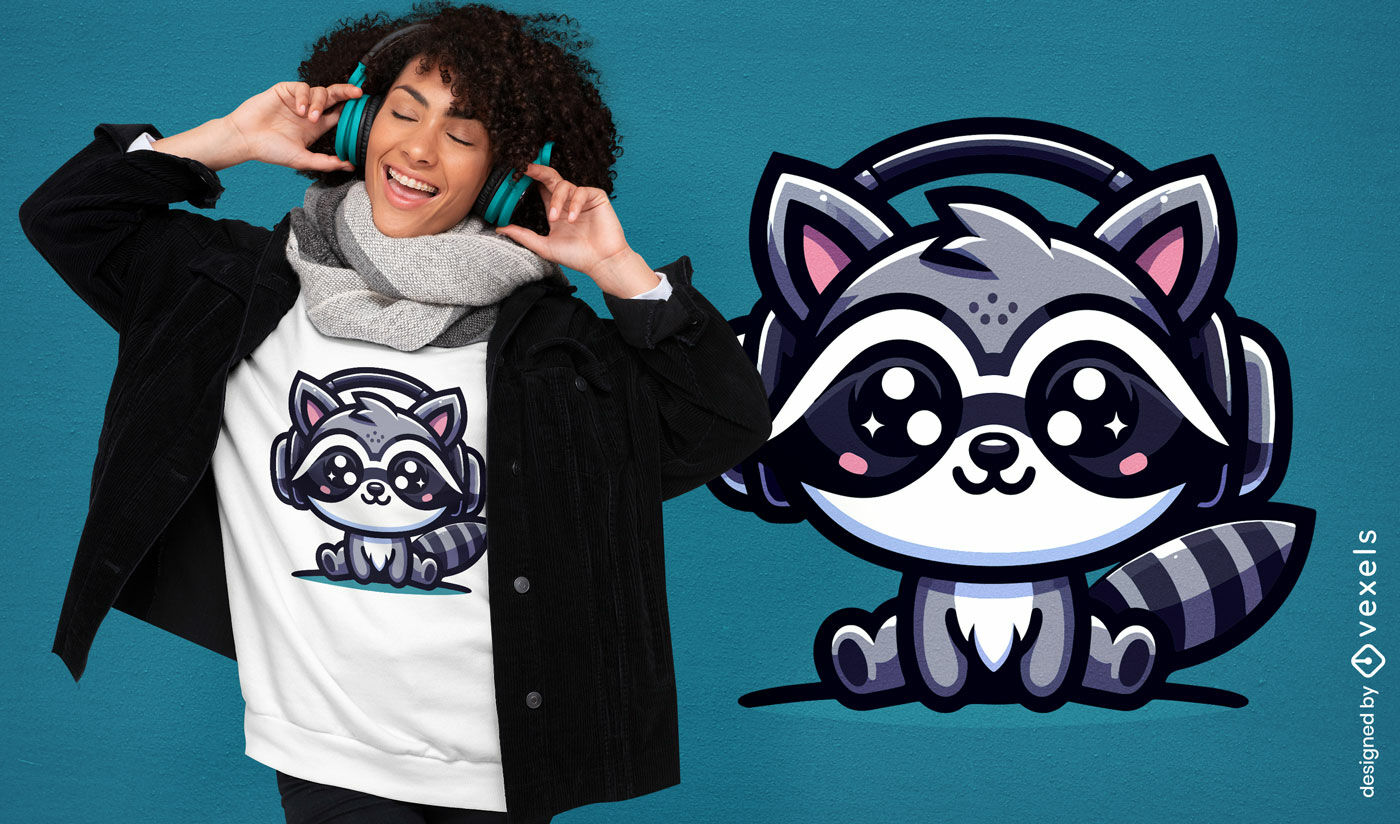
Raccoon kawaii with headphones t-shirt design
Choose a folder
All favorites
Create new
Save
Raccoon kawaii with headphones t-shirt design
Print ready
for Merch
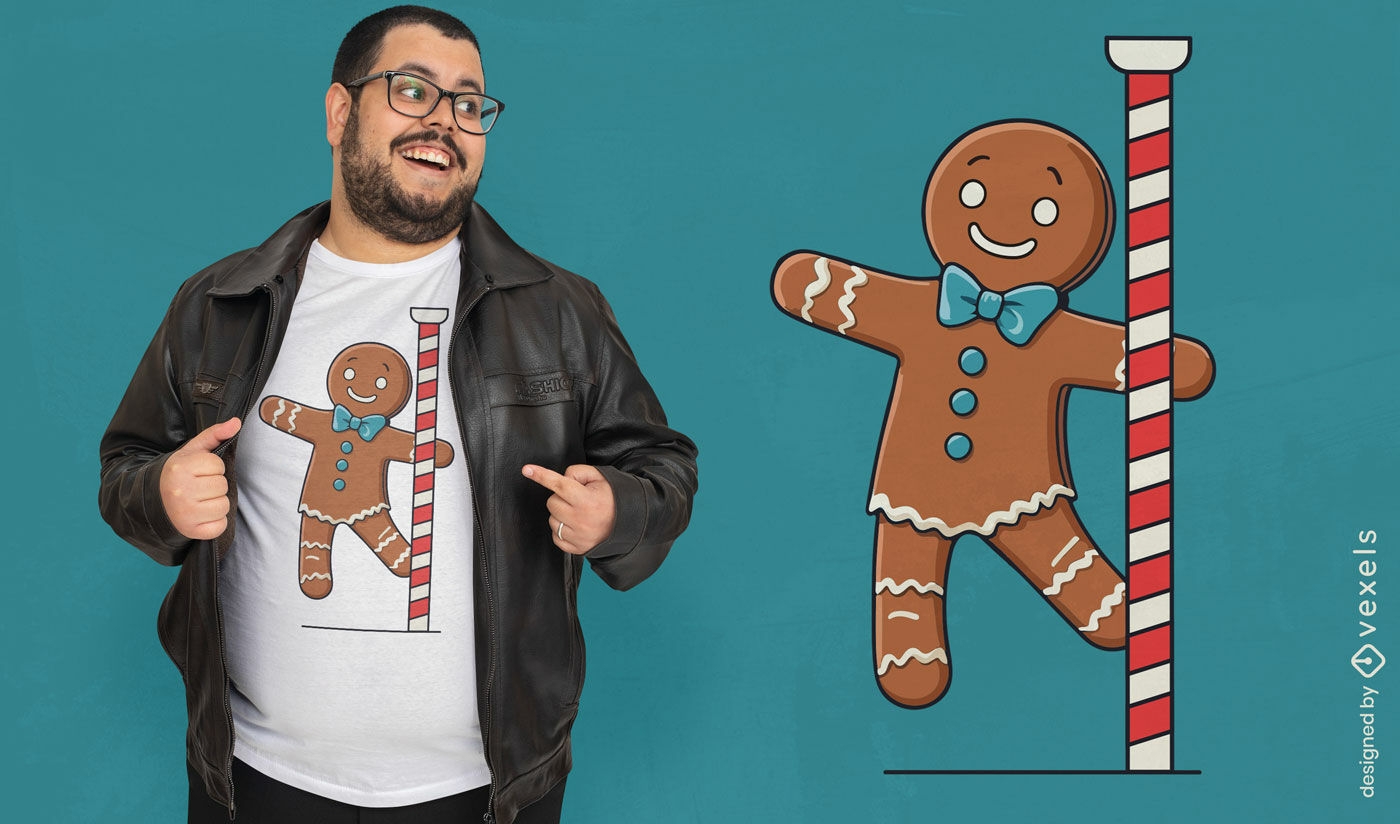
Gingerbread man candy cane t-shirt design
Choose a folder
All favorites
Create new
Save
Gingerbread man candy cane t-shirt design
Print ready
for Merch
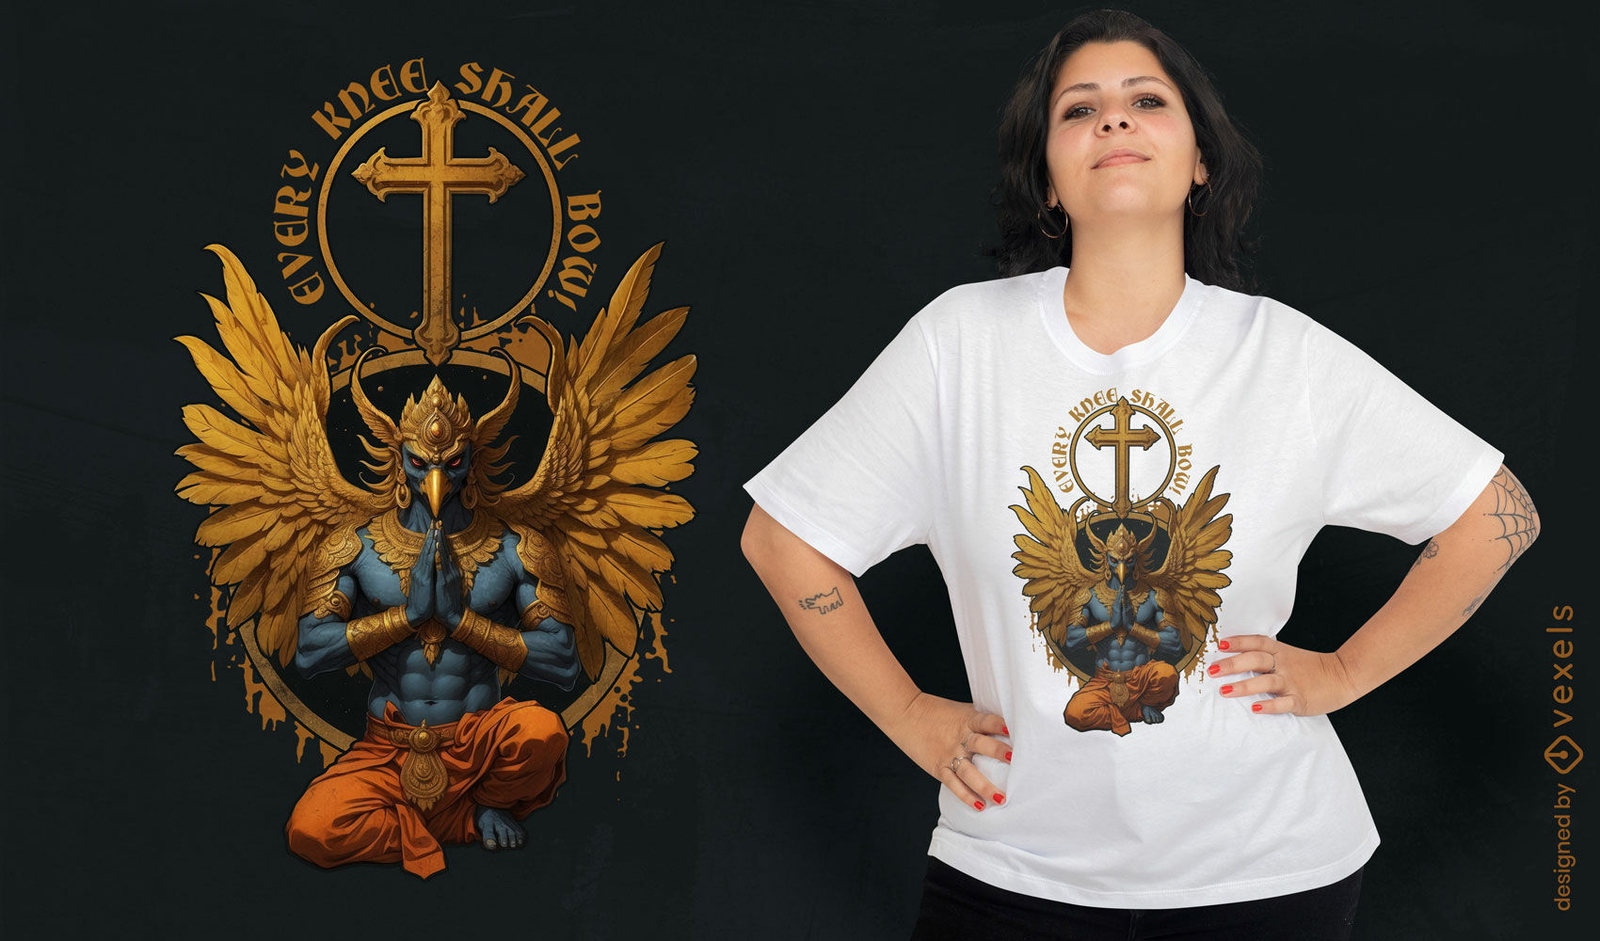
Mythical Garuda t-shirt design
Choose a folder
All favorites
Create new
Save
Mythical Garuda t-shirt design
Print ready
for Merch
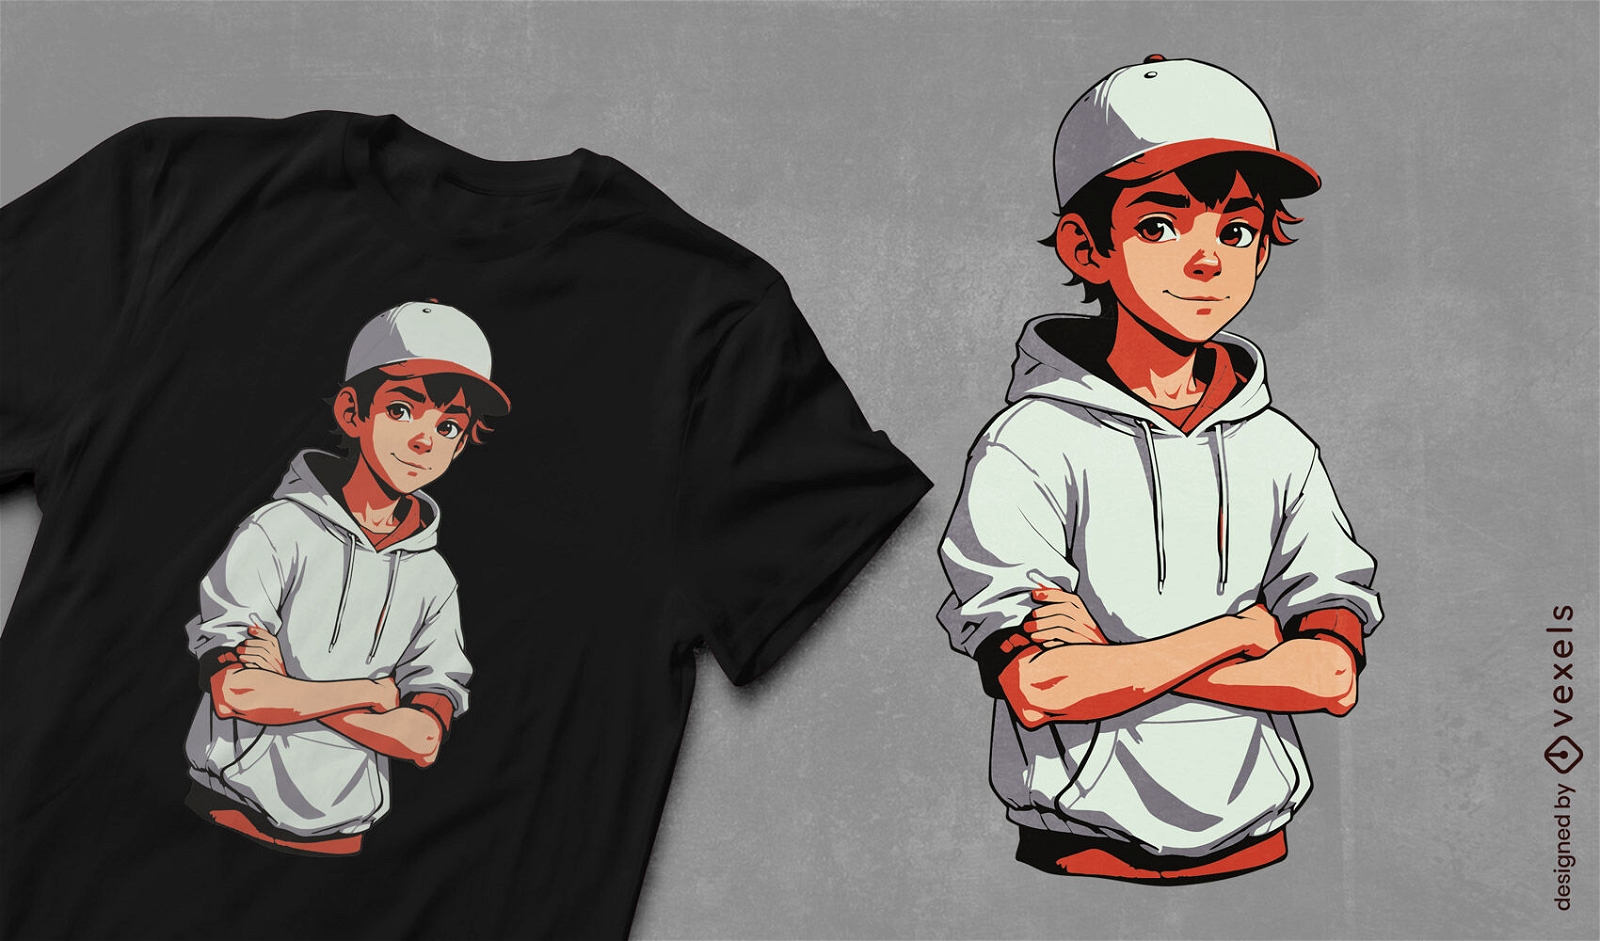
Smirking teenager t-shirt design
Choose a folder
All favorites
Create new
Save
Smirking teenager t-shirt design
Print ready
for Merch
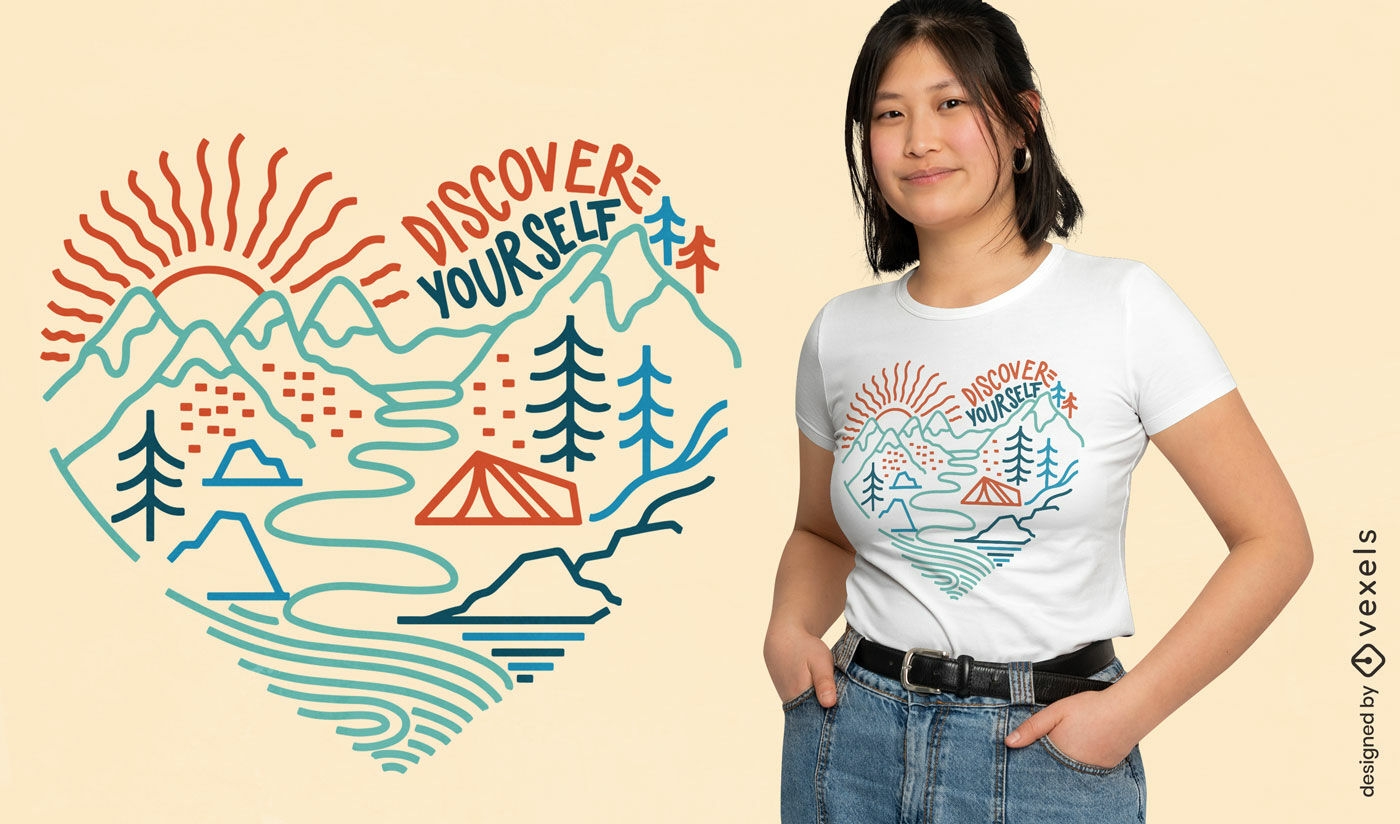
Inspirational landscape t-shirt design
Choose a folder
All favorites
Create new
Save
Inspirational landscape t-shirt design
Editable text
Print ready
for Merch
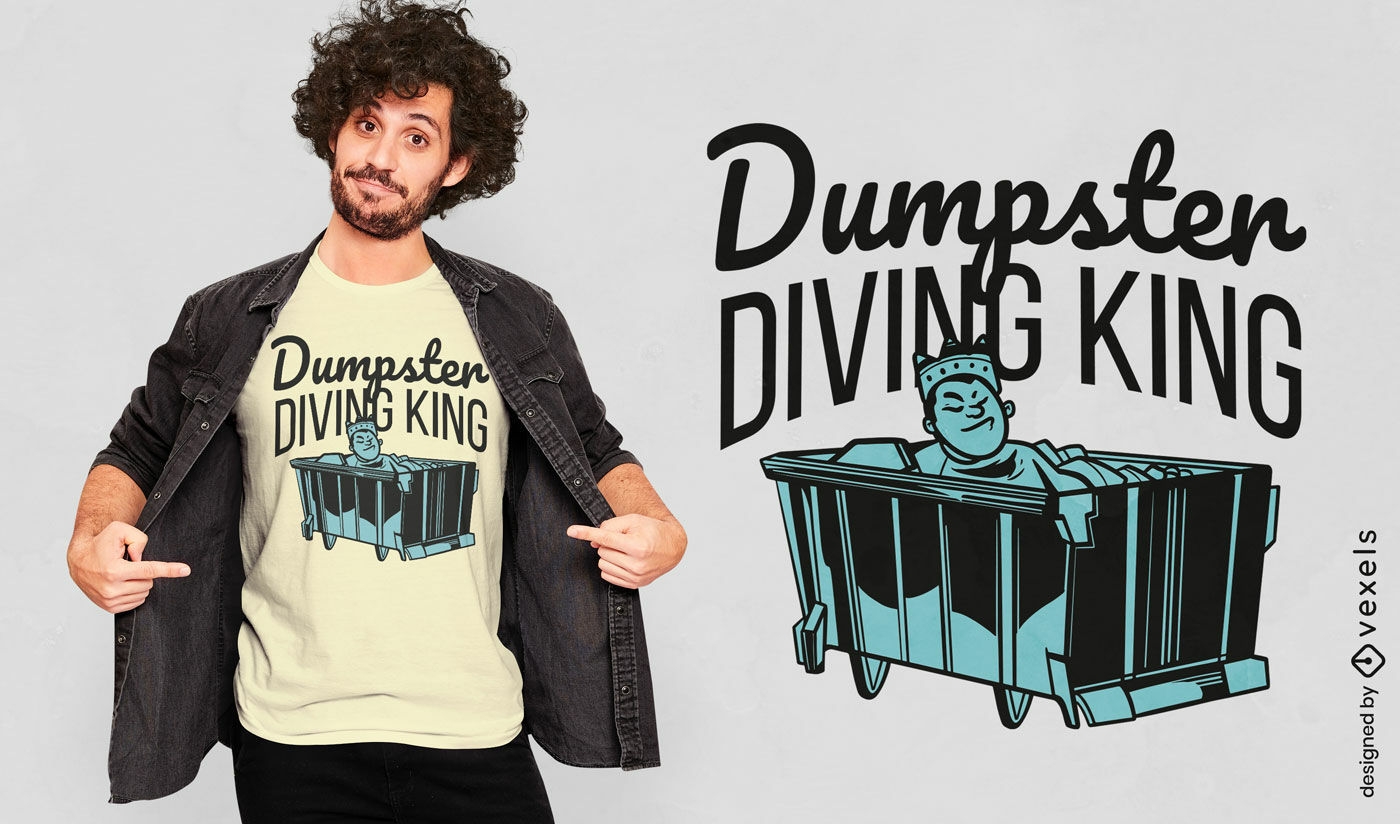
Dumpster diving king t-shirt design
Choose a folder
All favorites
Create new
Save
Dumpster diving king t-shirt design
Editable text
Print ready
for Merch
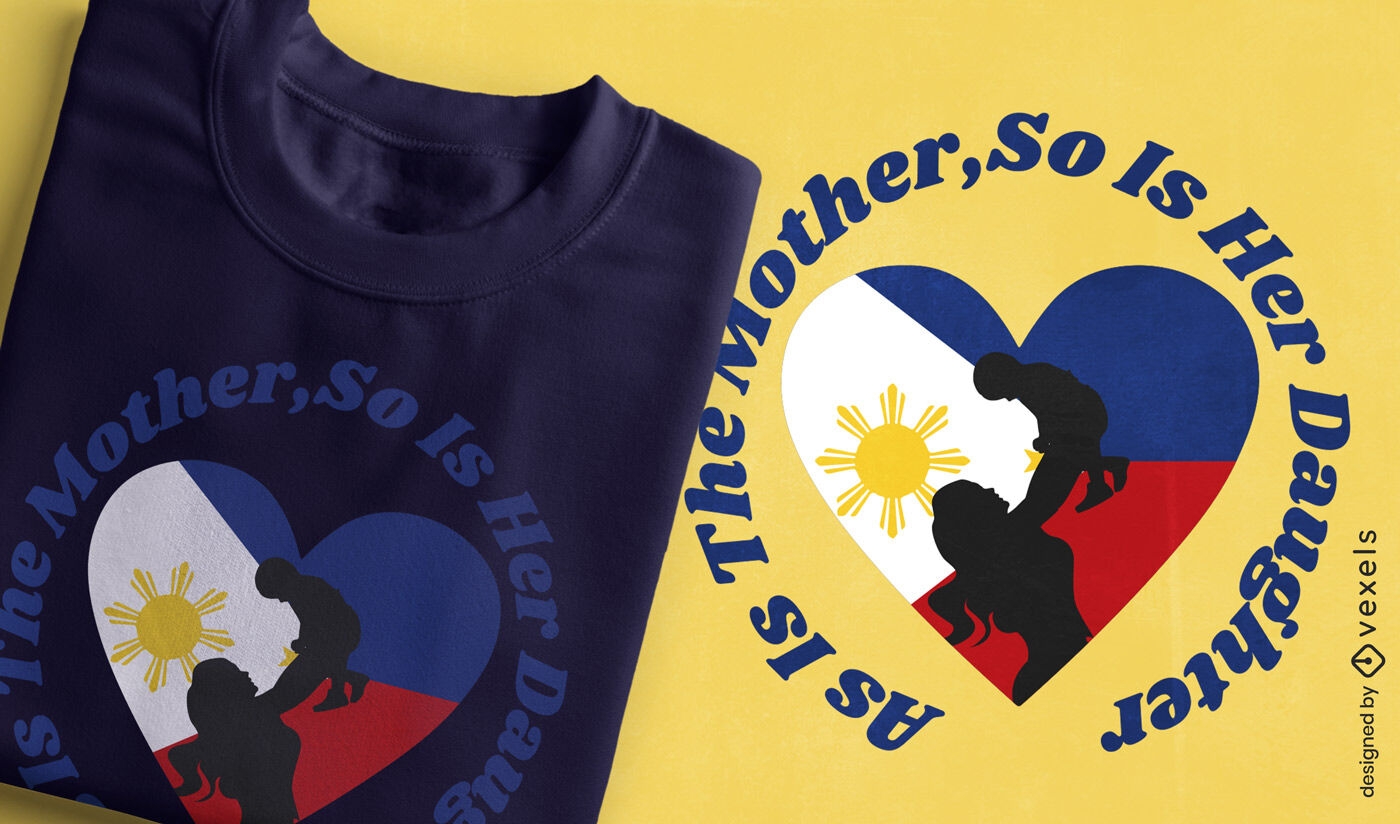
Mother-daughter bond t-shirt design
Choose a folder
All favorites
Create new
Save
Mother-daughter bond t-shirt design
Editable text
Print ready
for Merch
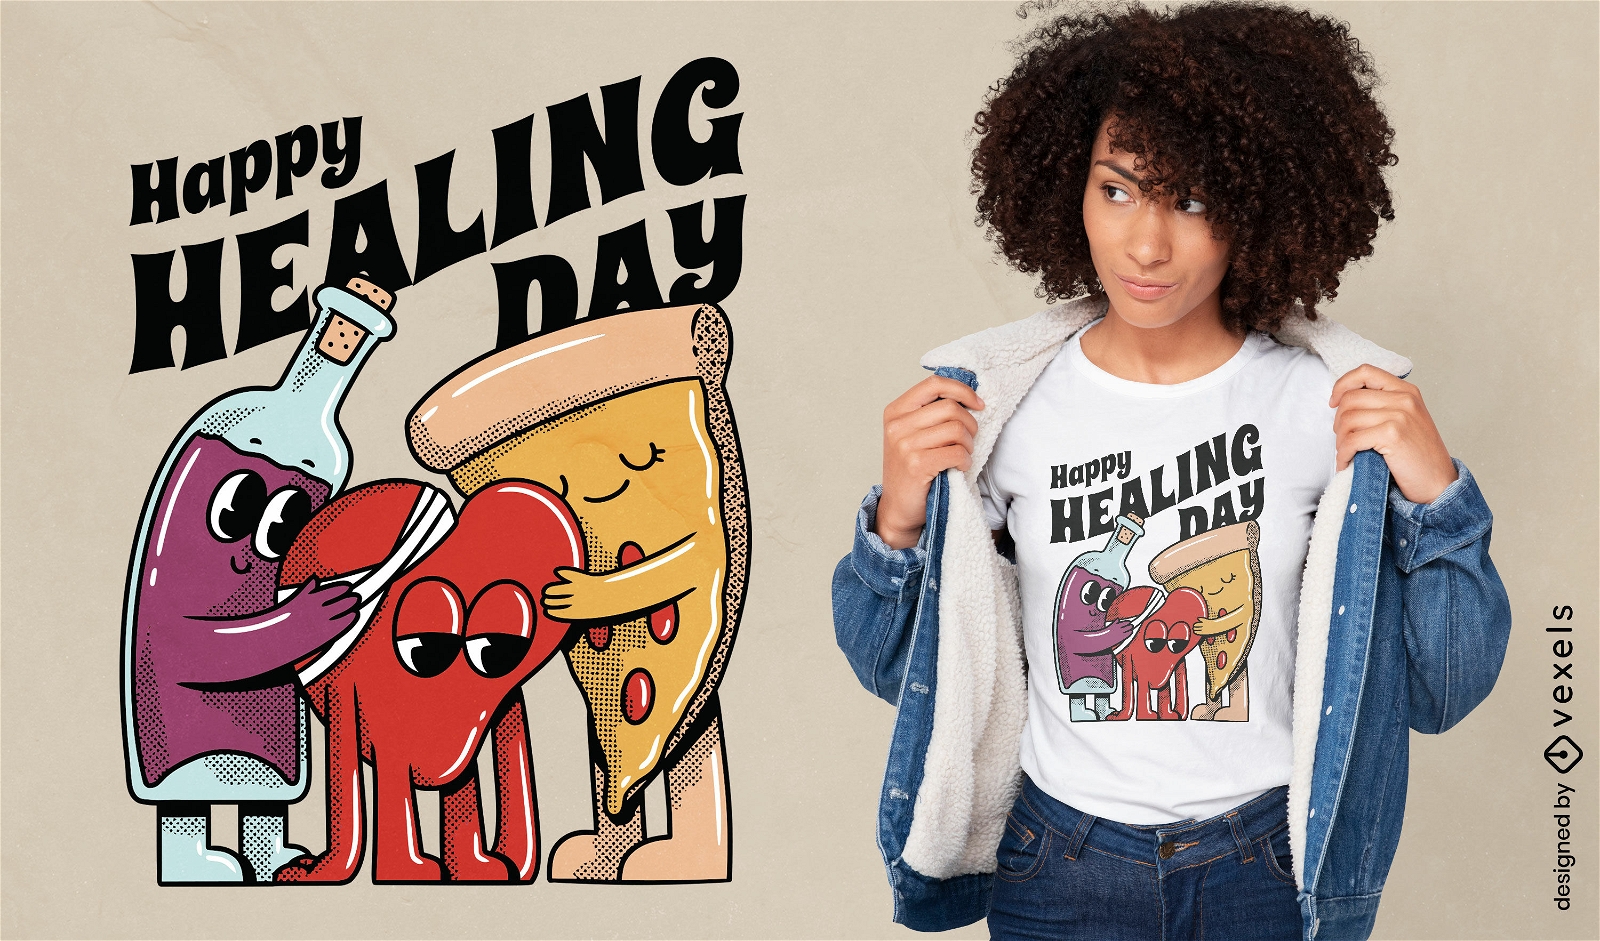
Playful healing day cartoon t-shirt design
Choose a folder
All favorites
Create new
Save
Playful healing day cartoon t-shirt design
Print ready
for Merch
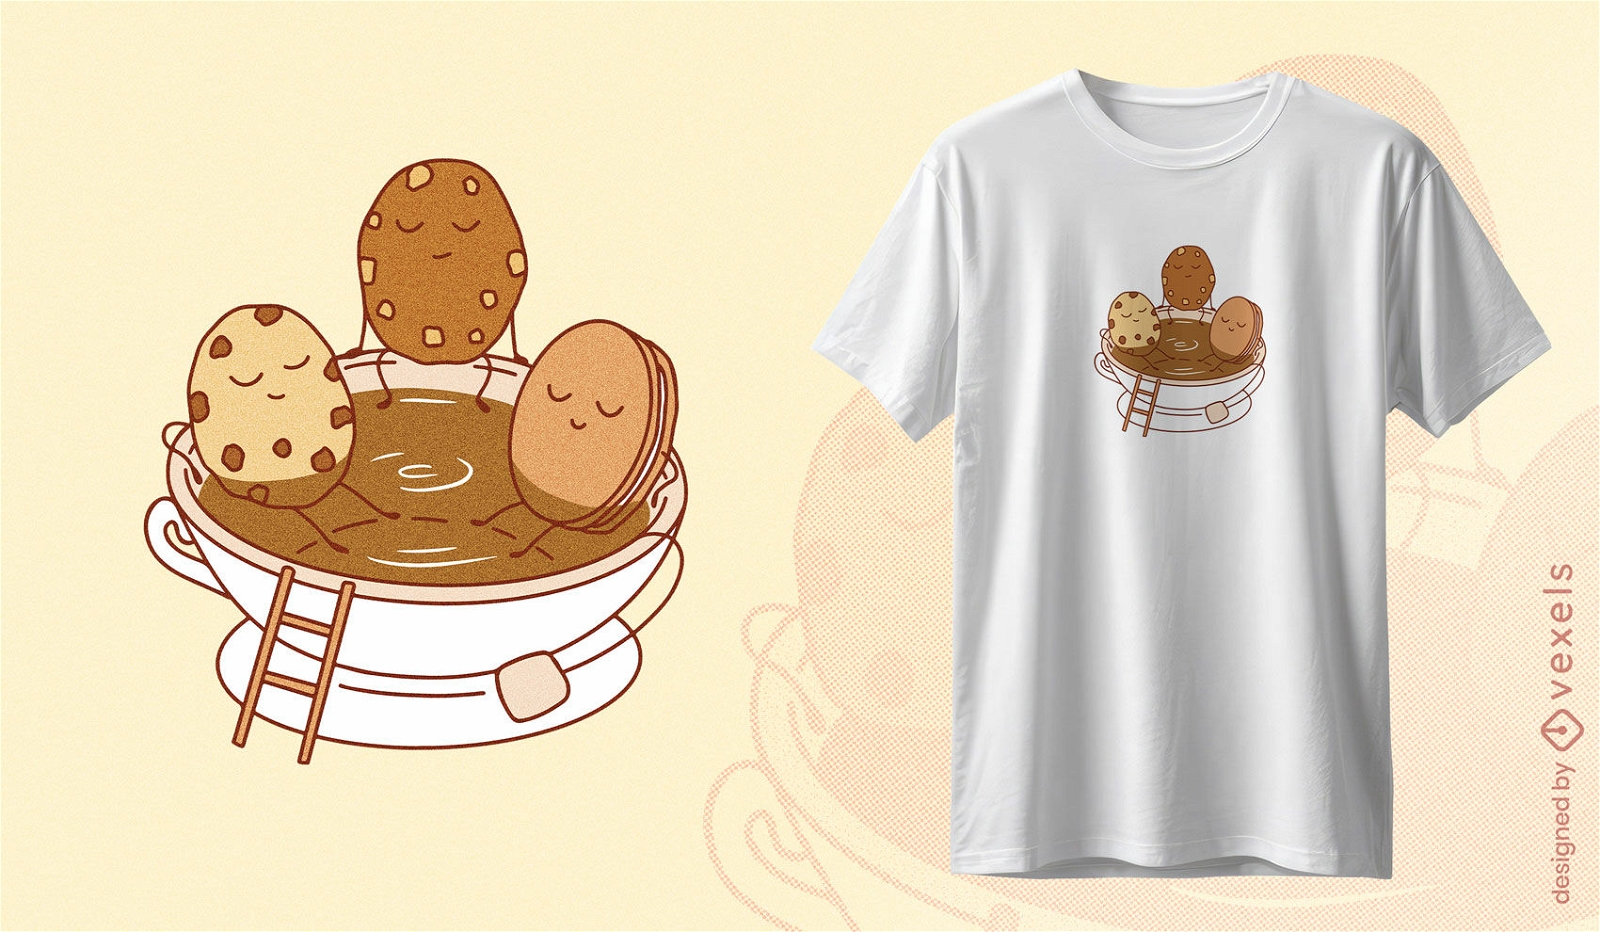
Cookies and tea t-shirt design
Choose a folder
All favorites
Create new
Save
Cookies and tea t-shirt design
Print ready
for Merch
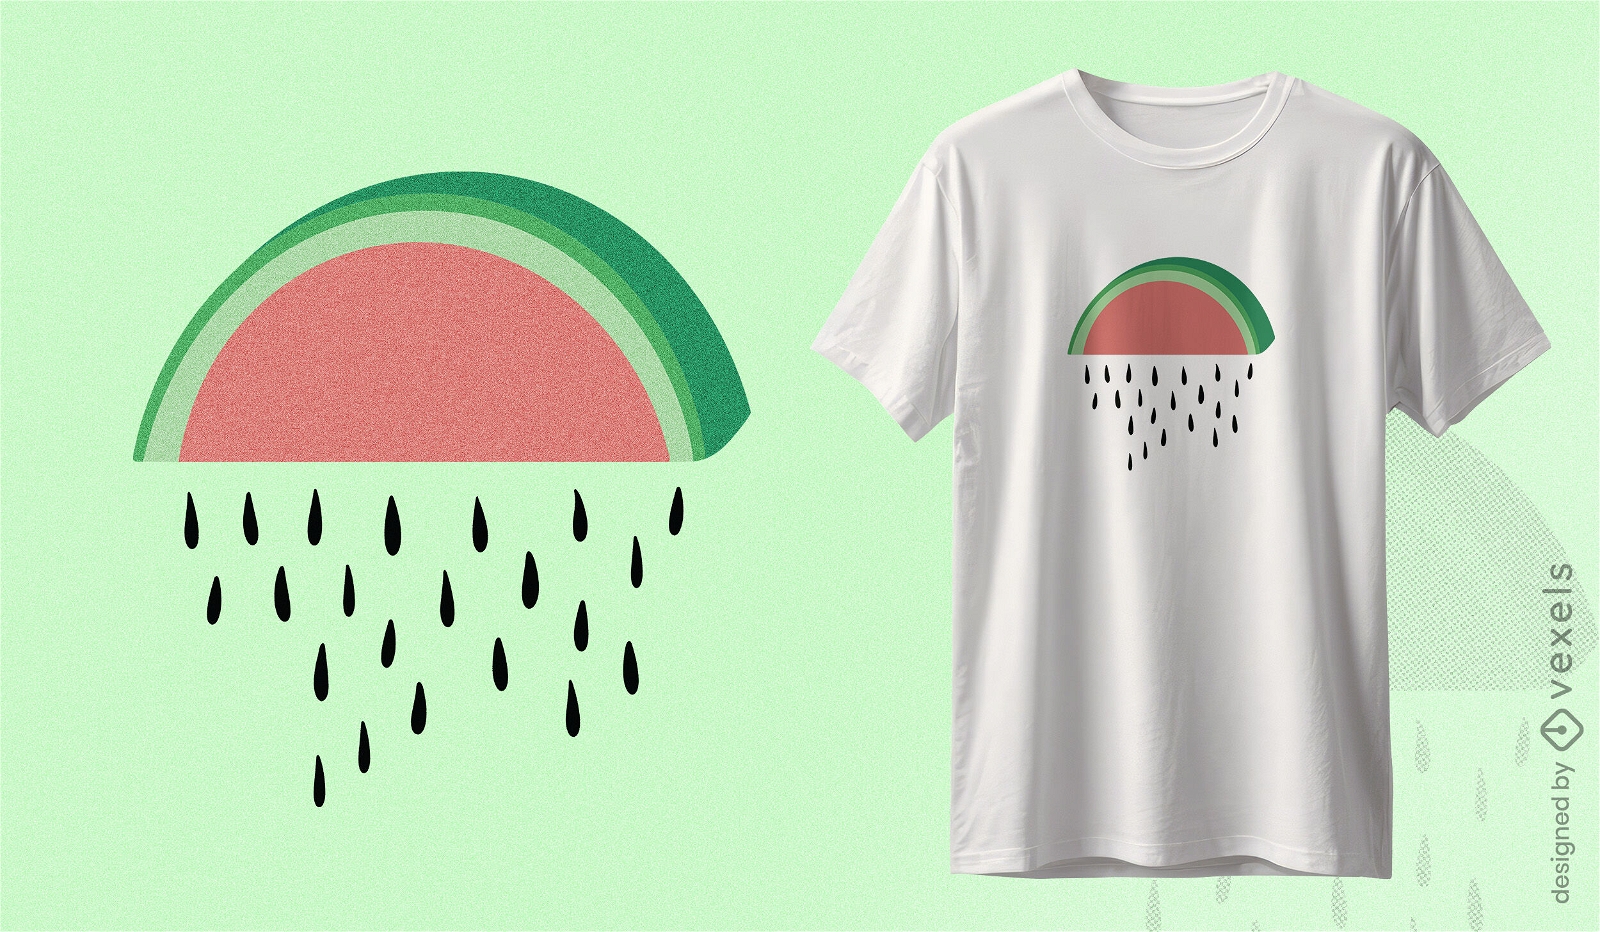
Watermelon rain cloud t-shirt design
Choose a folder
All favorites
Create new
Save
Watermelon rain cloud t-shirt design
Editable text
Print ready
for Merch
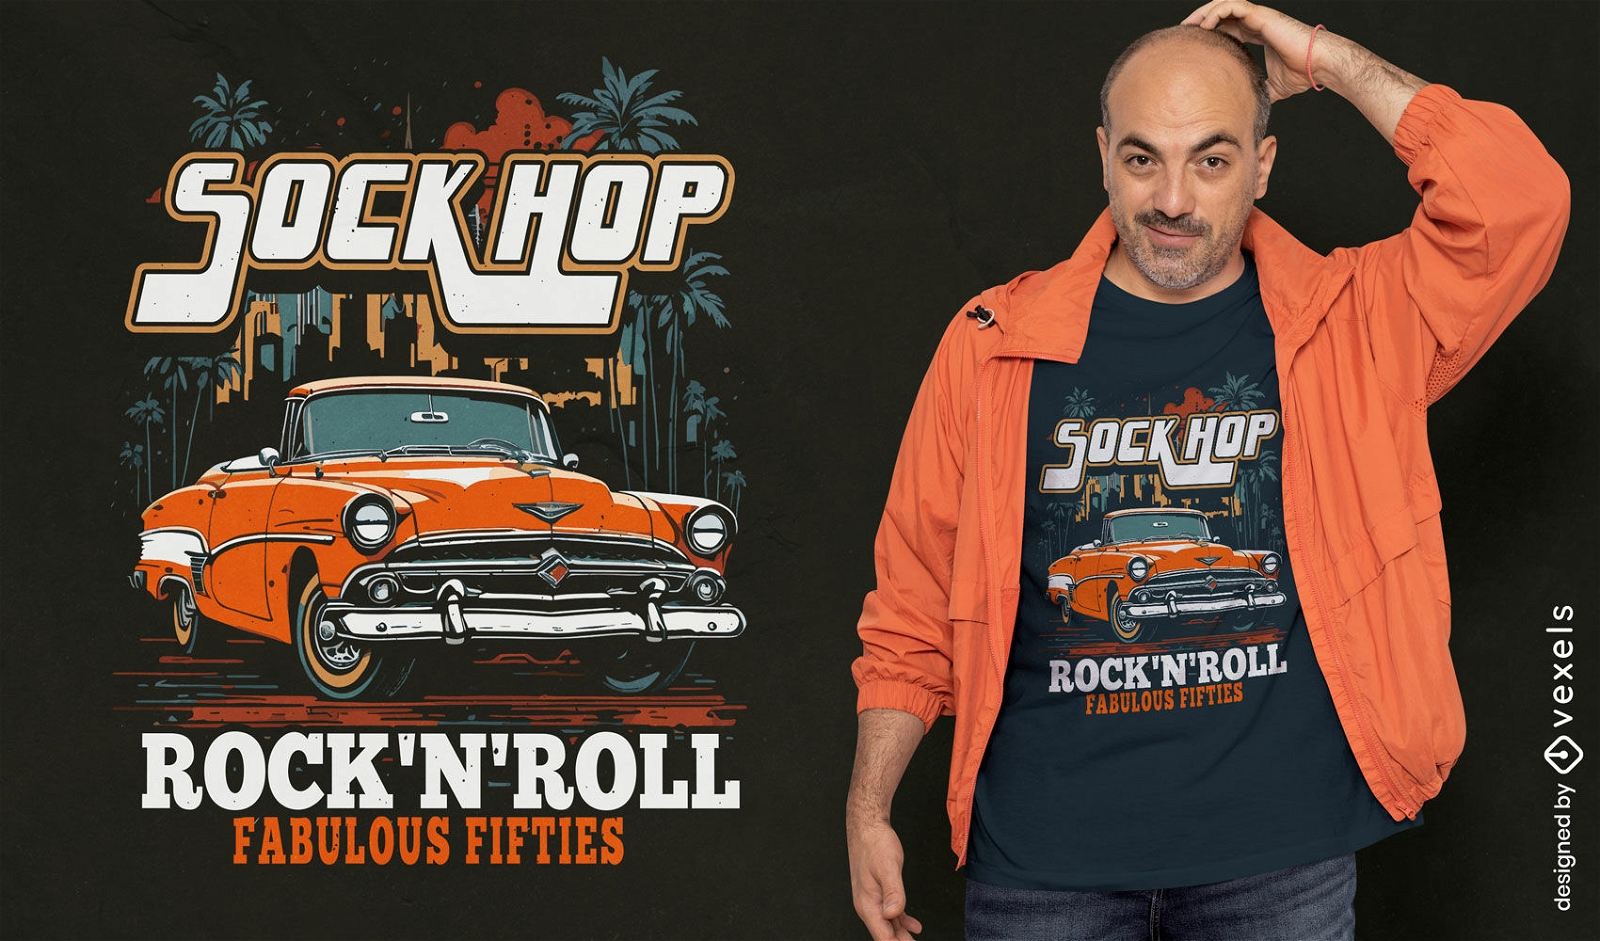
Retro red car t-shirt design
Choose a folder
All favorites
Create new
Save
Retro red car t-shirt design
Editable text
Print ready
for Merch
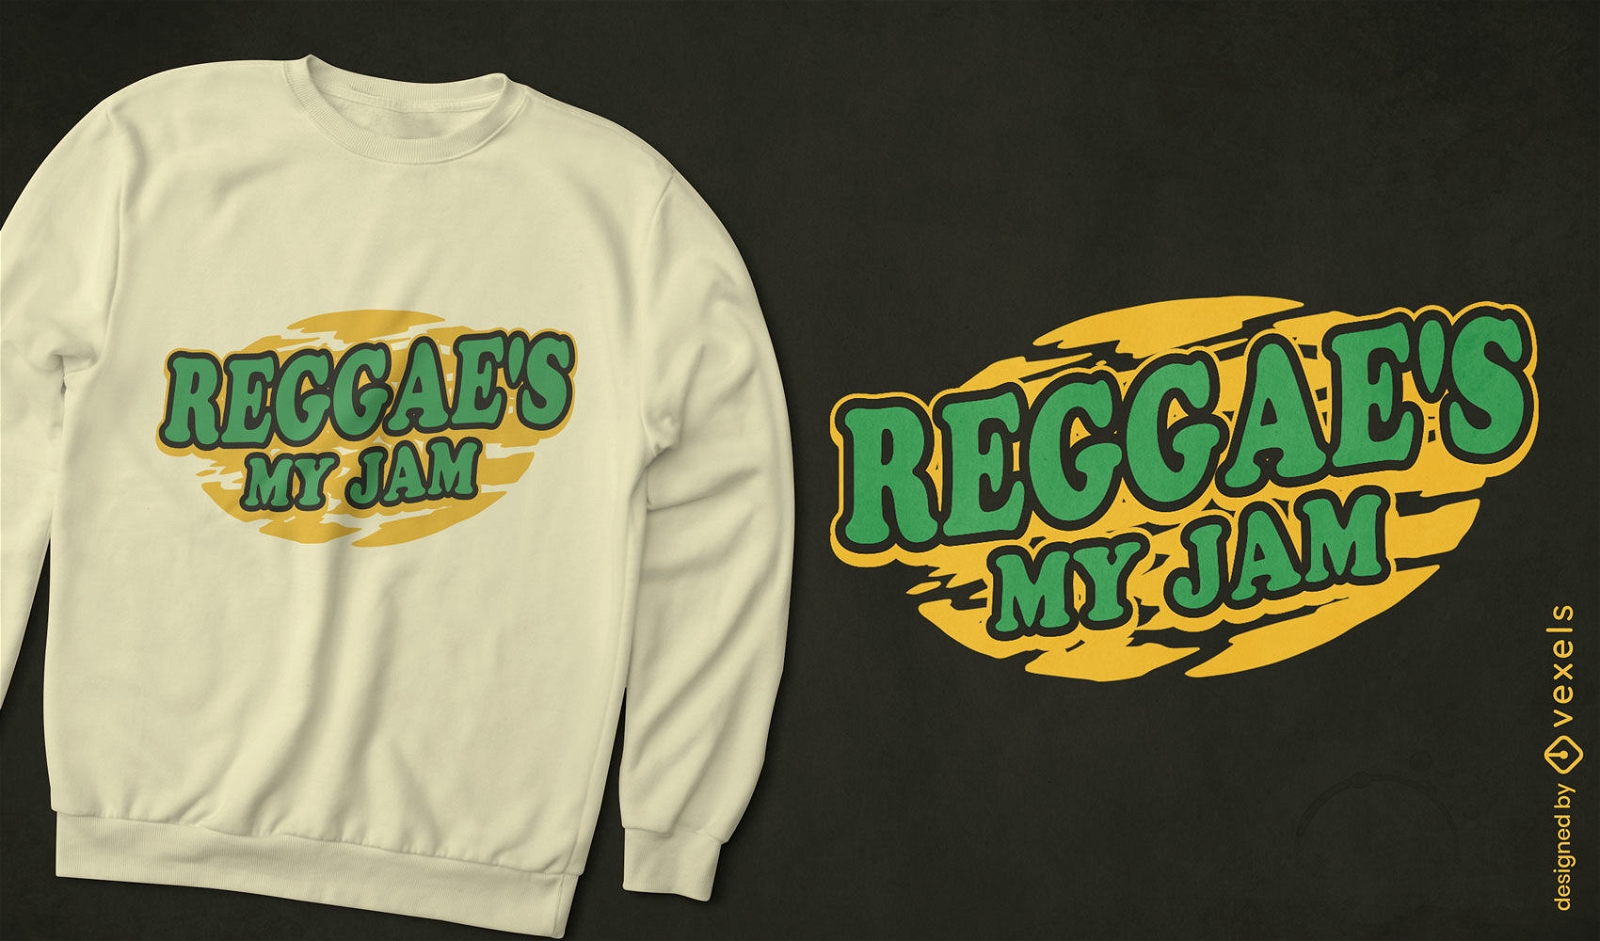
Reggae music jam t-shirt design
Choose a folder
All favorites
Create new
Save
Reggae music jam t-shirt design
Print ready
for Merch
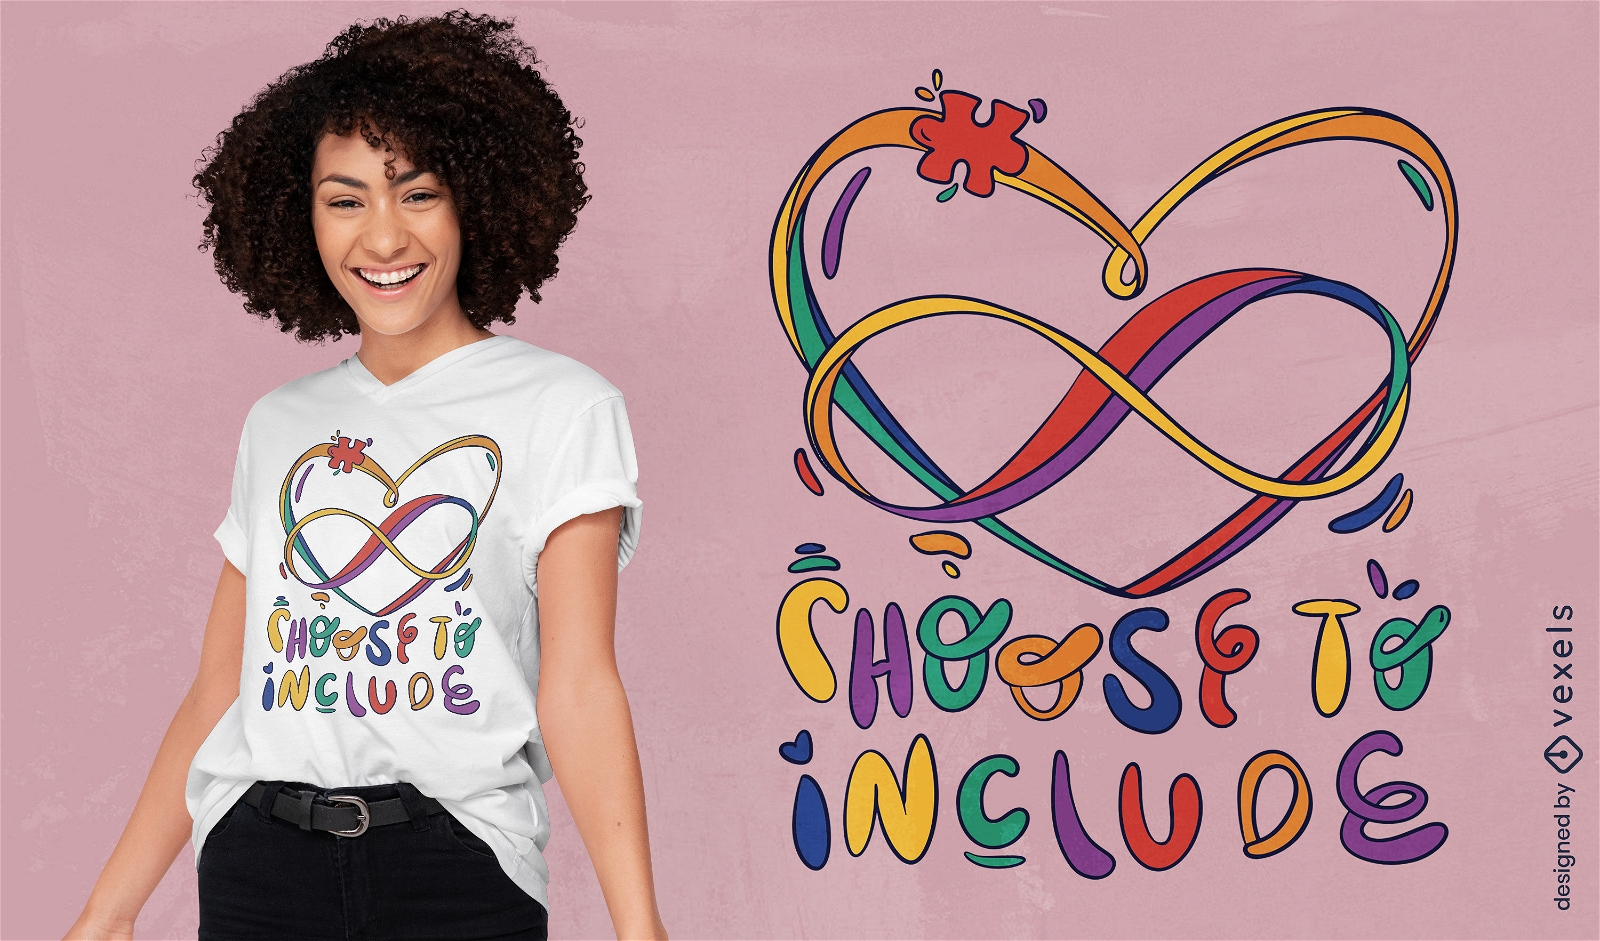
Choose to include t-shirt design
Choose a folder
All favorites
Create new
Save
Choose to include t-shirt design
Print ready
for Merch
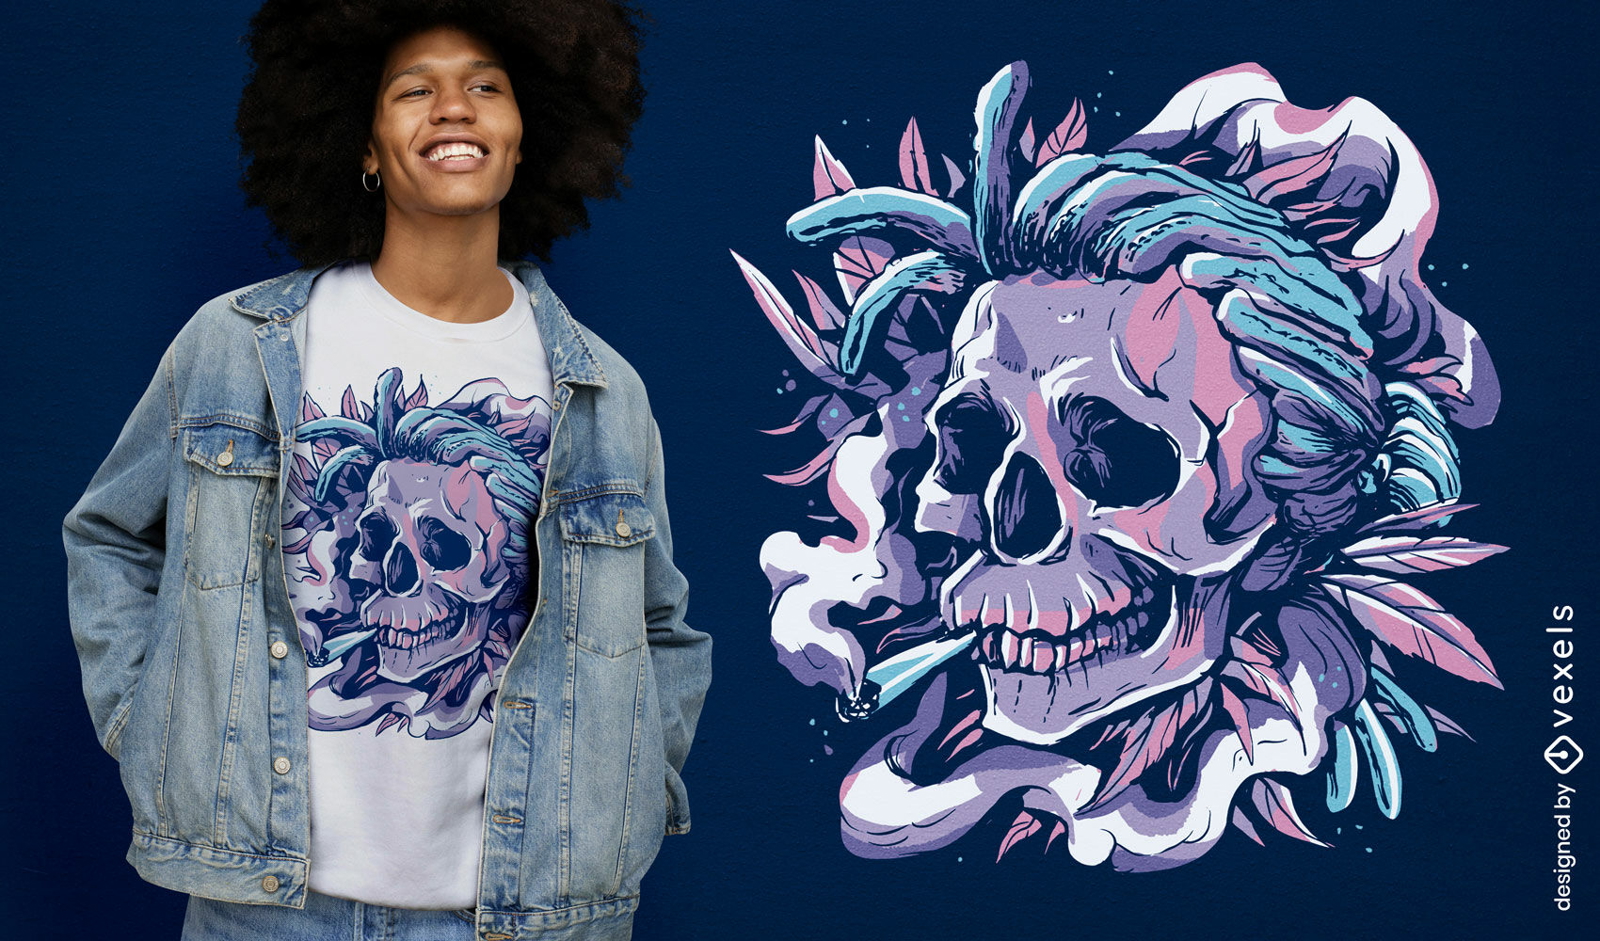
Trippy skull smoking weed t-shirt design
Choose a folder
All favorites
Create new
Save
Trippy skull smoking weed t-shirt design
Editable text
Print ready
for Merch
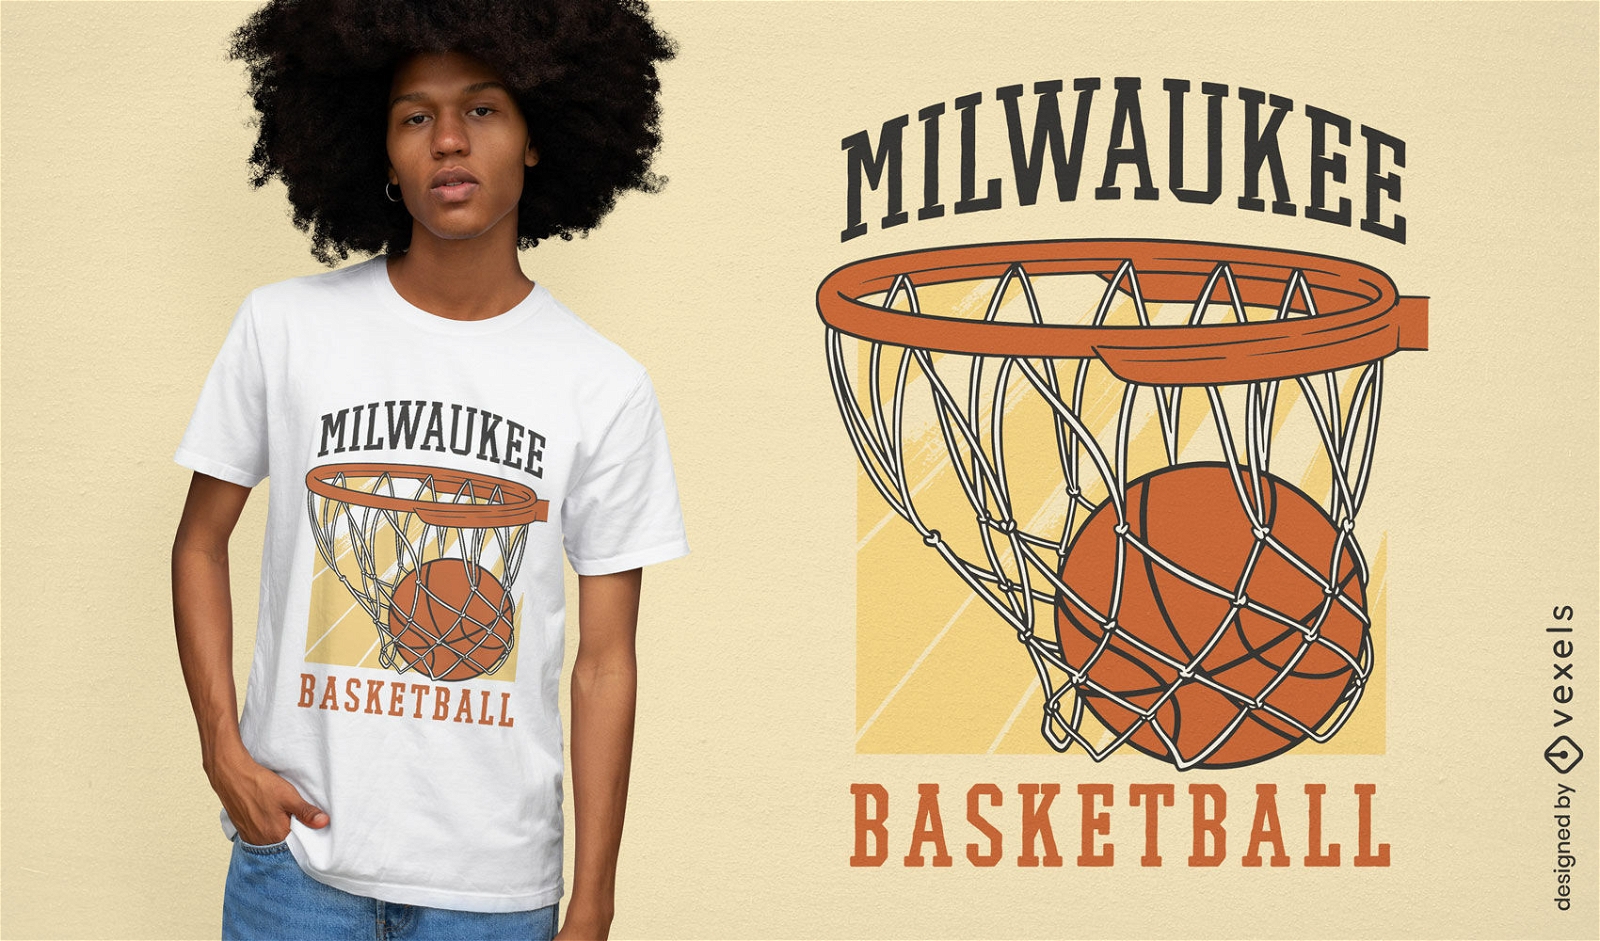
Basketball in hoop sport t-shirt design
Choose a folder
All favorites
Create new
Save
Basketball in hoop sport t-shirt design
Print ready
for Merch
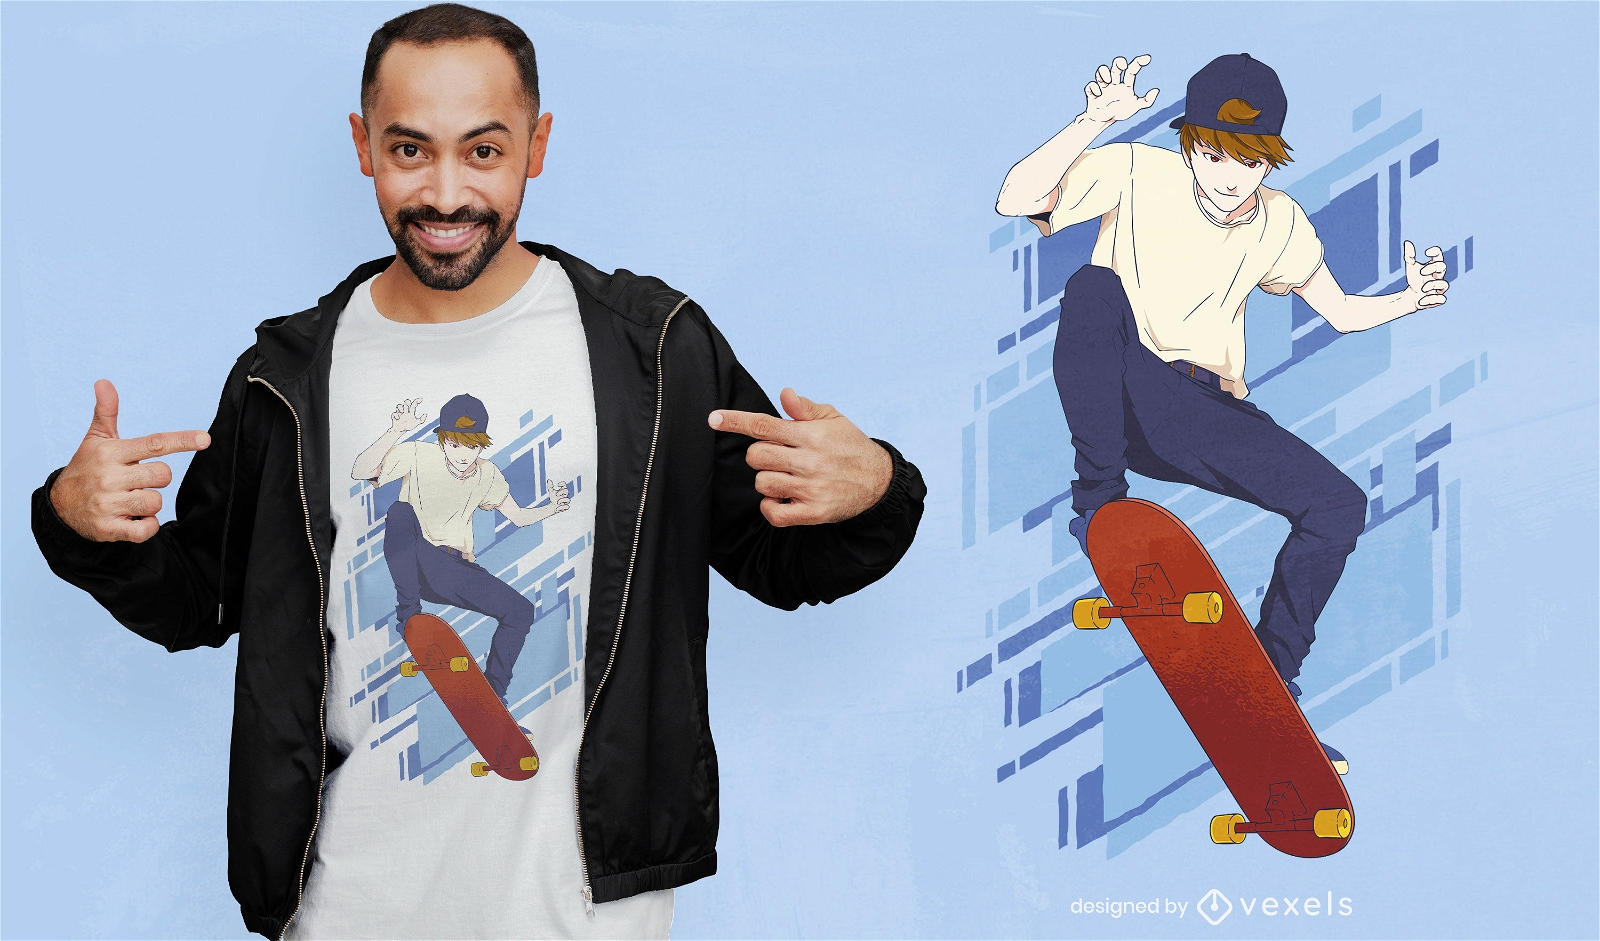
Anime skater boy t-shirt design
Choose a folder
All favorites
Create new
Save
Anime skater boy t-shirt design
Print ready
for Merch
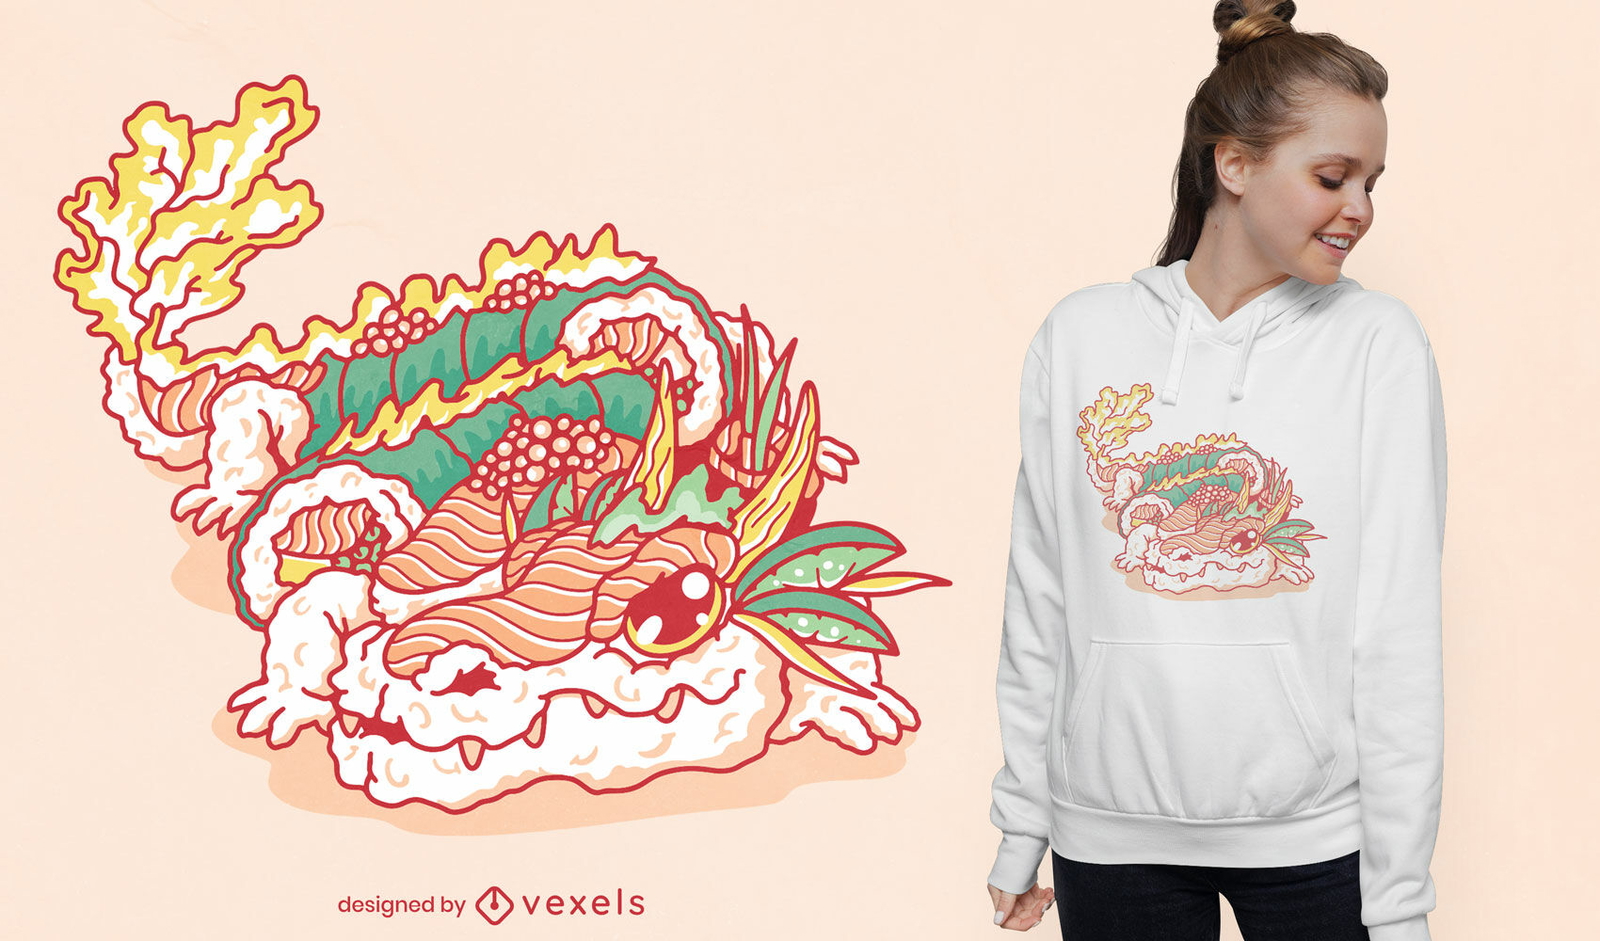
Sushi dragon creature t-shirt design
Choose a folder
All favorites
Create new
Save
Sushi dragon creature t-shirt design
Print ready
for Merch
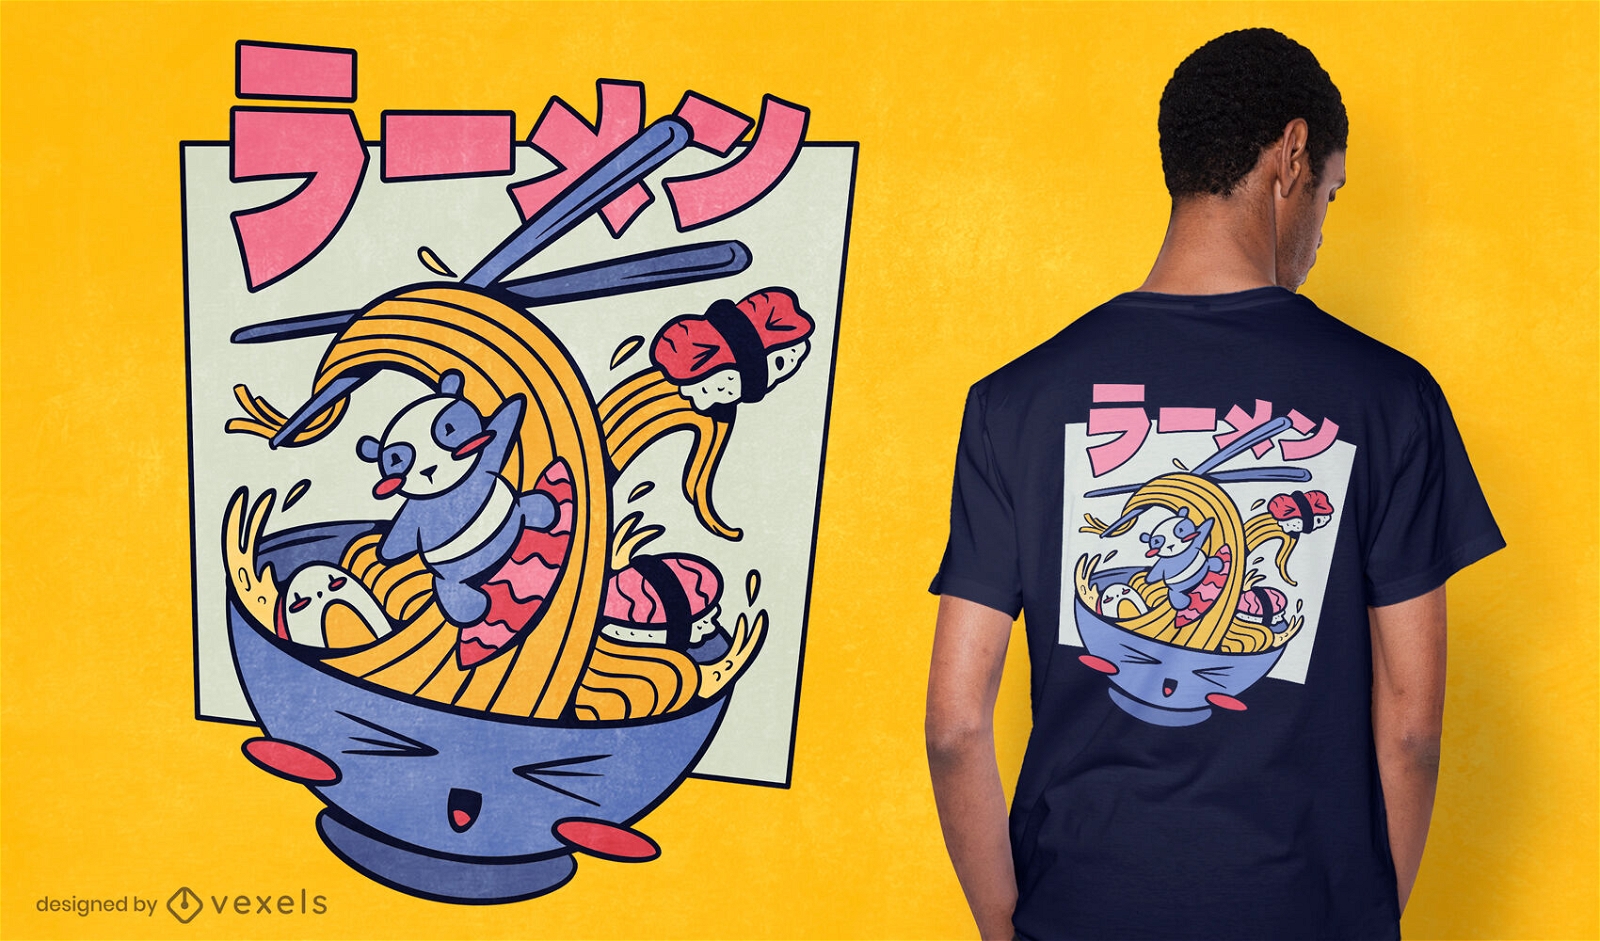
Panda surfing in ramen t-shirt design
Choose a folder
All favorites
Create new
Save
Panda surfing in ramen t-shirt design
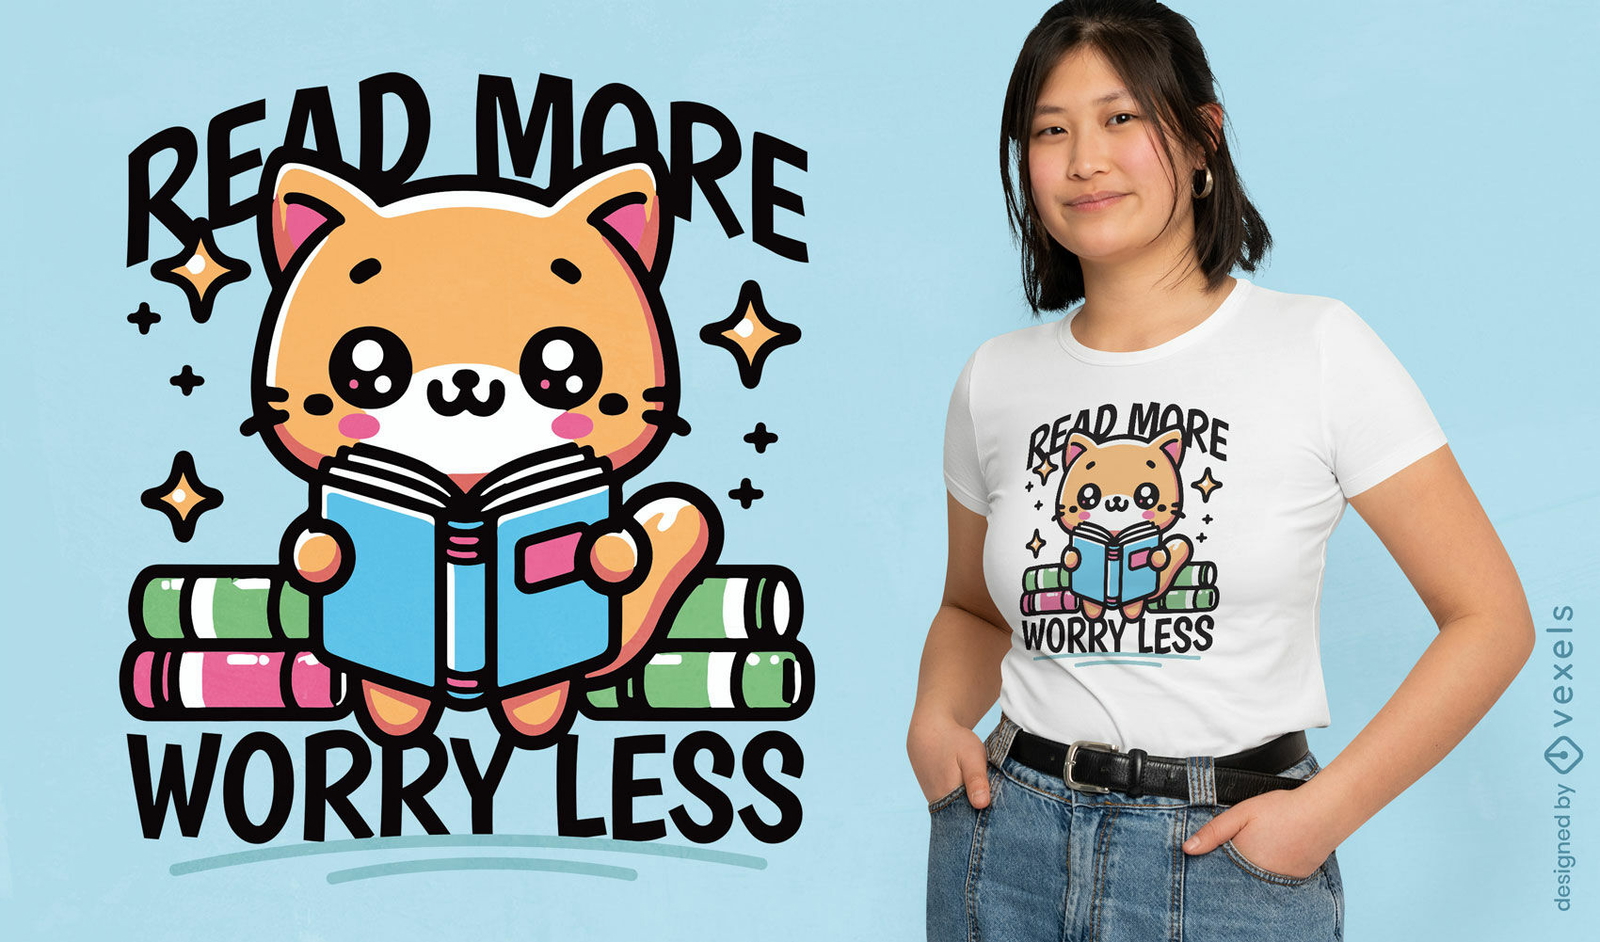
Editable text
Print ready
for Merch
Adorable cat reading t-shirt design
Choose a folder
All favorites
Create new
Save
Adorable cat reading t-shirt design
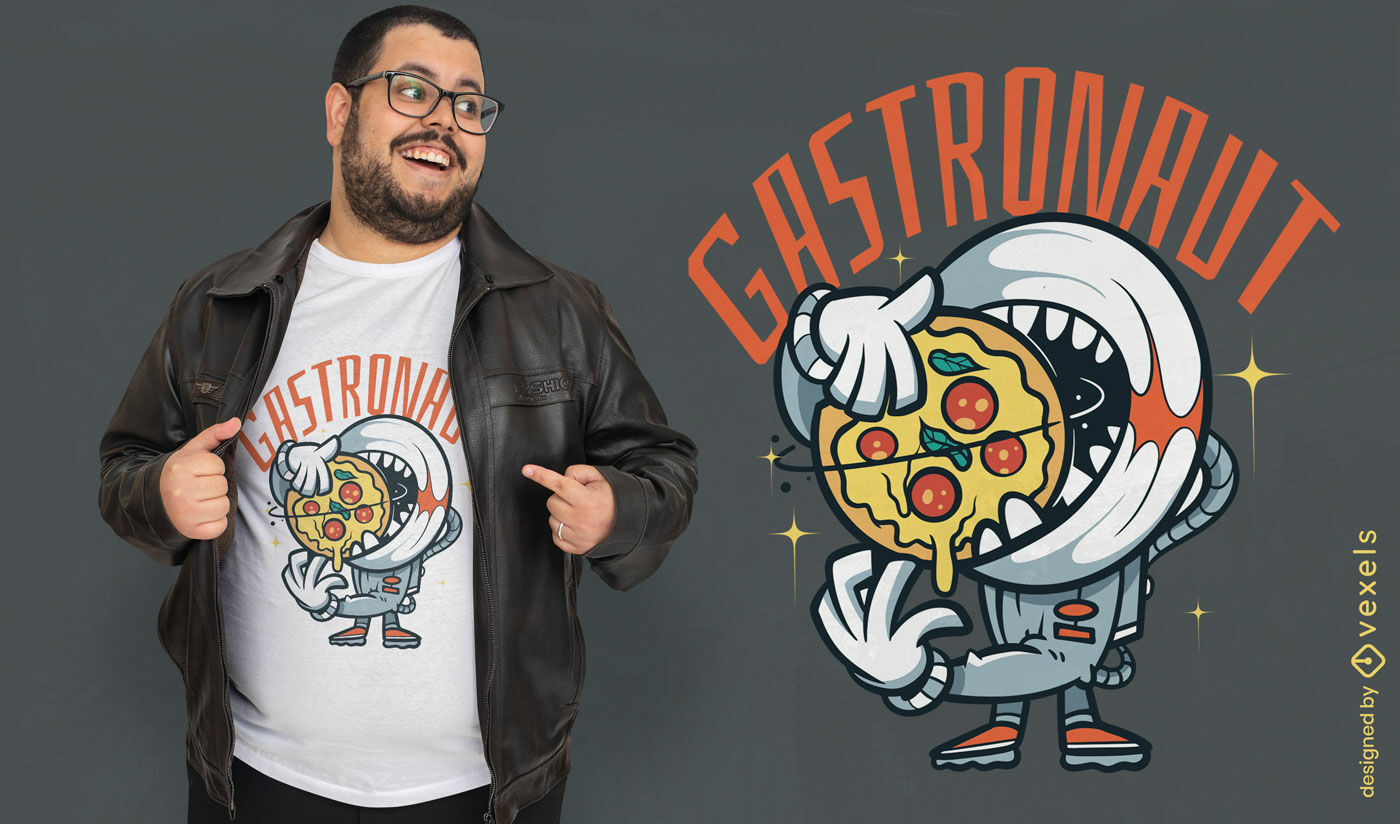
Editable text
Print ready
for Merch
Space pizza t-shirt design
Choose a folder
All favorites
Create new
Save
Space pizza t-shirt design
Editable text
Print ready
for Merch
Retro 80s 90s nostalgia t-shirt design
Choose a folder
All favorites
Create new
Save
Retro 80s 90s nostalgia t-shirt design
Boost Your Business
With The Leading Graphic Platform For Merch.
SEE PLANS
Next
of 720
prev page
next page