Design Library
New Merch Designs
T-Shirts
Vectors
Trending Merch Designs
PNGs & SVGs
Mockups
T-Shirt PSD Templates
Explore Designs
KDP Designs
Posters
Mugs
Phone Cases
Tote Bags
Pillows
Design Tools
Merch Designer
New!
Mockup Generator
AI Design Generator
Image Vectorizer
Quote Generator
T-Shirt Maker (Old)
Resources
Merch Digest
Blog
Help Center
Learn About Merch
Feedback
Corporate Solutions
Enterprise
API Access
Pricing
Loading...
Sign Up
Login
Merch Vectors
grafico
Design Library
New Merch Designs
T-Shirts
Vectors
Trending Merch Designs
PNGs & SVGs
Mockups
T-Shirt PSD Templates
Explore Designs
KDP Designs
Posters
Mugs
Phone Cases
Tote Bags
Pillows
Design Tools
Merch Designer
New!
Mockup Generator
AI Design Generator
Image Vectorizer
Quote Generator
T-Shirt Maker (Old)
Resources
Merch Digest
Blog
Help Center
Learn About Merch
Feedback
Corporate Solutions
Enterprise
API Access
PLANS
Merch Vectors
grafico
35988 grafico Vector Designs for T-Shirts and merch
Download & buy editable grafico AI Vector Graphics Designs for T shirts, Phone Cases, Book Covers and other Merch
Sort by
Most relevant
Sponsored results by
Get 15% off with code: VEXELS15
Show more
Print ready
for Merch
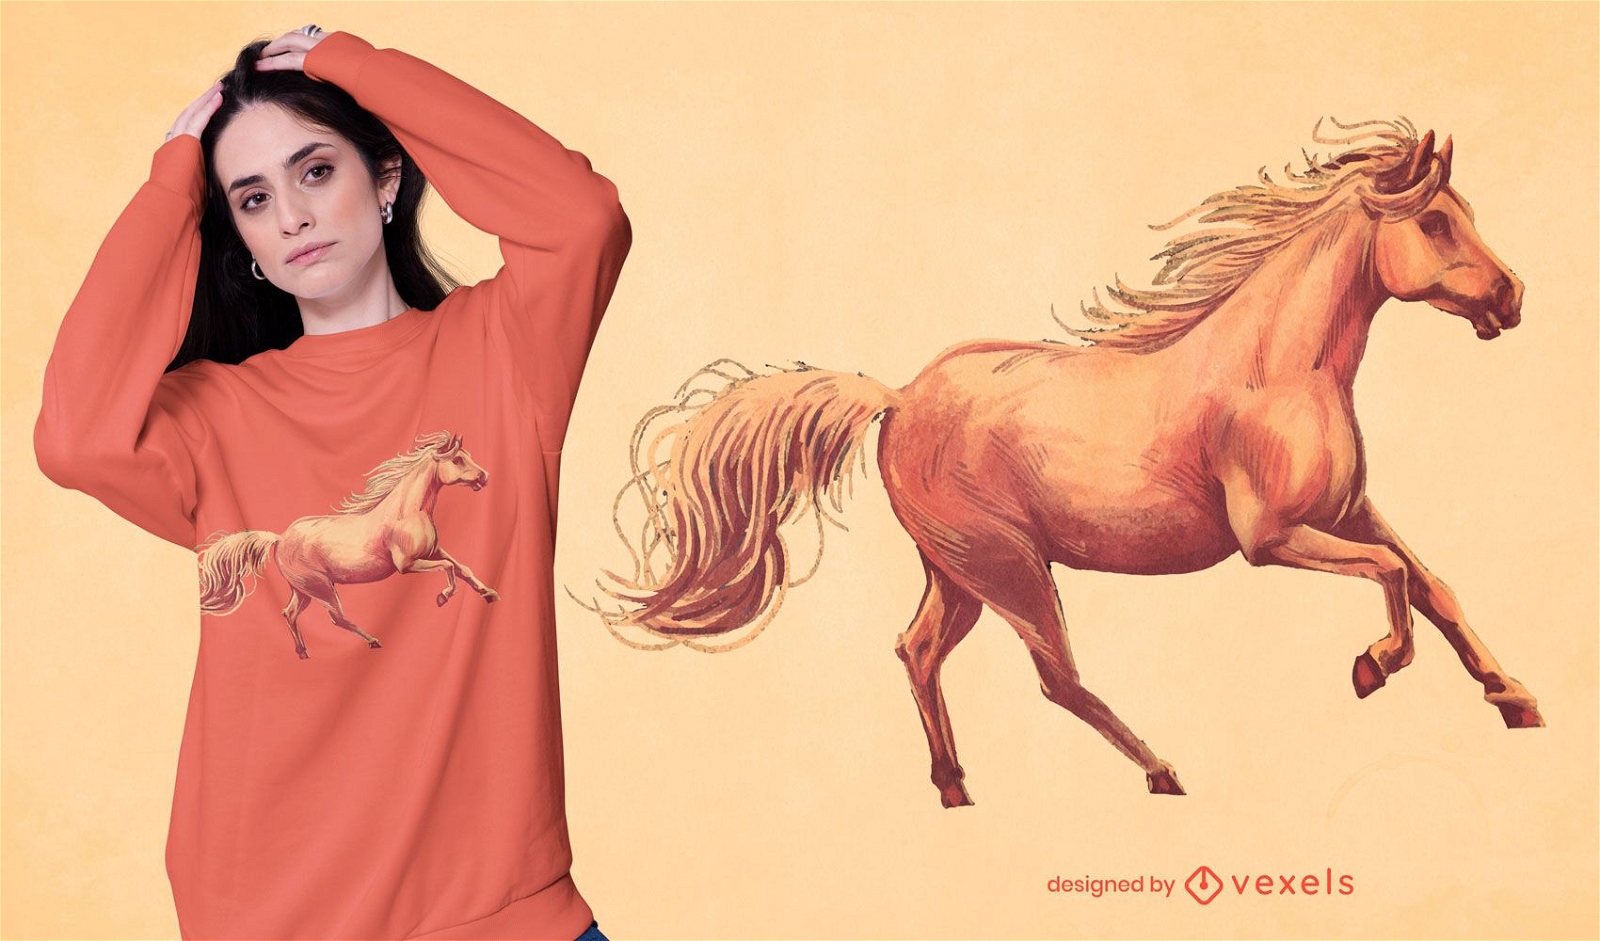
Realistic horse t-shirt design
Choose a folder
All favorites
Create new
Save
Realistic horse t-shirt design
Print ready
for Merch
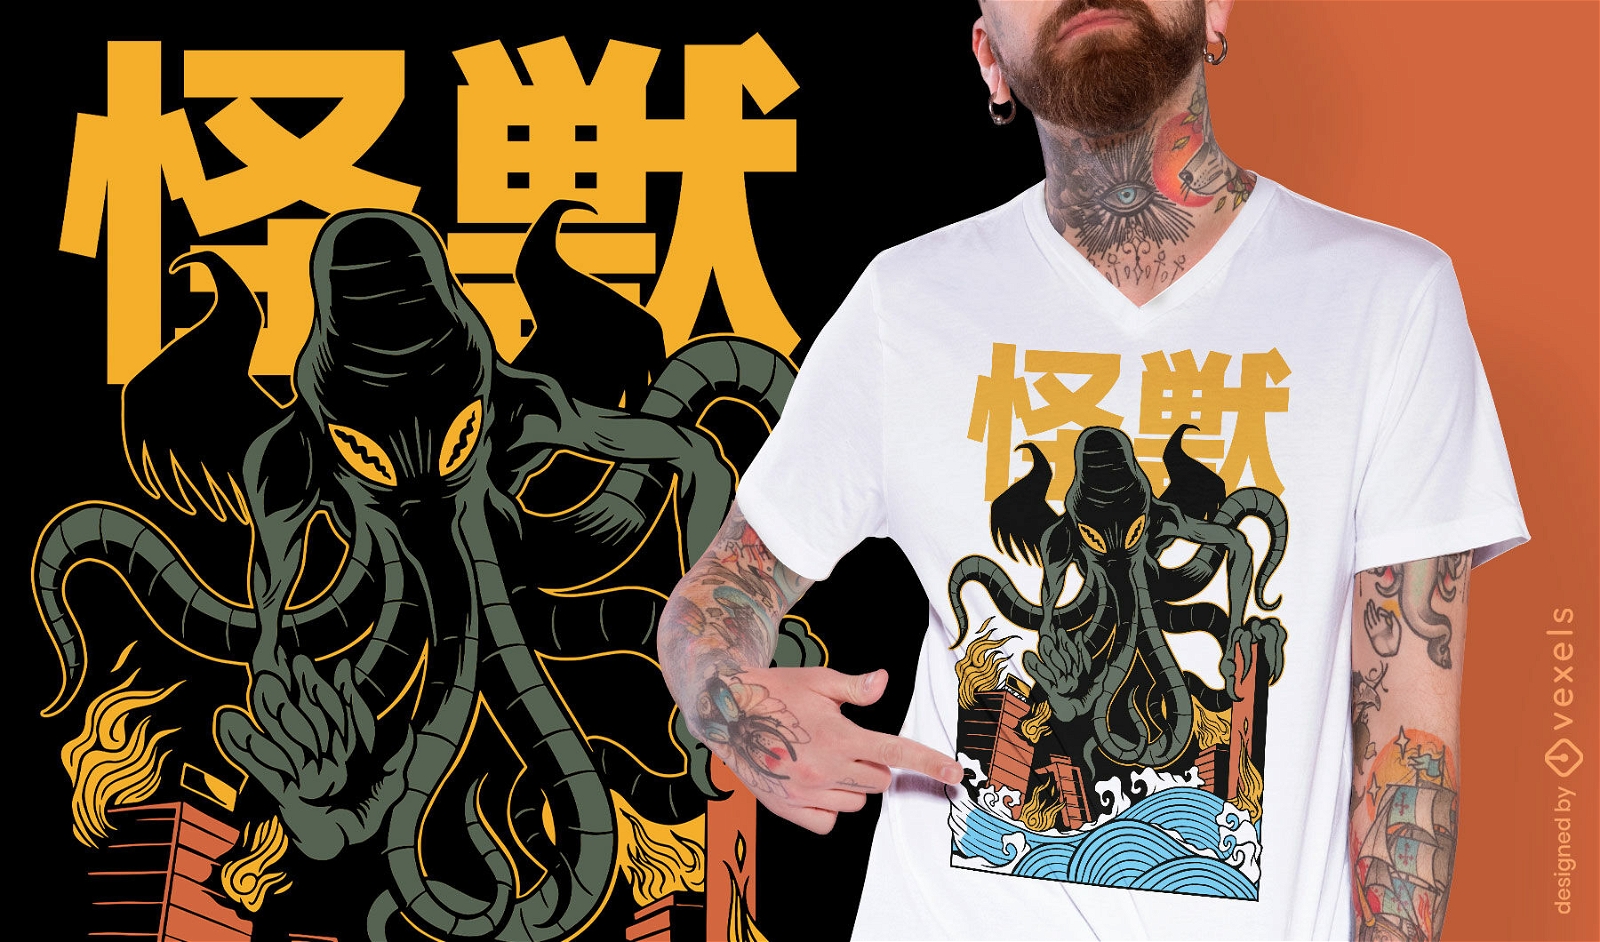
Japanese kaiju Cthulhu T-shirt Design
Choose a folder
All favorites
Create new
Save
Japanese kaiju Cthulhu T-shirt Design
Print ready
for Merch
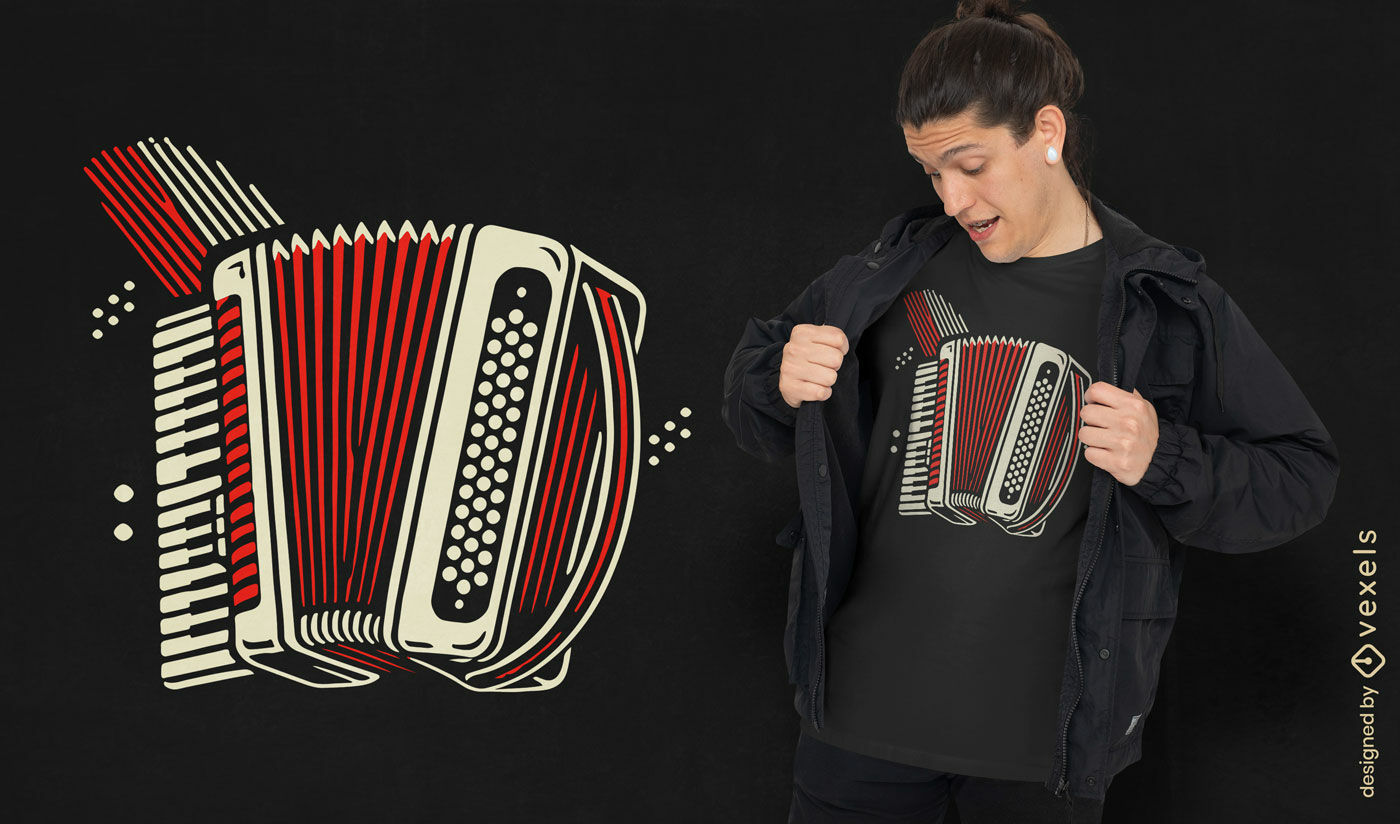
Stylized accordion t-shirt design
Choose a folder
All favorites
Create new
Save
Stylized accordion t-shirt design
Editable text
Print ready
for Merch
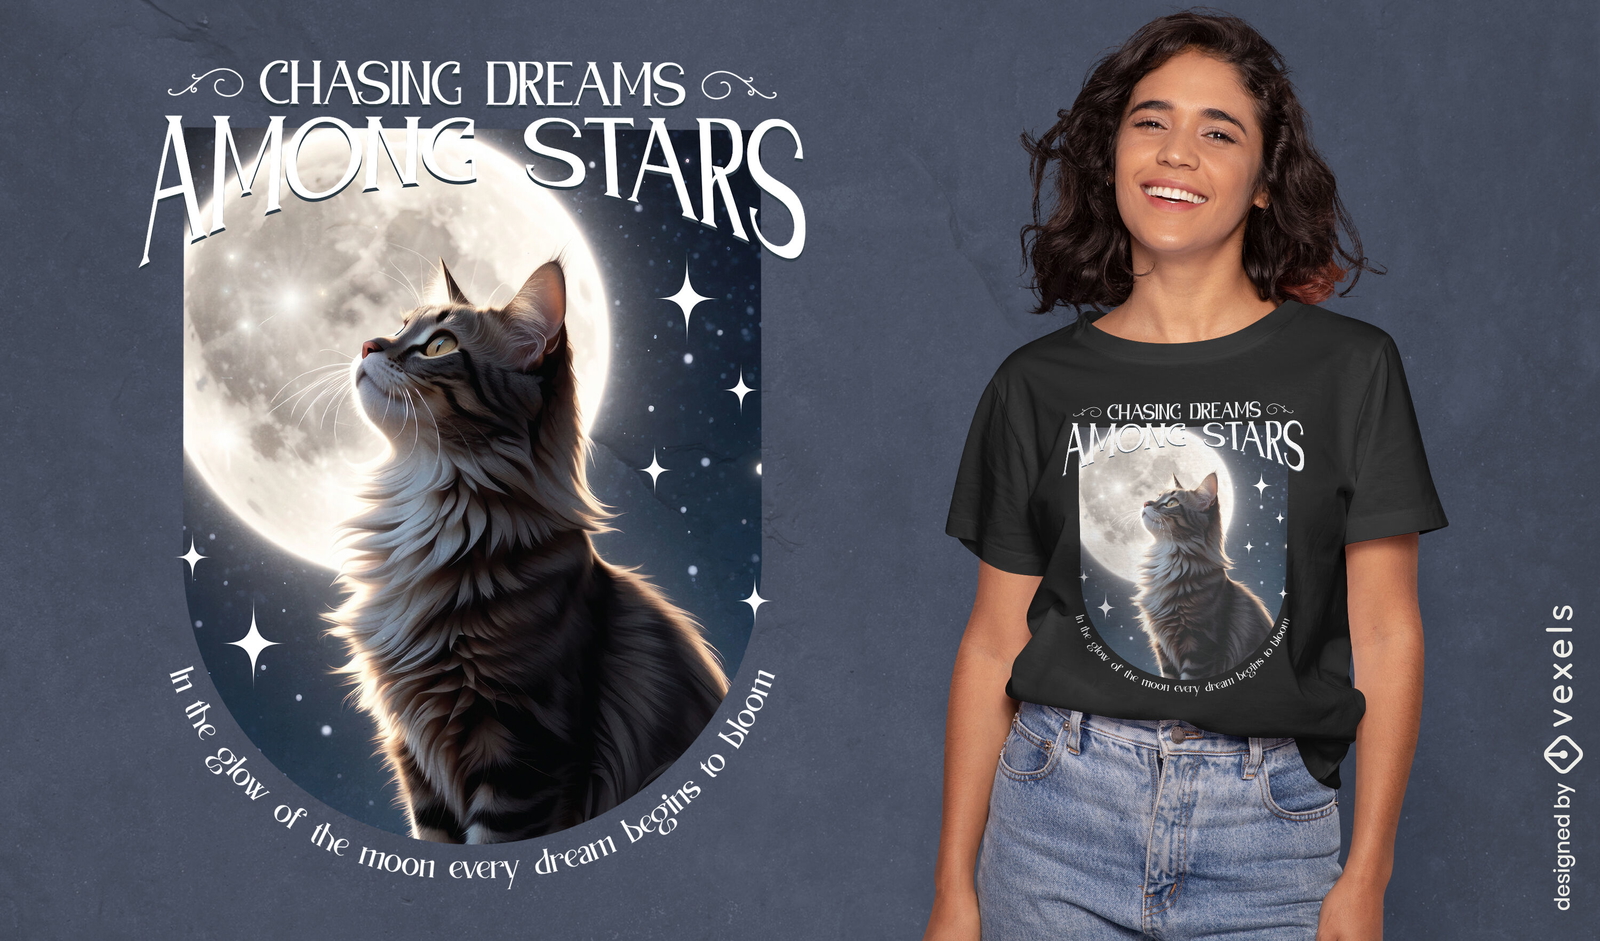
Chasing dreams among the stars cat t-shirt design
Choose a folder
All favorites
Create new
Save
Chasing dreams among the stars cat t-shirt design
Print ready
for Merch
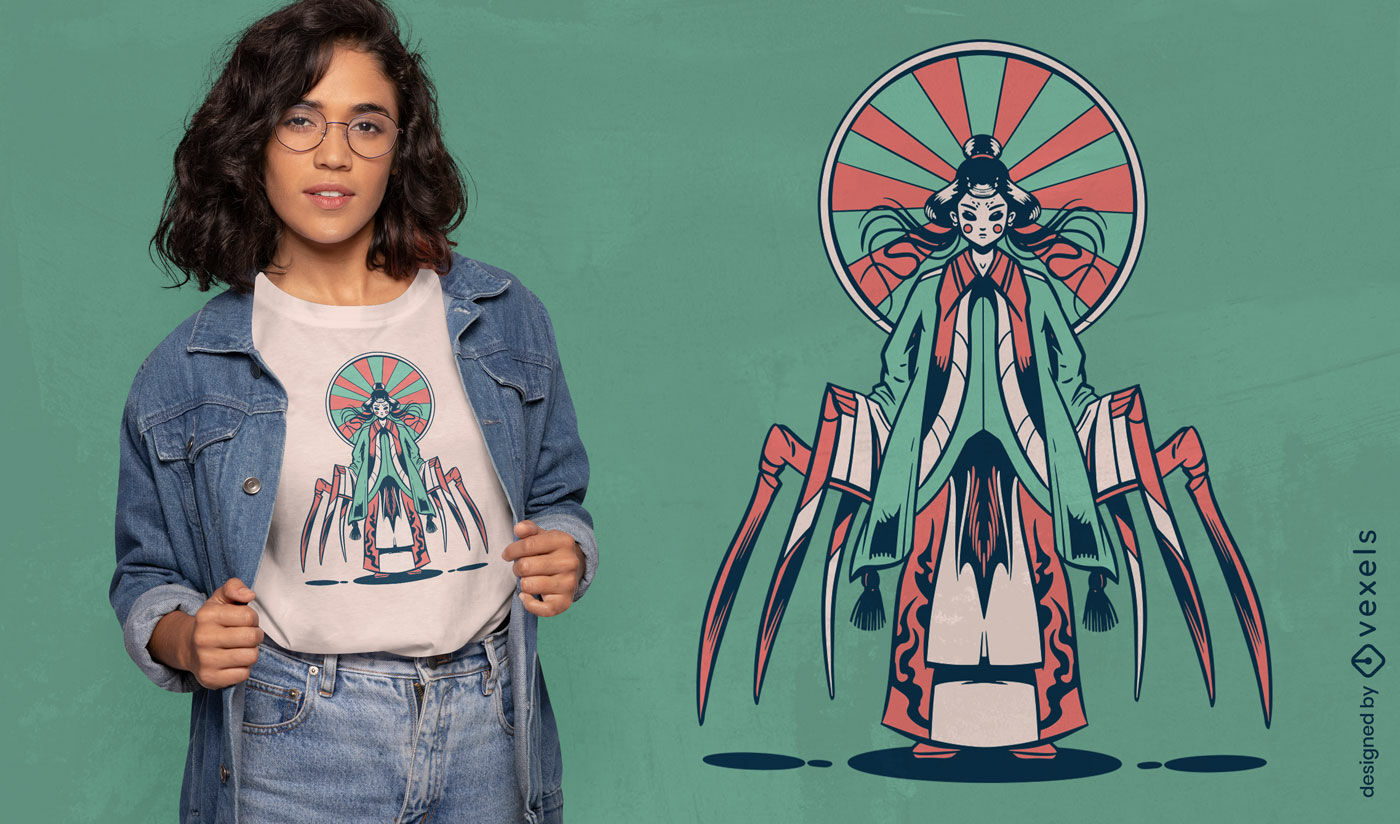
Jorogumo t-shirt design
Choose a folder
All favorites
Create new
Save
Jorogumo t-shirt design
Print ready
for Merch
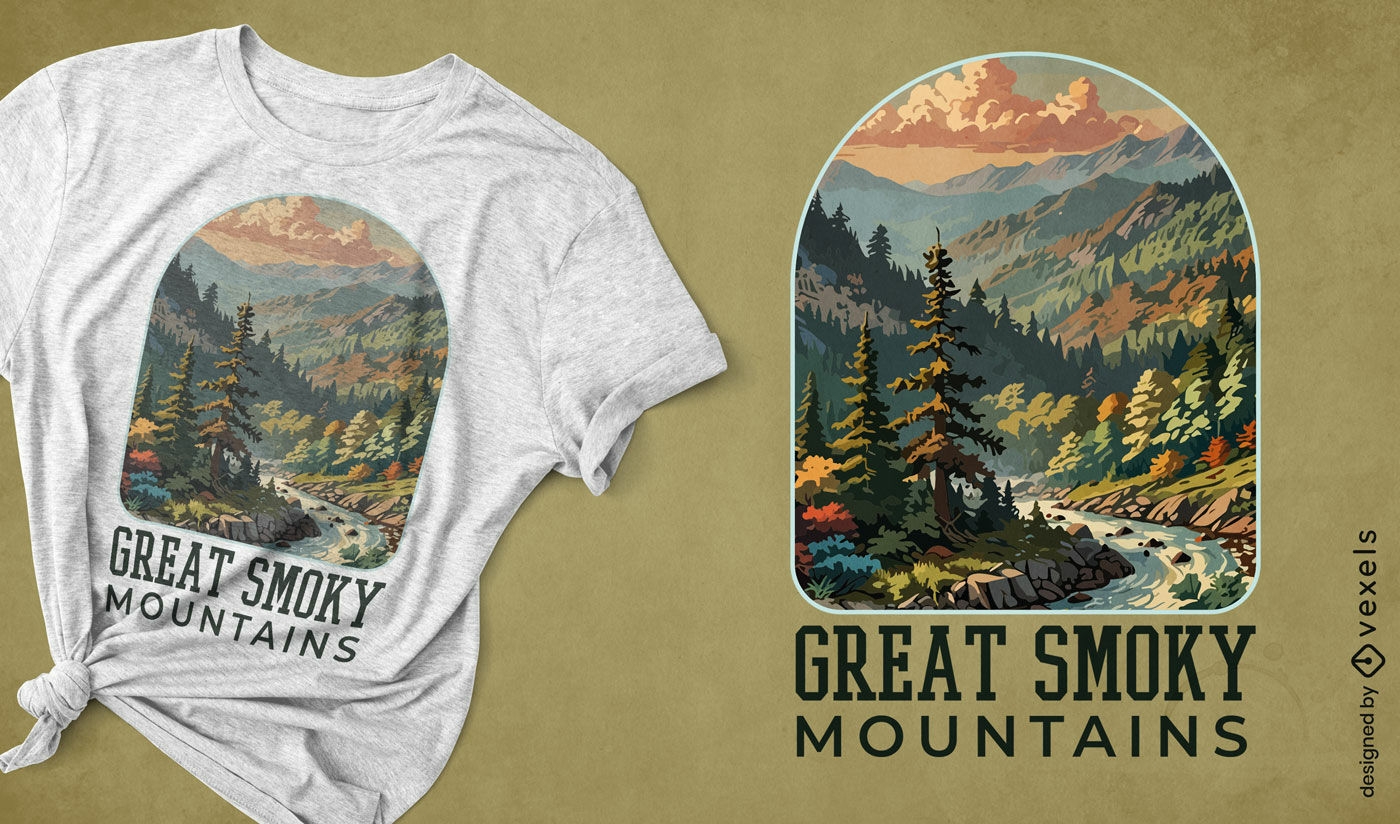
Great Smoky Mountains t-shirt design
Choose a folder
All favorites
Create new
Save
Great Smoky Mountains t-shirt design
Print ready
for Merch
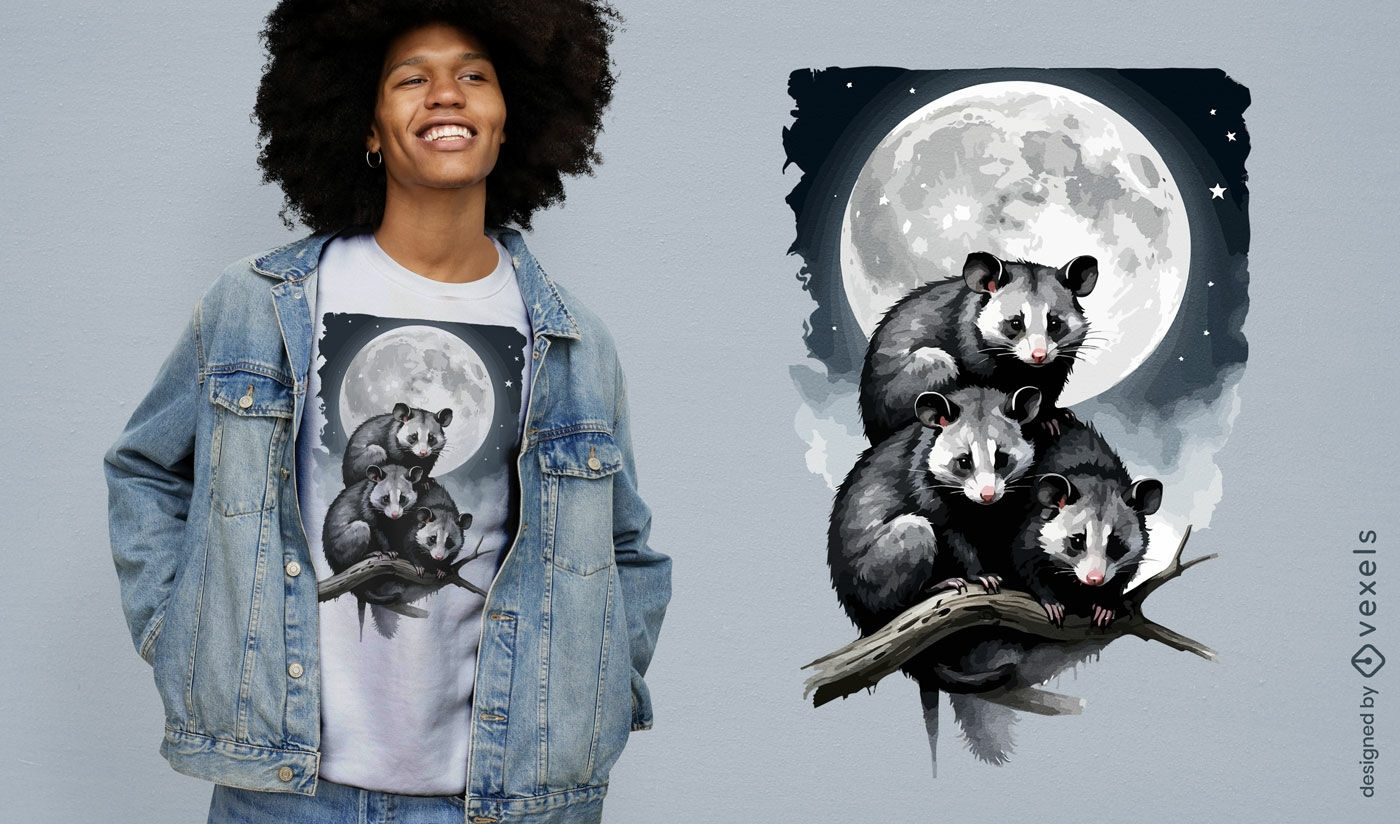
Moonlit opossum t-shirt design
Choose a folder
All favorites
Create new
Save
Moonlit opossum t-shirt design
Print ready
for Merch
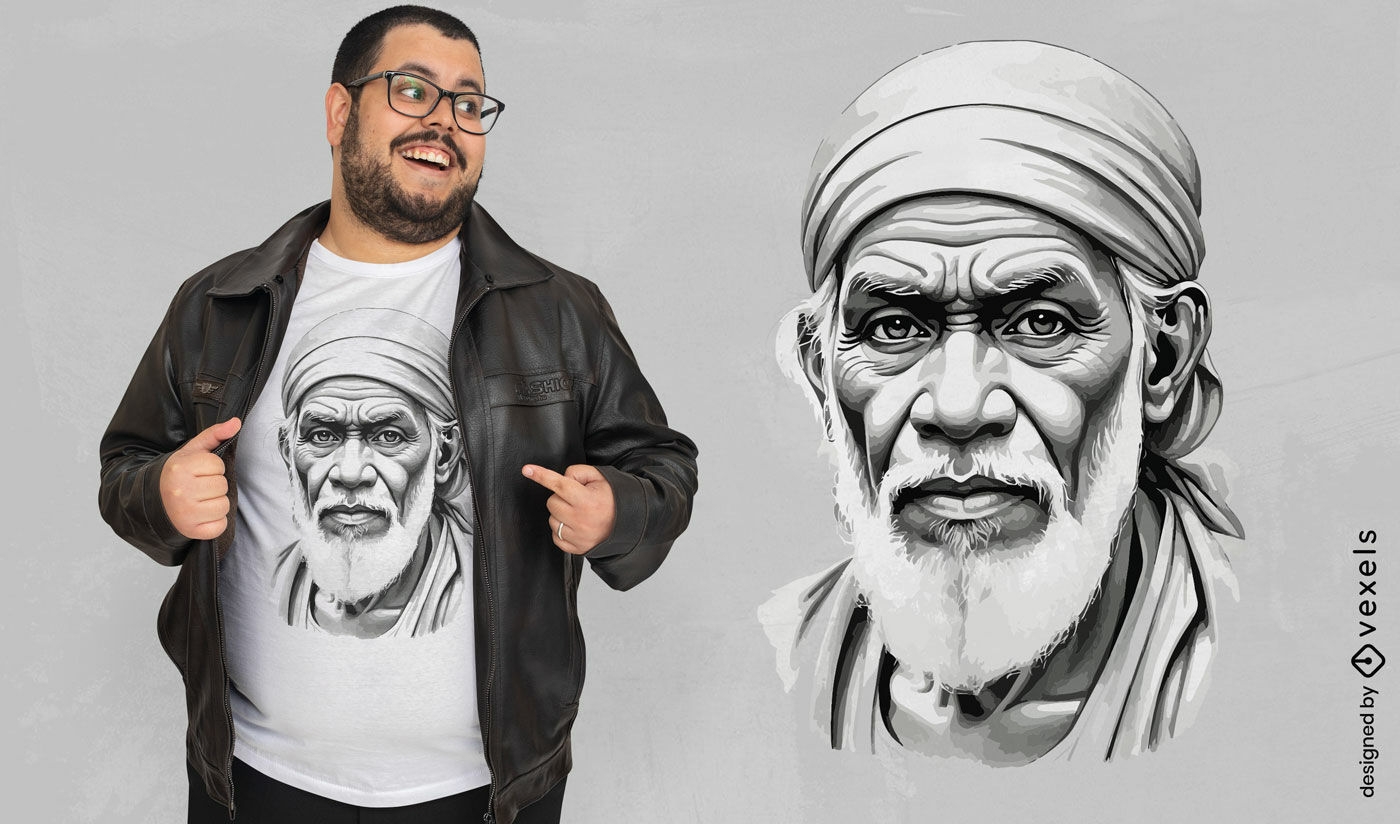
Sai Baba portrait t-shirt design
Choose a folder
All favorites
Create new
Save
Sai Baba portrait t-shirt design
Editable text
Print ready
for Merch
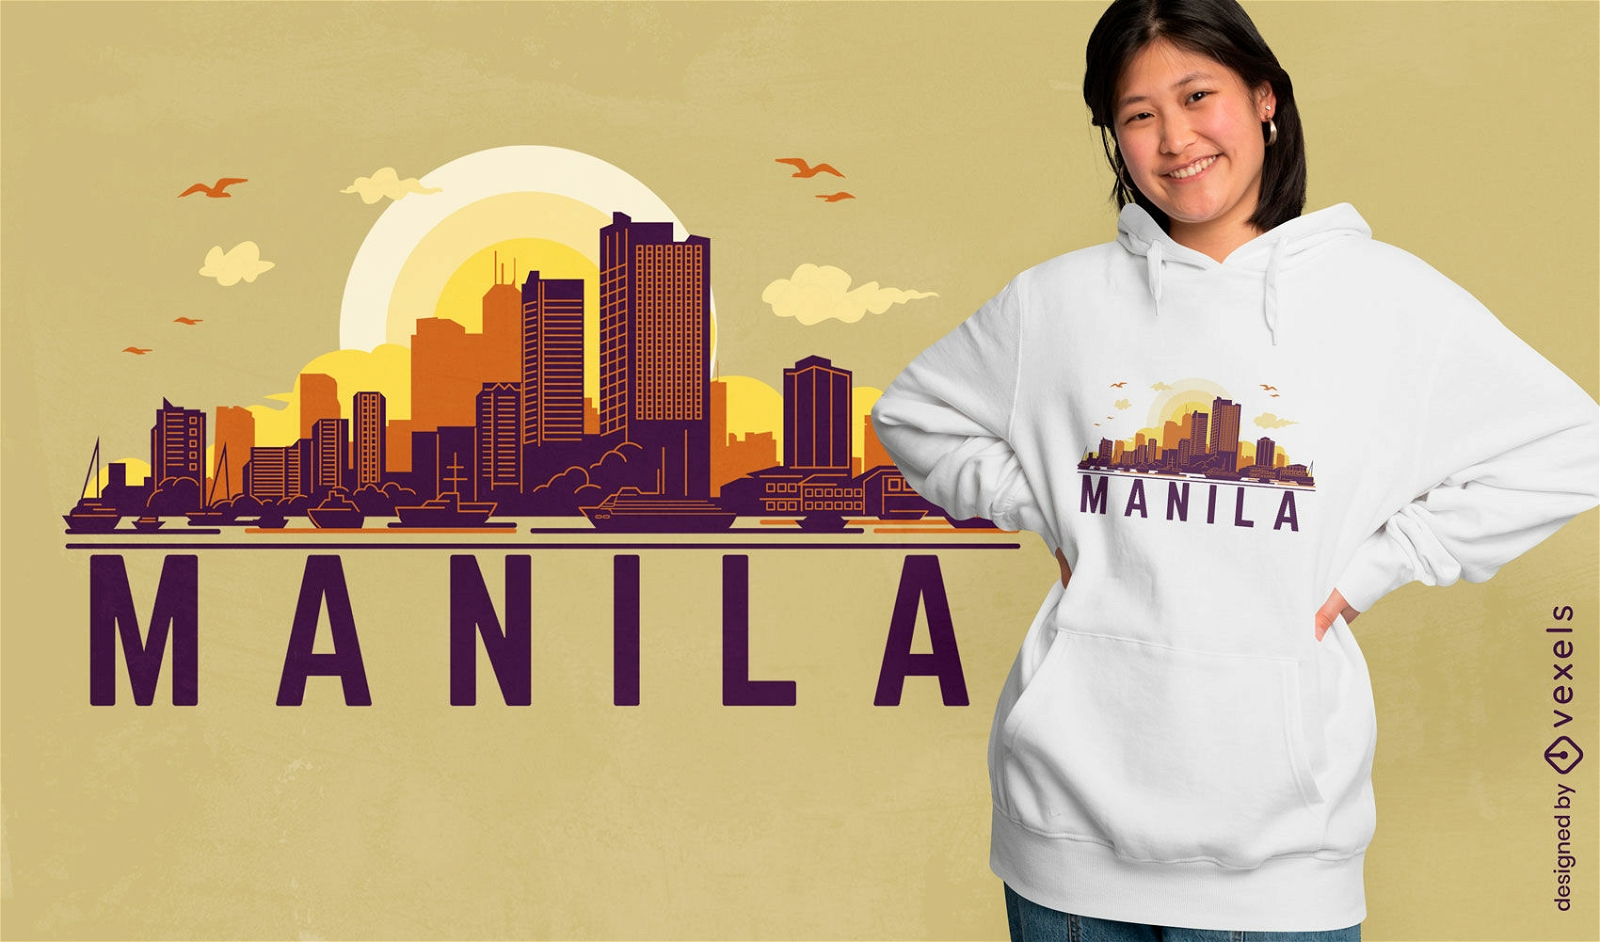
Manila city sunset skyline t-shirt design
Choose a folder
All favorites
Create new
Save
Manila city sunset skyline t-shirt design
Editable text
Print ready
for Merch
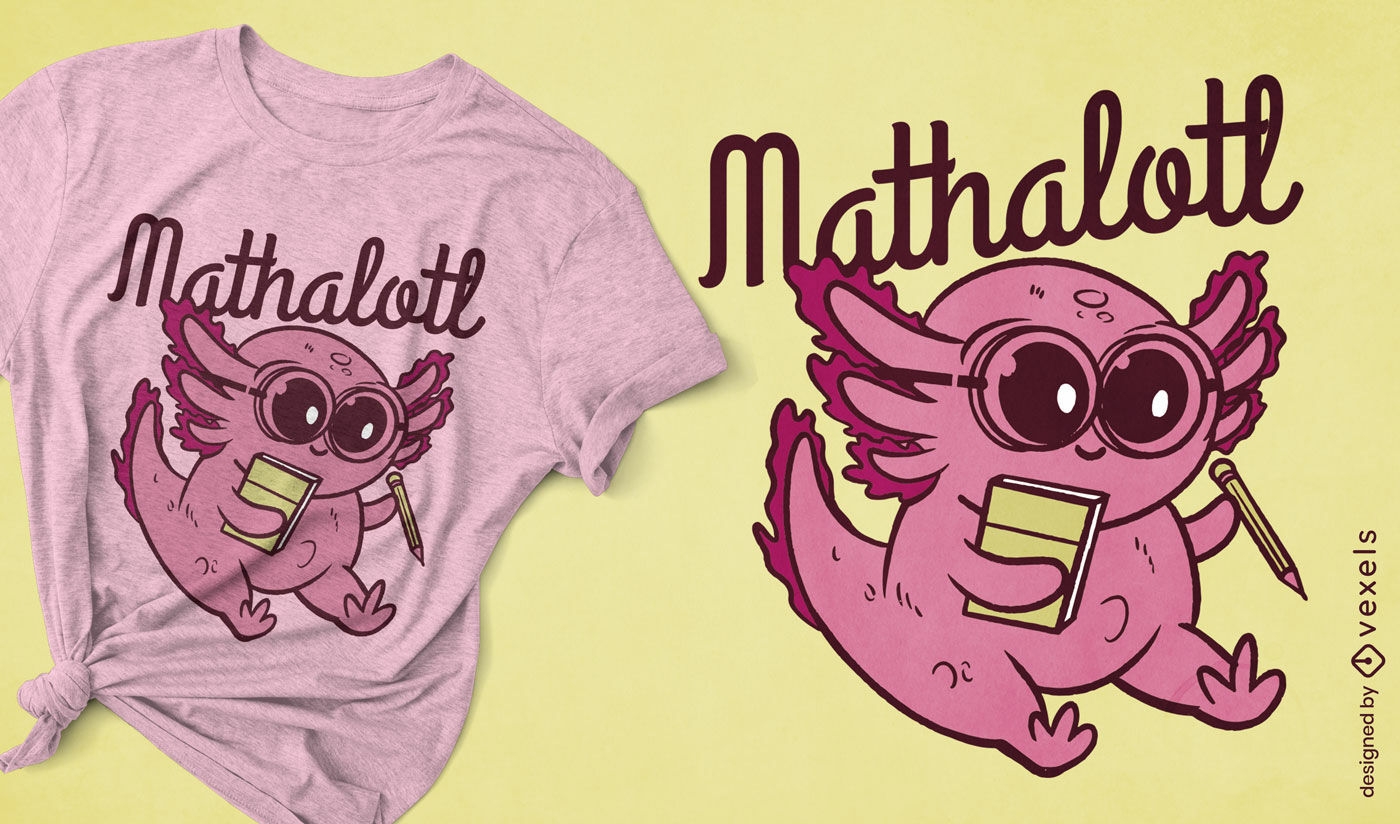
Playful axolotl math t-shirt design
Choose a folder
All favorites
Create new
Save
Playful axolotl math t-shirt design
Print ready
for Merch
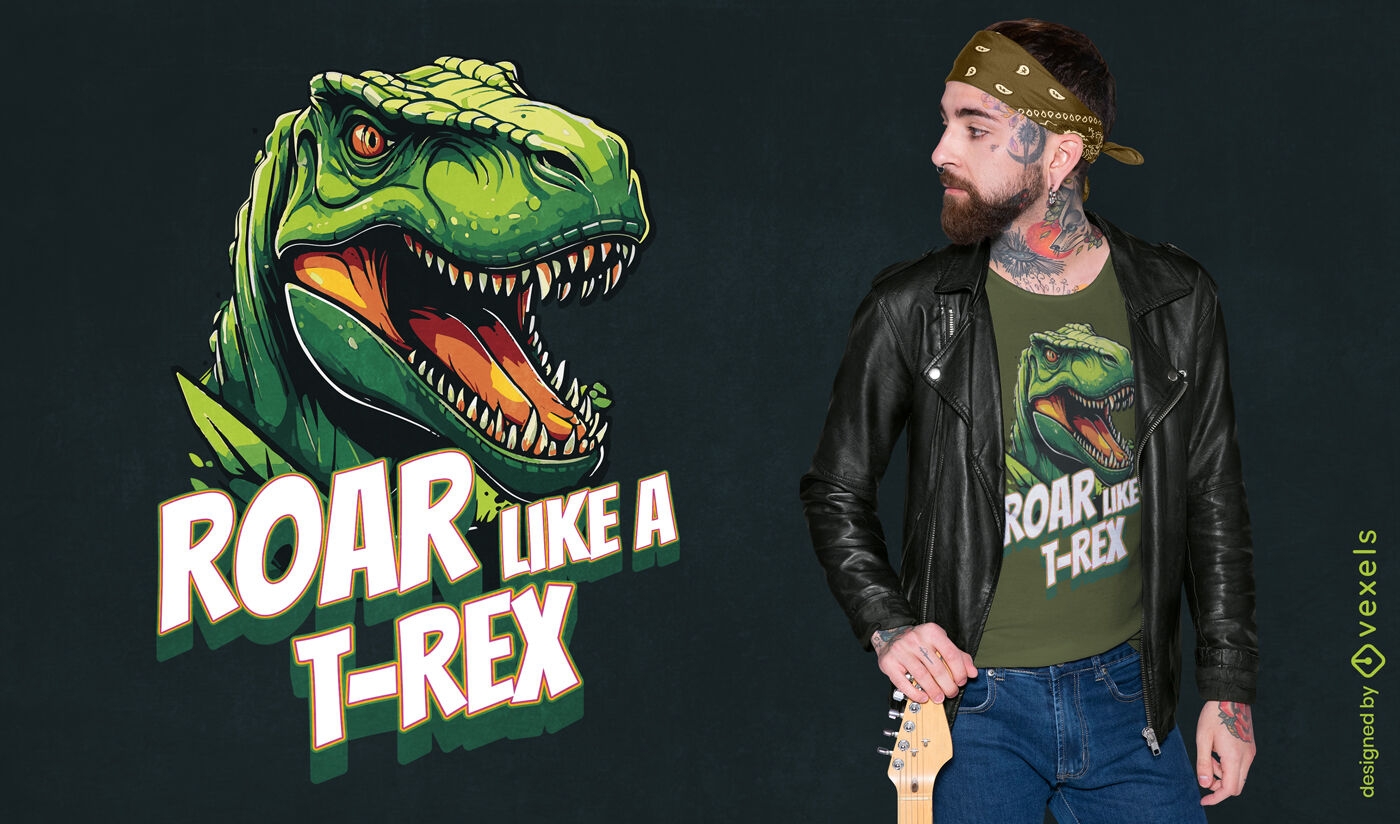
Roar like a T-Rex t-shirt design
Choose a folder
All favorites
Create new
Save
Roar like a T-Rex t-shirt design
Print ready
for Merch
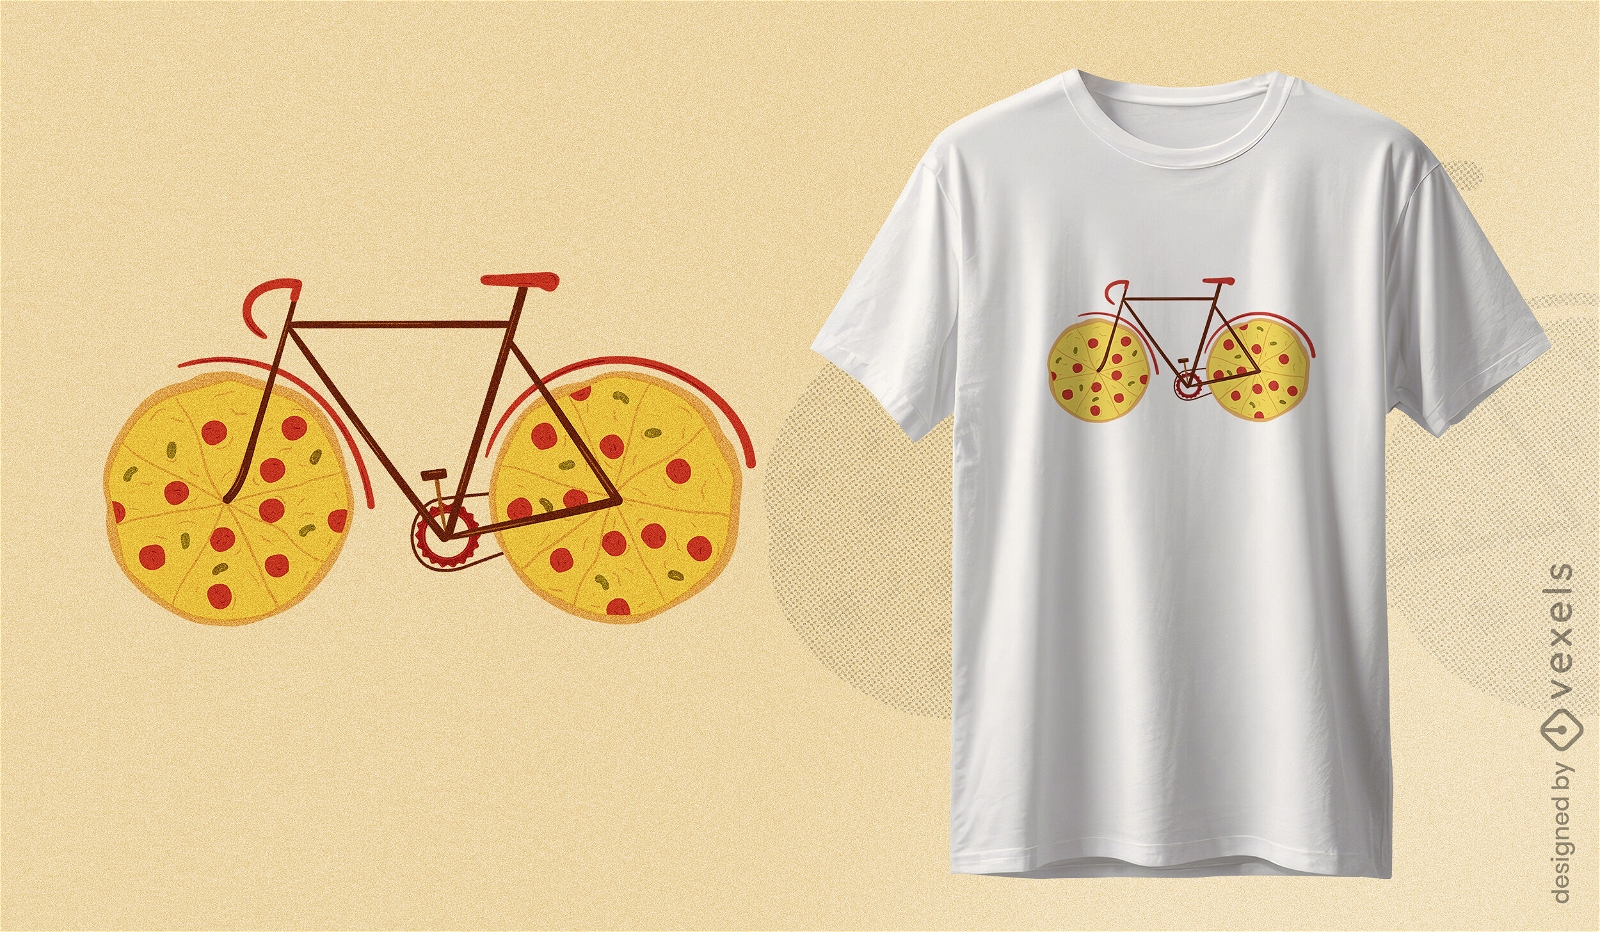
Pizza bicycle t-shirt design
Choose a folder
All favorites
Create new
Save
Pizza bicycle t-shirt design
Print ready
for Merch
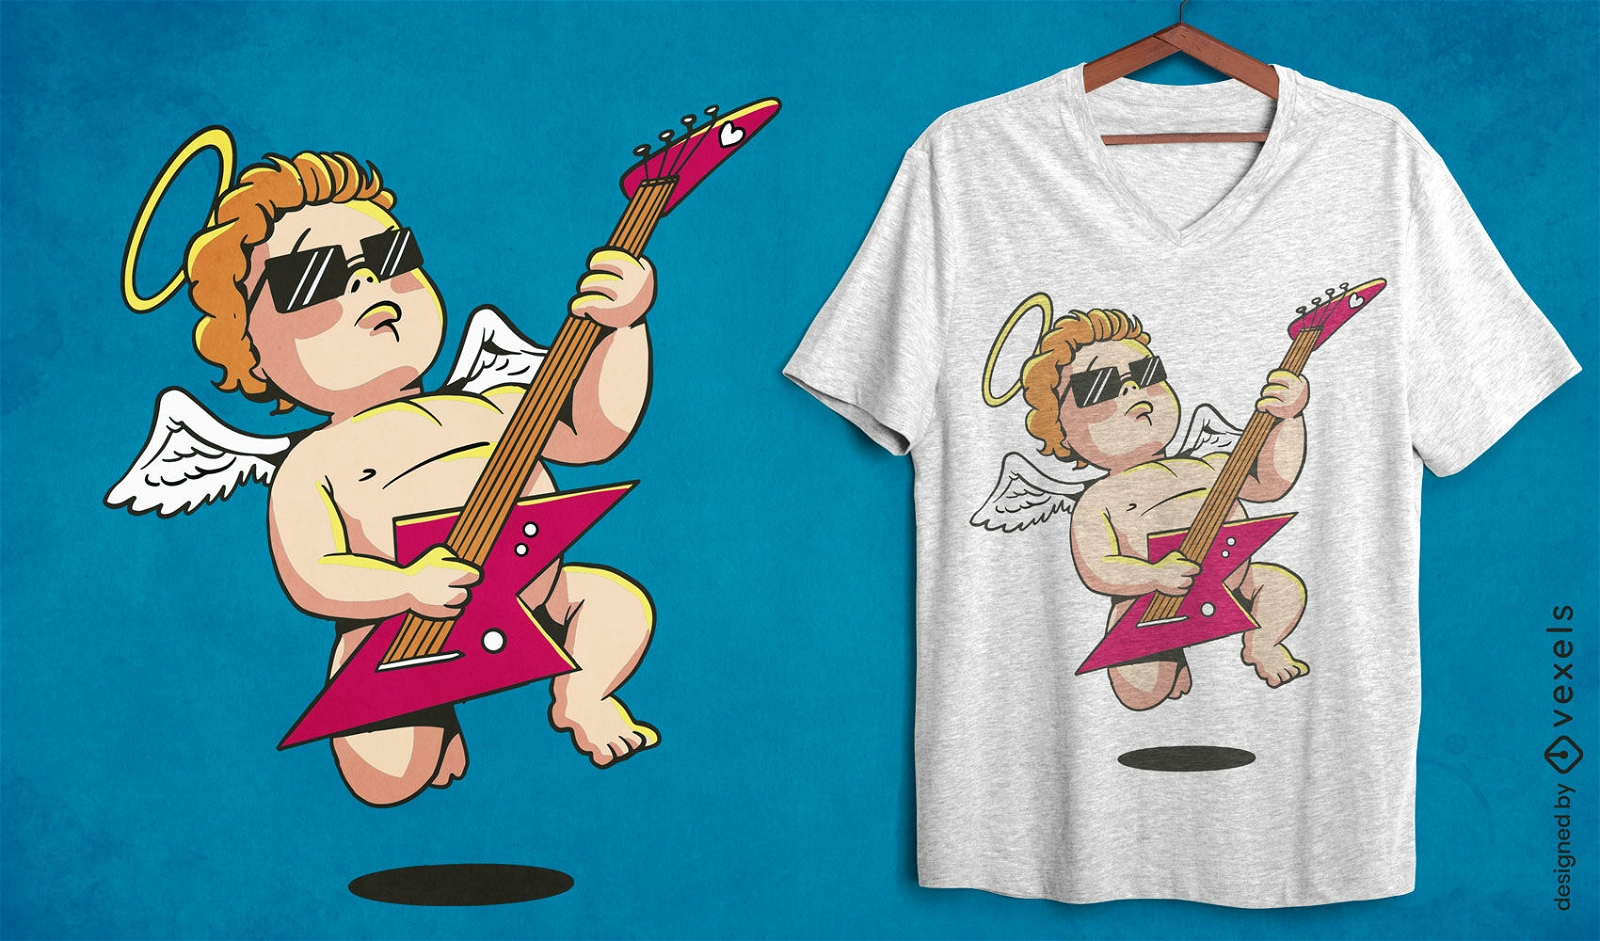
Rocking cupid t-shirt design
Choose a folder
All favorites
Create new
Save
Rocking cupid t-shirt design
Print ready
for Merch
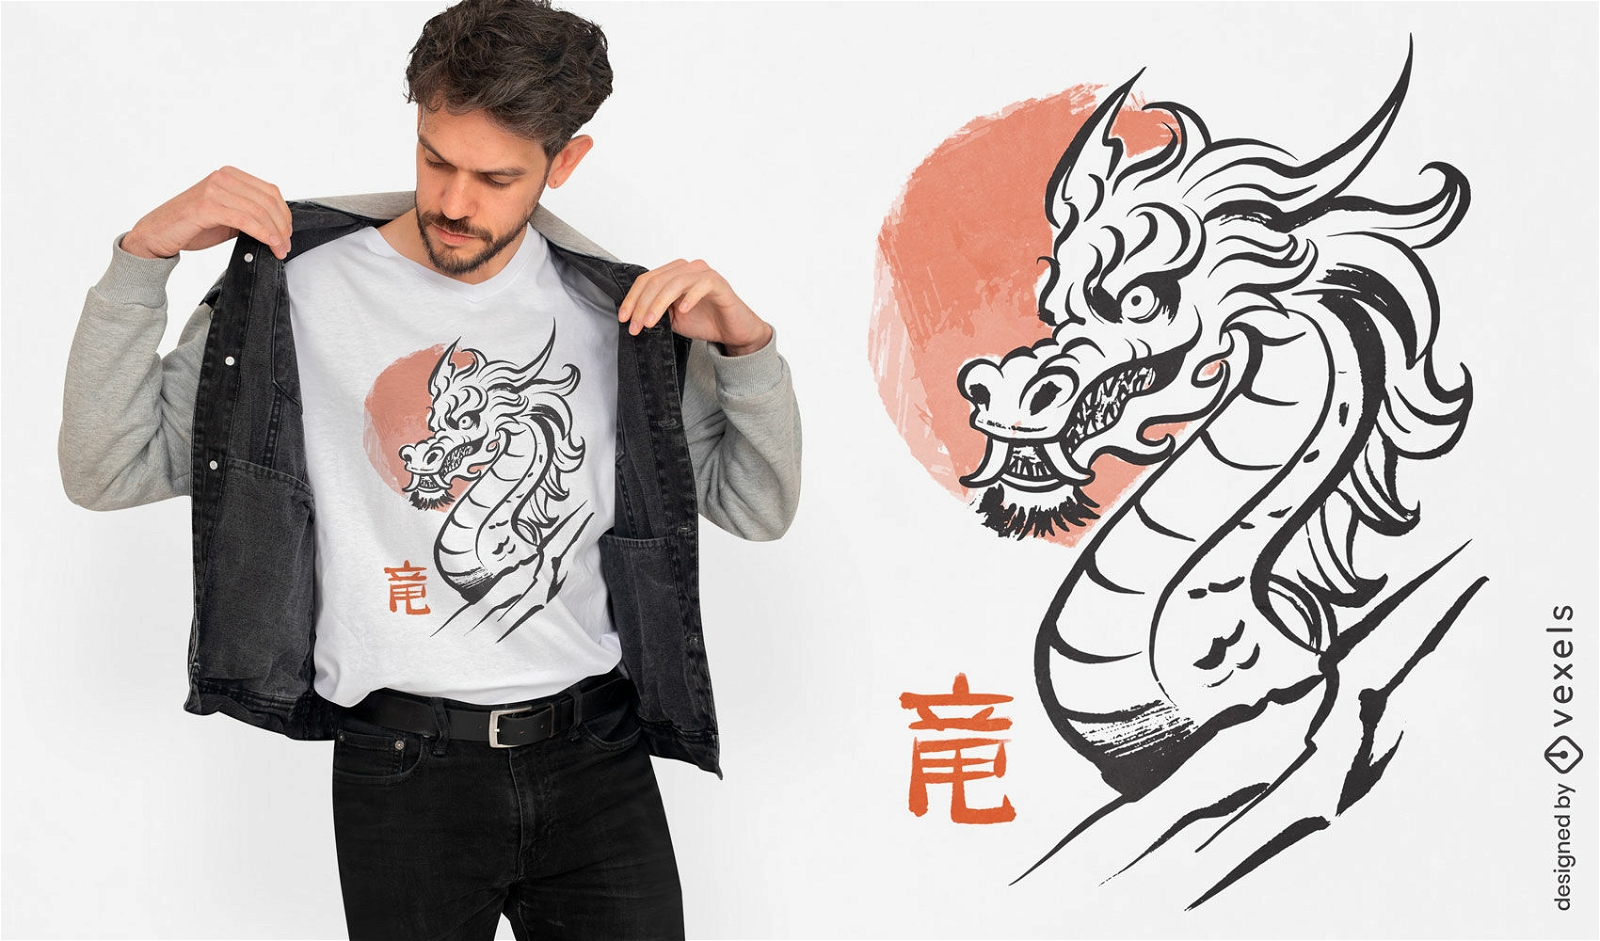
Dragon Year ink t-shirt design
Choose a folder
All favorites
Create new
Save
Dragon Year ink t-shirt design
Editable text
Print ready
for Merch
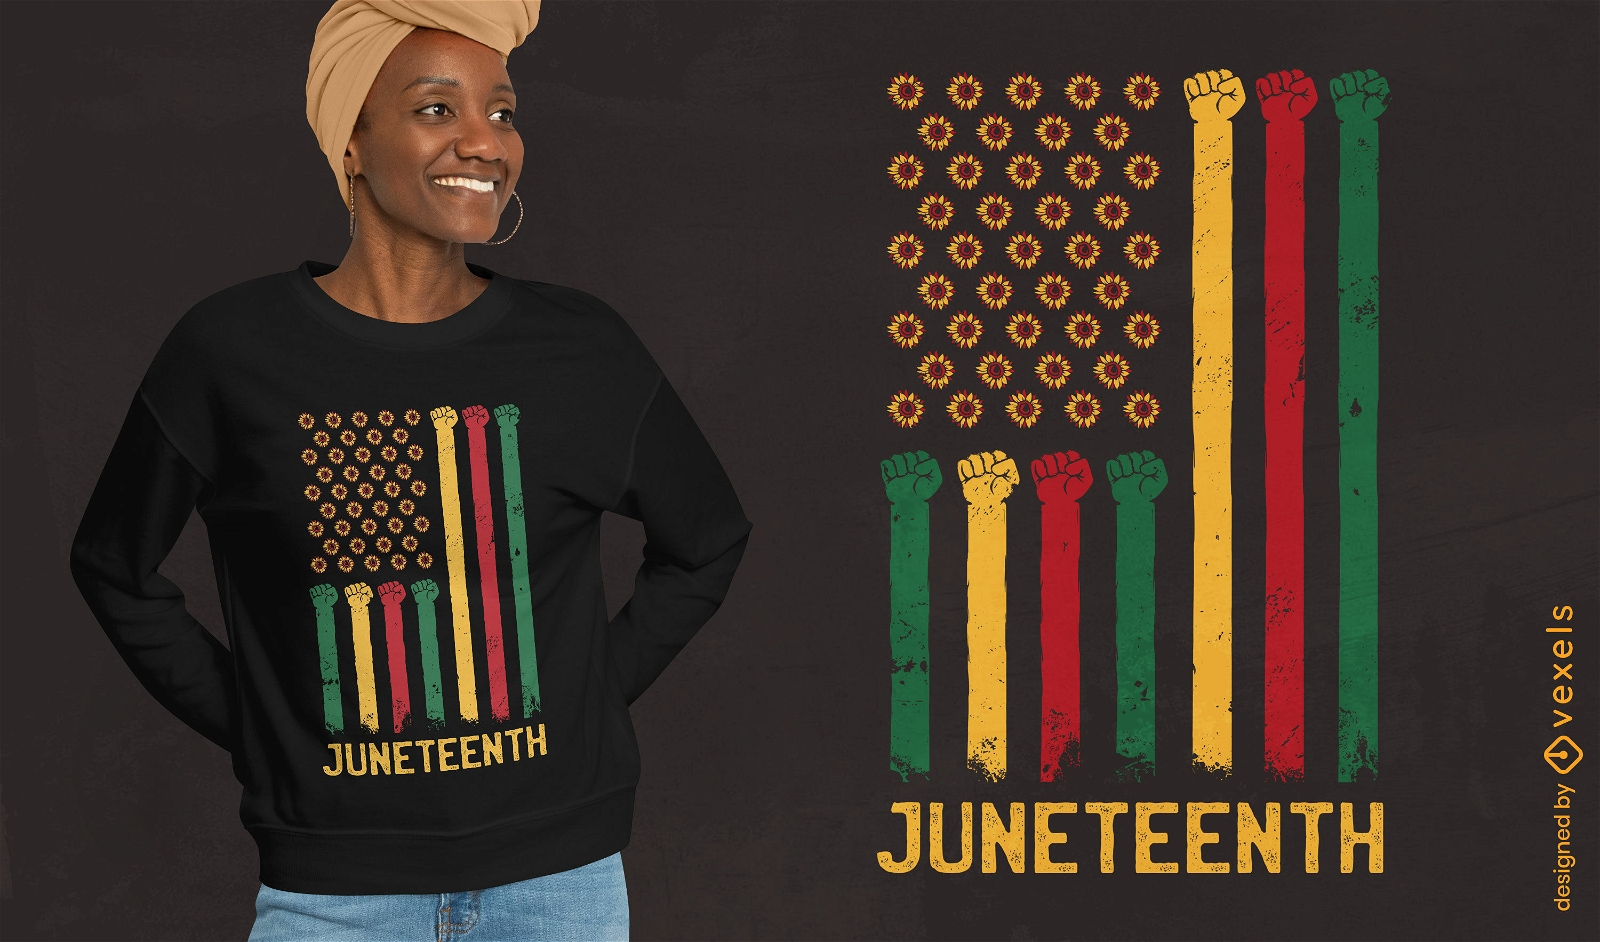
Juneteenth US flag t-shirt desgin
Choose a folder
All favorites
Create new
Save
Juneteenth US flag t-shirt desgin
Editable text
Print ready
for Merch
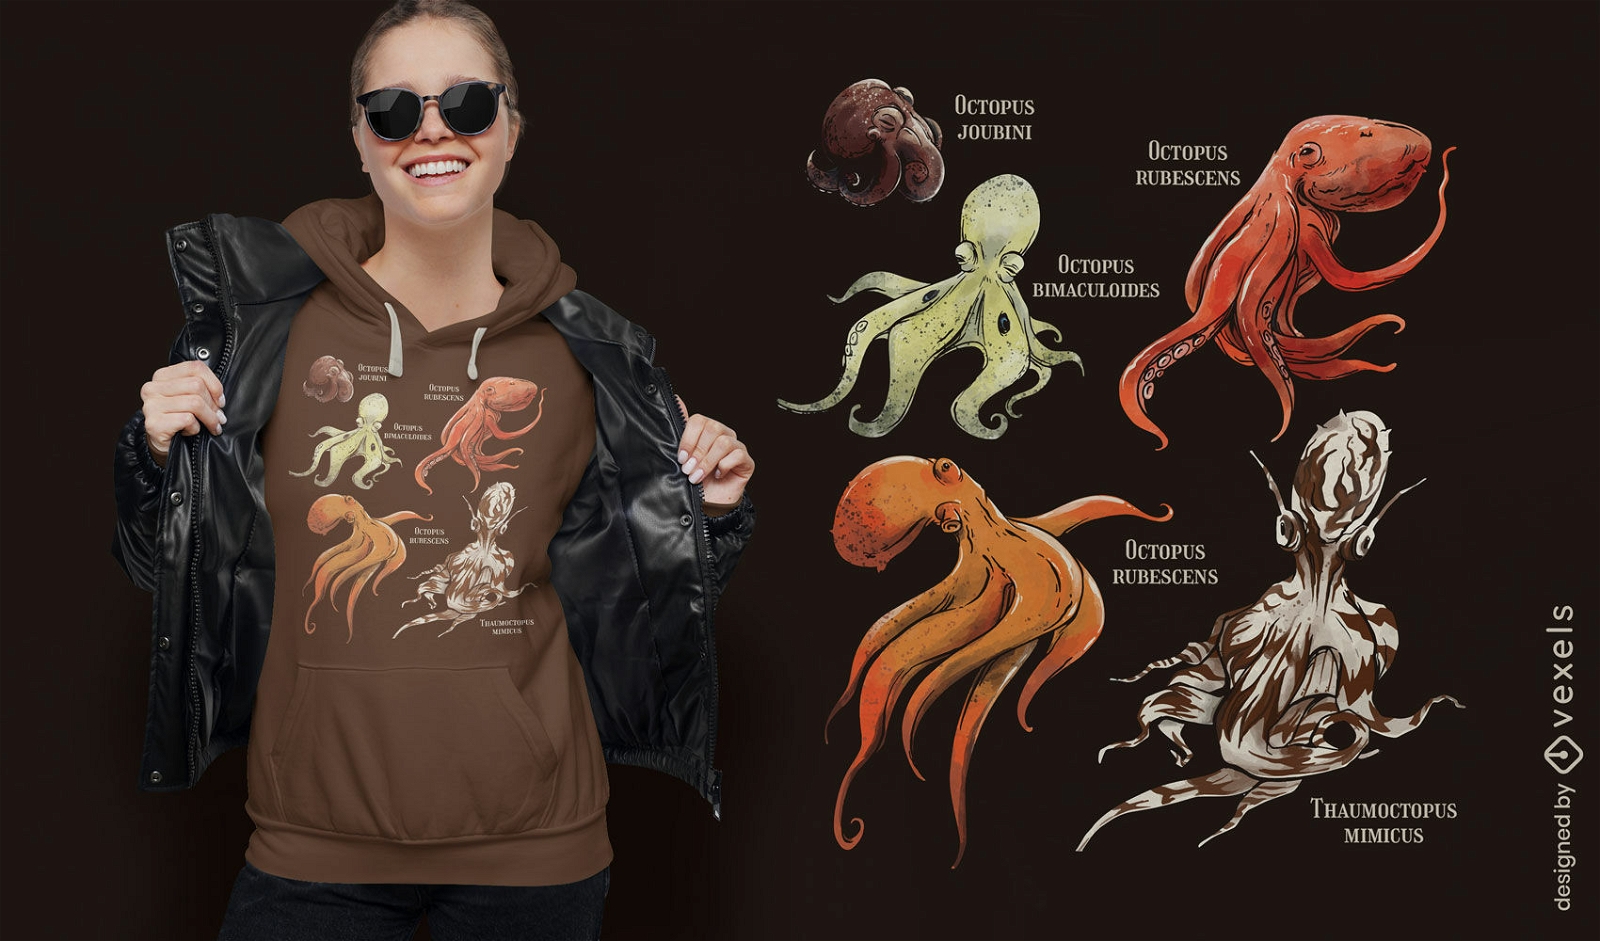
Octopus sea animals species t-shirt design
Choose a folder
All favorites
Create new
Save
Octopus sea animals species t-shirt design
Editable text
Print ready
for Merch
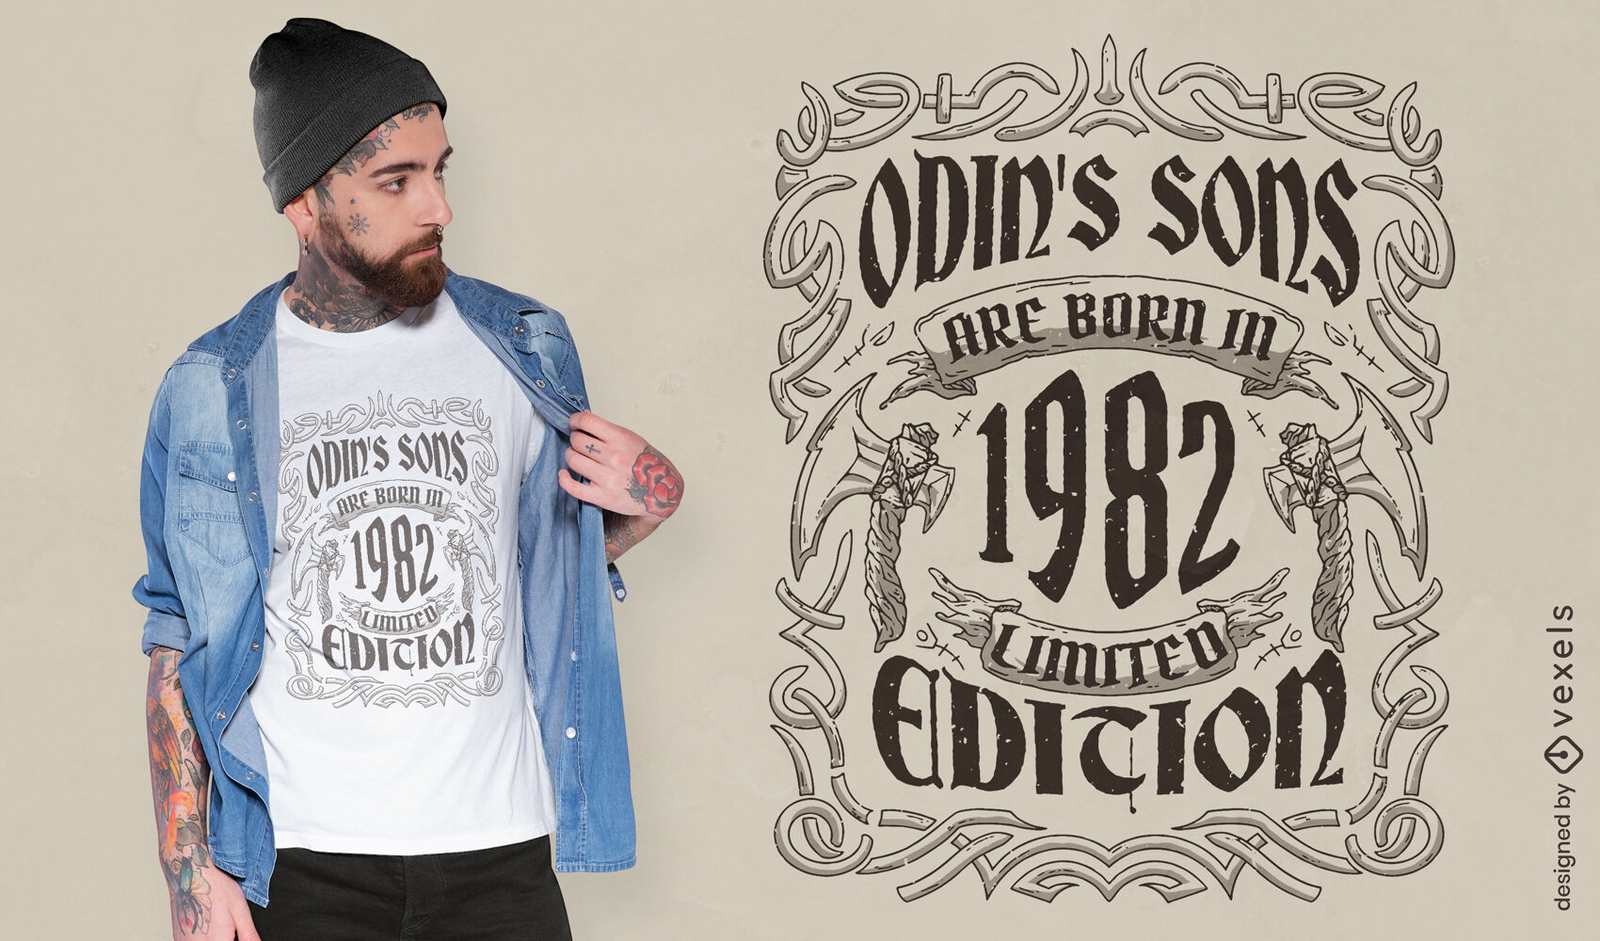
Odin's sons birthday vintage t-shirt design
Choose a folder
All favorites
Create new
Save
Odin's sons birthday vintage t-shirt design
Print ready
for Merch
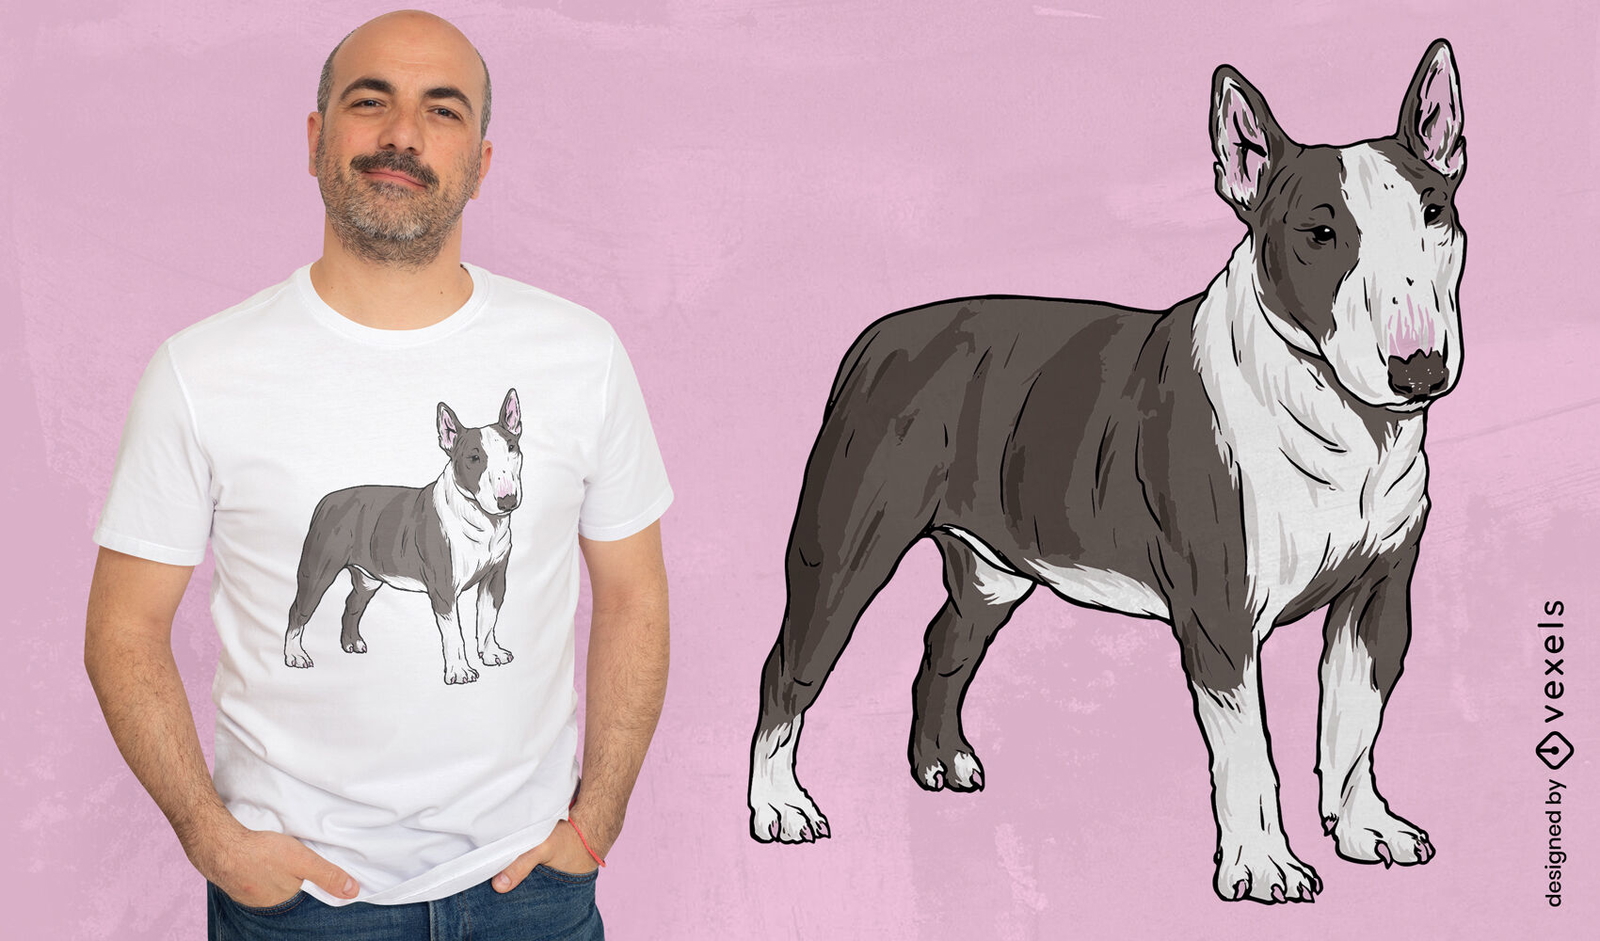
Pitbull dog animal realistic t-shirt design
Choose a folder
All favorites
Create new
Save
Pitbull dog animal realistic t-shirt design
Editable text
Print ready
for Merch
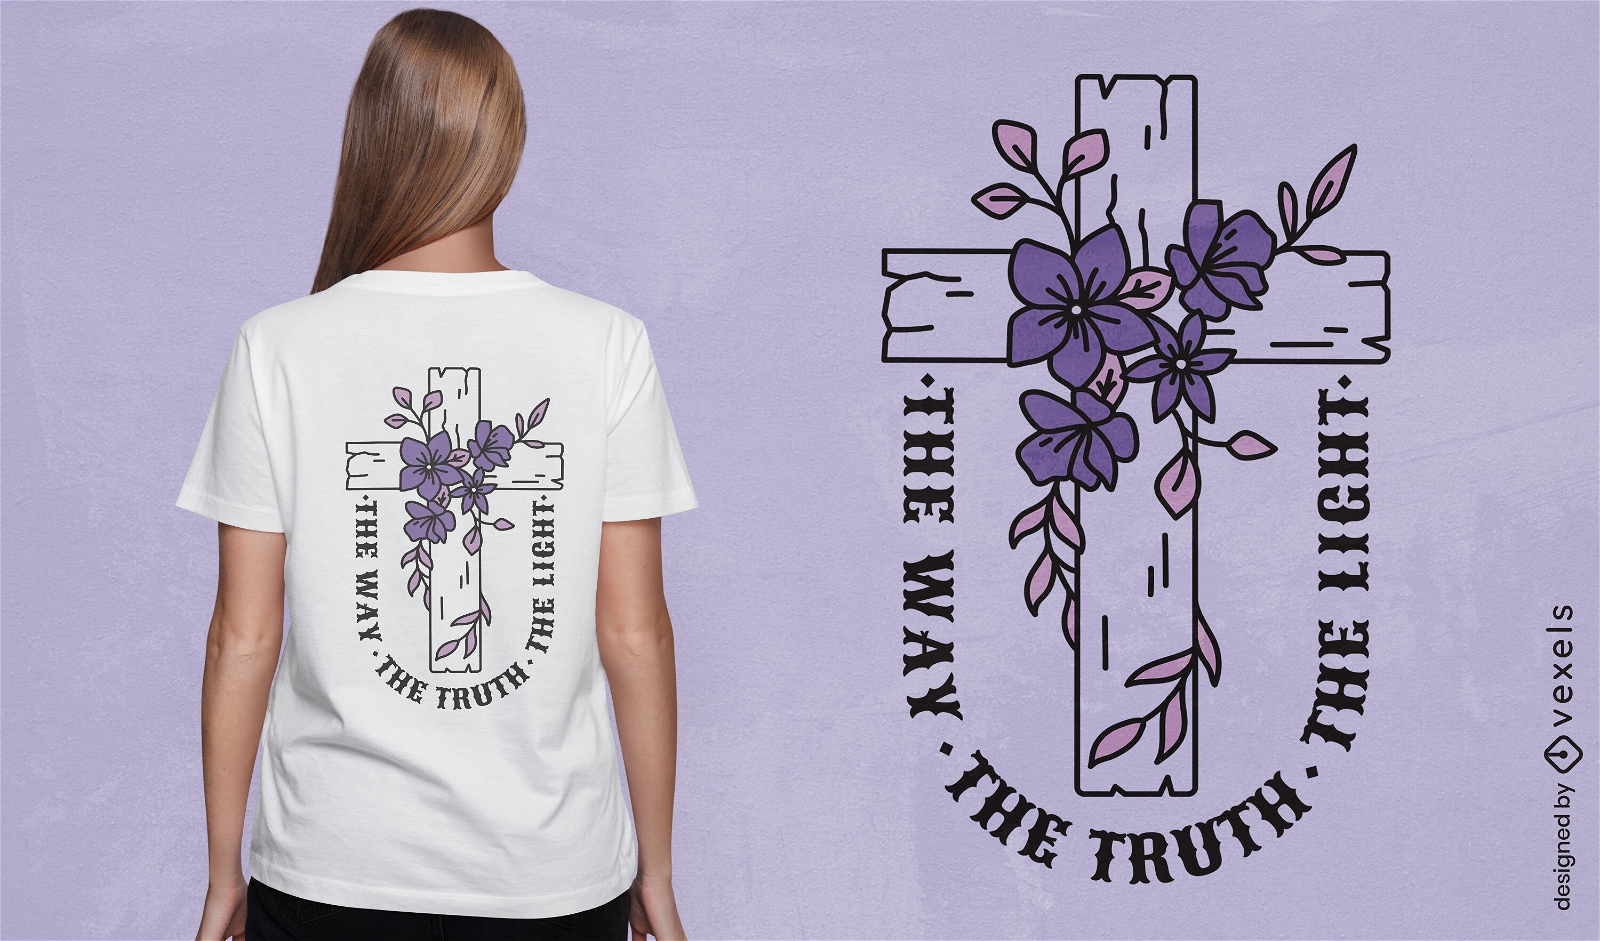
Floral faith cross t-shirt design
Choose a folder
All favorites
Create new
Save
Floral faith cross t-shirt design
Print ready
for Merch
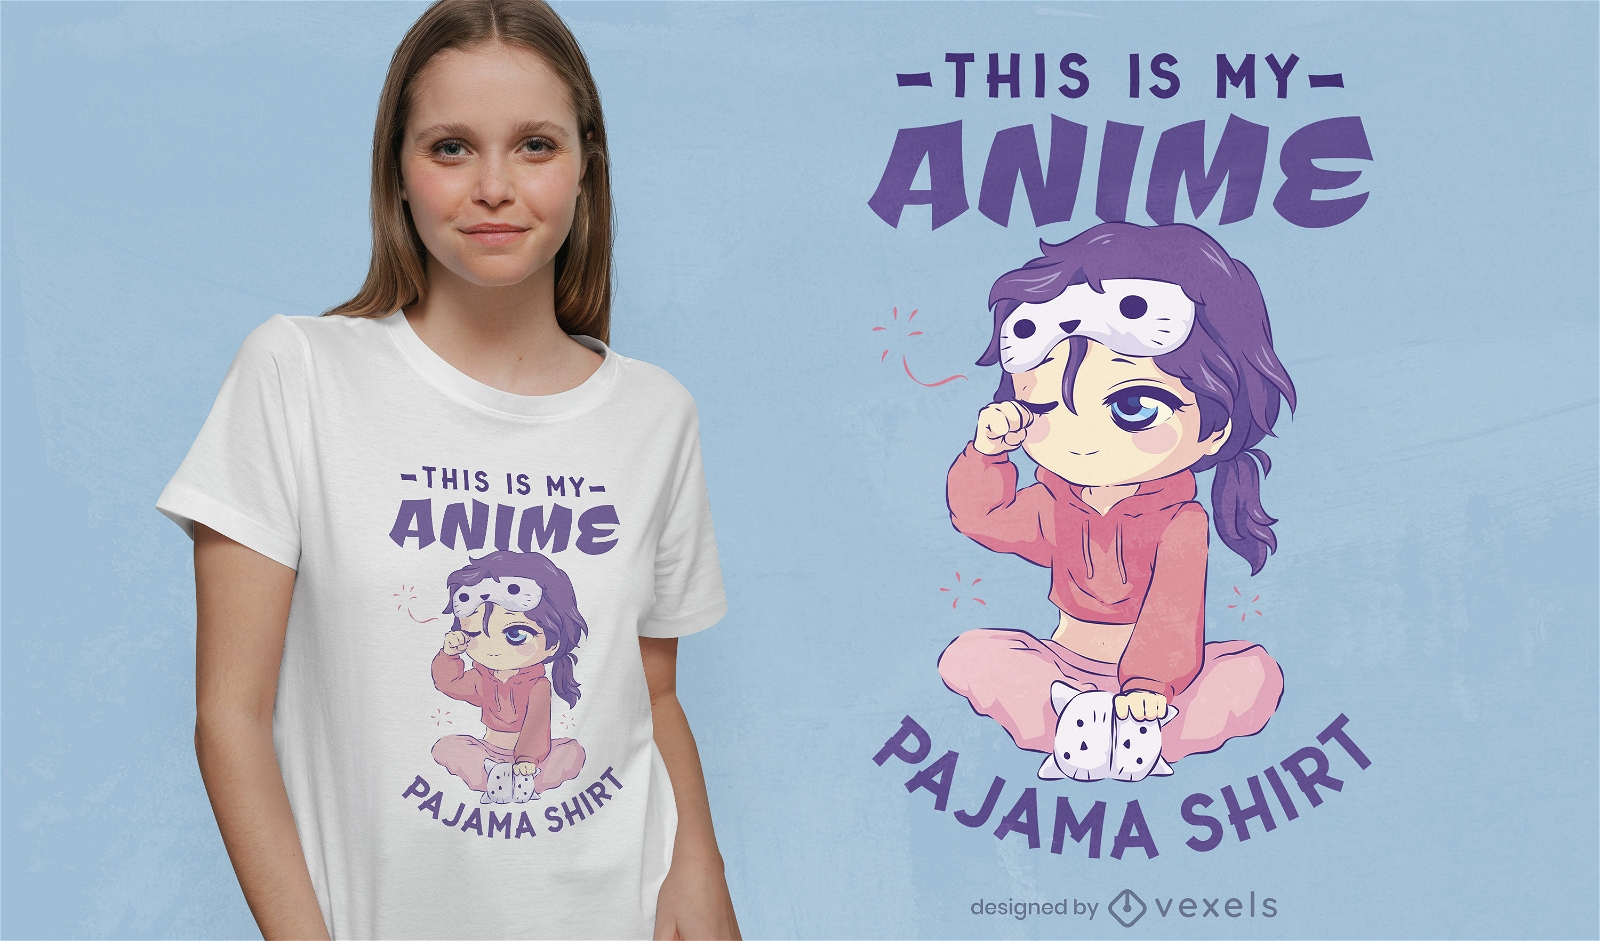
My anime pajama t-shirt design
Choose a folder
All favorites
Create new
Save
My anime pajama t-shirt design
Print ready
for Merch
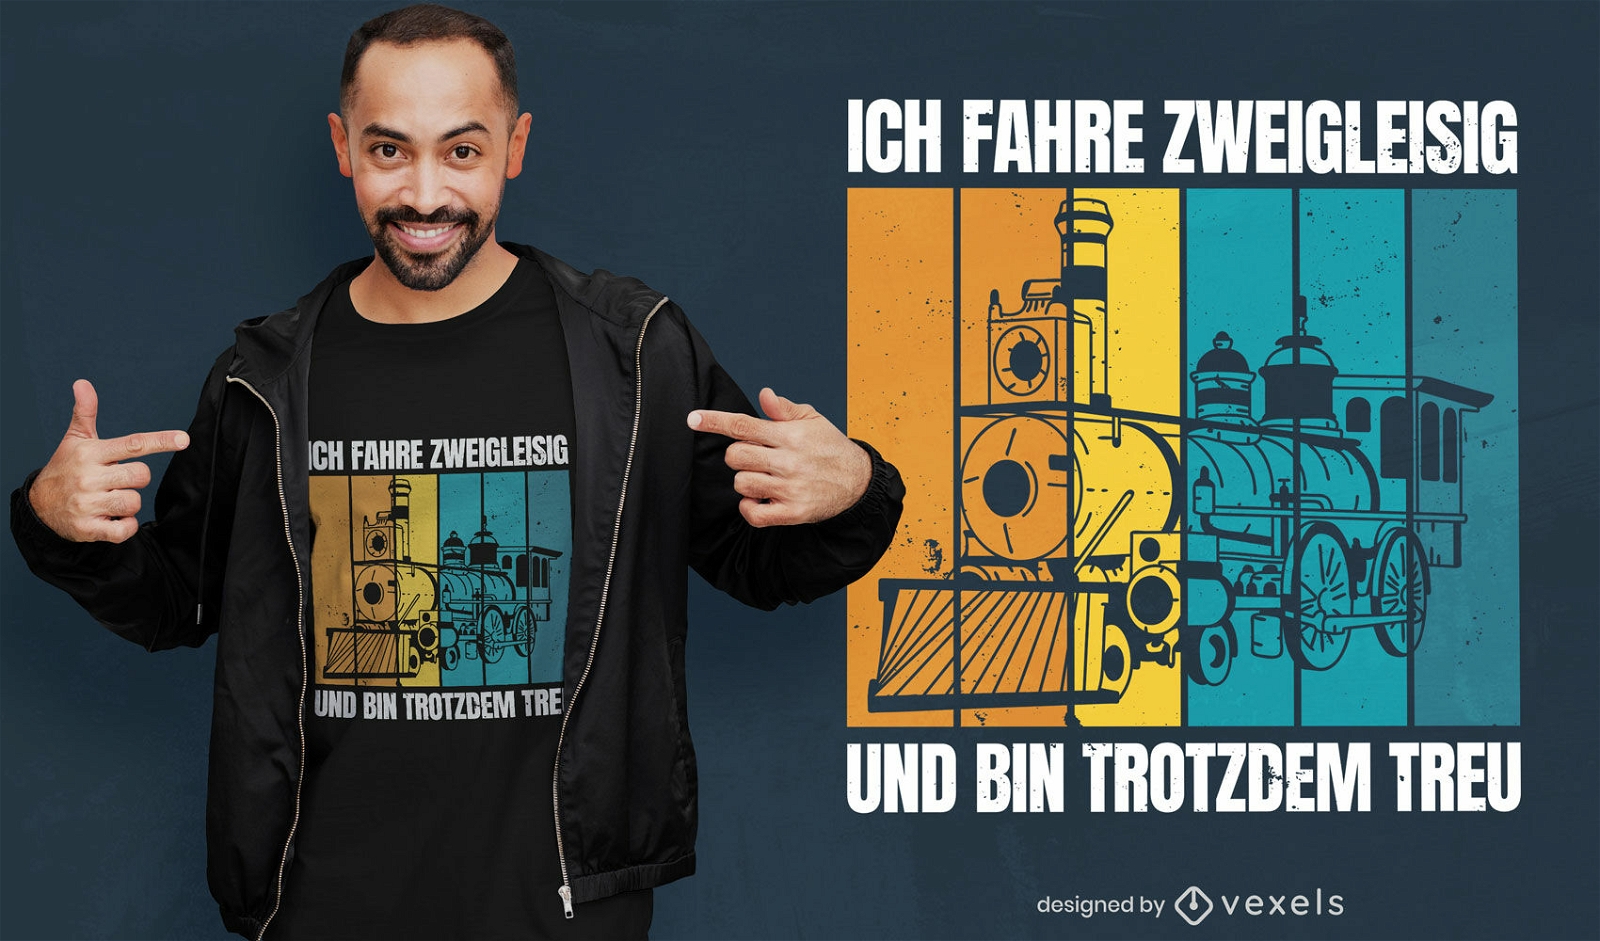
Locomotive german t-shirt design
Choose a folder
All favorites
Create new
Save
Locomotive german t-shirt design
Print ready
for Merch
Flaming darts t-shirt design
Choose a folder
All favorites
Create new
Save
Flaming darts t-shirt design
Editable text
Print ready
for Merch
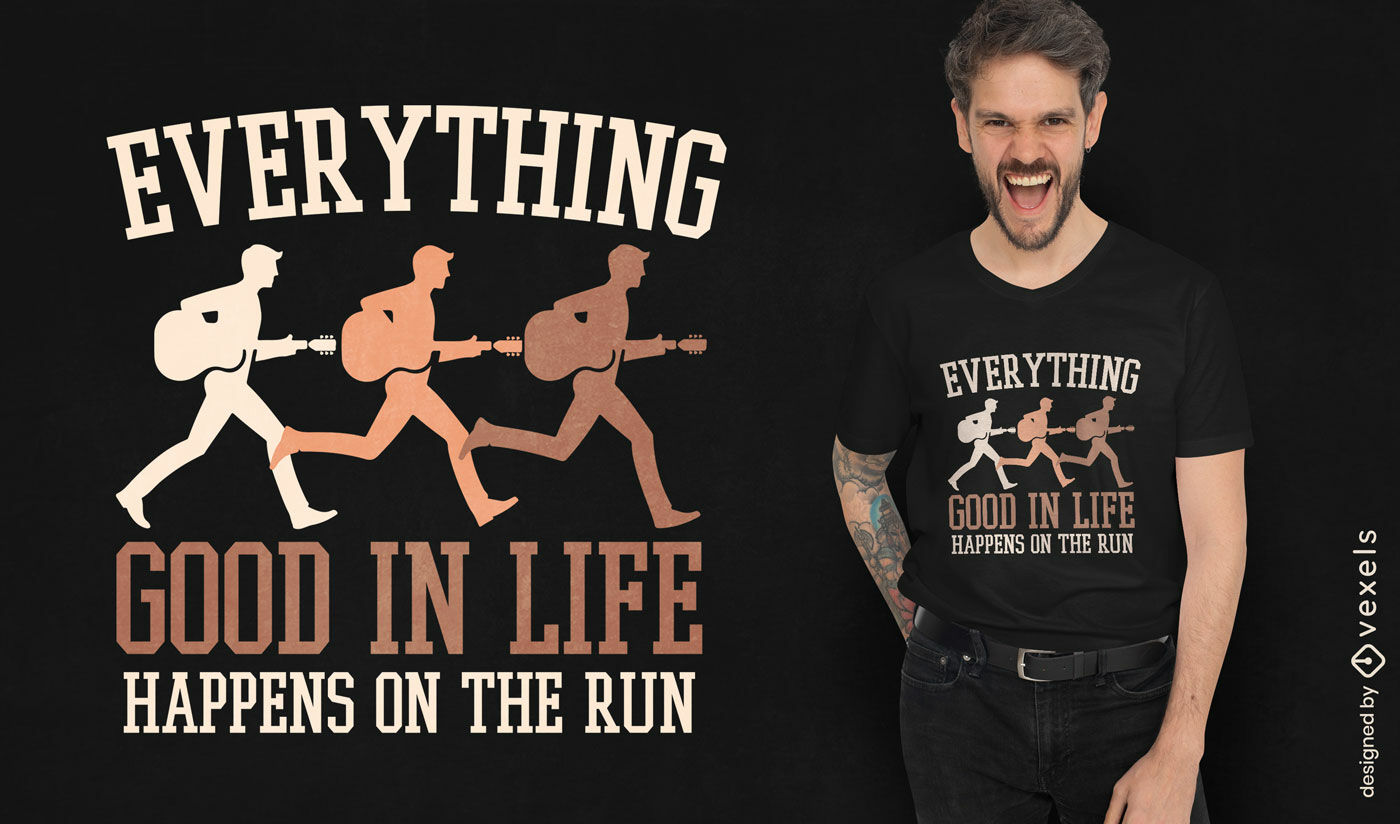
Runner motivation t-shirt design
Choose a folder
All favorites
Create new
Save
Runner motivation t-shirt design
Editable text
Print ready
for Merch
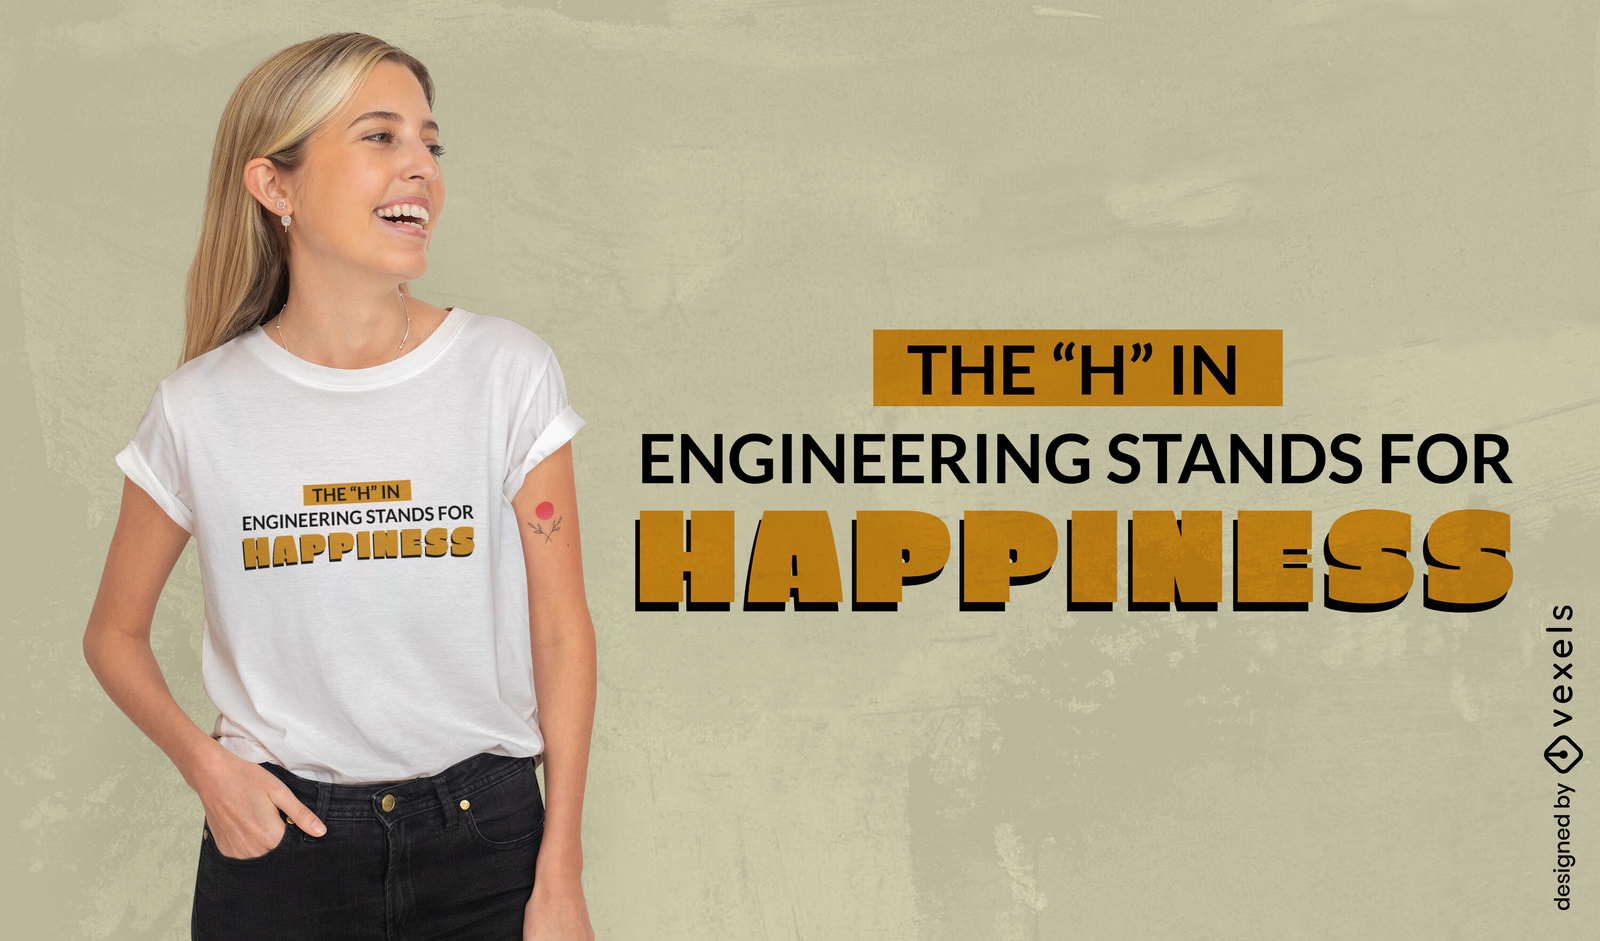
Engineering happiness quote t-shirt design
Choose a folder
All favorites
Create new
Save
Engineering happiness quote t-shirt design
Editable text
Print ready
for Merch
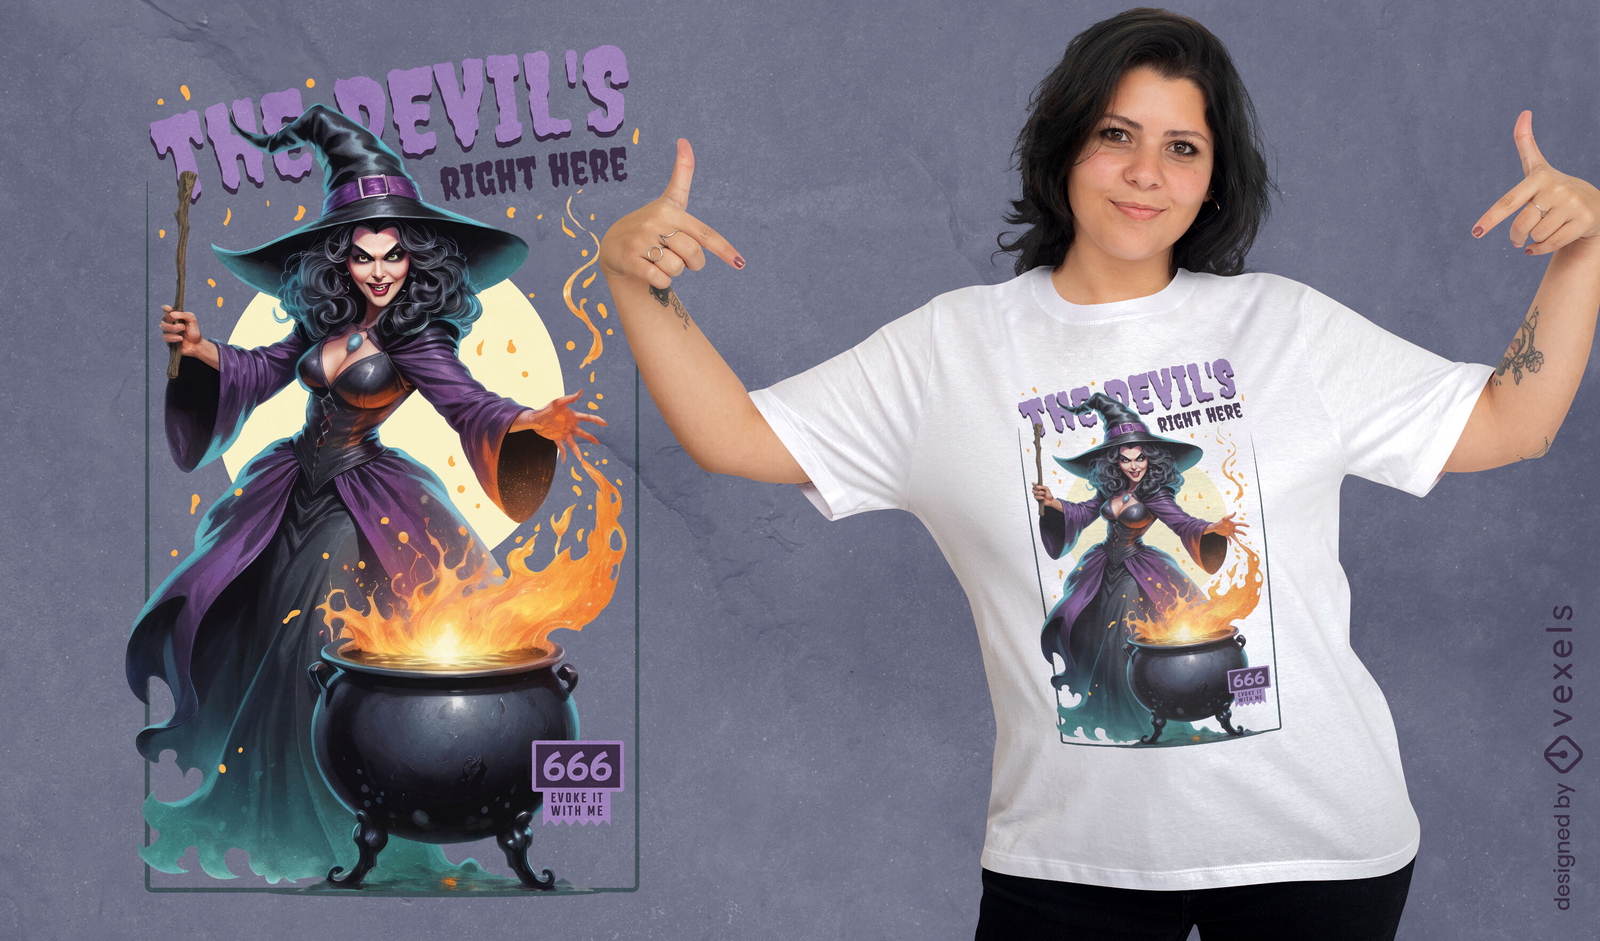
The Devil's right here t-shirt design
Choose a folder
All favorites
Create new
Save
The Devil's right here t-shirt design
Print ready
for Merch
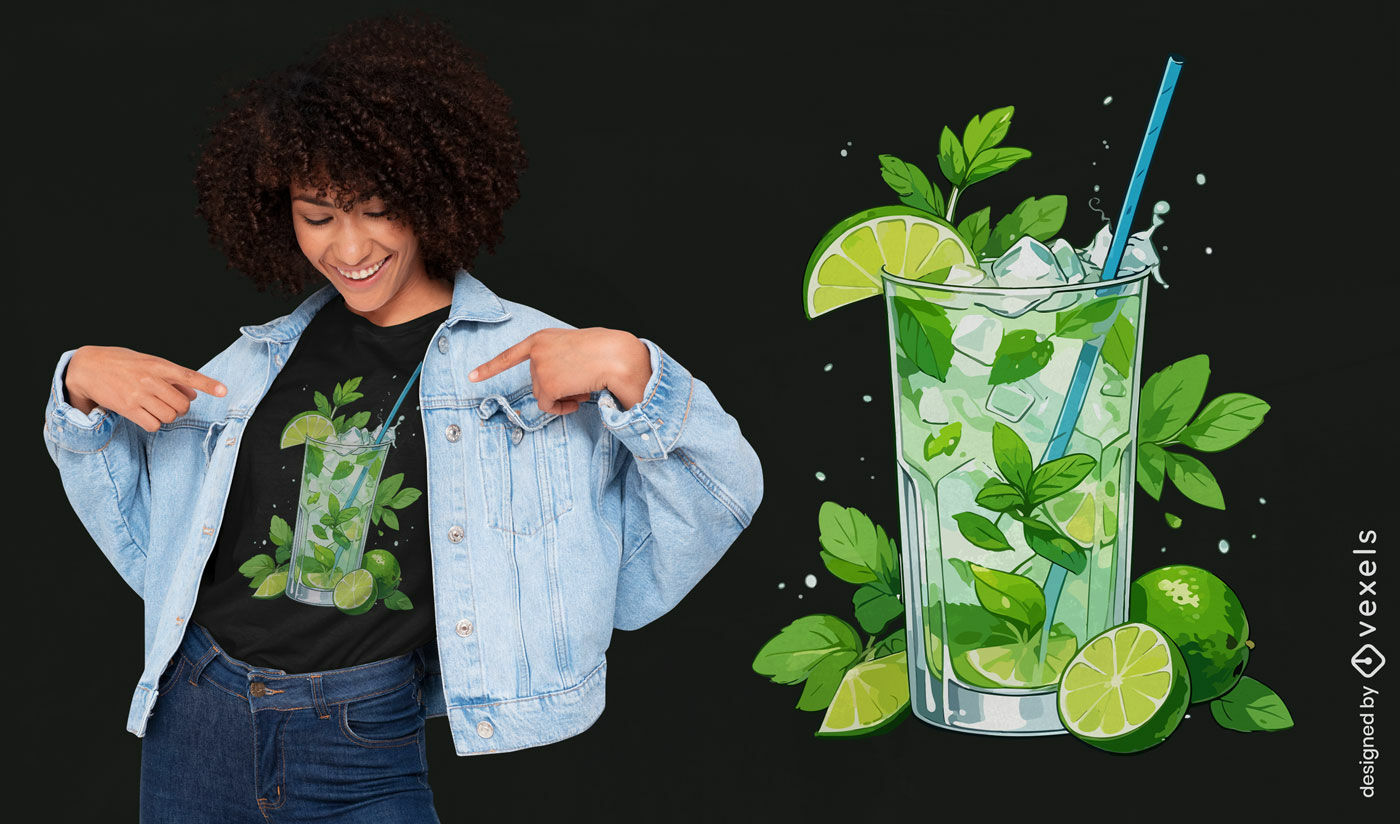
Tropical mojito t-shirt design
Choose a folder
All favorites
Create new
Save
Tropical mojito t-shirt design
Editable text
Print ready
for Merch
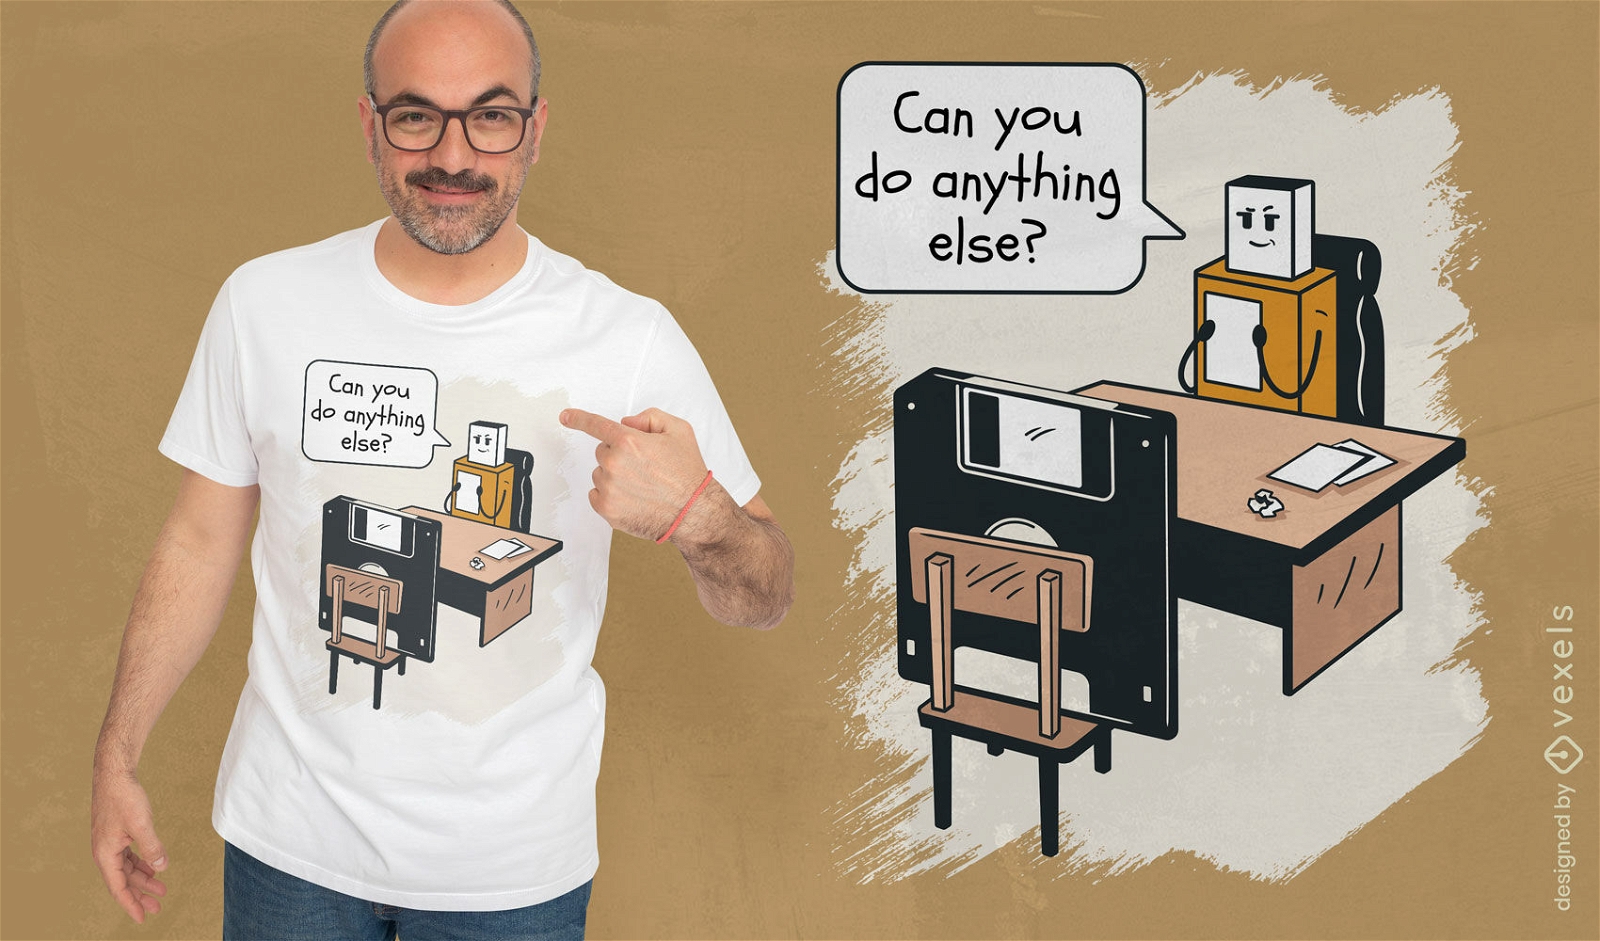
USB boss humorous t-shirt design
Choose a folder
All favorites
Create new
Save
USB boss humorous t-shirt design
Print ready
for Merch
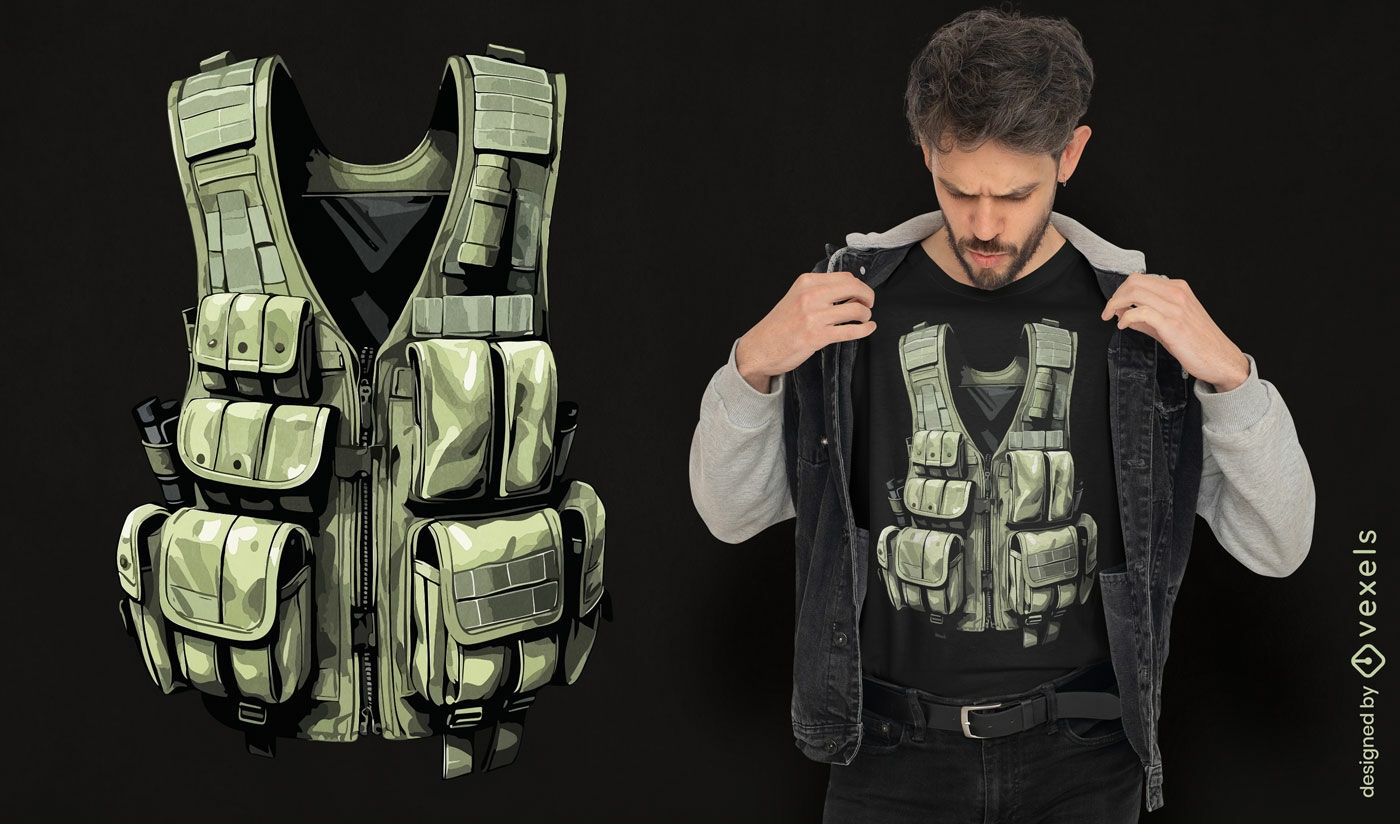
Tactical vest t-shirt design
Choose a folder
All favorites
Create new
Save
Tactical vest t-shirt design
Print ready
for Merch
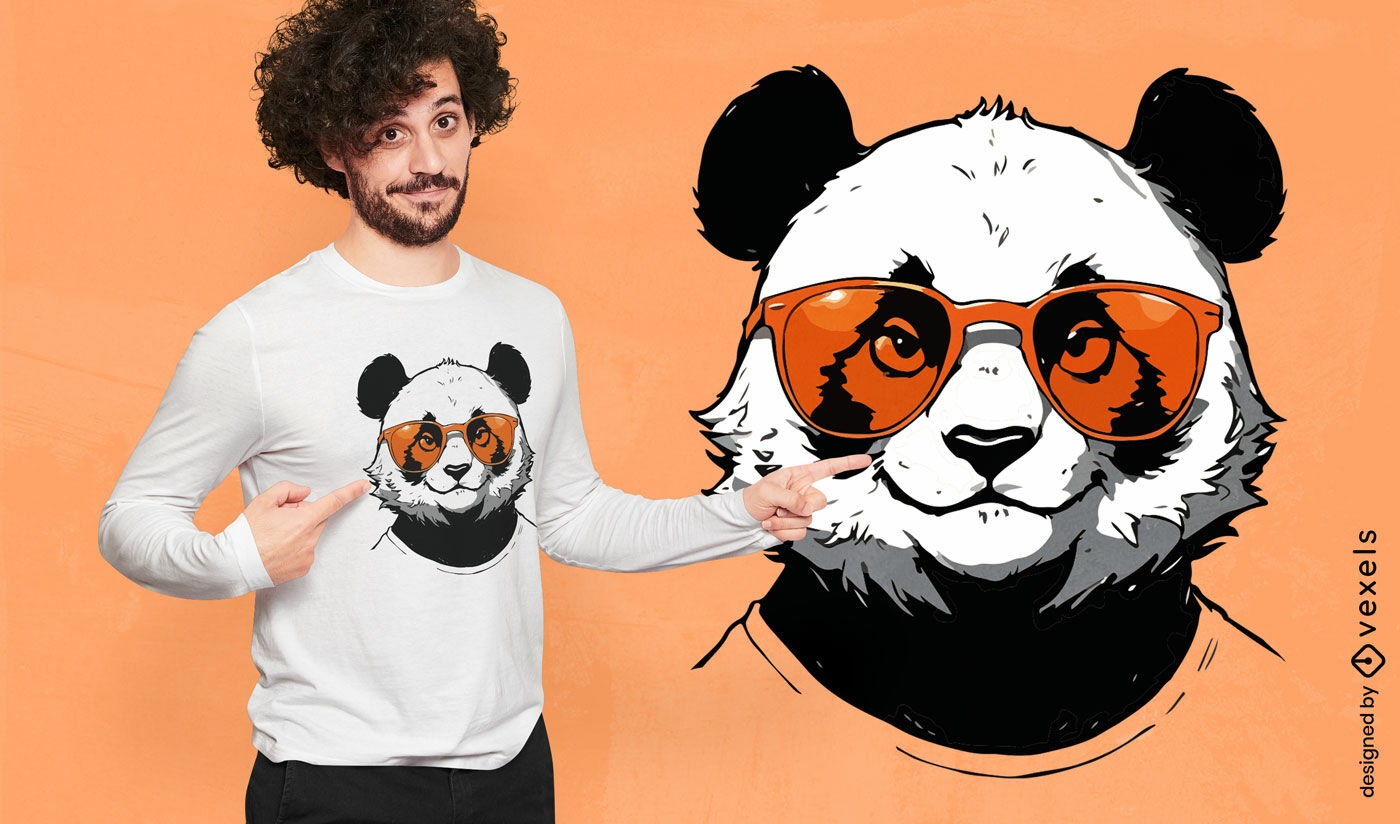
Panda with orange sunglasses t-shirt design
Choose a folder
All favorites
Create new
Save
Panda with orange sunglasses t-shirt design
Print ready
for Merch
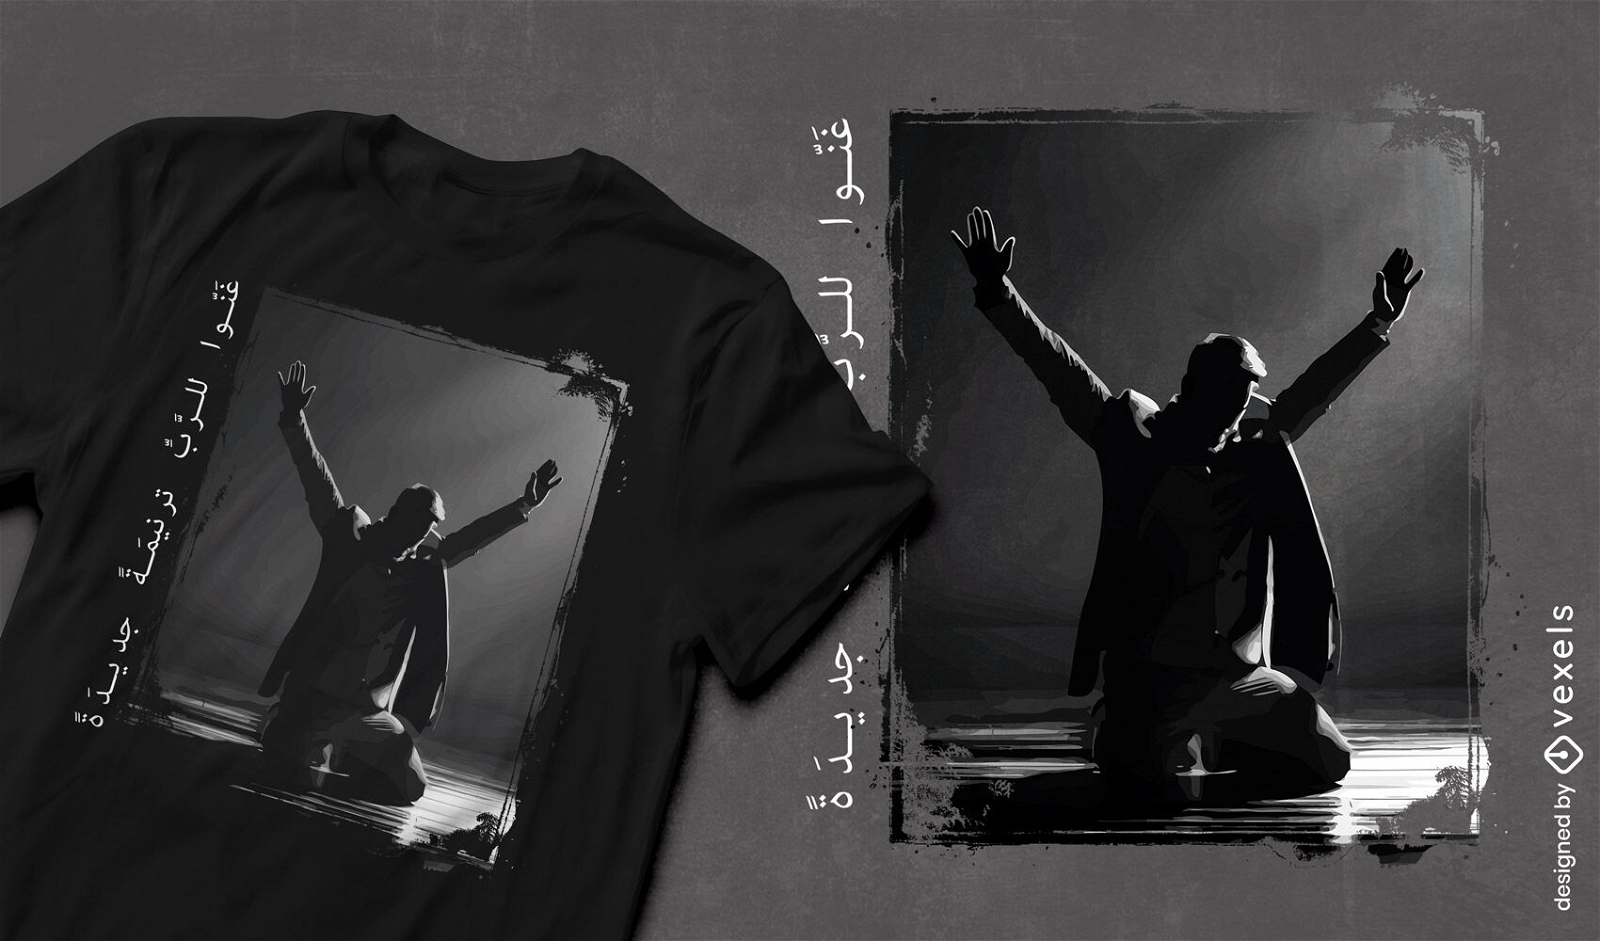
Worship man t-shirt design
Choose a folder
All favorites
Create new
Save
Worship man t-shirt design
Editable text
Print ready
for Merch
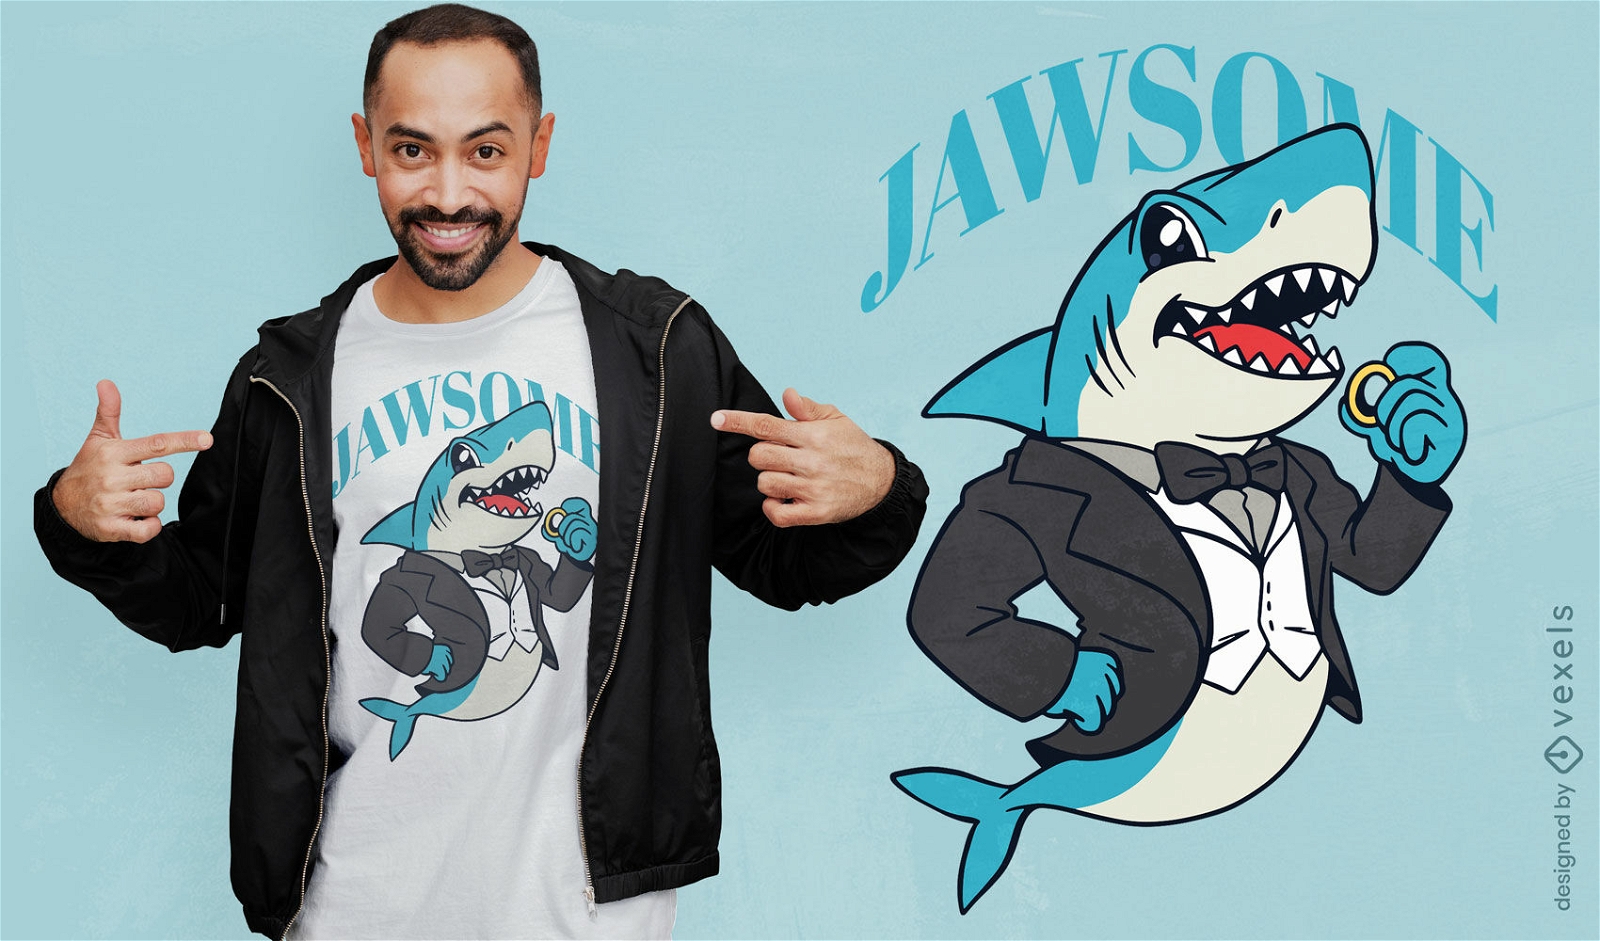
Shark wedding pun t-shirt design
Choose a folder
All favorites
Create new
Save
Shark wedding pun t-shirt design
Editable text
Print ready
for Merch
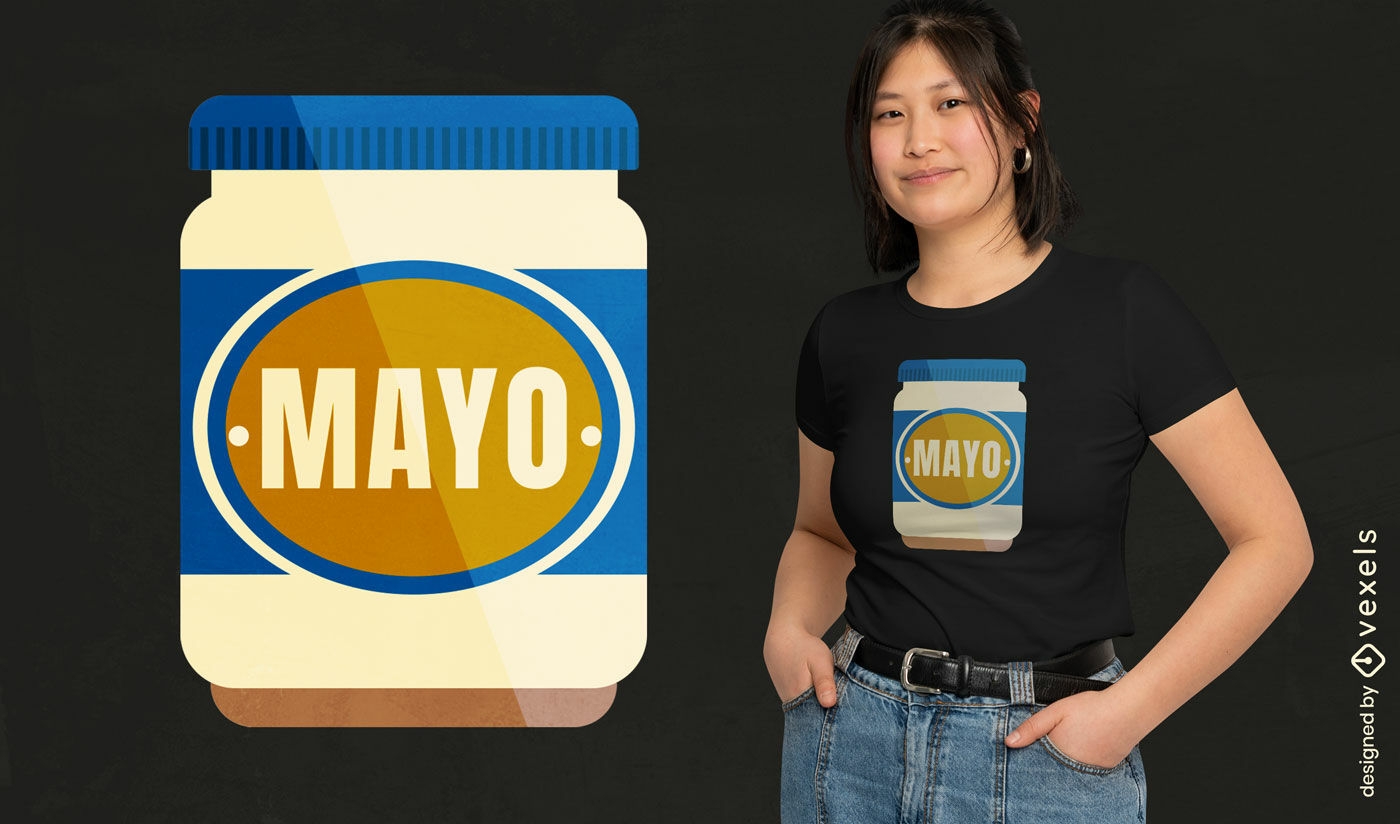
Mayo jar t-shirt design
Choose a folder
All favorites
Create new
Save
Mayo jar t-shirt design
Print ready
for Merch
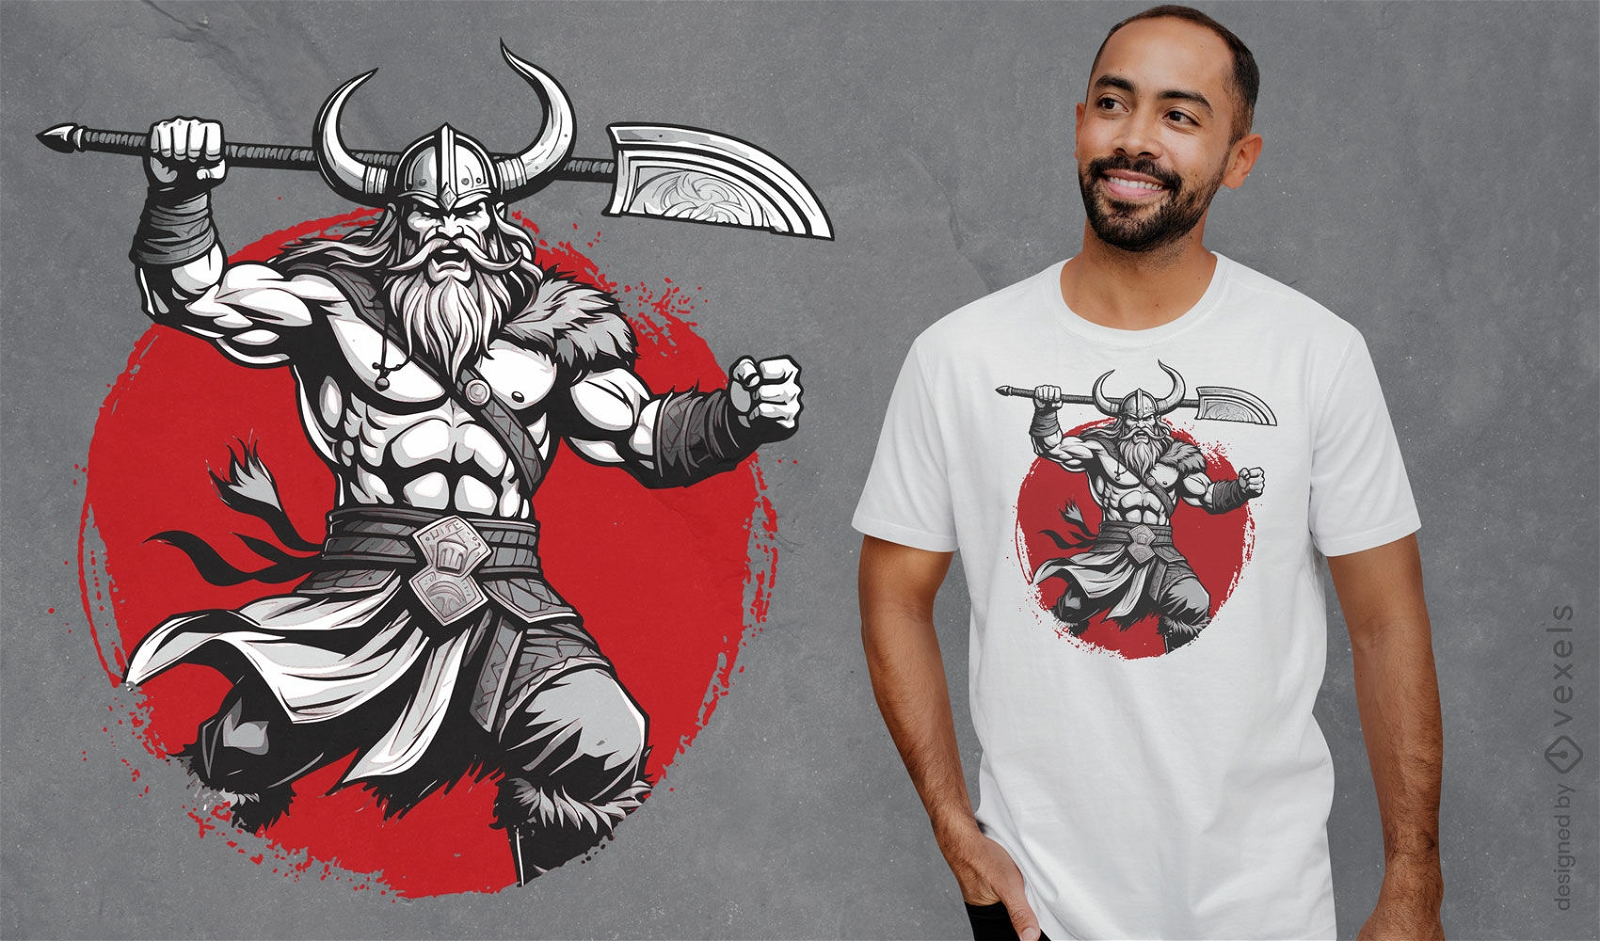
Viking warrior with red backdrop t-shirt design
Choose a folder
All favorites
Create new
Save
Viking warrior with red backdrop t-shirt design
Editable text
Print ready
for Merch
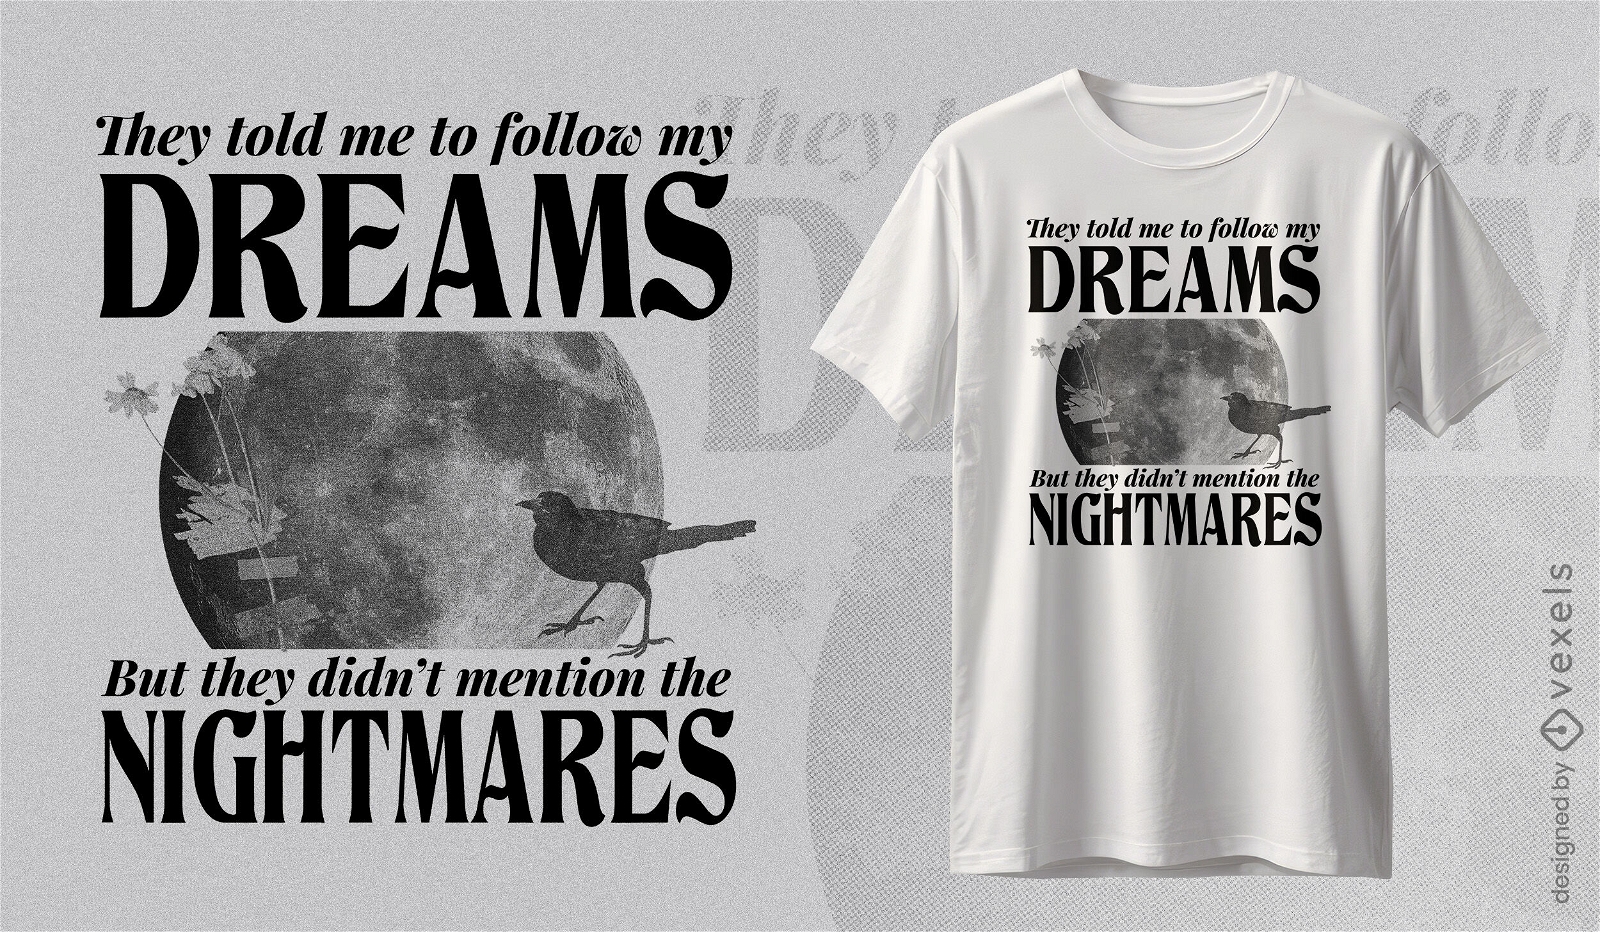
Dreams and nightmares bird t-shirt design
Choose a folder
All favorites
Create new
Save
Dreams and nightmares bird t-shirt design
Print ready
for Merch
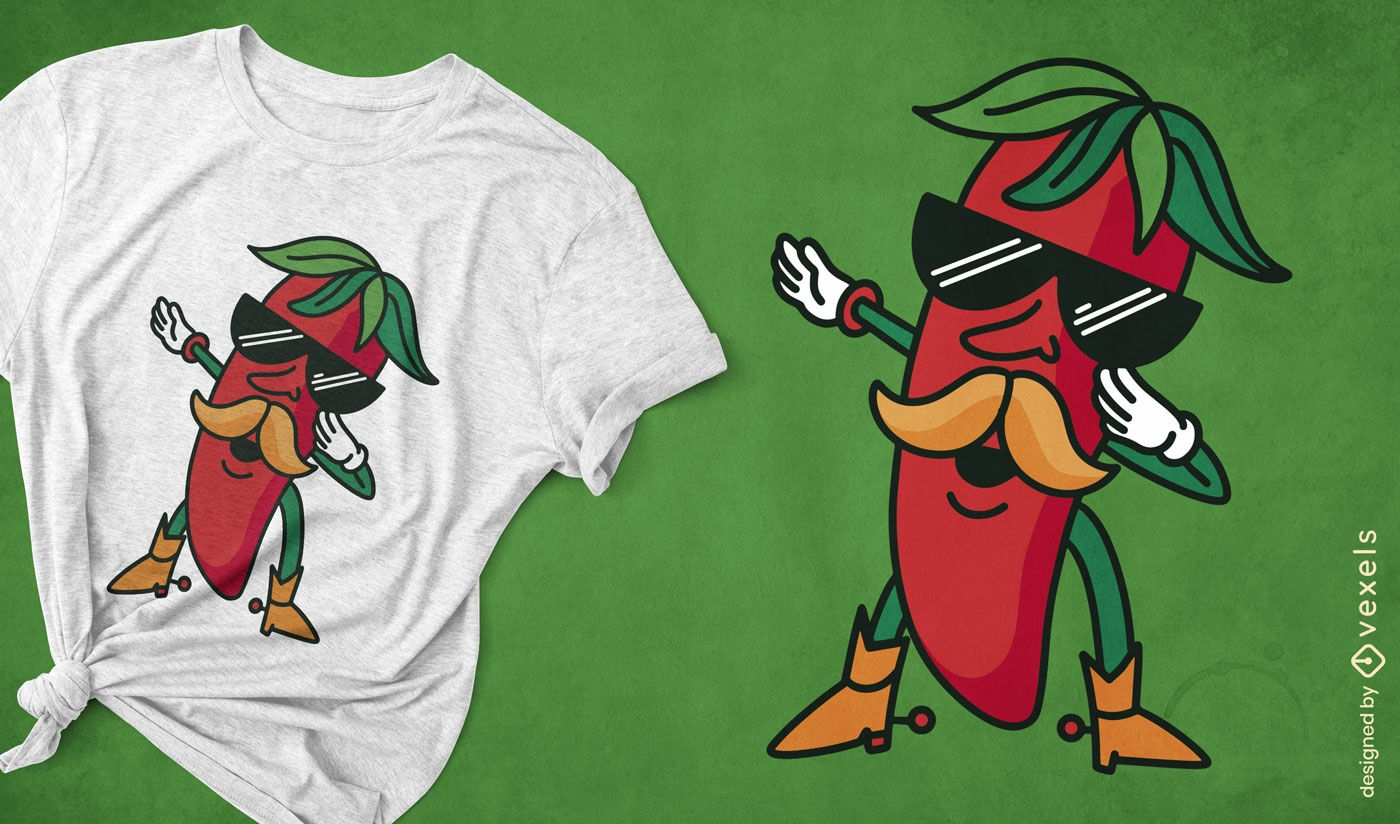
Spicy chili character t-shirt design
Choose a folder
All favorites
Create new
Save
Spicy chili character t-shirt design
Print ready
for Merch
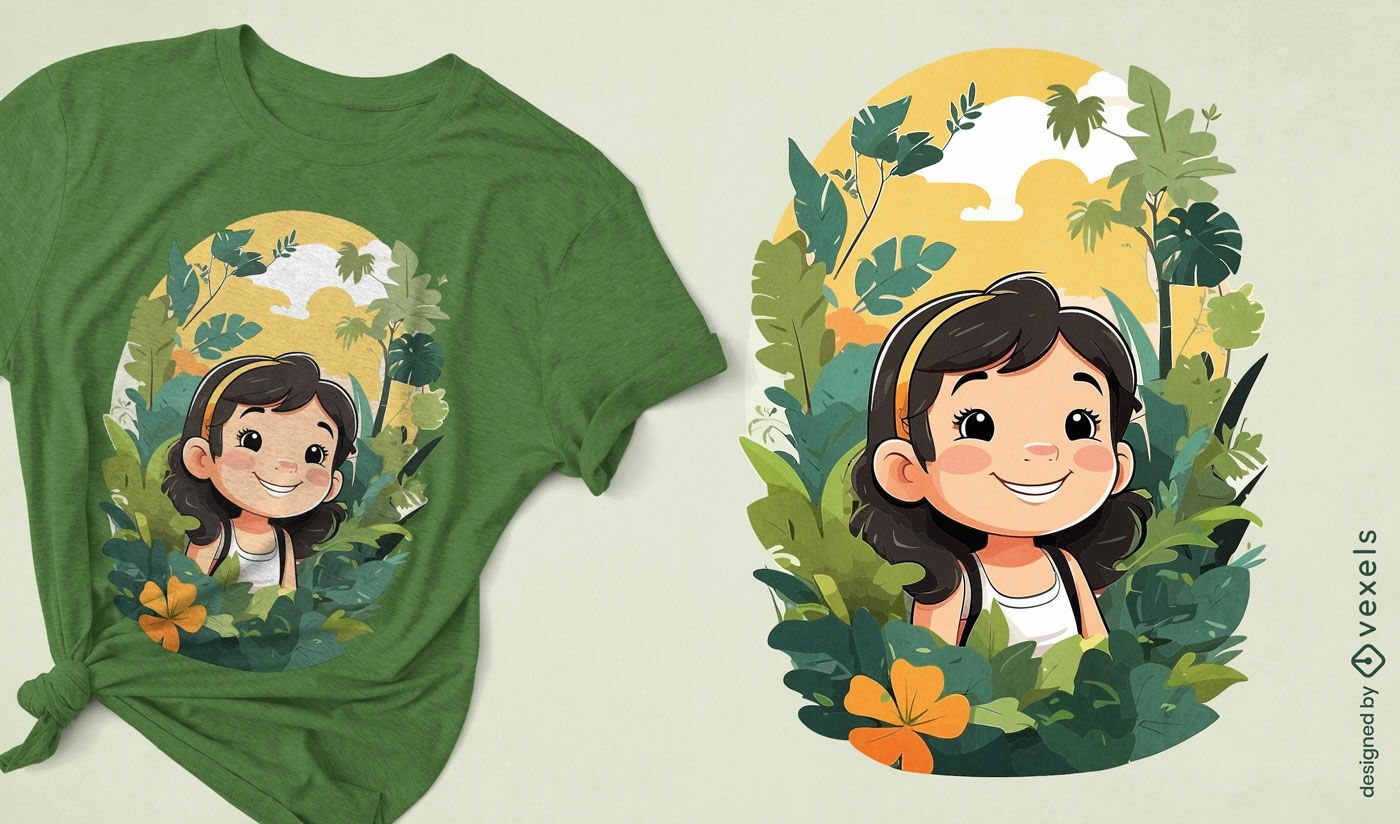
Jungle adventure kids t-shirt design
Choose a folder
All favorites
Create new
Save
Jungle adventure kids t-shirt design
Print ready
for Merch
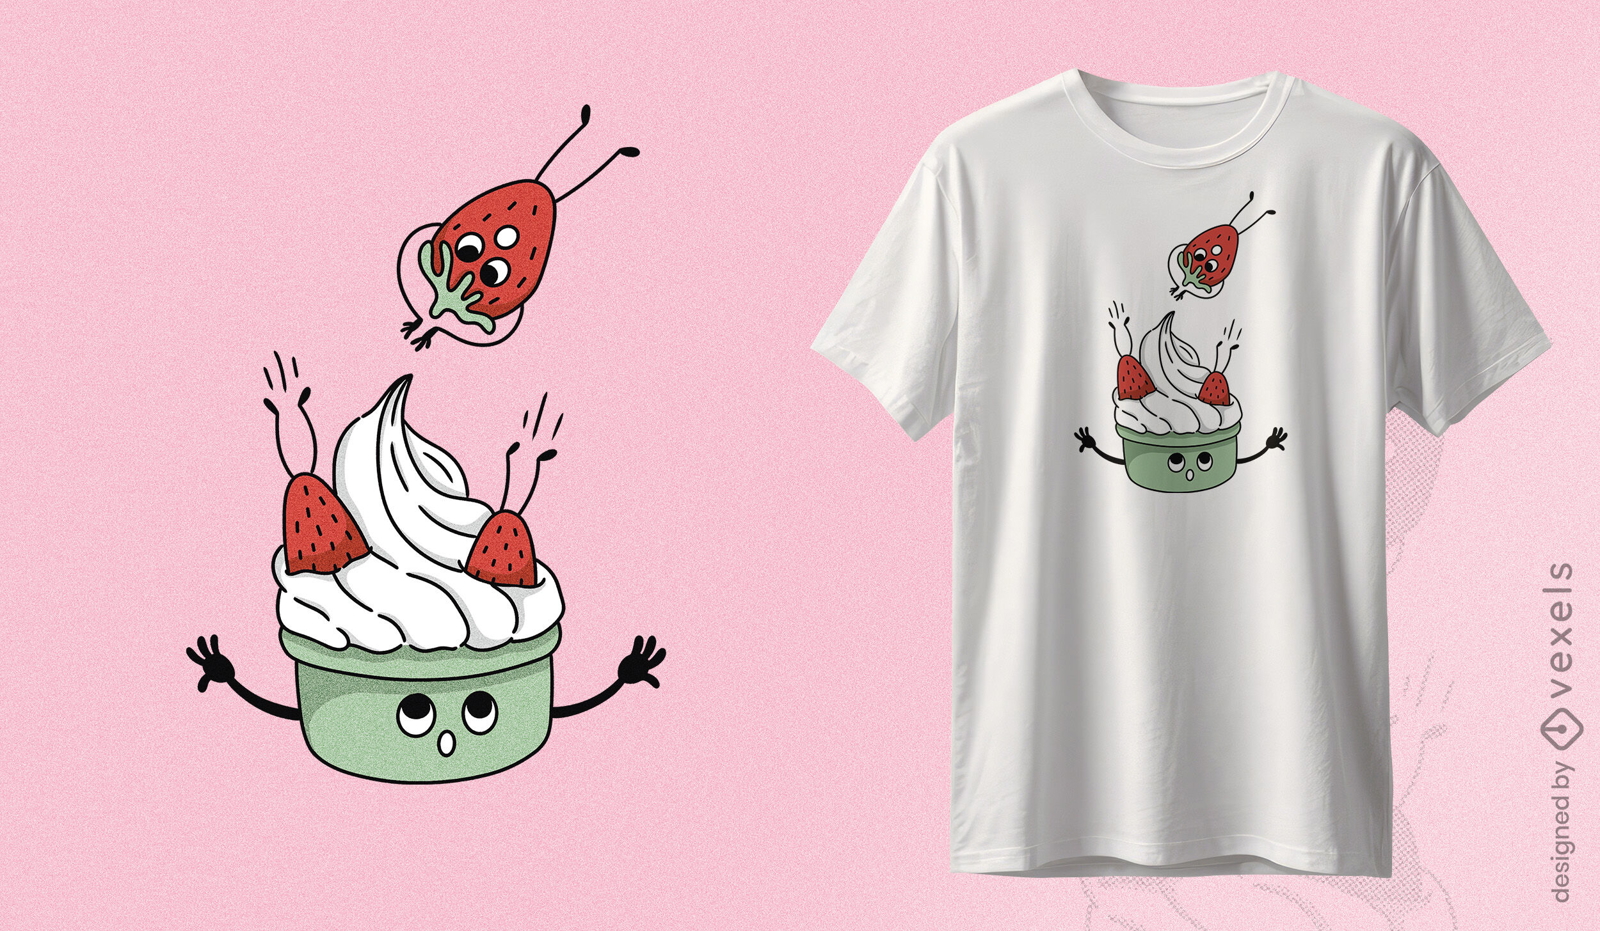
Playful strawberries and cream t-shirt design Whimsical t-shirt design featuring joyful strawberries jumping to a bowl of cream with playful facial expressions.
Choose a folder
All favorites
Create new
Save
Playful strawberries and cream t-shirt design Whimsical t-shirt design featuring joyful strawberries jumping to a bowl of cream with playful facial expressions.
Editable text
Print ready
for Merch
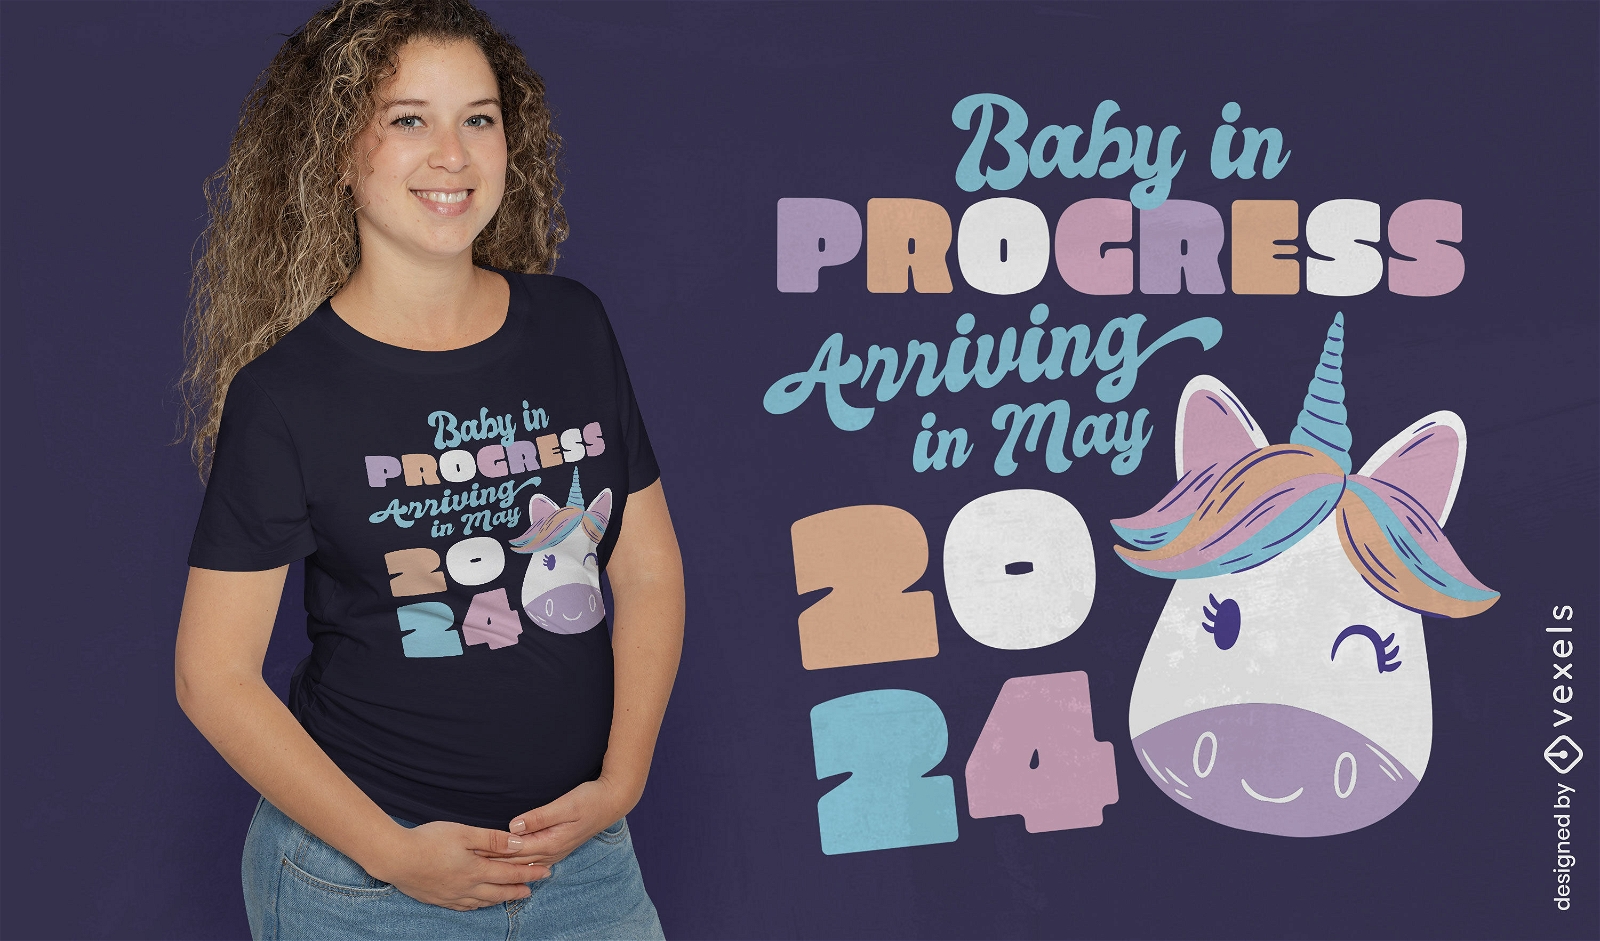
Maternity unicorn t-shirt design
Choose a folder
All favorites
Create new
Save
Maternity unicorn t-shirt design
Print ready
for Merch
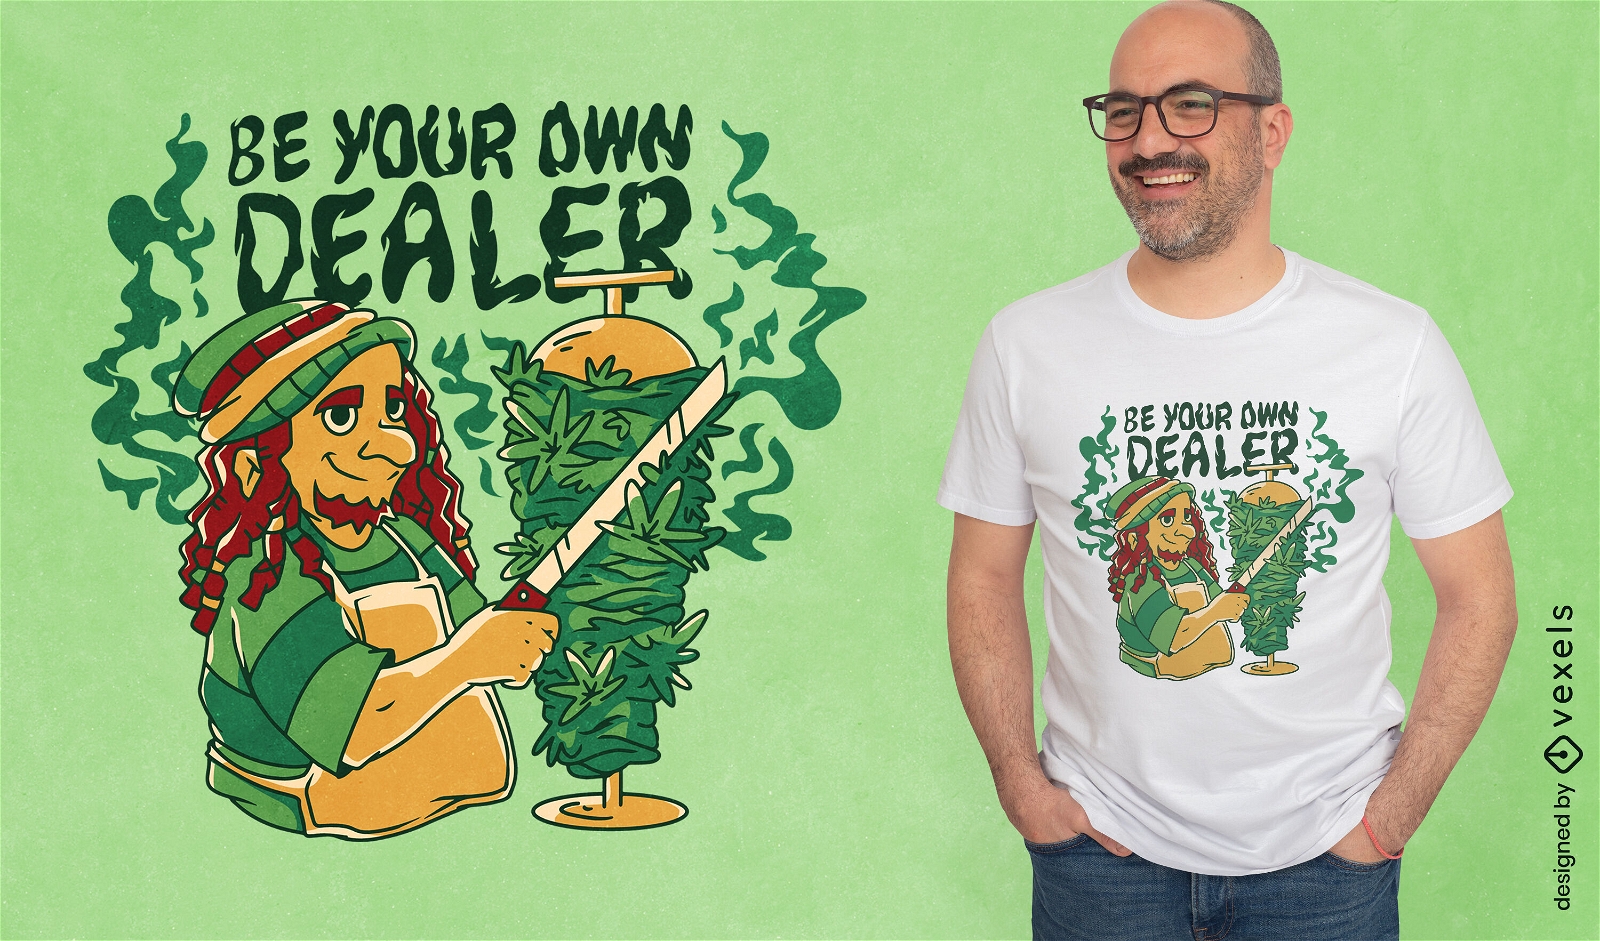
Be your own dealer cannabis kebab t-shirt design
Choose a folder
All favorites
Create new
Save
Be your own dealer cannabis kebab t-shirt design
Print ready
for Merch
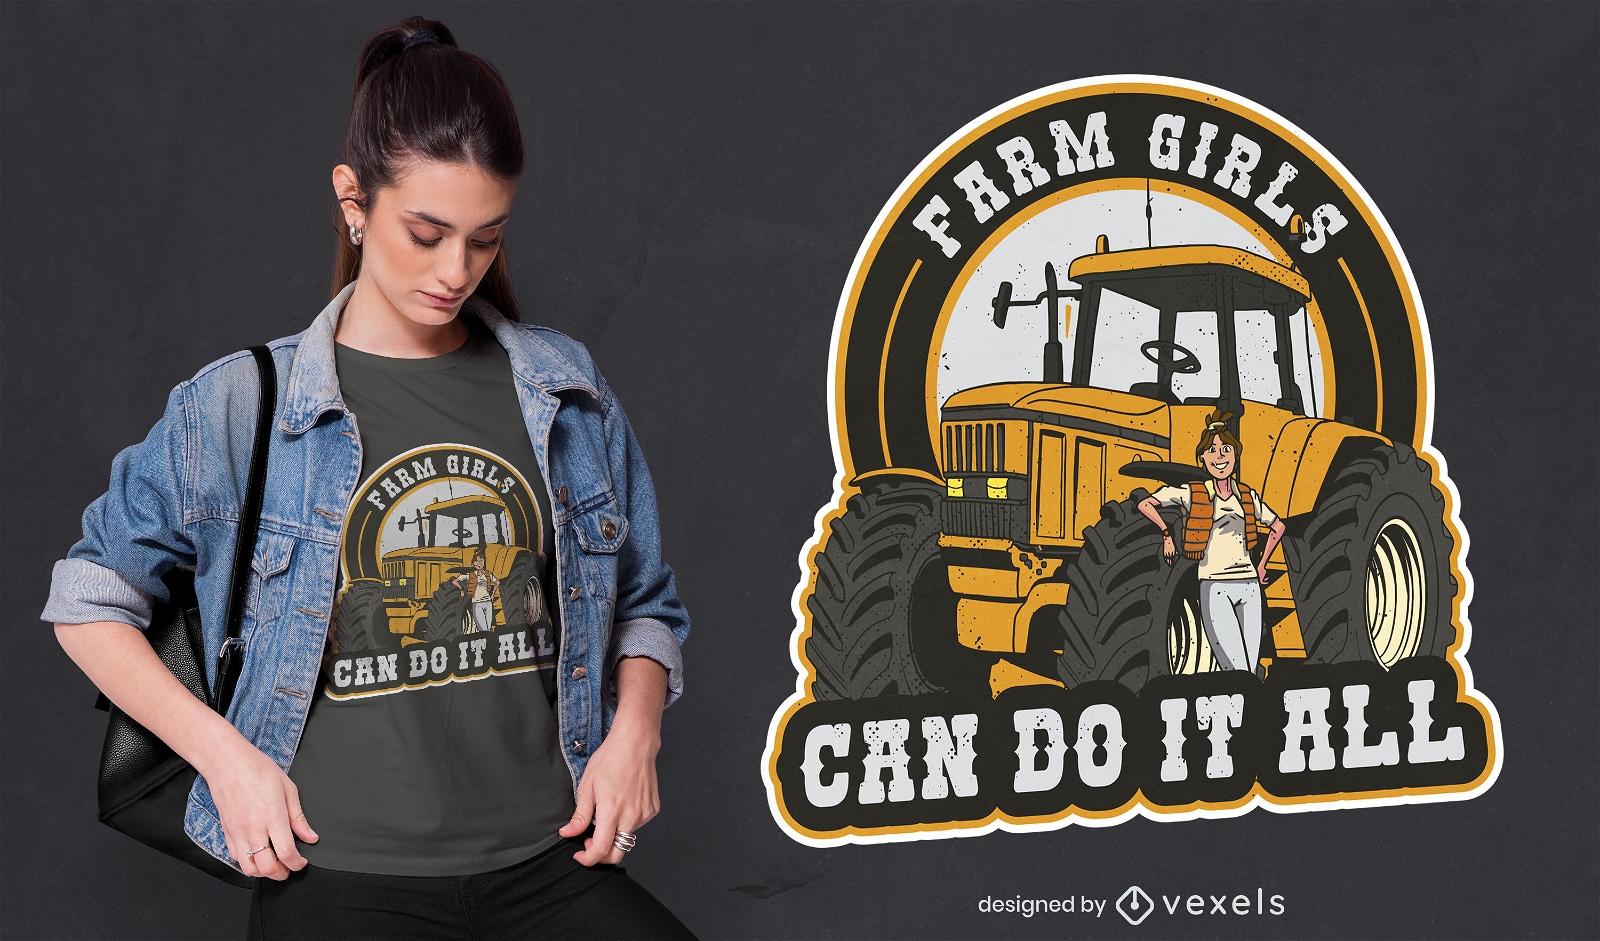
Farmer girl with truck t-shirt design
Choose a folder
All favorites
Create new
Save
Farmer girl with truck t-shirt design
Print ready
for Merch
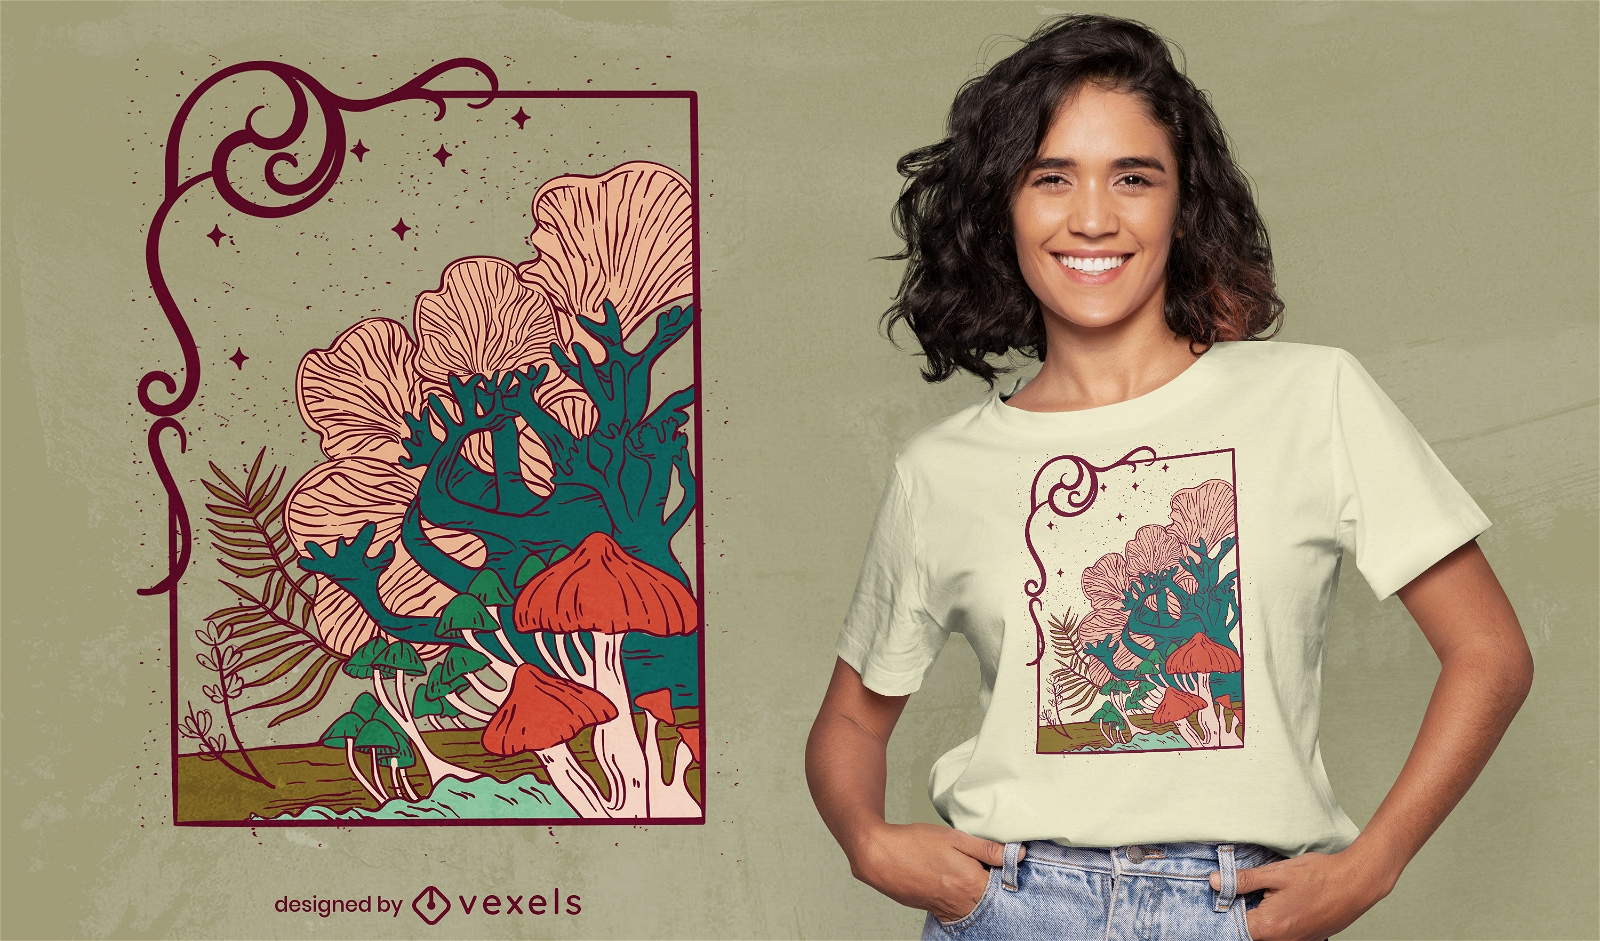
Cool mushrooms illustration t-shirt design
Choose a folder
All favorites
Create new
Save
Cool mushrooms illustration t-shirt design
Print ready
for Merch
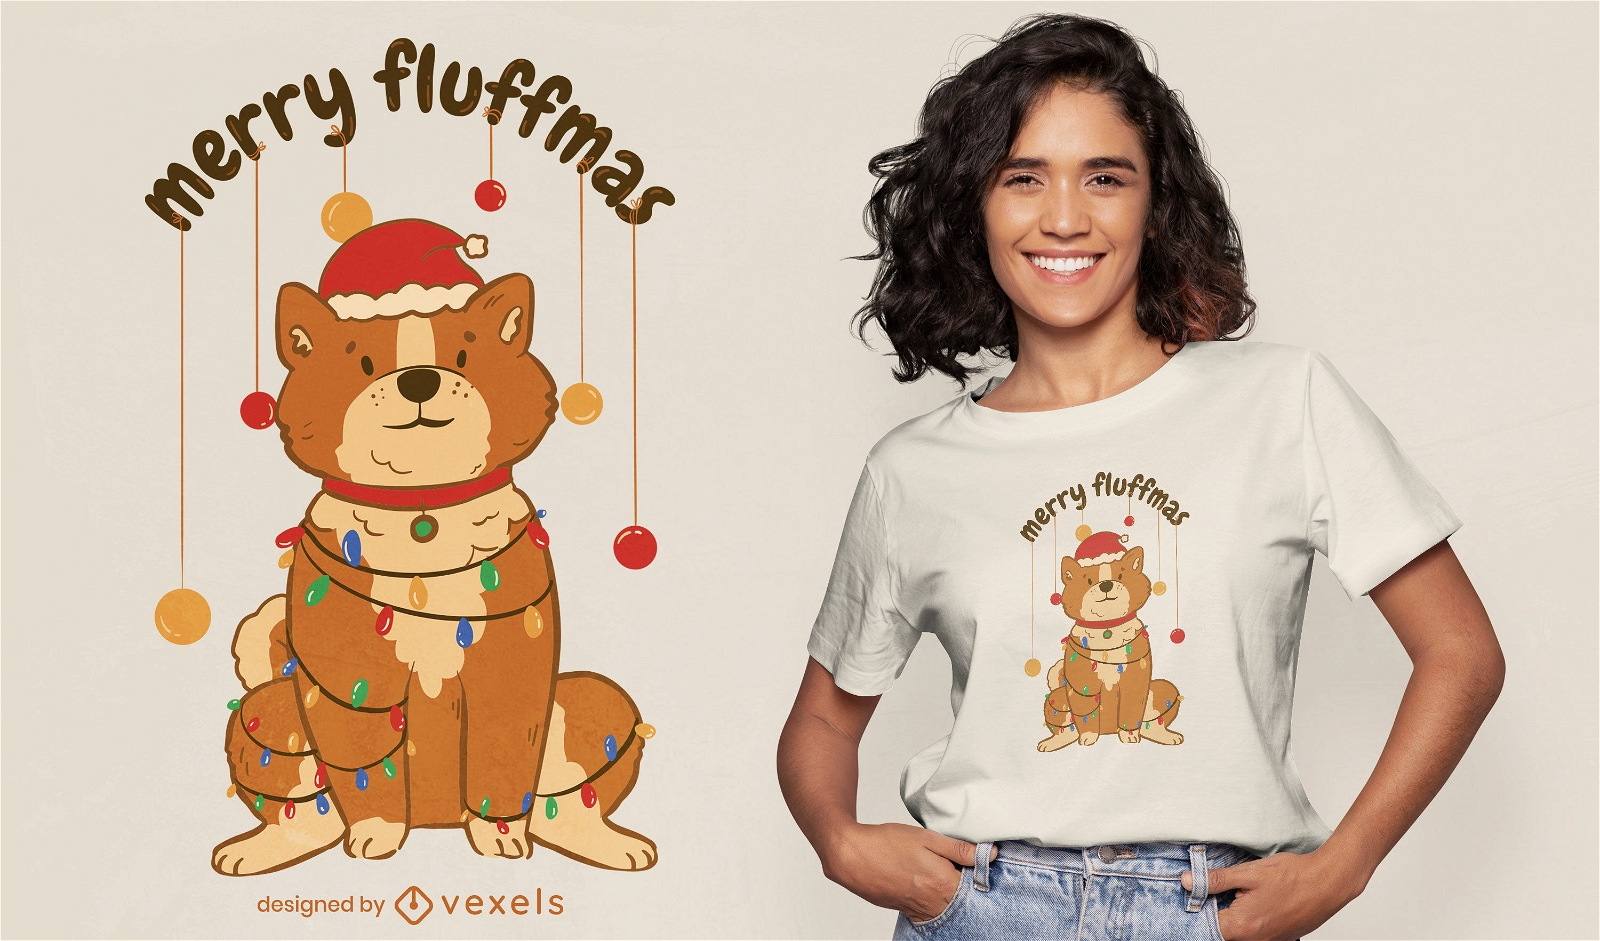
Merry Christmas dog fluffy pun t-shirt design
Choose a folder
All favorites
Create new
Save
Merry Christmas dog fluffy pun t-shirt design
Print ready
for Merch
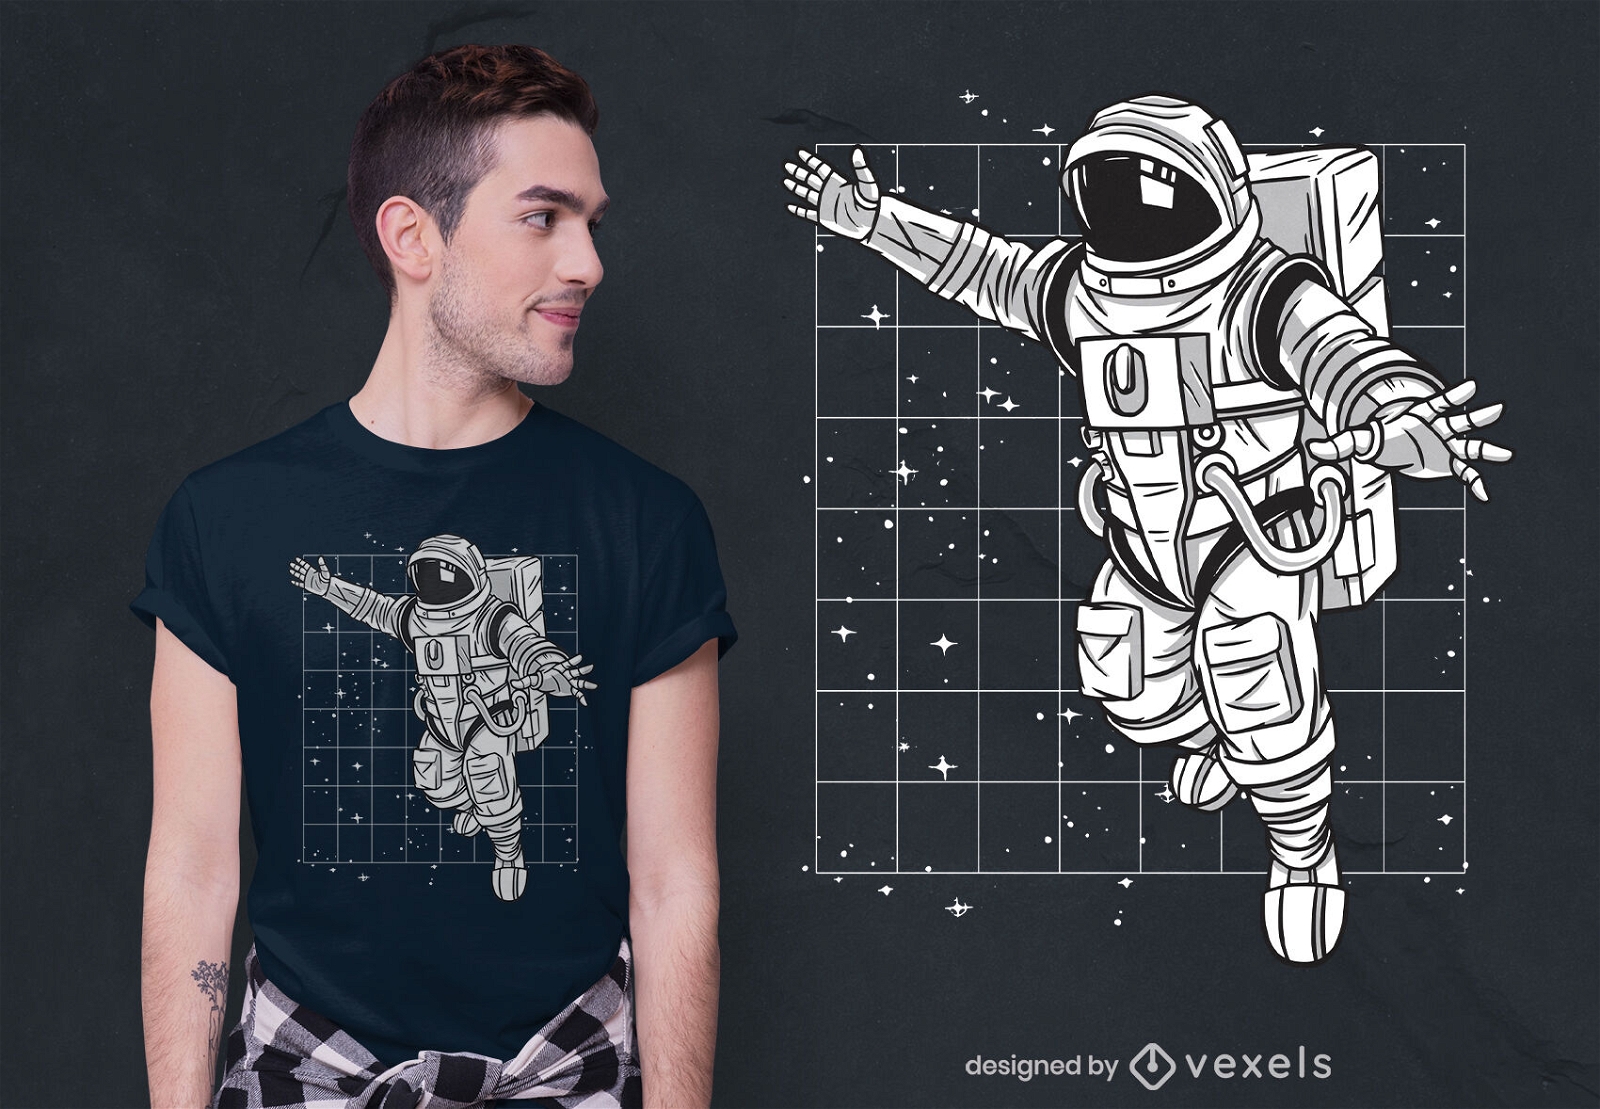
Spaceman floating t-shirt design
Choose a folder
All favorites
Create new
Save
Spaceman floating t-shirt design
Print ready
for Merch
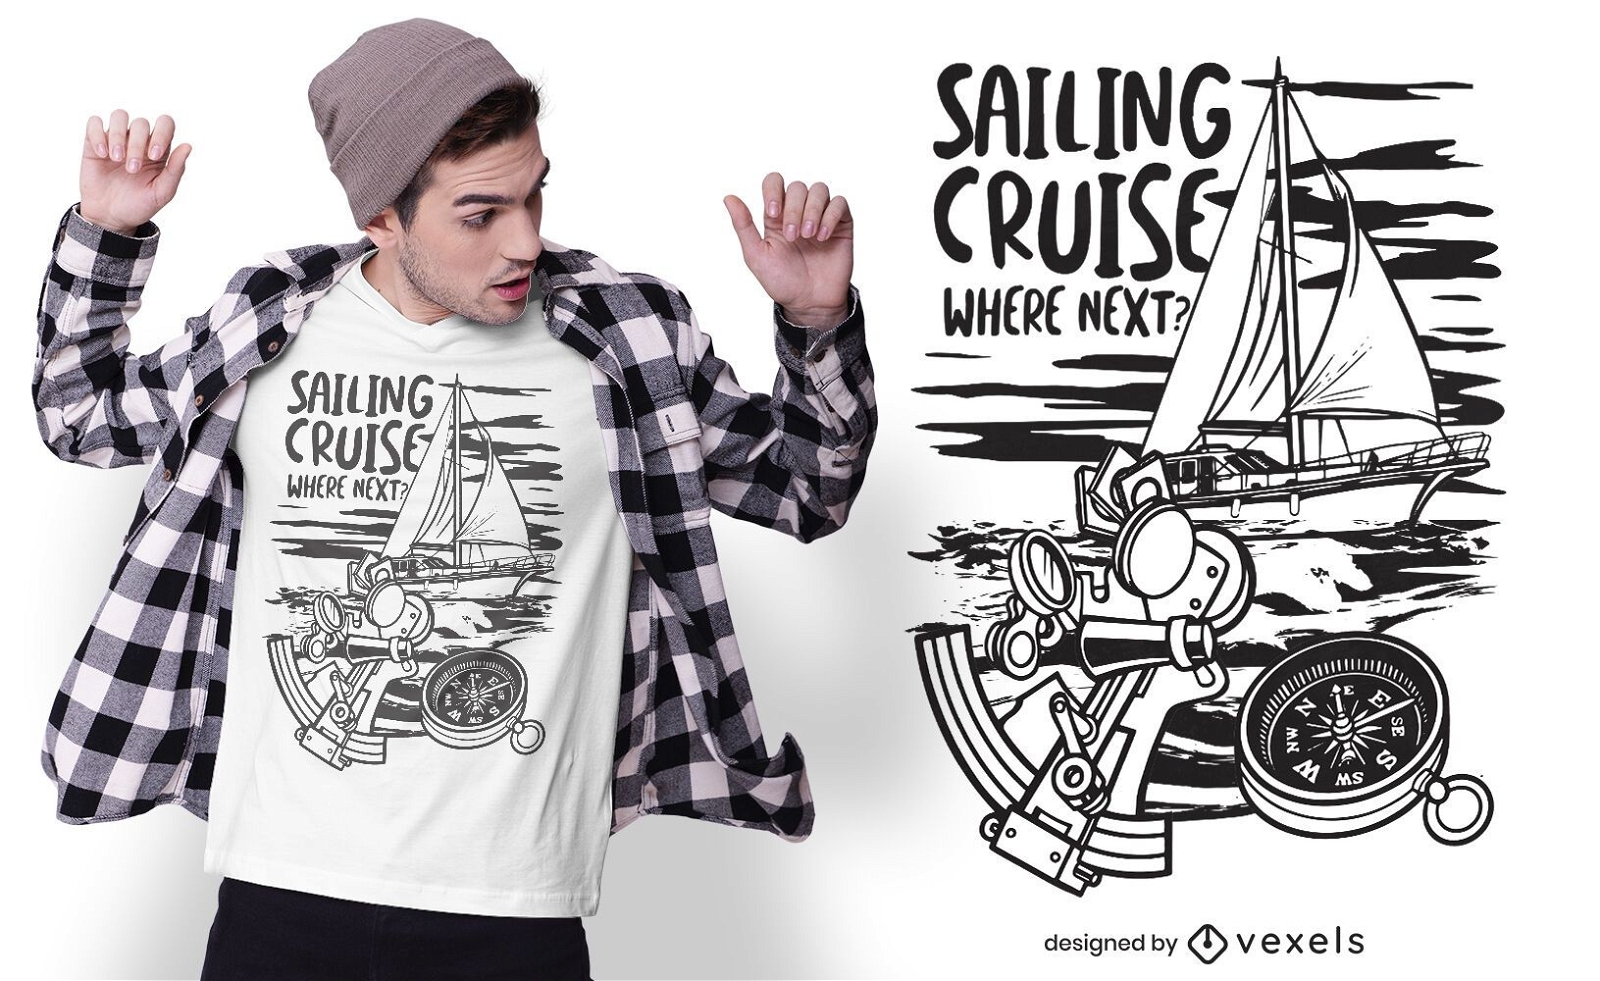
Sailing cruise t-shirt design
Choose a folder
All favorites
Create new
Save
Sailing cruise t-shirt design
Editable text
Print ready
for Merch
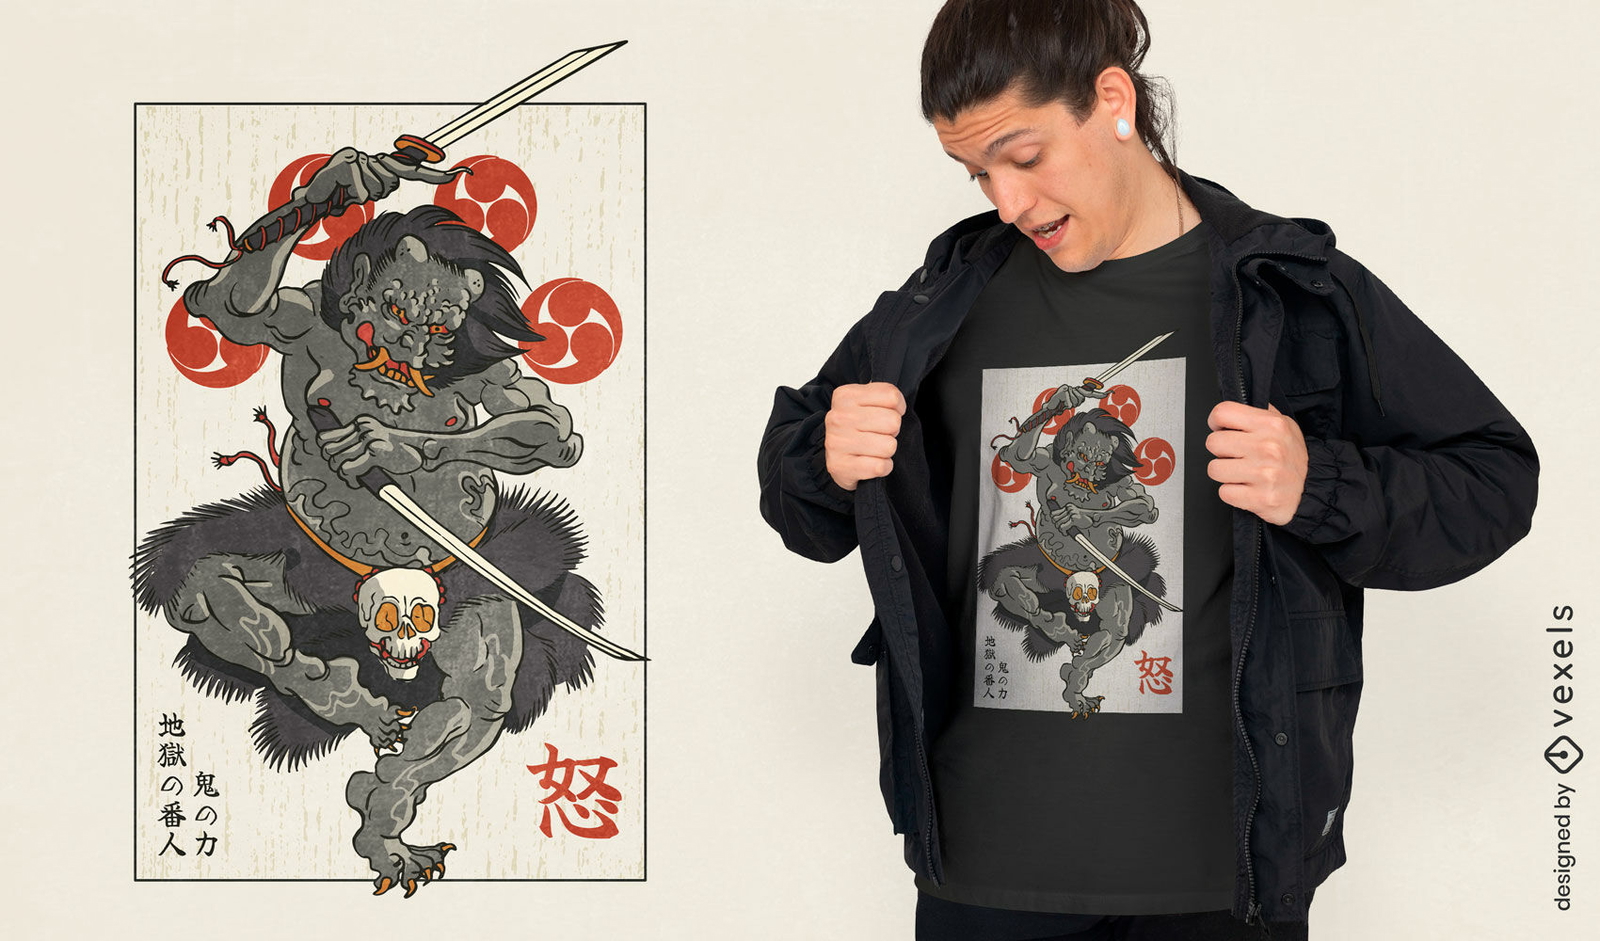
Japanese oni warrior t-shirt design
Choose a folder
All favorites
Create new
Save
Japanese oni warrior t-shirt design
Editable text
Print ready
for Merch
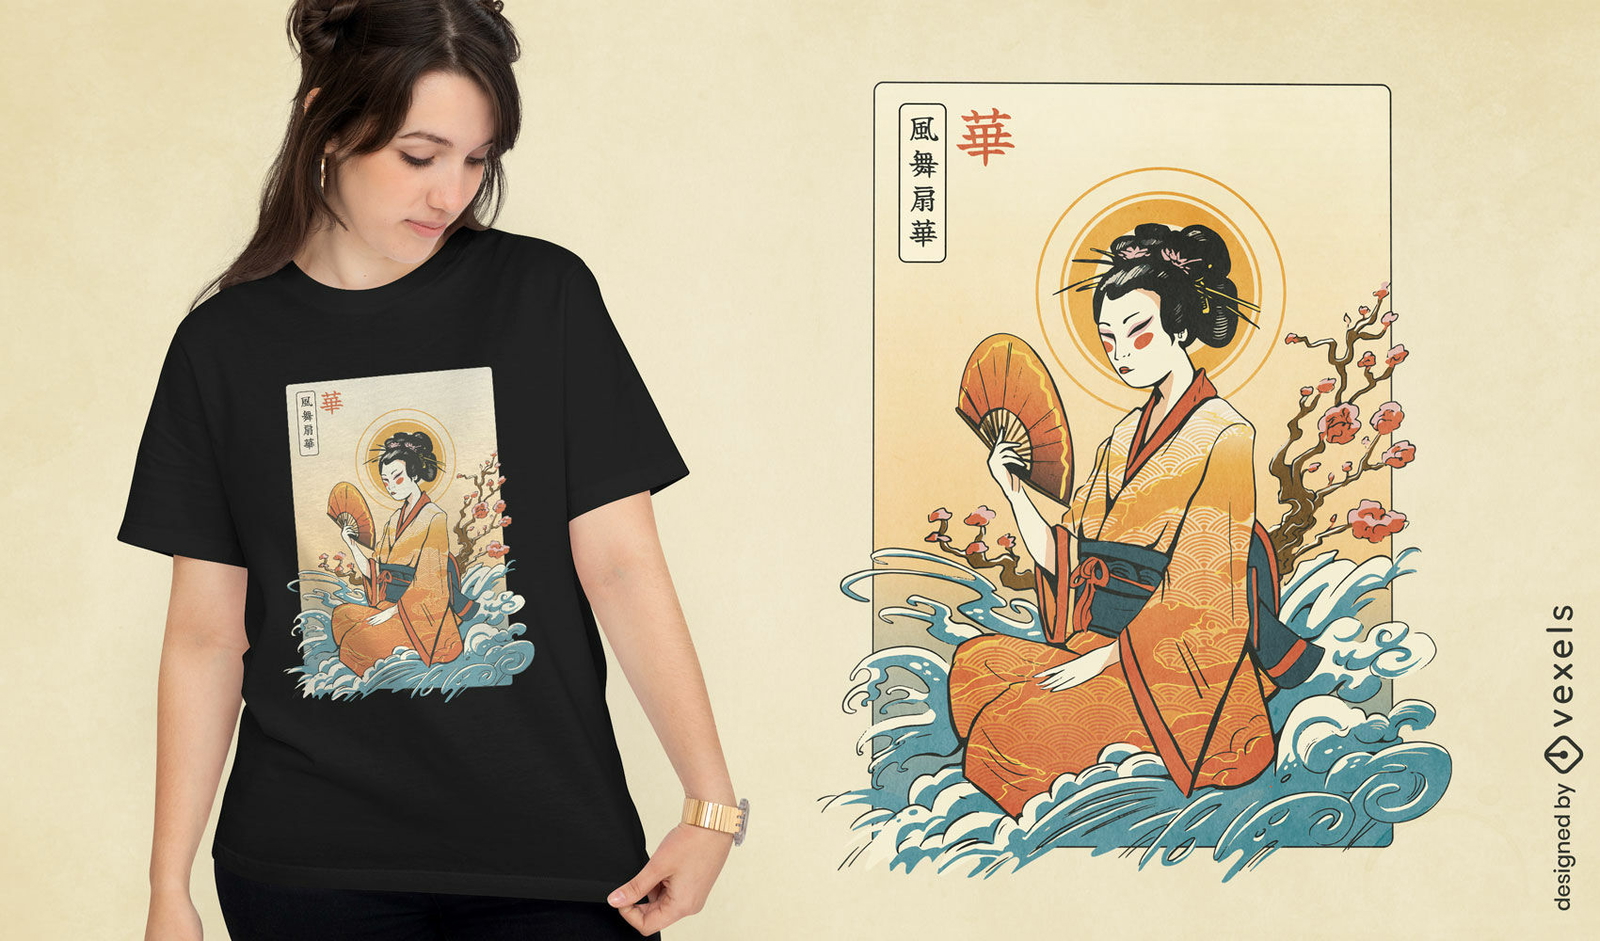
Geisha waves Japanese t-shirt design
Choose a folder
All favorites
Create new
Save
Geisha waves Japanese t-shirt design
Editable text
Print ready
for Merch
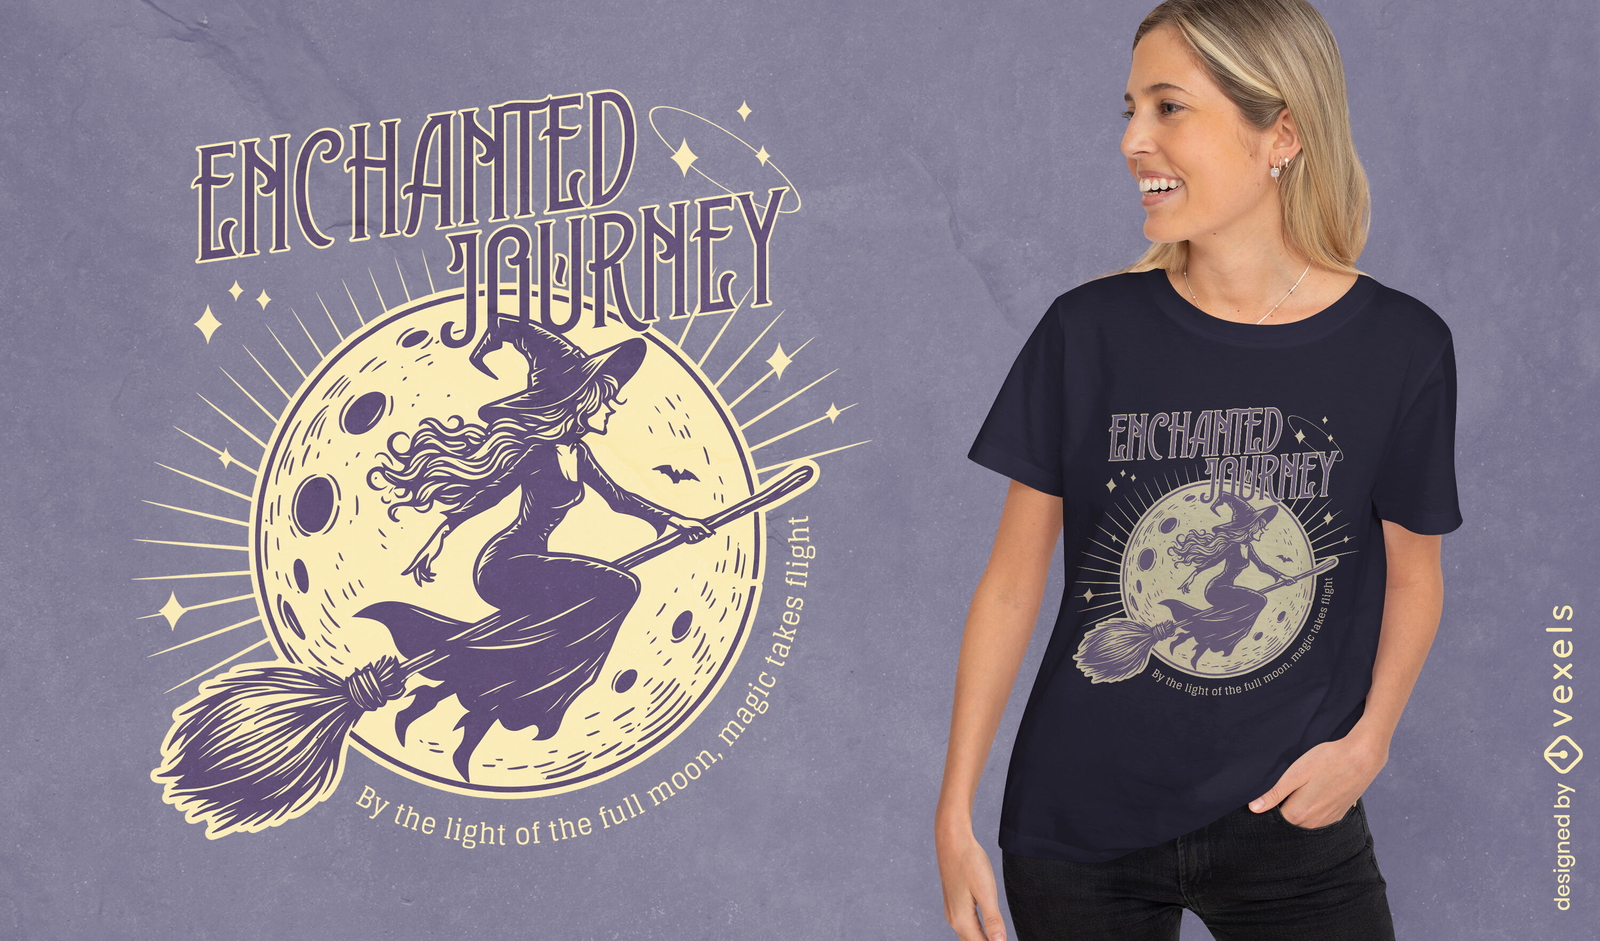
Enchanted journey t-shirt design
Choose a folder
All favorites
Create new
Save
Enchanted journey t-shirt design
Print ready
for Merch
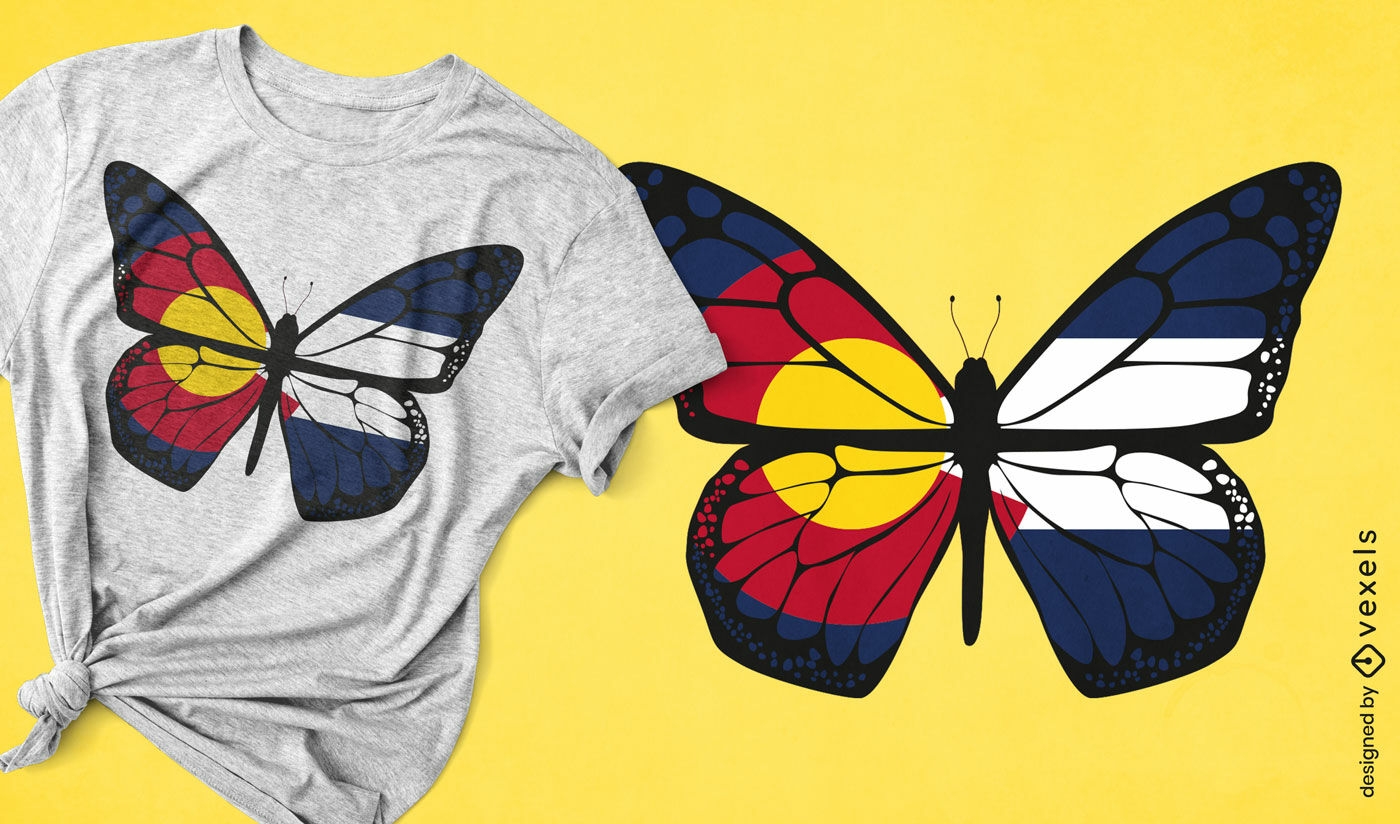
Colorado butterfly t-shirt design
Choose a folder
All favorites
Create new
Save
Colorado butterfly t-shirt design
Print ready
for Merch
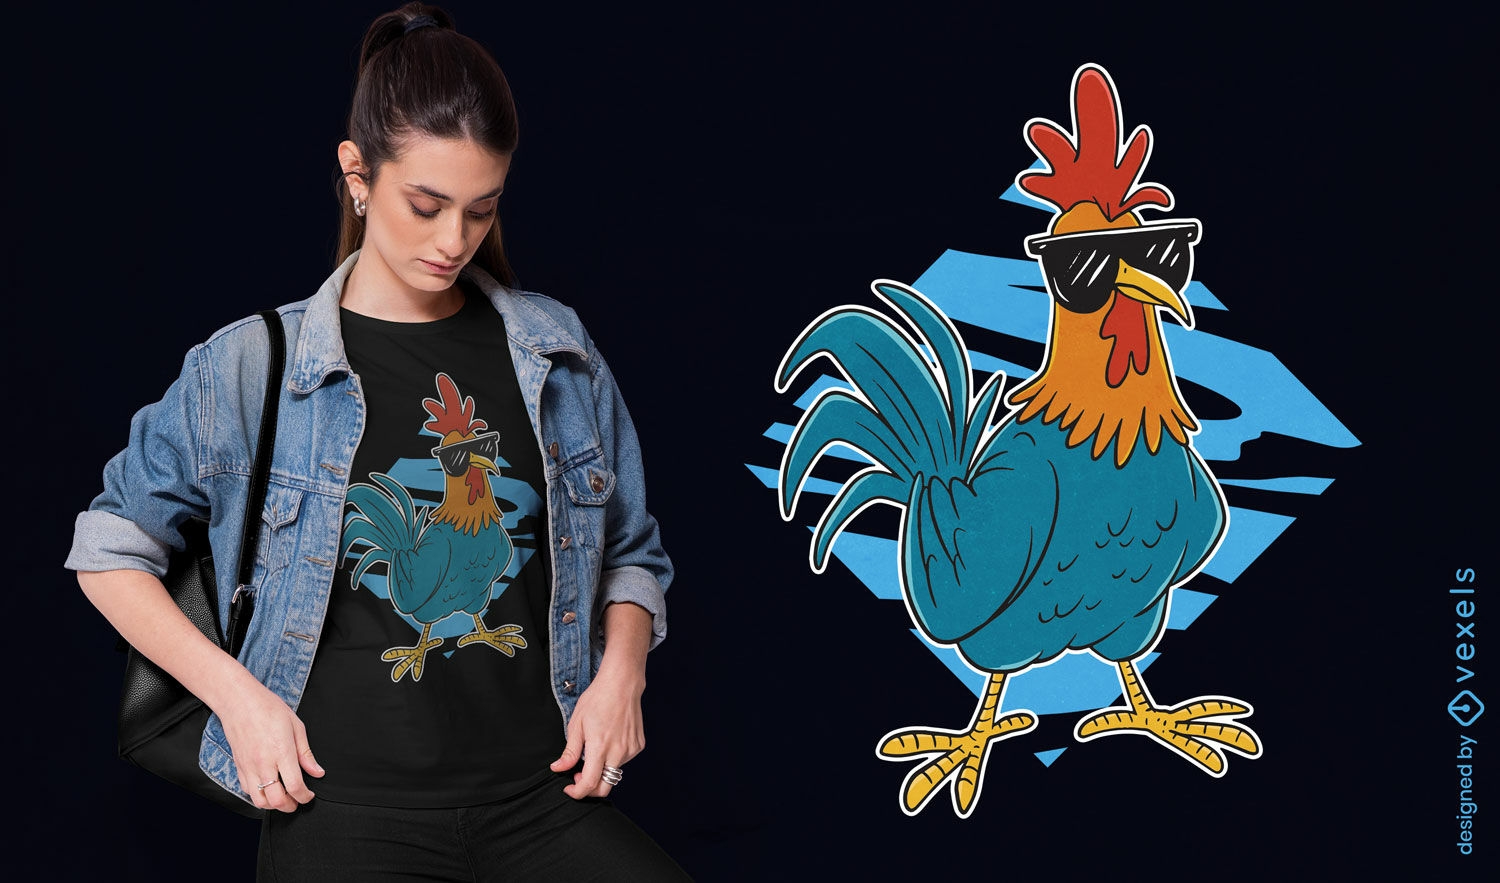
Cool rooster t-shirt design
Choose a folder
All favorites
Create new
Save
Cool rooster t-shirt design
Print ready
for Merch
Cockatiel illustration t-shirt design
Choose a folder
All favorites
Create new
Save
Cockatiel illustration t-shirt design
Boost Your Business
With The Leading Graphic Platform For Merch.
SEE PLANS
Next
of 720
prev page
next page