Design Library
New Merch Designs
T-Shirts
Vectors
Trending Merch Designs
PNGs & SVGs
Mockups
T-Shirt PSD Templates
Explore Designs
KDP Designs
Posters
Mugs
Phone Cases
Tote Bags
Pillows
Design Tools
Merch Designer
New!
Mockup Generator
AI Design Generator
Image Vectorizer
Quote Generator
T-Shirt Maker (Old)
Resources
Merch Digest
Blog
Help Center
Learn About Merch
Feedback
Corporate Solutions
Enterprise
API Access
Design Studio
Bulk Design Production
Pricing
Loading...
Sign Up
Login
PNGs For Merch
visual
elements
Design Library
New Merch Designs
T-Shirts
Vectors
Trending Merch Designs
PNGs & SVGs
Mockups
T-Shirt PSD Templates
Explore Designs
KDP Designs
Posters
Mugs
Phone Cases
Tote Bags
Pillows
Design Tools
Merch Designer
New!
Mockup Generator
AI Design Generator
Image Vectorizer
Quote Generator
T-Shirt Maker (Old)
Resources
Merch Digest
Blog
Help Center
Learn About Merch
Feedback
Corporate Solutions
Enterprise
API Access
Design Studio
Bulk Design Production
PLANS
PNGs For Merch
visual
elements
251 visual elements PNG and SVG design graphic
Download visual elements PNG & SVG Designs with transparent background for T-Shirts, book covers, phone cases and other merch.
Sort by
Most relevant
Sponsored results by
Get 15% off with code: VEXELS15
Show more
Premium
Intriguing potion bottle design with a snake motif PNG Design
Choose a folder
All favorites
Create new
Save
Intriguing potion bottle design with a snake motif PNG Design
Premium
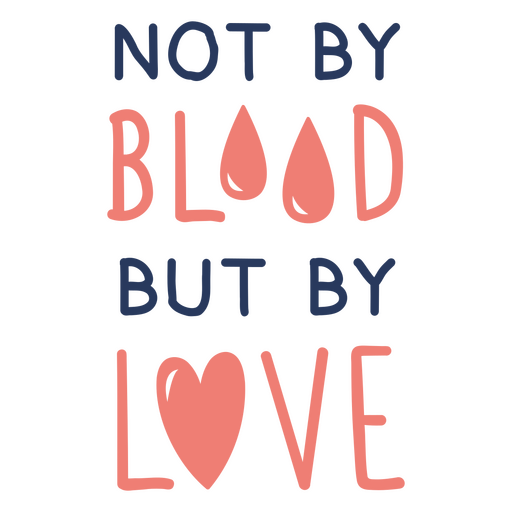
Heartfelt quote design about chosen family PNG Design
Choose a folder
All favorites
Create new
Save
Heartfelt quote design about chosen family PNG Design
Premium
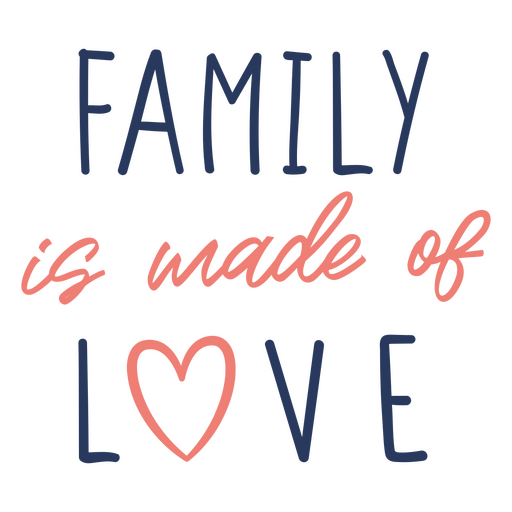
Heartfelt family love quote design PNG Design
Choose a folder
All favorites
Create new
Save
Heartfelt family love quote design PNG Design
Premium
Pearl necklace and baseball cap design PNG Design
Choose a folder
All favorites
Create new
Save
Pearl necklace and baseball cap design PNG Design
Premium
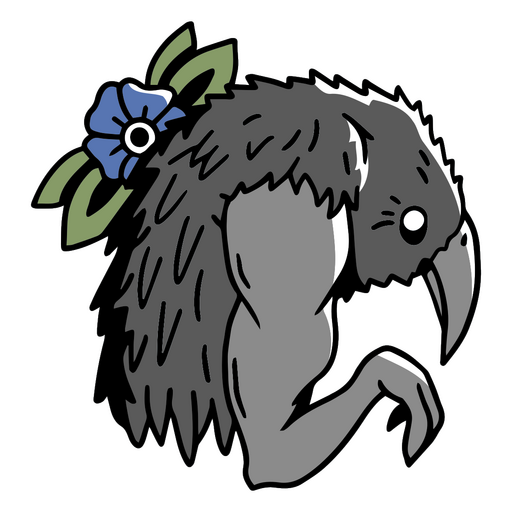
Unique crow and flower graphic design PNG Design
Choose a folder
All favorites
Create new
Save
Unique crow and flower graphic design PNG Design
Premium
Whimsical floral and wood-inspired illustration PNG Design
Choose a folder
All favorites
Create new
Save
Whimsical floral and wood-inspired illustration PNG Design
Premium
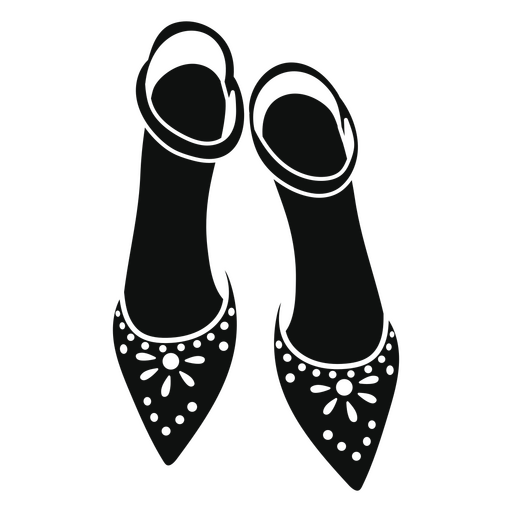
Elegant high heel shoe silhouette design PNG Design
Choose a folder
All favorites
Create new
Save
Elegant high heel shoe silhouette design PNG Design
Premium
Playful rocket illustration design PNG Design
Choose a folder
All favorites
Create new
Save
Playful rocket illustration design PNG Design
Premium
Floral vintage ray gun illustration PNG Design
Choose a folder
All favorites
Create new
Save
Floral vintage ray gun illustration PNG Design
Premium
Stylized bacon wave illustration PNG Design
Choose a folder
All favorites
Create new
Save
Stylized bacon wave illustration PNG Design
Premium
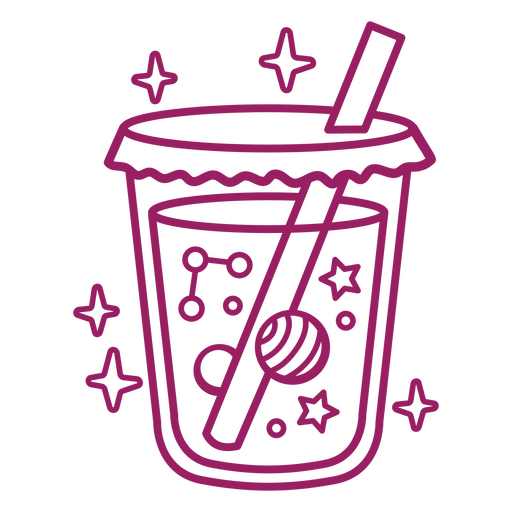
Whimsical cosmic drink illustration PNG Design
Choose a folder
All favorites
Create new
Save
Whimsical cosmic drink illustration PNG Design
Premium
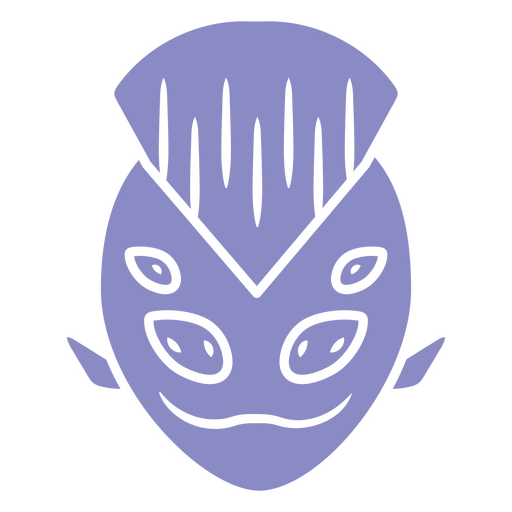
Stylized anthropomorphic mask illustration PNG Design
Choose a folder
All favorites
Create new
Save
Stylized anthropomorphic mask illustration PNG Design
Premium
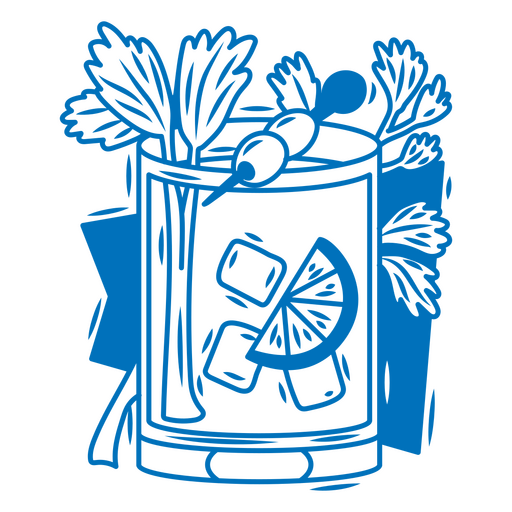
Stylized cocktail illustration with garnish and ice cubes PNG Design
Choose a folder
All favorites
Create new
Save
Stylized cocktail illustration with garnish and ice cubes PNG Design
Premium
Playful mama with a masters design PNG Design
Choose a folder
All favorites
Create new
Save
Playful mama with a masters design PNG Design
Premium
Artistic candle illustration with dripping wax PNG Design
Choose a folder
All favorites
Create new
Save
Artistic candle illustration with dripping wax PNG Design
Premium
Vibrant monkey health graphic PNG Design
Choose a folder
All favorites
Create new
Save
Vibrant monkey health graphic PNG Design
Premium
Whimsical mouse with flower design PNG Design
Choose a folder
All favorites
Create new
Save
Whimsical mouse with flower design PNG Design
Premium
Whimsical fish in a potion bottle illustration PNG Design
Choose a folder
All favorites
Create new
Save
Whimsical fish in a potion bottle illustration PNG Design
Premium
Stylish black butterfly graphic design PNG Design
Choose a folder
All favorites
Create new
Save
Stylish black butterfly graphic design PNG Design
Premium
Humorous mechanic dad quote design PNG Design
Choose a folder
All favorites
Create new
Save
Humorous mechanic dad quote design PNG Design
Premium
Detective in training humorous design featuring magnifying glass and fingerprint PNG Design
Choose a folder
All favorites
Create new
Save
Detective in training humorous design featuring magnifying glass and fingerprint PNG Design
Premium
Retro ticket design with relaxation theme PNG Design
Choose a folder
All favorites
Create new
Save
Retro ticket design with relaxation theme PNG Design
Premium
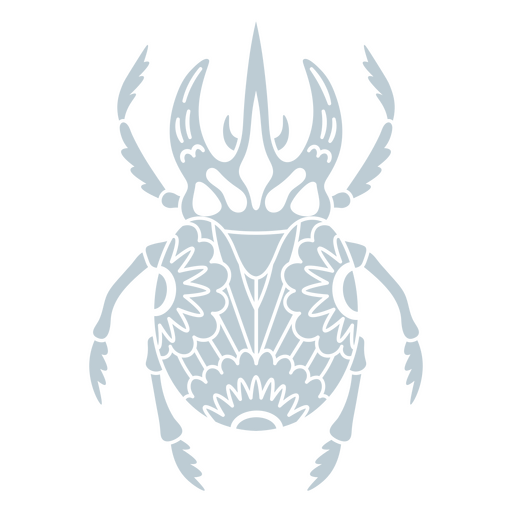
Artistic beetle illustration with intricate patterns PNG Design
Choose a folder
All favorites
Create new
Save
Artistic beetle illustration with intricate patterns PNG Design
Premium
Intricate ant stamp illustration PNG Design
Choose a folder
All favorites
Create new
Save
Intricate ant stamp illustration PNG Design
Premium
Unique glitch art donut illustration PNG Design
Choose a folder
All favorites
Create new
Save
Unique glitch art donut illustration PNG Design
Premium
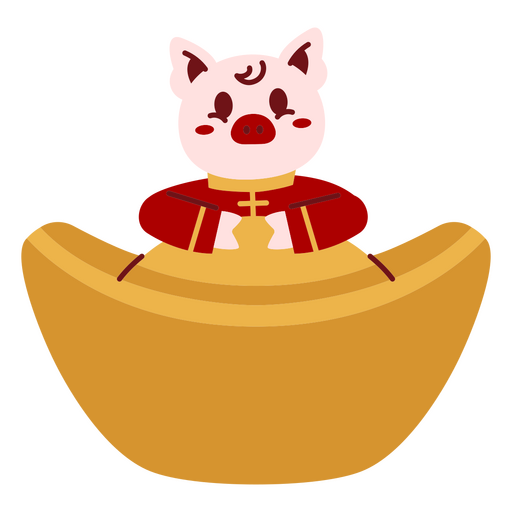
Playful pig figure in a golden ingot design PNG Design
Choose a folder
All favorites
Create new
Save
Playful pig figure in a golden ingot design PNG Design
Premium
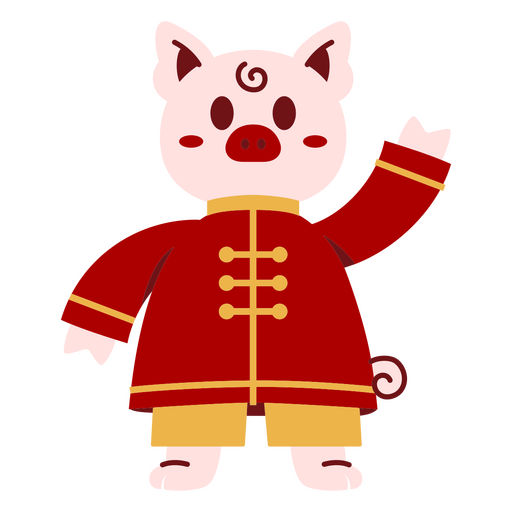
Playful cartoon pig in traditional attire PNG Design
Choose a folder
All favorites
Create new
Save
Playful cartoon pig in traditional attire PNG Design
Premium
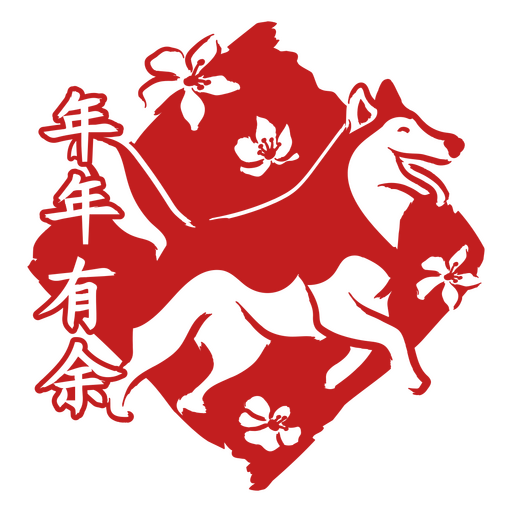
Vibrant red dog silhouette design with floral accents PNG Design
Choose a folder
All favorites
Create new
Save
Vibrant red dog silhouette design with floral accents PNG Design
Premium
Charming dog illustration with floral accents PNG Design
Choose a folder
All favorites
Create new
Save
Charming dog illustration with floral accents PNG Design
Premium
Inspirational quote poster design featuring live, laugh, love PNG Design
Choose a folder
All favorites
Create new
Save
Inspirational quote poster design featuring live, laugh, love PNG Design
Premium
Playful cheese lamp illustration PNG Design
Choose a folder
All favorites
Create new
Save
Playful cheese lamp illustration PNG Design
Premium
Charming handmade with care quote design PNG Design
Choose a folder
All favorites
Create new
Save
Charming handmade with care quote design PNG Design
Premium
Cute planet illustration with stars and hearts PNG Design
Choose a folder
All favorites
Create new
Save
Cute planet illustration with stars and hearts PNG Design
Premium
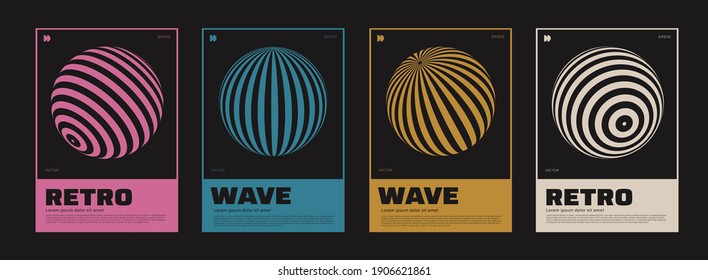
Abstract brown wave pattern design PNG Design
Choose a folder
All favorites
Create new
Save
Abstract brown wave pattern design PNG Design
Premium
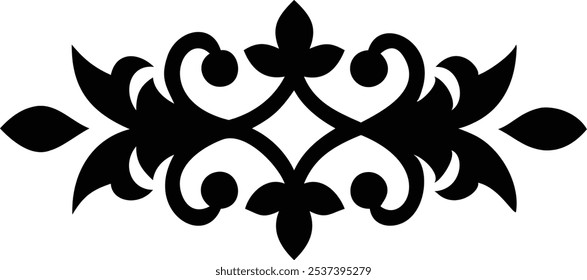
Whimsical decorative wave border design PNG Design
Choose a folder
All favorites
Create new
Save
Whimsical decorative wave border design PNG Design
Premium
Intricate circuit board design with microchip elements PNG Design
Choose a folder
All favorites
Create new
Save
Intricate circuit board design with microchip elements PNG Design
Premium
Elegant black and white rabbit illustration with floral elements PNG Design
Choose a folder
All favorites
Create new
Save
Elegant black and white rabbit illustration with floral elements PNG Design
Premium
Playful monster illustration with leaf elements PNG Design
Choose a folder
All favorites
Create new
Save
Playful monster illustration with leaf elements PNG Design
Premium
Stylish letter y design for creative branding PNG Design
Choose a folder
All favorites
Create new
Save
Stylish letter y design for creative branding PNG Design
Premium
Abstract textured circular line design for art prints PNG Design
Choose a folder
All favorites
Create new
Save
Abstract textured circular line design for art prints PNG Design
Premium
Playful geometric design with vibrant colors PNG Design
Choose a folder
All favorites
Create new
Save
Playful geometric design with vibrant colors PNG Design
Premium
Playful geometric block illustration PNG Design
Choose a folder
All favorites
Create new
Save
Playful geometric block illustration PNG Design
Premium
Bold geometric logo design with circular elements PNG Design
Choose a folder
All favorites
Create new
Save
Bold geometric logo design with circular elements PNG Design
AI generated, curated by our designers
Premium
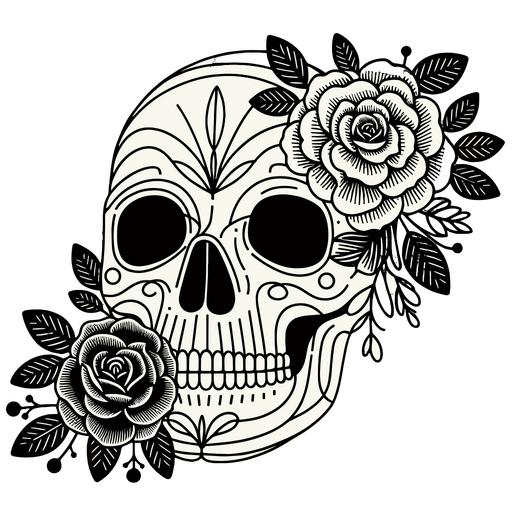
Skull and roses black and white PNG Design
Choose a folder
All favorites
Create new
Save
Skull and roses black and white PNG Design
Premium
Christmas cheer red design PNG Design
Choose a folder
All favorites
Create new
Save
Christmas cheer red design PNG Design
Premium
DUPLICADO Cute christmas tree t-shirt design PNG Design
Choose a folder
All favorites
Create new
Save
DUPLICADO Cute christmas tree t-shirt design PNG Design
Premium
Light bulb dripping in black PNG Design
Choose a folder
All favorites
Create new
Save
Light bulb dripping in black PNG Design
Vision impairment awareness icon PNG Design
Choose a folder
All favorites
Create new
Save
Vision impairment awareness icon PNG Design
Eye fight to win badge sticker PNG Design
Choose a folder
All favorites
Create new
Save
Eye fight to win badge sticker PNG Design
Premium
Blue and white snake design PNG Design
Choose a folder
All favorites
Create new
Save
Blue and white snake design PNG Design
Boost Your Business
With The Leading Graphic Platform For Merch.
SEE PLANS
Next
of 6
prev page
next page