Design Library
New Merch Designs
T-Shirts
Vectors
Trending Merch Designs
PNGs & SVGs
Mockups
T-Shirt PSD Templates
Explore Designs
KDP Designs
Posters
Mugs
Phone Cases
Tote Bags
Pillows
Design Tools
Merch Designer
New!
Mockup Generator
AI Design Generator
Image Vectorizer
Quote Generator
T-Shirt Maker (Old)
Resources
Merch Digest
Blog
Help Center
Learn About Merch
Feedback
Corporate Solutions
Enterprise
API Access
Design Studio
Bulk Design Production
Pricing
Loading...
Sign Up
Login
PNGs For Merch
chart
Design Library
New Merch Designs
T-Shirts
Vectors
Trending Merch Designs
PNGs & SVGs
Mockups
T-Shirt PSD Templates
Explore Designs
KDP Designs
Posters
Mugs
Phone Cases
Tote Bags
Pillows
Design Tools
Merch Designer
New!
Mockup Generator
AI Design Generator
Image Vectorizer
Quote Generator
T-Shirt Maker (Old)
Resources
Merch Digest
Blog
Help Center
Learn About Merch
Feedback
Corporate Solutions
Enterprise
API Access
Design Studio
Bulk Design Production
PLANS
PNGs For Merch
chart
279 chart PNG and SVG design graphic
Download chart PNG & SVG Designs with transparent background for T-Shirts, book covers, phone cases and other merch.
Related:
charts
,
pie chart
,
pie charts
Sort by
Most relevant
Sponsored results by
Get 15% off with code: VEXELS15
Show more
Premium
The eastern sign of horse PNG Design
Choose a folder
All favorites
Create new
Save
The eastern sign of horse PNG Design
Growing graph icon PNG Design
Choose a folder
All favorites
Create new
Save
Growing graph icon PNG Design
Growing graph icon stroke pink PNG Design
Choose a folder
All favorites
Create new
Save
Growing graph icon stroke pink PNG Design
Premium
Graph square icon PNG Design
Choose a folder
All favorites
Create new
Save
Graph square icon PNG Design
Premium
Half blue multicolor piechart PNG Design
Choose a folder
All favorites
Create new
Save
Half blue multicolor piechart PNG Design
Premium
Tarot cards with a powerful symbol PNG Design
Choose a folder
All favorites
Create new
Save
Tarot cards with a powerful symbol PNG Design
Premium
Moon design on a hand PNG Design
Choose a folder
All favorites
Create new
Save
Moon design on a hand PNG Design
Premium
Fortune telling card PNG Design
Choose a folder
All favorites
Create new
Save
Fortune telling card PNG Design
Premium
The eastern zodiac sign of ox PNG Design
Choose a folder
All favorites
Create new
Save
The eastern zodiac sign of ox PNG Design
Premium
The Steeple card in a skeleton-themed tarot PNG Design
Choose a folder
All favorites
Create new
Save
The Steeple card in a skeleton-themed tarot PNG Design
Graph flat icon PNG Design
Choose a folder
All favorites
Create new
Save
Graph flat icon PNG Design
Premium
Taurus sign in the western horoscope PNG Design
Choose a folder
All favorites
Create new
Save
Taurus sign in the western horoscope PNG Design
Premium
The eastern sign of rat PNG Design
Choose a folder
All favorites
Create new
Save
The eastern sign of rat PNG Design
Premium
Growing graph screen stroke icon PNG Design
Choose a folder
All favorites
Create new
Save
Growing graph screen stroke icon PNG Design
Graph curve doodle PNG Design
Choose a folder
All favorites
Create new
Save
Graph curve doodle PNG Design
Premium
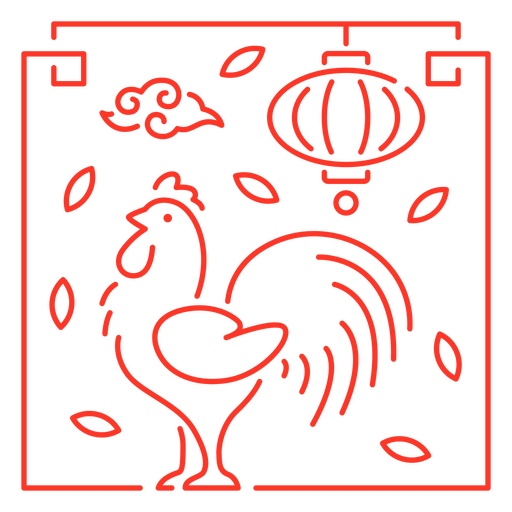
The eastern sign of rooster PNG Design
Choose a folder
All favorites
Create new
Save
The eastern sign of rooster PNG Design
Premium
The eastern zodiac sign of pig PNG Design
Choose a folder
All favorites
Create new
Save
The eastern zodiac sign of pig PNG Design
Premium
The eastern zodiac sign of dragon PNG Design
Choose a folder
All favorites
Create new
Save
The eastern zodiac sign of dragon PNG Design
Premium
The eastern zodiac sign of snake PNG Design
Choose a folder
All favorites
Create new
Save
The eastern zodiac sign of snake PNG Design
Premium
The eastern zodiac sign of rabbit PNG Design
Choose a folder
All favorites
Create new
Save
The eastern zodiac sign of rabbit PNG Design
Premium
The eastern sign of monkey PNG Design
Choose a folder
All favorites
Create new
Save
The eastern sign of monkey PNG Design
Premium
The eastern sign of snake PNG Design
Choose a folder
All favorites
Create new
Save
The eastern sign of snake PNG Design
Premium
The eastern sign of rabbit PNG Design
Choose a folder
All favorites
Create new
Save
The eastern sign of rabbit PNG Design
Premium
The eastern zodiac sign of dog PNG Design
Choose a folder
All favorites
Create new
Save
The eastern zodiac sign of dog PNG Design
Premium
The eastern zodiac sign of monkey PNG Design
Choose a folder
All favorites
Create new
Save
The eastern zodiac sign of monkey PNG Design
Premium
The eastern zodiac sign of horse PNG Design
Choose a folder
All favorites
Create new
Save
The eastern zodiac sign of horse PNG Design
Premium
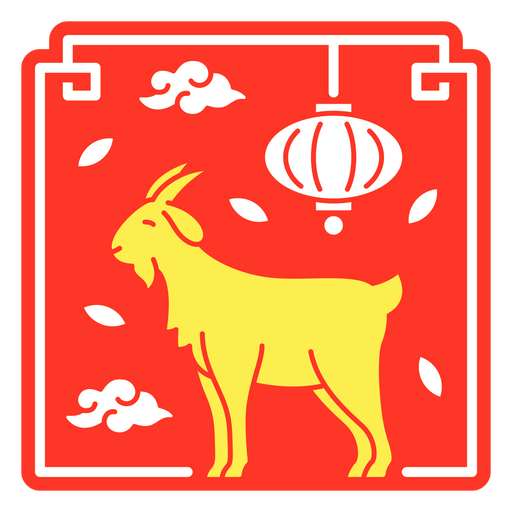
The eastern zodiac sign of goat PNG Design
Choose a folder
All favorites
Create new
Save
The eastern zodiac sign of goat PNG Design
Premium
The eastern zodiac sign of tiger PNG Design
Choose a folder
All favorites
Create new
Save
The eastern zodiac sign of tiger PNG Design
Premium
The eastern zodiac sign of rat PNG Design
Choose a folder
All favorites
Create new
Save
The eastern zodiac sign of rat PNG Design
Boost Your Business
With The Leading Graphic Platform For Merch.
SEE PLANS
of 6
prev page
next page