Design Library
New Merch Designs
T-Shirts
Vectors
Trending Merch Designs
PNGs & SVGs
Mockups
T-Shirt PSD Templates
Explore Designs
KDP Designs
Posters
Mugs
Phone Cases
Tote Bags
Pillows
Design Tools
Merch Designer
New!
Mockup Generator
AI Design Generator
Image Vectorizer
Quote Generator
T-Shirt Maker (Old)
Resources
Merch Digest
Blog
Help Center
Learn About Merch
Feedback
Corporate Solutions
Enterprise
API Access
Design Studio
Bulk Design Production
Pricing
Loading...
Sign Up
Login
Vectors
graph
Design Library
New Merch Designs
T-Shirts
Vectors
Trending Merch Designs
PNGs & SVGs
Mockups
T-Shirt PSD Templates
Explore Designs
KDP Designs
Posters
Mugs
Phone Cases
Tote Bags
Pillows
Design Tools
Merch Designer
New!
Mockup Generator
AI Design Generator
Image Vectorizer
Quote Generator
T-Shirt Maker (Old)
Resources
Merch Digest
Blog
Help Center
Learn About Merch
Feedback
Corporate Solutions
Enterprise
API Access
Design Studio
Bulk Design Production
PLANS
Vectors
graph
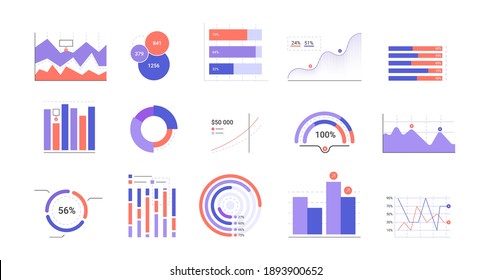
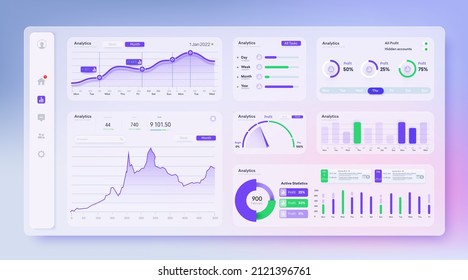
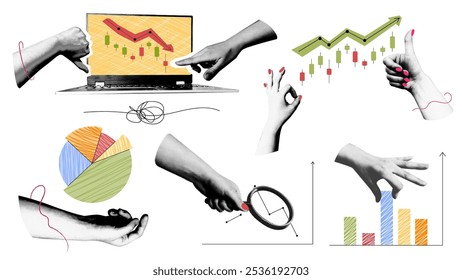
159 graph Vectors & Graphics to Download
Download graph editable vector graphics for every design project. In AI, SVG, PNG, JPG and PSD.
Related:
graphic novel
,
this graphic tee design can be used on shirts
,
graphics
Sort by
Most relevant
Sponsored results by
Get 15% off with code: VEXELS15
Show more
Print ready
for Merch
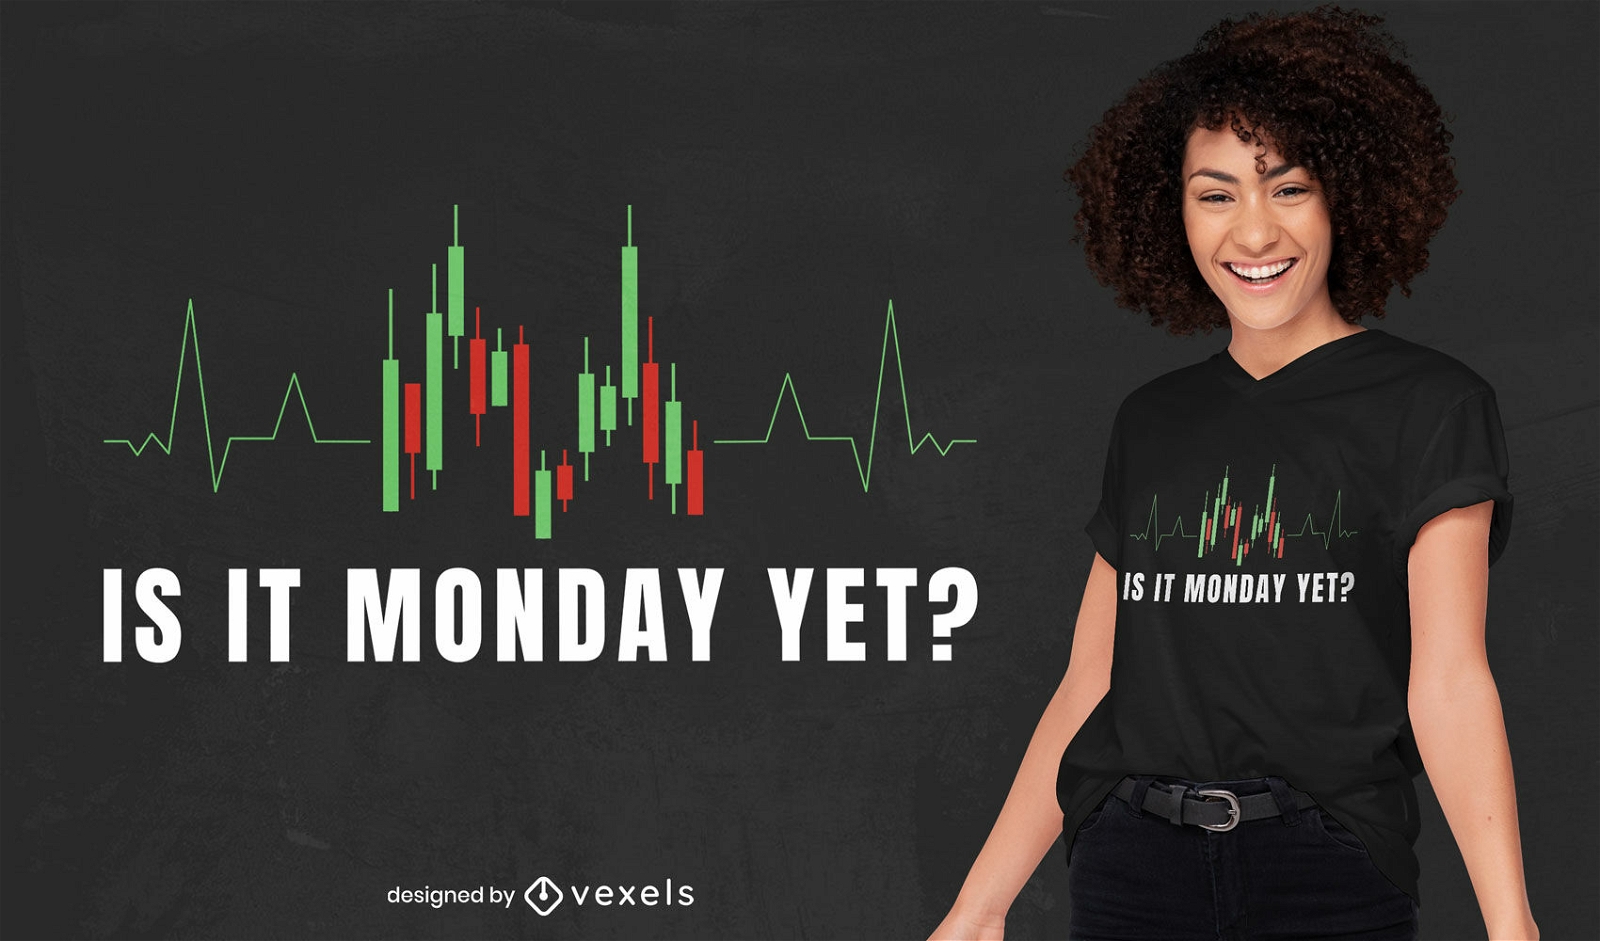
Heartbeat trading graphic t-shirt design
Choose a folder
All favorites
Create new
Save
Heartbeat trading graphic t-shirt design
Print ready
for Merch
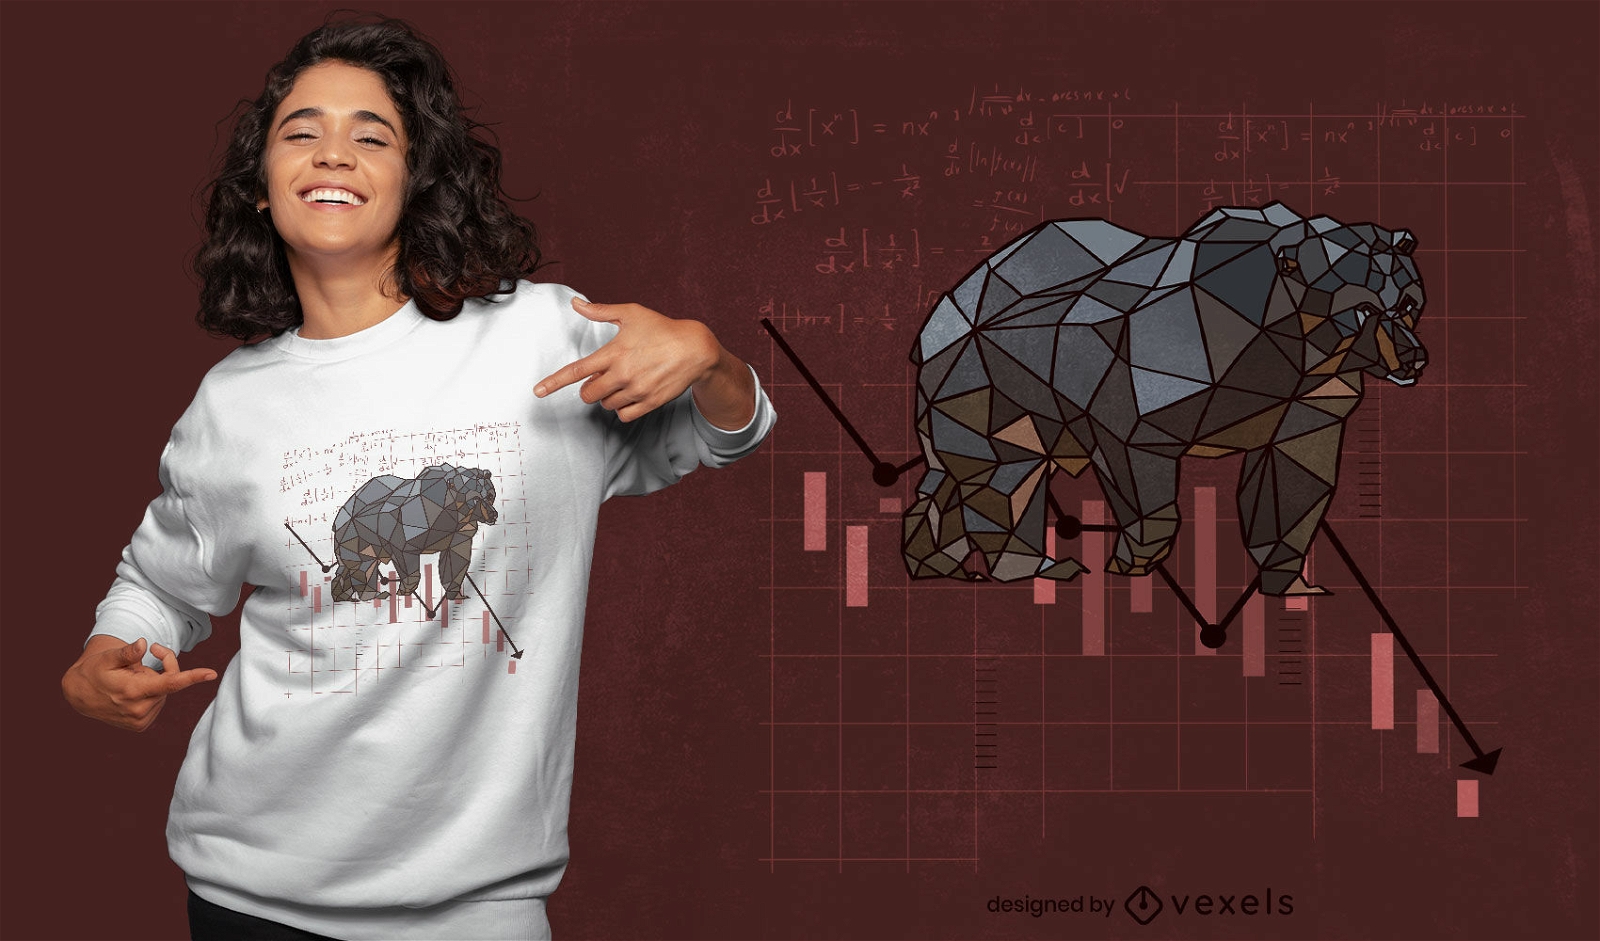
Polygonal bear animal t-shirt design
Choose a folder
All favorites
Create new
Save
Polygonal bear animal t-shirt design
Print ready
for Merch
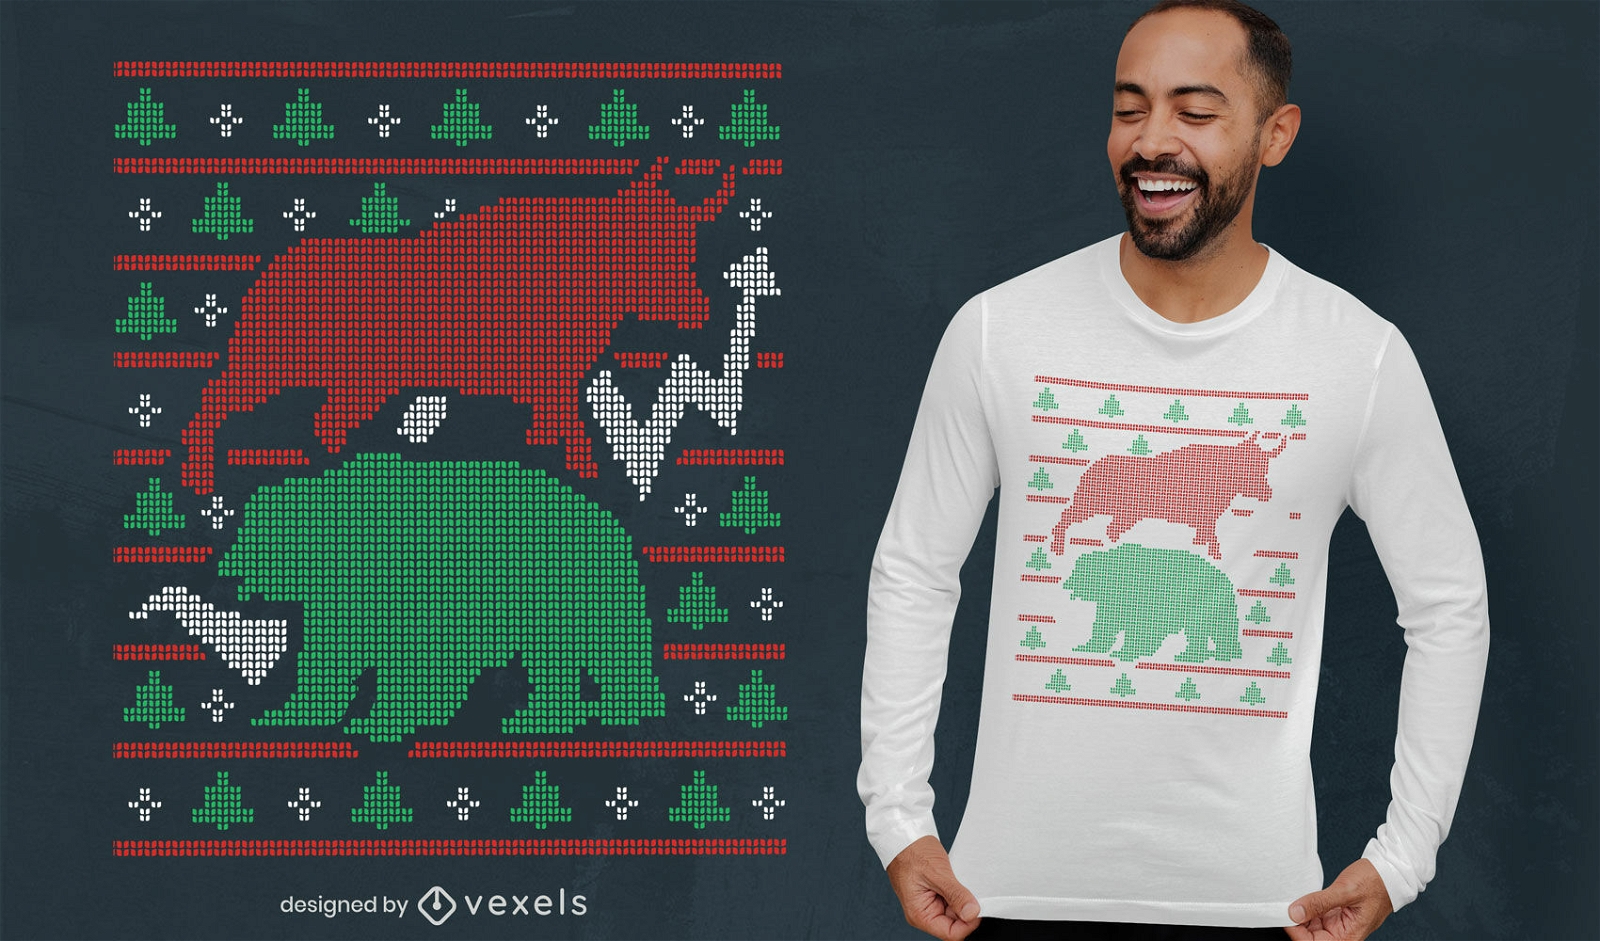
Stocks market animals ugly sweater t-shirt design
Choose a folder
All favorites
Create new
Save
Stocks market animals ugly sweater t-shirt design
Series Of Black And White Design Elements Vector 10 Circle Graph
Choose a folder
All favorites
Create new
Save
Series Of Black And White Design Elements Vector 10 Circle Graph
Print ready
for Merch
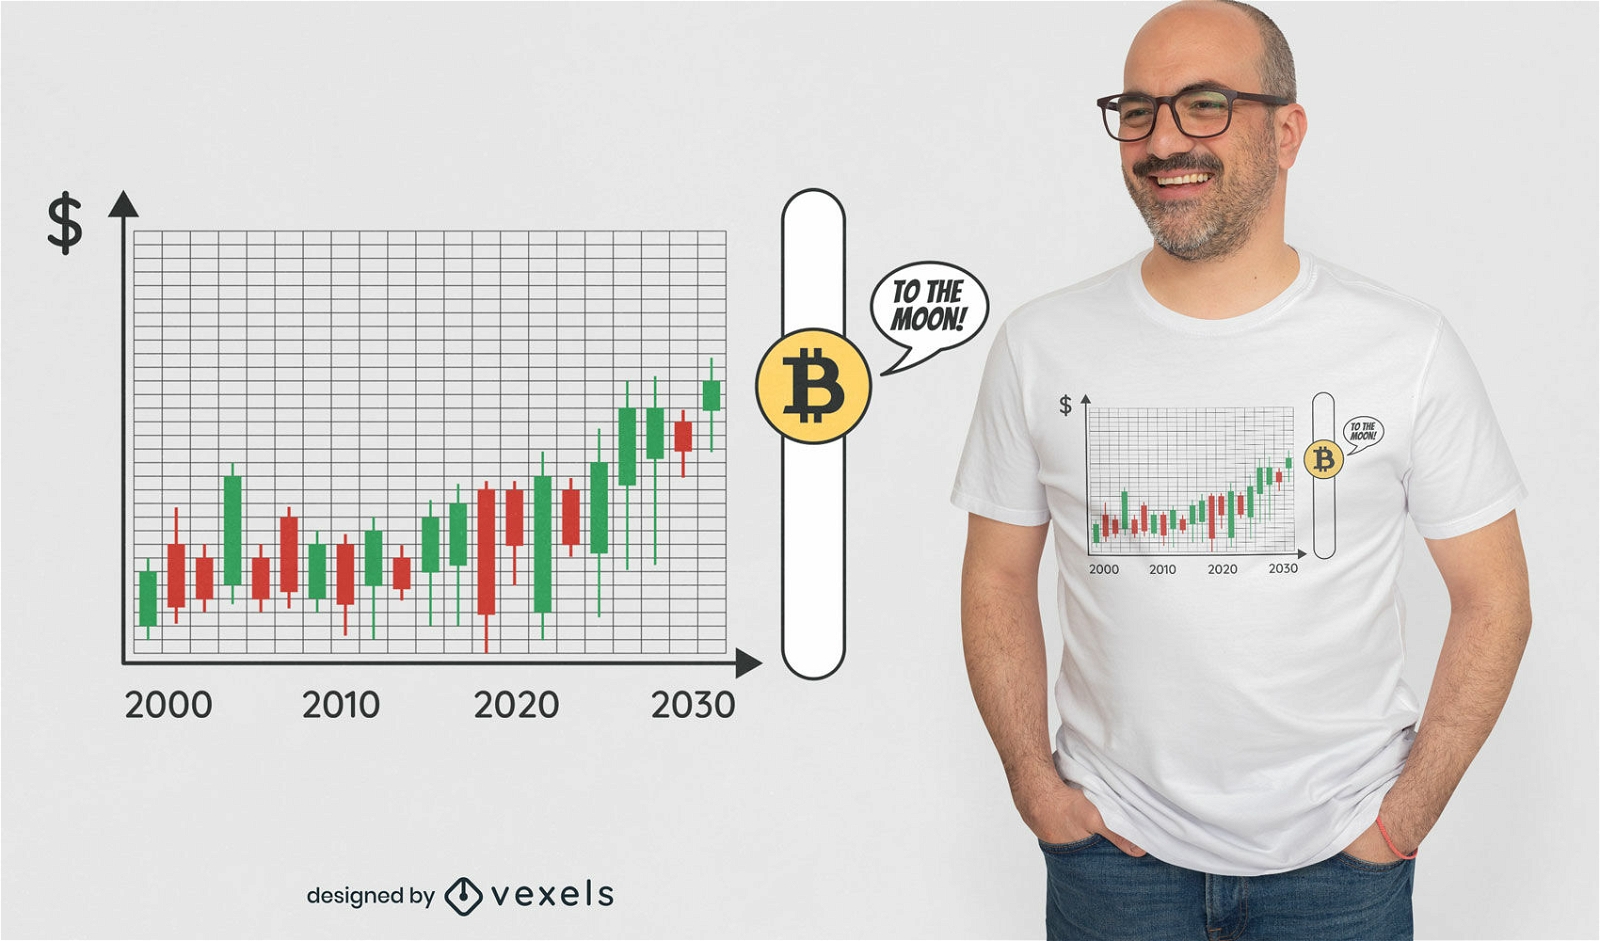
Crypto Currency graphic T-shirt Design
Choose a folder
All favorites
Create new
Save
Crypto Currency graphic T-shirt Design
Print ready
for Merch
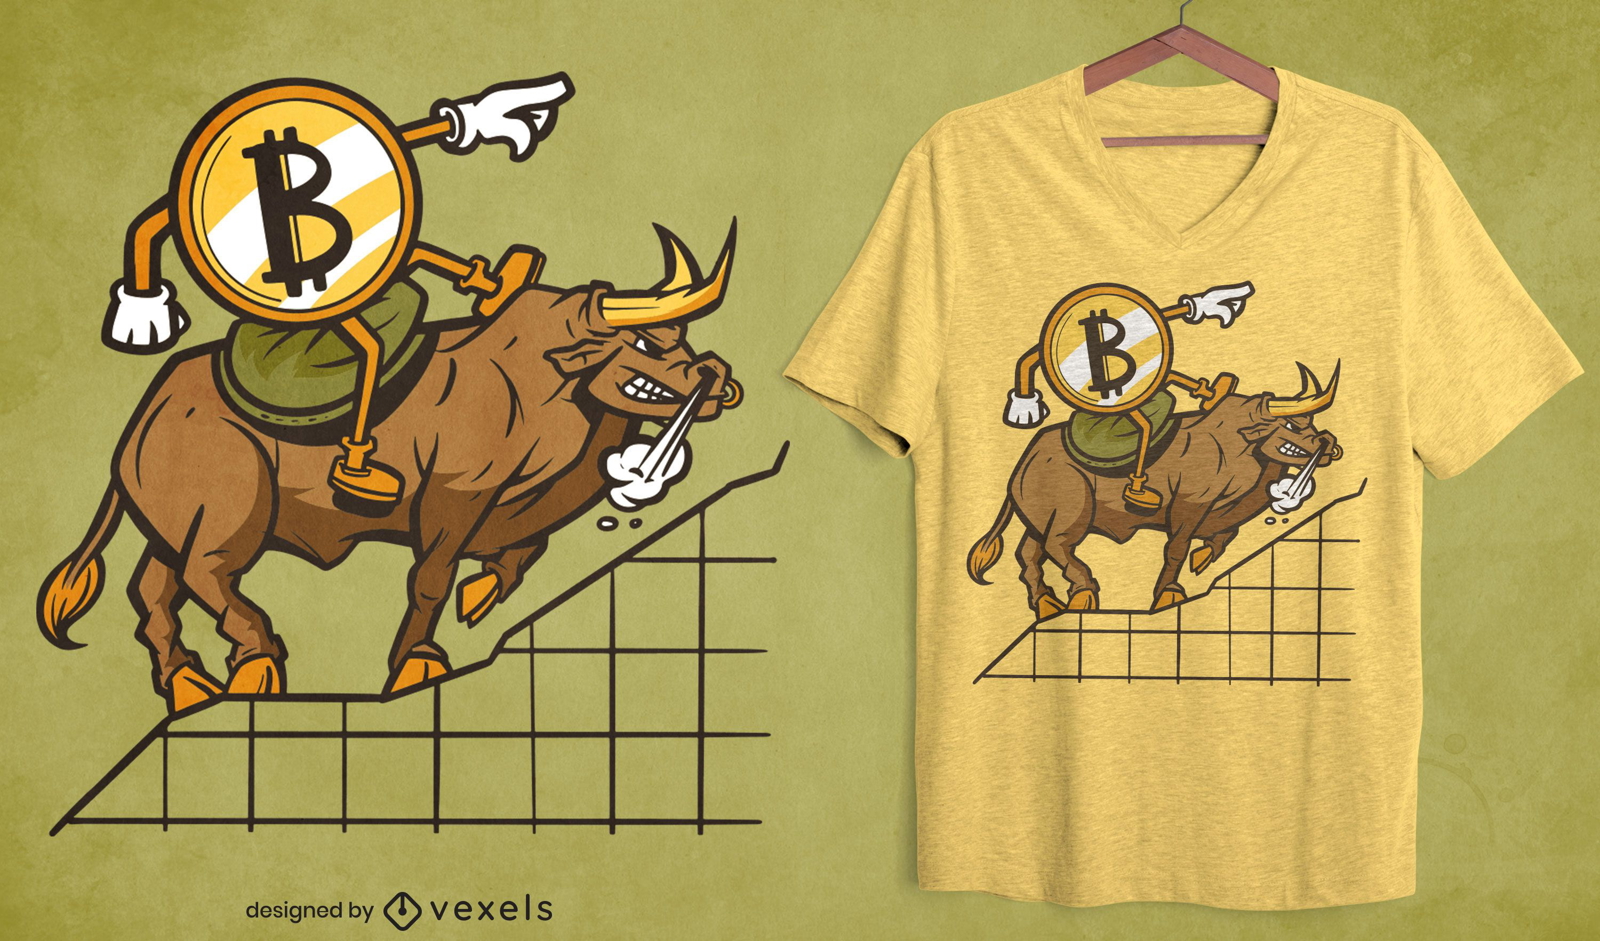
Crypto cartoon riding bull t-shirt design
Choose a folder
All favorites
Create new
Save
Crypto cartoon riding bull t-shirt design
Print ready
for Merch
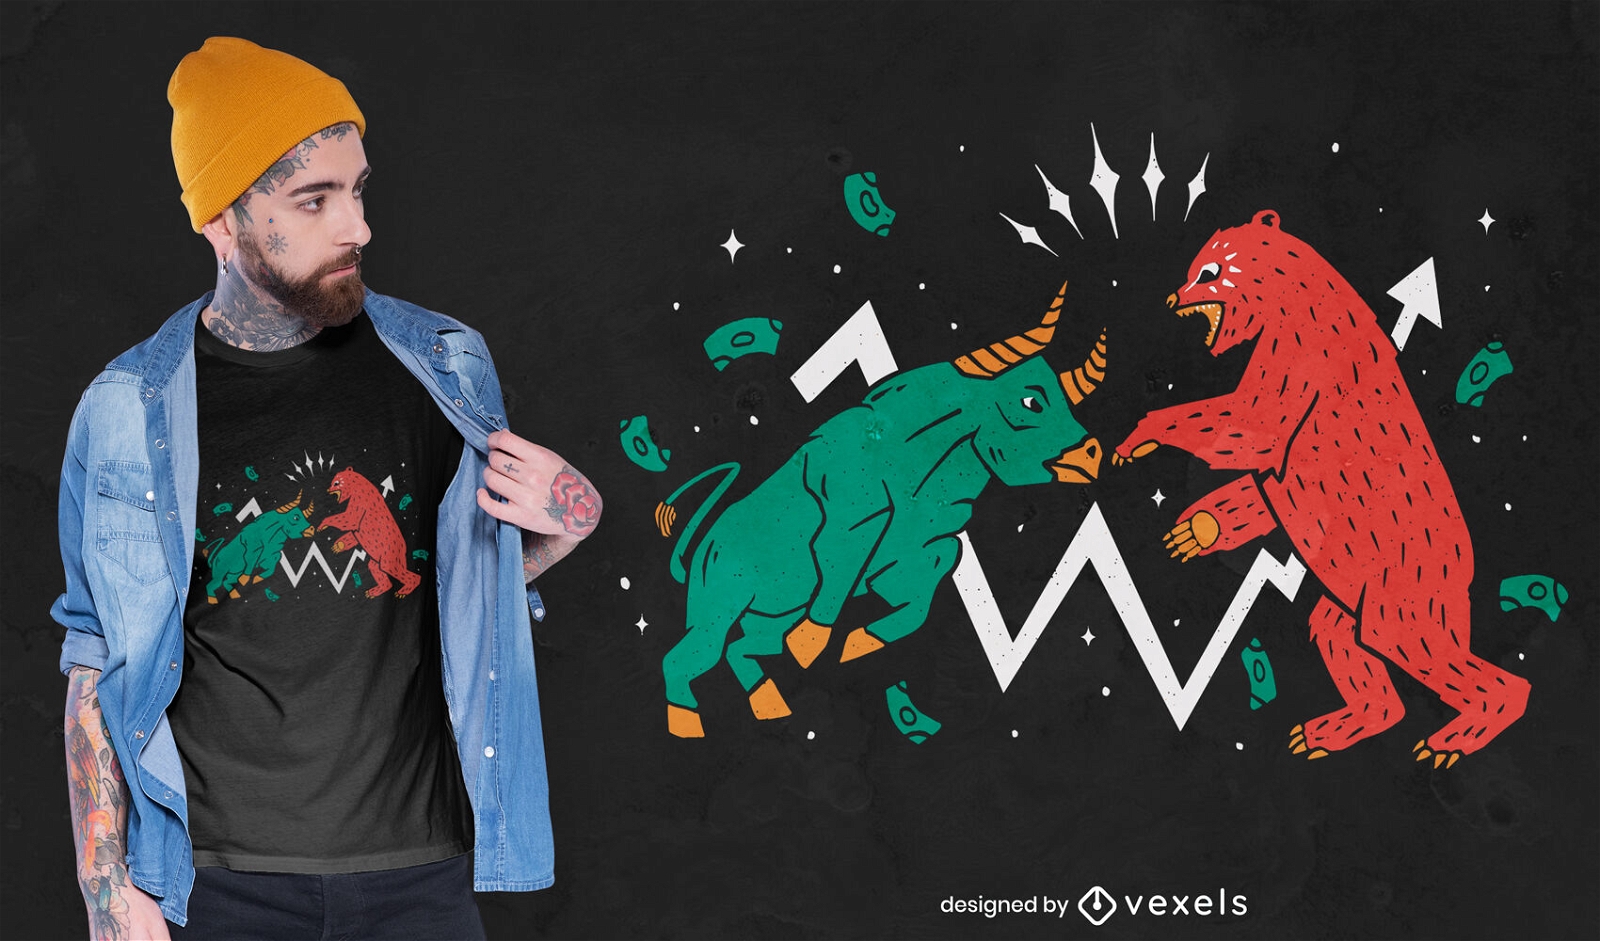
Bull and bear animal fight t-shirt design
Choose a folder
All favorites
Create new
Save
Bull and bear animal fight t-shirt design
Print ready
for Merch
Day Trader Finances T-shirt Design
Choose a folder
All favorites
Create new
Save
Day Trader Finances T-shirt Design
Print ready
for Merch
Stocks Shareholders T-Shirt Design
Choose a folder
All favorites
Create new
Save
Stocks Shareholders T-Shirt Design
Subscribe
To Get High-Quality Commercial Use Designs For Your Business
SEE PLANS
of 4
prev page
next page