Design Library
New Merch Designs
T-Shirts
Vectors
Trending Merch Designs
PNGs & SVGs
Mockups
T-Shirt PSD Templates
Explore Designs
KDP Designs
Posters
Mugs
Phone Cases
Tote Bags
Pillows
Design Tools
Merch Designer
New!
Mockup Generator
AI Design Generator
Image Vectorizer
Quote Generator
T-Shirt Maker (Old)
Resources
Merch Digest
Blog
Help Center
Learn About Merch
Feedback
Corporate Solutions
Enterprise
API Access
Design Studio
Bulk Design Production
Pricing
Loading...
Sign Up
Login
PNG
chart
Design Library
New Merch Designs
T-Shirts
Vectors
Trending Merch Designs
PNGs & SVGs
Mockups
T-Shirt PSD Templates
Explore Designs
KDP Designs
Posters
Mugs
Phone Cases
Tote Bags
Pillows
Design Tools
Merch Designer
New!
Mockup Generator
AI Design Generator
Image Vectorizer
Quote Generator
T-Shirt Maker (Old)
Resources
Merch Digest
Blog
Help Center
Learn About Merch
Feedback
Corporate Solutions
Enterprise
API Access
Design Studio
Bulk Design Production
PLANS
PNG
chart
276 chart PNG and SVG Editable Vectors
Download editable chart PNG and SVG Vectors with transparent background.
Related:
charts
,
pie chart
,
pie charts
Sort by
Most relevant
Sponsored results by
Get 15% off with code: VEXELS15
Show more
Premium
Graph bar chart icon PNG Design
Choose a folder
All favorites
Create new
Save
Graph bar chart icon PNG Design
Premium
Graph pie chart icon PNG Design
Choose a folder
All favorites
Create new
Save
Graph pie chart icon PNG Design
Premium
Refill water drinking chart PNG Design
Choose a folder
All favorites
Create new
Save
Refill water drinking chart PNG Design
Premium
Solar system cut out design PNG Design
Choose a folder
All favorites
Create new
Save
Solar system cut out design PNG Design
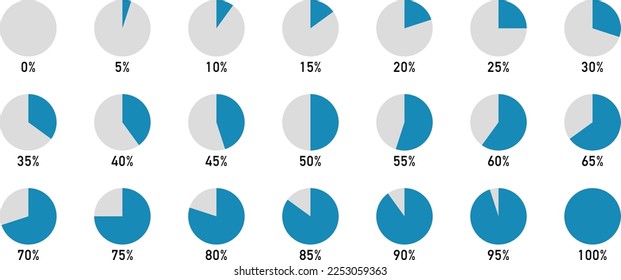
50 percent progress circle PNG Design
Choose a folder
All favorites
Create new
Save
50 percent progress circle PNG Design
Premium
Male body medical pose PNG Design
Choose a folder
All favorites
Create new
Save
Male body medical pose PNG Design
Businessman cartoon showing graph tab PNG Design
Choose a folder
All favorites
Create new
Save
Businessman cartoon showing graph tab PNG Design
100 percent circle graph PNG Design
Choose a folder
All favorites
Create new
Save
100 percent circle graph PNG Design
Premium
Marketing graph icon PNG Design
Choose a folder
All favorites
Create new
Save
Marketing graph icon PNG Design
Premium
Person infographic pie PNG Design
Choose a folder
All favorites
Create new
Save
Person infographic pie PNG Design
Premium
Graph circle icon PNG Design
Choose a folder
All favorites
Create new
Save
Graph circle icon PNG Design
25 percent circular progress tag PNG Design
Choose a folder
All favorites
Create new
Save
25 percent circular progress tag PNG Design
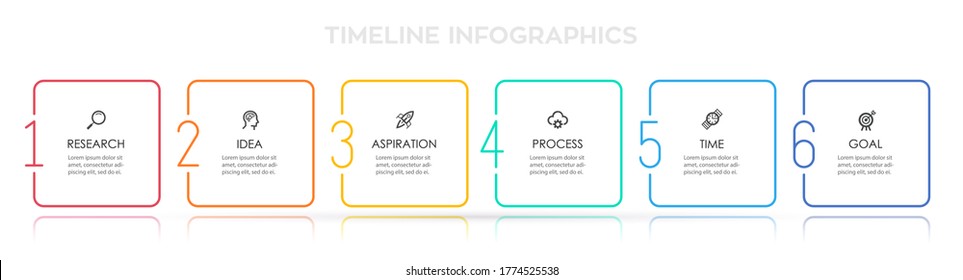
Production to delivery diagram PNG Design
Choose a folder
All favorites
Create new
Save
Production to delivery diagram PNG Design
Premium
Growing bar graphs PNG Design
Choose a folder
All favorites
Create new
Save
Growing bar graphs PNG Design
Premium
Female body medical pose PNG Design
Choose a folder
All favorites
Create new
Save
Female body medical pose PNG Design
Premium
Black tarot card telling the fortune PNG Design
Choose a folder
All favorites
Create new
Save
Black tarot card telling the fortune PNG Design
Colorful balloons infographic diagram PNG Design
Choose a folder
All favorites
Create new
Save
Colorful balloons infographic diagram PNG Design
75 percent progress circle PNG Design
Choose a folder
All favorites
Create new
Save
75 percent progress circle PNG Design
Premium
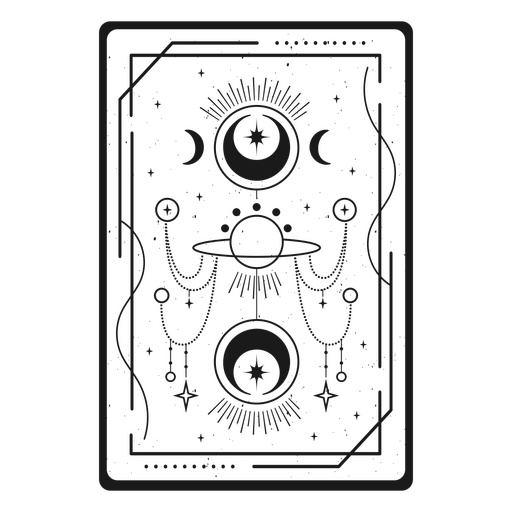
Esoteric tarot card PNG Design
Choose a folder
All favorites
Create new
Save
Esoteric tarot card PNG Design
Premium
Infographic 100 percent doodle PNG Design
Choose a folder
All favorites
Create new
Save
Infographic 100 percent doodle PNG Design
Premium
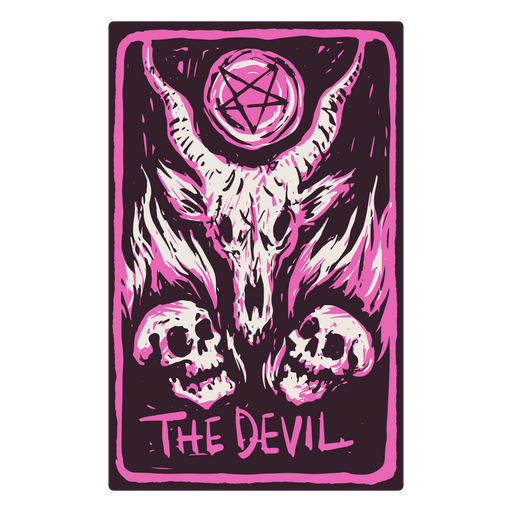
The Devil card in a skeleton-themed tarot PNG Design
Choose a folder
All favorites
Create new
Save
The Devil card in a skeleton-themed tarot PNG Design
Premium
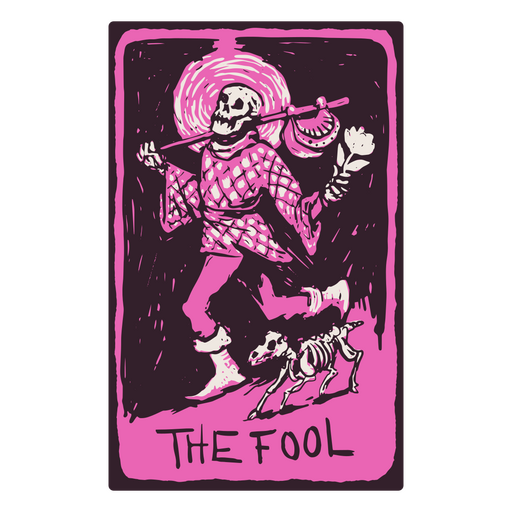
The Fool card in a skeleton-themed tarot PNG Design
Choose a folder
All favorites
Create new
Save
The Fool card in a skeleton-themed tarot PNG Design
Hand drawn bar graph PNG Design
Choose a folder
All favorites
Create new
Save
Hand drawn bar graph PNG Design
Premium
Growth graph doodle PNG Design
Choose a folder
All favorites
Create new
Save
Growth graph doodle PNG Design
Premium
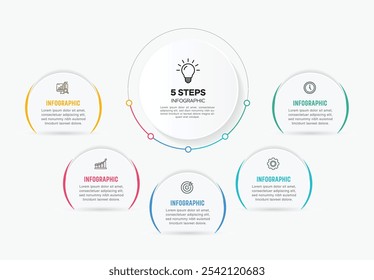
Multistage round icons infographic PNG Design
Choose a folder
All favorites
Create new
Save
Multistage round icons infographic PNG Design
Female body diagram PNG Design
Choose a folder
All favorites
Create new
Save
Female body diagram PNG Design
Premium
Marketing to conversion PNG Design
Choose a folder
All favorites
Create new
Save
Marketing to conversion PNG Design
Premium
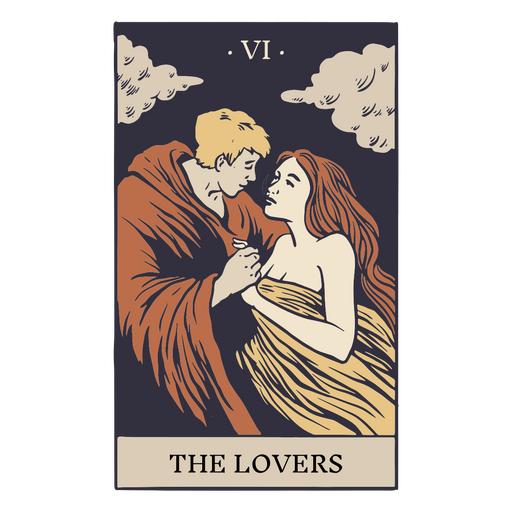
Eye-catching Lovers tarot card PNG Design
Choose a folder
All favorites
Create new
Save
Eye-catching Lovers tarot card PNG Design
Premium
The Justice card in a skeleton-themed tarot PNG Design
Choose a folder
All favorites
Create new
Save
The Justice card in a skeleton-themed tarot PNG Design
Premium
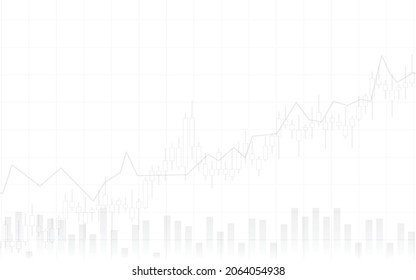
Line graph 7 PNG Design
Choose a folder
All favorites
Create new
Save
Line graph 7 PNG Design
Premium
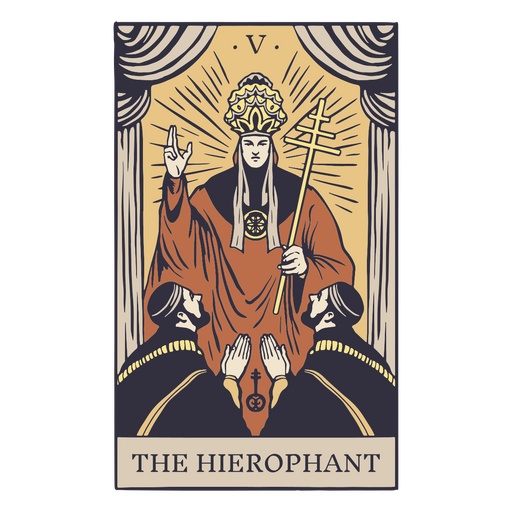
The hierophant tarot card PNG Design
Choose a folder
All favorites
Create new
Save
The hierophant tarot card PNG Design
Bubbles icons squares diagram PNG Design
Choose a folder
All favorites
Create new
Save
Bubbles icons squares diagram PNG Design
Premium
Scorpio sign in the horoscope PNG Design
Choose a folder
All favorites
Create new
Save
Scorpio sign in the horoscope PNG Design
Premium
Business presentation board PNG Design
Choose a folder
All favorites
Create new
Save
Business presentation board PNG Design
Premium
Live by the sun love by the moon PNG Design
Choose a folder
All favorites
Create new
Save
Live by the sun love by the moon PNG Design
Premium
Hand drawn graph bars PNG Design
Choose a folder
All favorites
Create new
Save
Hand drawn graph bars PNG Design
Premium
Leo sign in the horoscope PNG Design
Choose a folder
All favorites
Create new
Save
Leo sign in the horoscope PNG Design
Premium
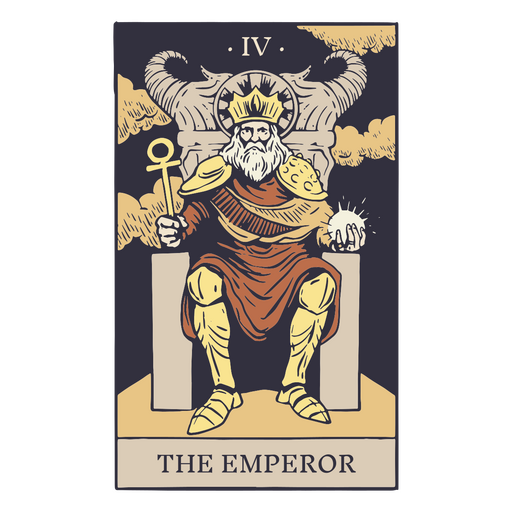
The emperor tarot card PNG Design
Choose a folder
All favorites
Create new
Save
The emperor tarot card PNG Design
Premium
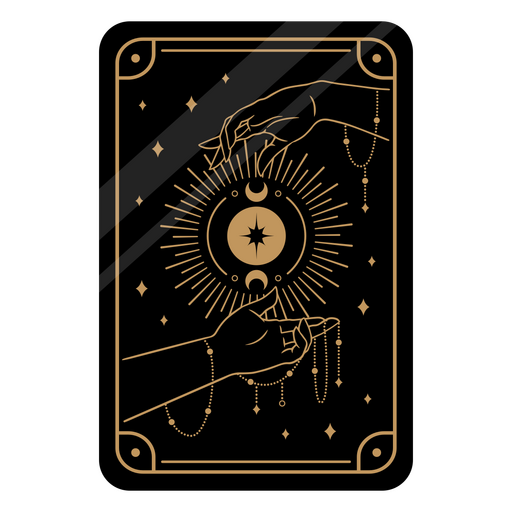
Black tarot card PNG Design
Choose a folder
All favorites
Create new
Save
Black tarot card PNG Design
Office staff working desk PNG Design
Choose a folder
All favorites
Create new
Save
Office staff working desk PNG Design
Bar graph infographic 5 PNG Design
Choose a folder
All favorites
Create new
Save
Bar graph infographic 5 PNG Design
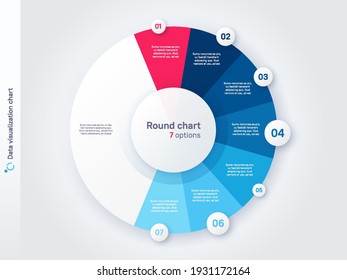
5 parts piechart with boxes PNG Design
Choose a folder
All favorites
Create new
Save
5 parts piechart with boxes PNG Design
Double graph linechart infographic PNG Design
Choose a folder
All favorites
Create new
Save
Double graph linechart infographic PNG Design
Premium
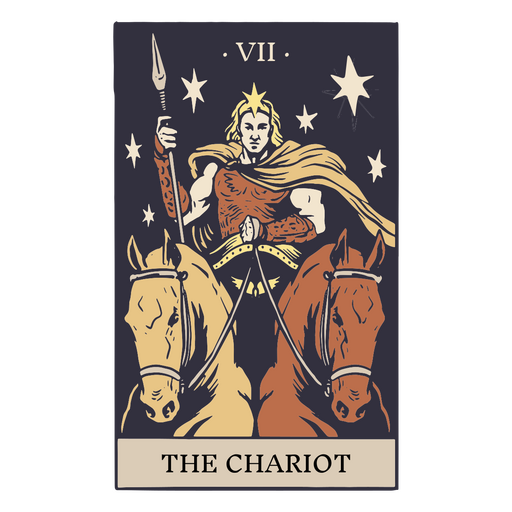
The chariot tarot card PNG Design
Choose a folder
All favorites
Create new
Save
The chariot tarot card PNG Design
Premium
The Magician card in a skeleton-themed tarot PNG Design
Choose a folder
All favorites
Create new
Save
The Magician card in a skeleton-themed tarot PNG Design
Premium
The Moon in a tarot card PNG Design
Choose a folder
All favorites
Create new
Save
The Moon in a tarot card PNG Design
Premium
Glossy colorful piechart with boxes PNG Design
Choose a folder
All favorites
Create new
Save
Glossy colorful piechart with boxes PNG Design
Graph bars doodle PNG Design
Choose a folder
All favorites
Create new
Save
Graph bars doodle PNG Design
Premium
Purple fortune tarot PNG Design
Choose a folder
All favorites
Create new
Save
Purple fortune tarot PNG Design
Premium
The High Priestess card in a skeleton-themed tarot PNG Design
Choose a folder
All favorites
Create new
Save
The High Priestess card in a skeleton-themed tarot PNG Design
Subscribe
To Get High-Quality Commercial Use Designs For Your Business
SEE PLANS
Next
of 6
prev page
next page