Design Library
New Merch Designs
T-Shirts
Vectors
Trending Merch Designs
PNGs & SVGs
Mockups
T-Shirt PSD Templates
Explore Designs
KDP Designs
Posters
Mugs
Phone Cases
Tote Bags
Pillows
Design Tools
Merch Designer
New!
Mockup Generator
AI Design Generator
Image Vectorizer
Quote Generator
T-Shirt Maker (Old)
Resources
Merch Digest
Blog
Help Center
Learn About Merch
Feedback
Corporate Solutions
Enterprise
API Access
Design Studio
Bulk Design Production
Pricing
Loading...
Sign Up
Login
PNG
chart
Design Library
New Merch Designs
T-Shirts
Vectors
Trending Merch Designs
PNGs & SVGs
Mockups
T-Shirt PSD Templates
Explore Designs
KDP Designs
Posters
Mugs
Phone Cases
Tote Bags
Pillows
Design Tools
Merch Designer
New!
Mockup Generator
AI Design Generator
Image Vectorizer
Quote Generator
T-Shirt Maker (Old)
Resources
Merch Digest
Blog
Help Center
Learn About Merch
Feedback
Corporate Solutions
Enterprise
API Access
Design Studio
Bulk Design Production
PLANS
PNG
chart
276 chart PNG and SVG Editable Vectors
Download editable chart PNG and SVG Vectors with transparent background.
Related:
charts
,
pie chart
,
pie charts
Sort by
Most relevant
Sponsored results by
Get 15% off with code: VEXELS15
Show more
Premium
Flat multicolor decreasing bar chart PNG Design
Choose a folder
All favorites
Create new
Save
Flat multicolor decreasing bar chart PNG Design
Premium
3 parts pie chart PNG Design
Choose a folder
All favorites
Create new
Save
3 parts pie chart PNG Design
Premium
Purple pie chart PNG Design
Choose a folder
All favorites
Create new
Save
Purple pie chart PNG Design
Premium
Graphic chart board stroke icon PNG Design
Choose a folder
All favorites
Create new
Save
Graphic chart board stroke icon PNG Design
Money chart flat icon PNG Design
Choose a folder
All favorites
Create new
Save
Money chart flat icon PNG Design
Money chart stroke icon PNG Design
Choose a folder
All favorites
Create new
Save
Money chart stroke icon PNG Design
Premium
Proportion pie chart doodle PNG Design
Choose a folder
All favorites
Create new
Save
Proportion pie chart doodle PNG Design
Premium
Chart columns 3d doodle PNG Design
Choose a folder
All favorites
Create new
Save
Chart columns 3d doodle PNG Design
Premium
Green red rhomb chart PNG Design
Choose a folder
All favorites
Create new
Save
Green red rhomb chart PNG Design
Bar chart hand drawn element PNG Design
Choose a folder
All favorites
Create new
Save
Bar chart hand drawn element PNG Design
Pie chart hand drawn element PNG Design
Choose a folder
All favorites
Create new
Save
Pie chart hand drawn element PNG Design
Premium
Website impressions chart colored stroke PNG Design
Choose a folder
All favorites
Create new
Save
Website impressions chart colored stroke PNG Design
Premium
Blue orange circles chart PNG Design
Choose a folder
All favorites
Create new
Save
Blue orange circles chart PNG Design
Premium
Blue pie chart PNG Design
Choose a folder
All favorites
Create new
Save
Blue pie chart PNG Design
Pie chart flat PNG Design
Choose a folder
All favorites
Create new
Save
Pie chart flat PNG Design
Premium
Splitted pie chart icon PNG Design
Choose a folder
All favorites
Create new
Save
Splitted pie chart icon PNG Design
Blue grey orange pie chart PNG Design
Choose a folder
All favorites
Create new
Save
Blue grey orange pie chart PNG Design
Multiple line chart hand drawn element PNG Design
Choose a folder
All favorites
Create new
Save
Multiple line chart hand drawn element PNG Design
Pie chart stroke PNG Design
Choose a folder
All favorites
Create new
Save
Pie chart stroke PNG Design
Premium
Multicolor rounded edge bar chart PNG Design
Choose a folder
All favorites
Create new
Save
Multicolor rounded edge bar chart PNG Design
Premium
Three parts pie chart PNG Design
Choose a folder
All favorites
Create new
Save
Three parts pie chart PNG Design
Bauble christmas pie chart PNG Design
Choose a folder
All favorites
Create new
Save
Bauble christmas pie chart PNG Design
Chart on monitor icon PNG Design
Choose a folder
All favorites
Create new
Save
Chart on monitor icon PNG Design
Chart on smartphone icon PNG Design
Choose a folder
All favorites
Create new
Save
Chart on smartphone icon PNG Design
Premium
Pie chart percetage PNG Design
Choose a folder
All favorites
Create new
Save
Pie chart percetage PNG Design
Premium
Two parts bars chart 3 PNG Design
Choose a folder
All favorites
Create new
Save
Two parts bars chart 3 PNG Design
Premium
Pie chart icon PNG Design
Choose a folder
All favorites
Create new
Save
Pie chart icon PNG Design
Premium
Flat pie chart icon PNG Design
Choose a folder
All favorites
Create new
Save
Flat pie chart icon PNG Design
Purple pie chart line icon.svg PNG Design
Choose a folder
All favorites
Create new
Save
Purple pie chart line icon.svg PNG Design
Premium
Quarter pie chart shape PNG Design
Choose a folder
All favorites
Create new
Save
Quarter pie chart shape PNG Design
Premium
Orange green circles chart PNG Design
Choose a folder
All favorites
Create new
Save
Orange green circles chart PNG Design
Premium
Golden pie chart PNG Design
Choose a folder
All favorites
Create new
Save
Golden pie chart PNG Design
Box plot chart hand drawn element PNG Design
Choose a folder
All favorites
Create new
Save
Box plot chart hand drawn element PNG Design
3 part pie chart PNG Design
Choose a folder
All favorites
Create new
Save
3 part pie chart PNG Design
Pie chart eleven parts hand drawn element PNG Design
Choose a folder
All favorites
Create new
Save
Pie chart eleven parts hand drawn element PNG Design
3 part chirstmas pie chart PNG Design
Choose a folder
All favorites
Create new
Save
3 part chirstmas pie chart PNG Design
Area chart high school hand drawn element PNG Design
Choose a folder
All favorites
Create new
Save
Area chart high school hand drawn element PNG Design
Premium
Chart shape PNG Design
Choose a folder
All favorites
Create new
Save
Chart shape PNG Design
Premium
Chart shape stroke PNG Design
Choose a folder
All favorites
Create new
Save
Chart shape stroke PNG Design
Pie chart hand drawn PNG Design
Choose a folder
All favorites
Create new
Save
Pie chart hand drawn PNG Design
Premium
Rounded chart shape PNG Design
Choose a folder
All favorites
Create new
Save
Rounded chart shape PNG Design
Premium
Green pie chart PNG Design
Choose a folder
All favorites
Create new
Save
Green pie chart PNG Design
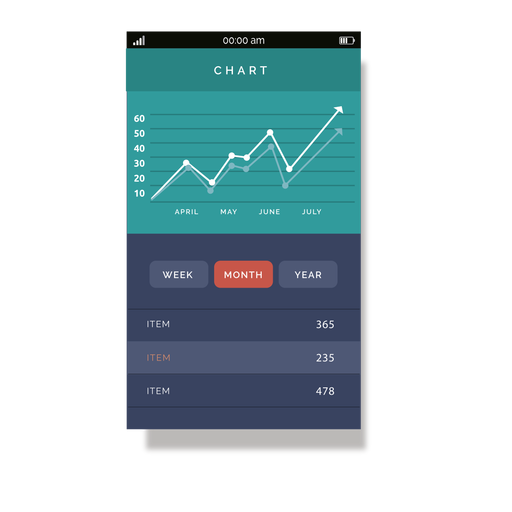
Premium
Green mobile chart interface PNG Design
Choose a folder
All favorites
Create new
Save
Green mobile chart interface PNG Design
Premium
Red pie chart PNG Design
Choose a folder
All favorites
Create new
Save
Red pie chart PNG Design
Premium
Tab with chart PNG Design
Choose a folder
All favorites
Create new
Save
Tab with chart PNG Design
Donut chart hand drawn PNG Design
Choose a folder
All favorites
Create new
Save
Donut chart hand drawn PNG Design
Premium
Blue orange rhomb chart PNG Design
Choose a folder
All favorites
Create new
Save
Blue orange rhomb chart PNG Design
Large 3d bar chart hand drawing PNG Design
Choose a folder
All favorites
Create new
Save
Large 3d bar chart hand drawing PNG Design
3d bar chart hand drawn PNG Design
Choose a folder
All favorites
Create new
Save
3d bar chart hand drawn PNG Design
Premium
Melanin pantone chart PNG Design
Choose a folder
All favorites
Create new
Save
Melanin pantone chart PNG Design
Subscribe
To Get High-Quality Commercial Use Designs For Your Business
SEE PLANS
Next
of 6
prev page
next page