Design Library
New Merch Designs
T-Shirts
Vectors
Trending Merch Designs
PNGs & SVGs
Mockups
T-Shirt PSD Templates
Explore Designs
KDP Designs
Posters
Mugs
Phone Cases
Tote Bags
Pillows
Design Tools
Merch Designer
New!
Mockup Generator
AI Design Generator
Image Vectorizer
Quote Generator
T-Shirt Maker (Old)
Resources
Merch Digest
Blog
Help Center
Learn About Merch
Feedback
Corporate Solutions
Enterprise
API Access
Pricing
Loading...
Sign Up
Login
Merch Vectors
grafico
Design Library
New Merch Designs
T-Shirts
Vectors
Trending Merch Designs
PNGs & SVGs
Mockups
T-Shirt PSD Templates
Explore Designs
KDP Designs
Posters
Mugs
Phone Cases
Tote Bags
Pillows
Design Tools
Merch Designer
New!
Mockup Generator
AI Design Generator
Image Vectorizer
Quote Generator
T-Shirt Maker (Old)
Resources
Merch Digest
Blog
Help Center
Learn About Merch
Feedback
Corporate Solutions
Enterprise
API Access
PLANS
Merch Vectors
grafico
35988 grafico Vector Designs for T-Shirts and merch
Download & buy editable grafico AI Vector Graphics Designs for T shirts, Phone Cases, Book Covers and other Merch
Sort by
Most relevant
Sponsored results by
Get 15% off with code: VEXELS15
Show more
Print ready
for Merch
Cockatiel with seed stick t-shirt design
Choose a folder
All favorites
Create new
Save
Cockatiel with seed stick t-shirt design
Print ready
for Merch
Cute potato character t-shirt design
Choose a folder
All favorites
Create new
Save
Cute potato character t-shirt design
Print ready
for Merch
Eclipse lines t-shirt design
Choose a folder
All favorites
Create new
Save
Eclipse lines t-shirt design
Print ready
for Merch
Hustle beats talent t-shirt design
Choose a folder
All favorites
Create new
Save
Hustle beats talent t-shirt design
Print ready
for Merch
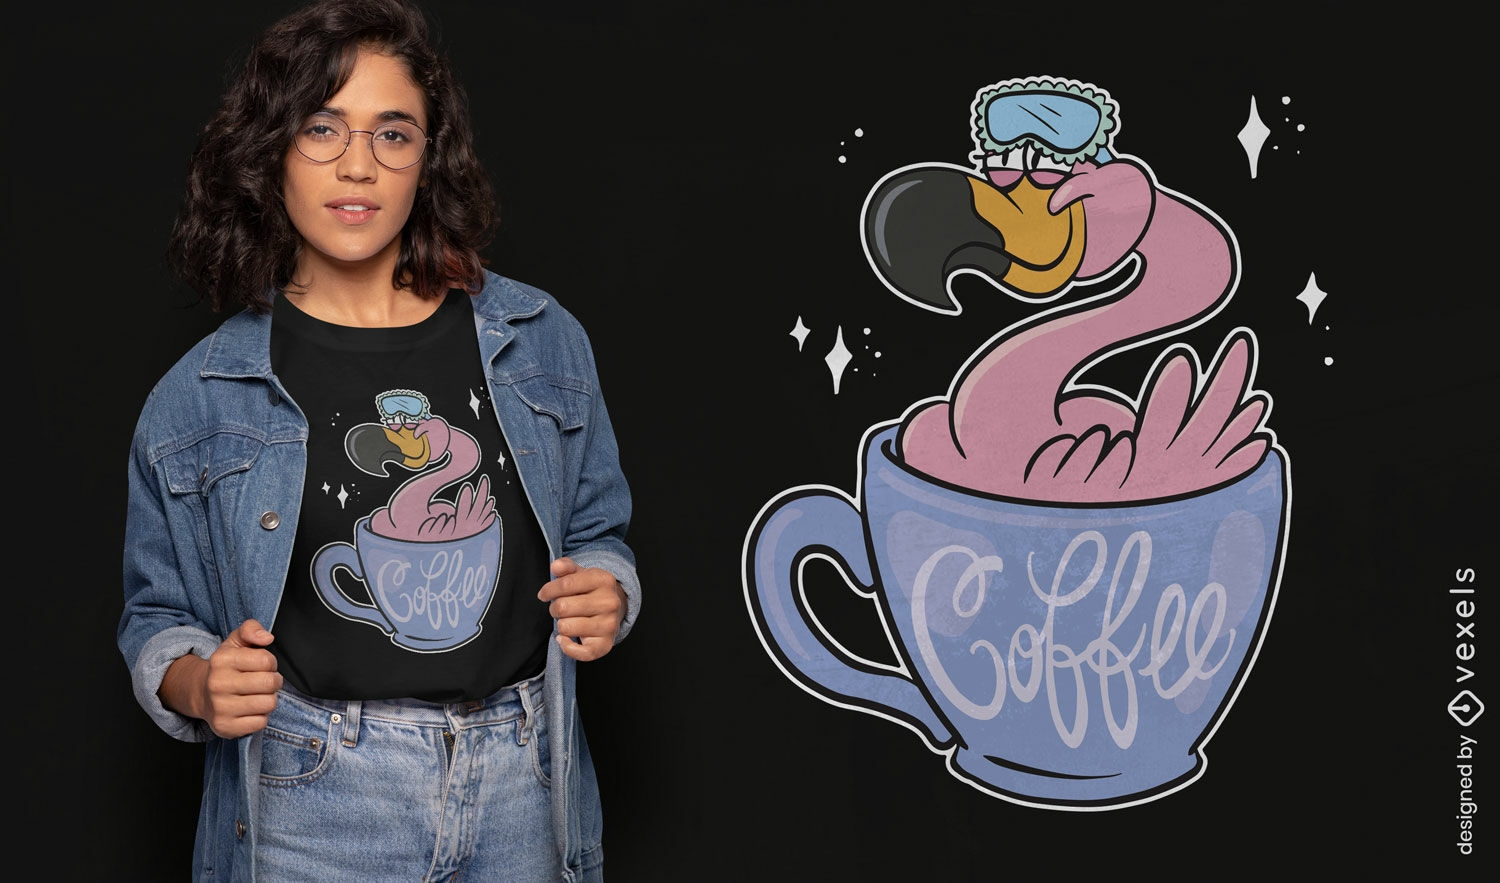
Flamingo coffee t-shirt design
Choose a folder
All favorites
Create new
Save
Flamingo coffee t-shirt design
Print ready
for Merch
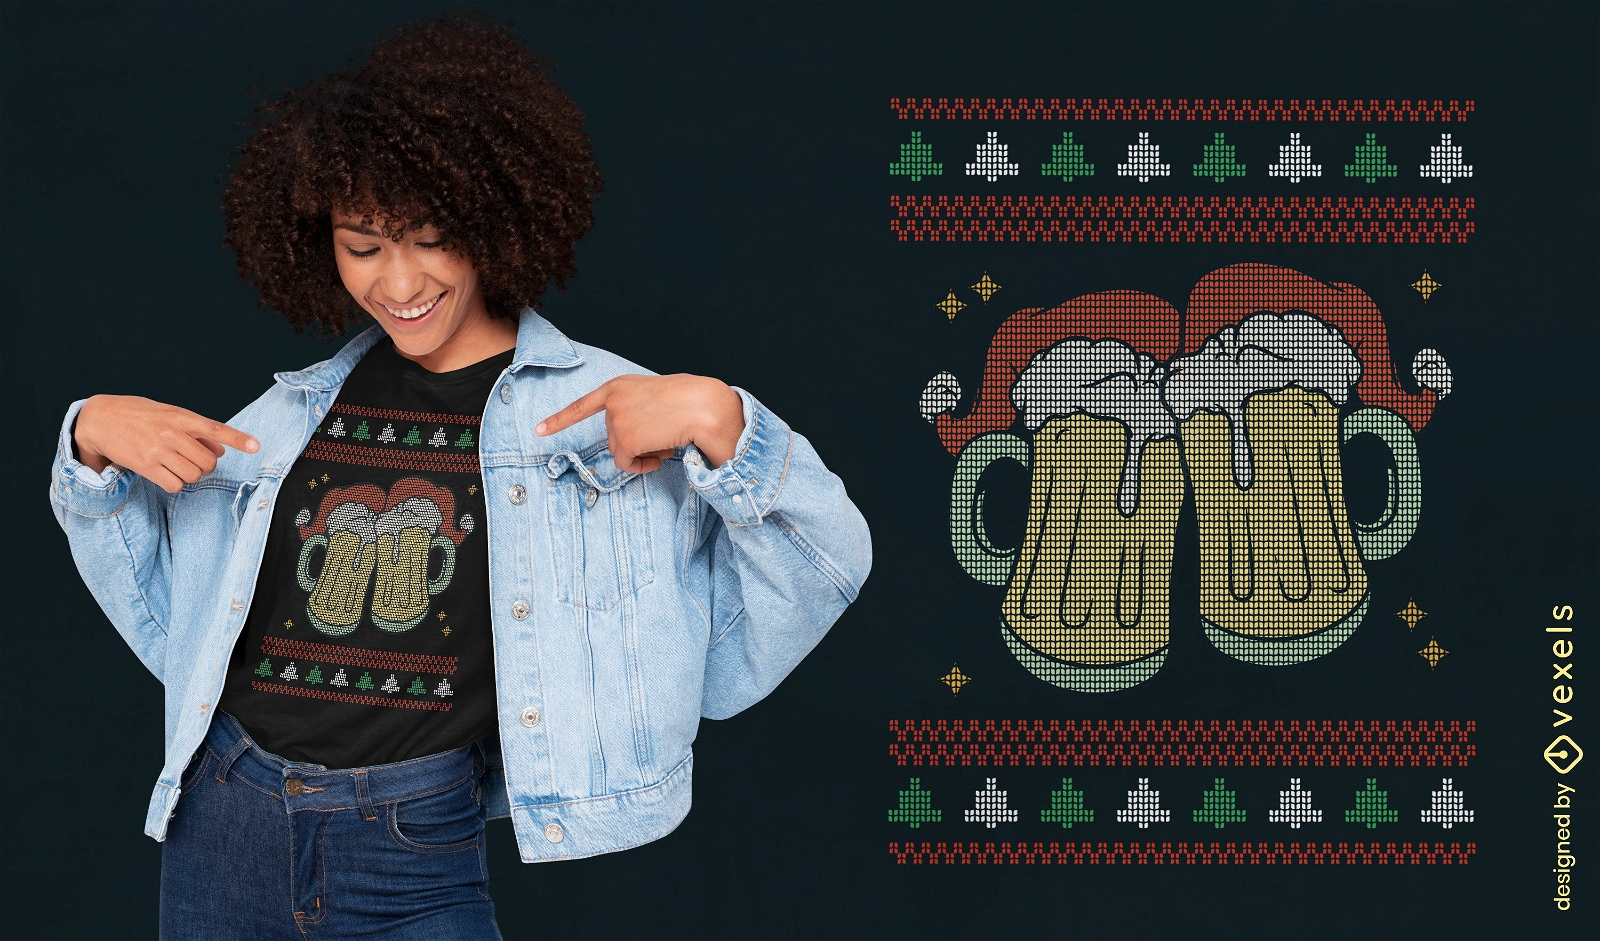
Beers in ugly sweater t-shirt design
Choose a folder
All favorites
Create new
Save
Beers in ugly sweater t-shirt design
Print ready
for Merch
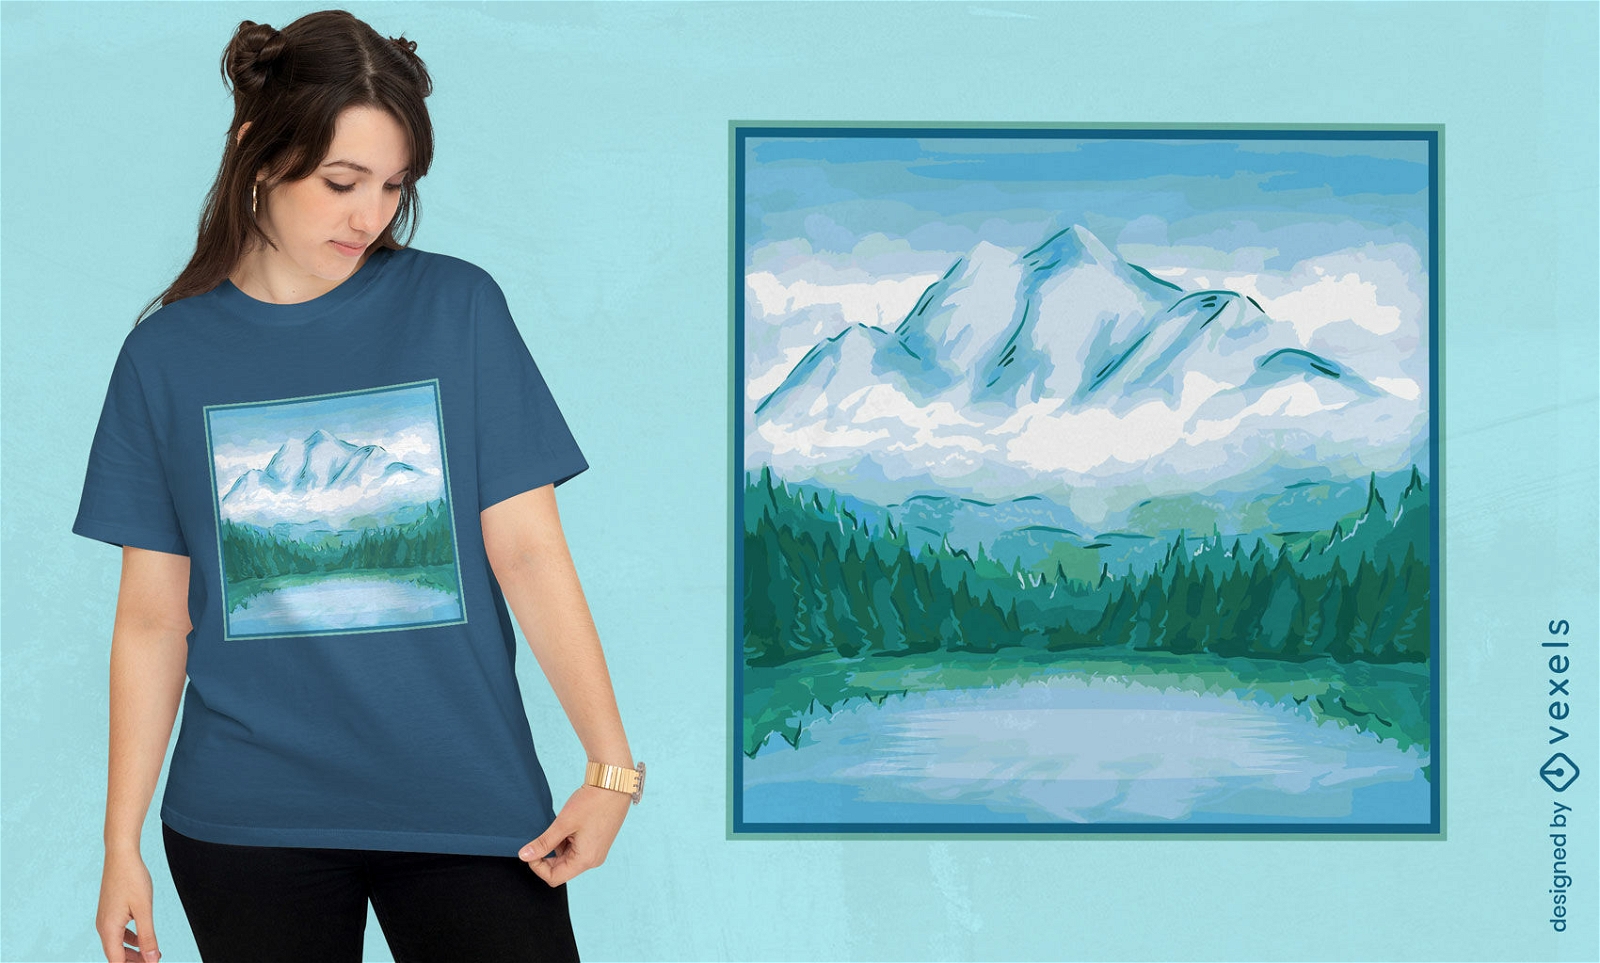
Mountain landscape watercolor portrait t-shirt design
Choose a folder
All favorites
Create new
Save
Mountain landscape watercolor portrait t-shirt design
Print ready
for Merch
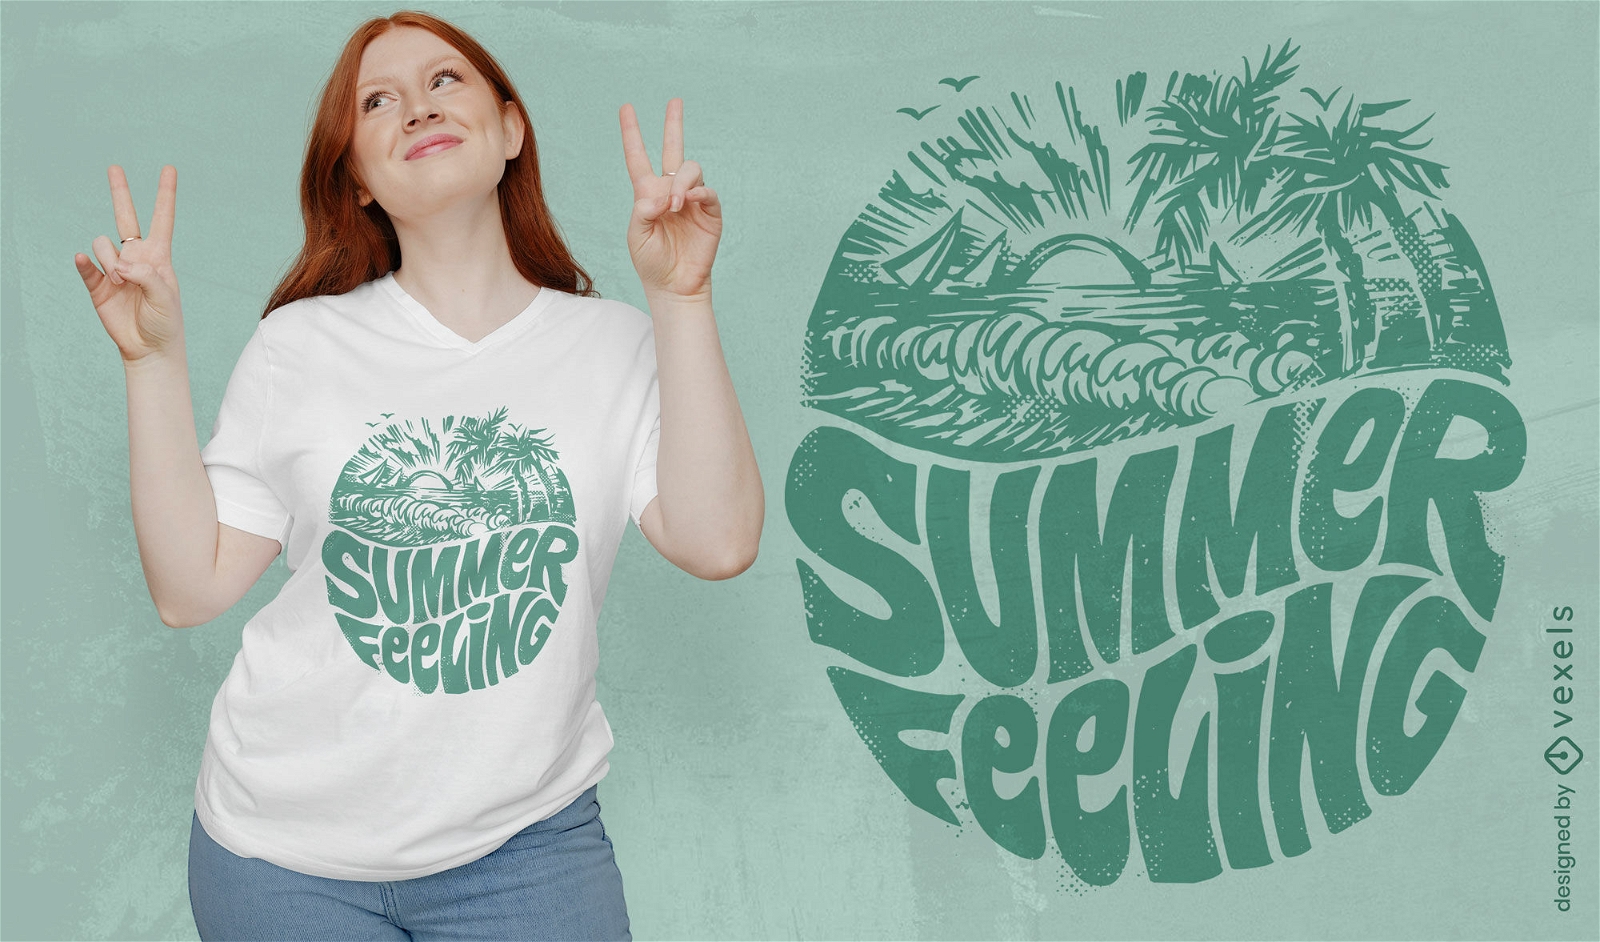
Summer feeling green t-shirt design
Choose a folder
All favorites
Create new
Save
Summer feeling green t-shirt design
Print ready
for Merch
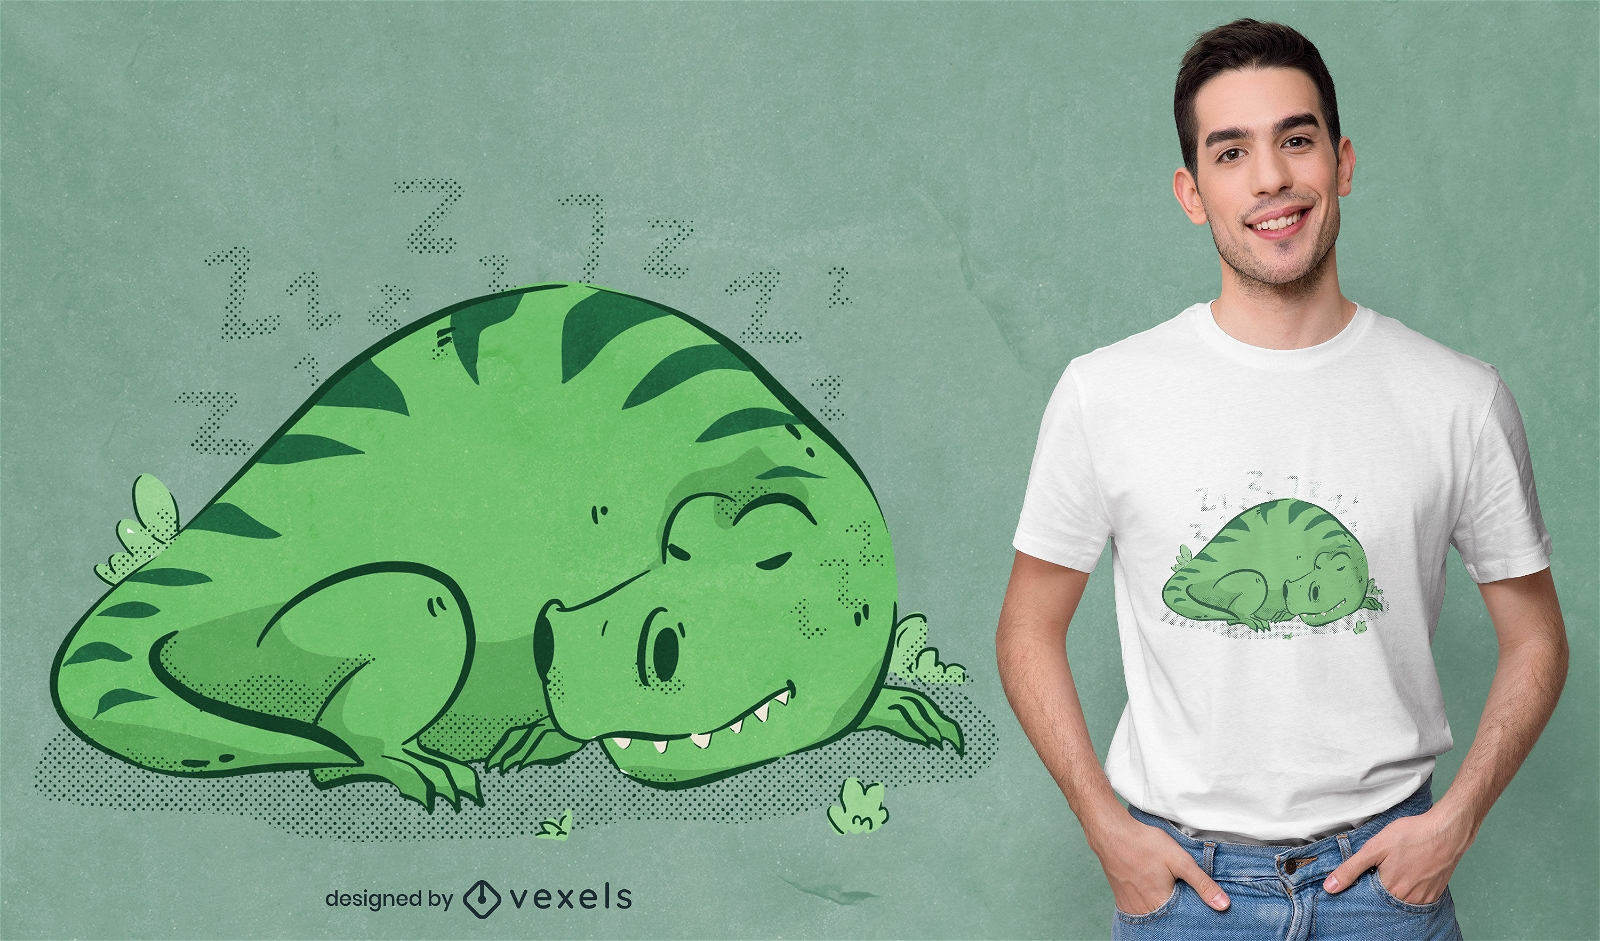
Dinosaur animal sleeping t-shirt design
Choose a folder
All favorites
Create new
Save
Dinosaur animal sleeping t-shirt design
Print ready
for Merch
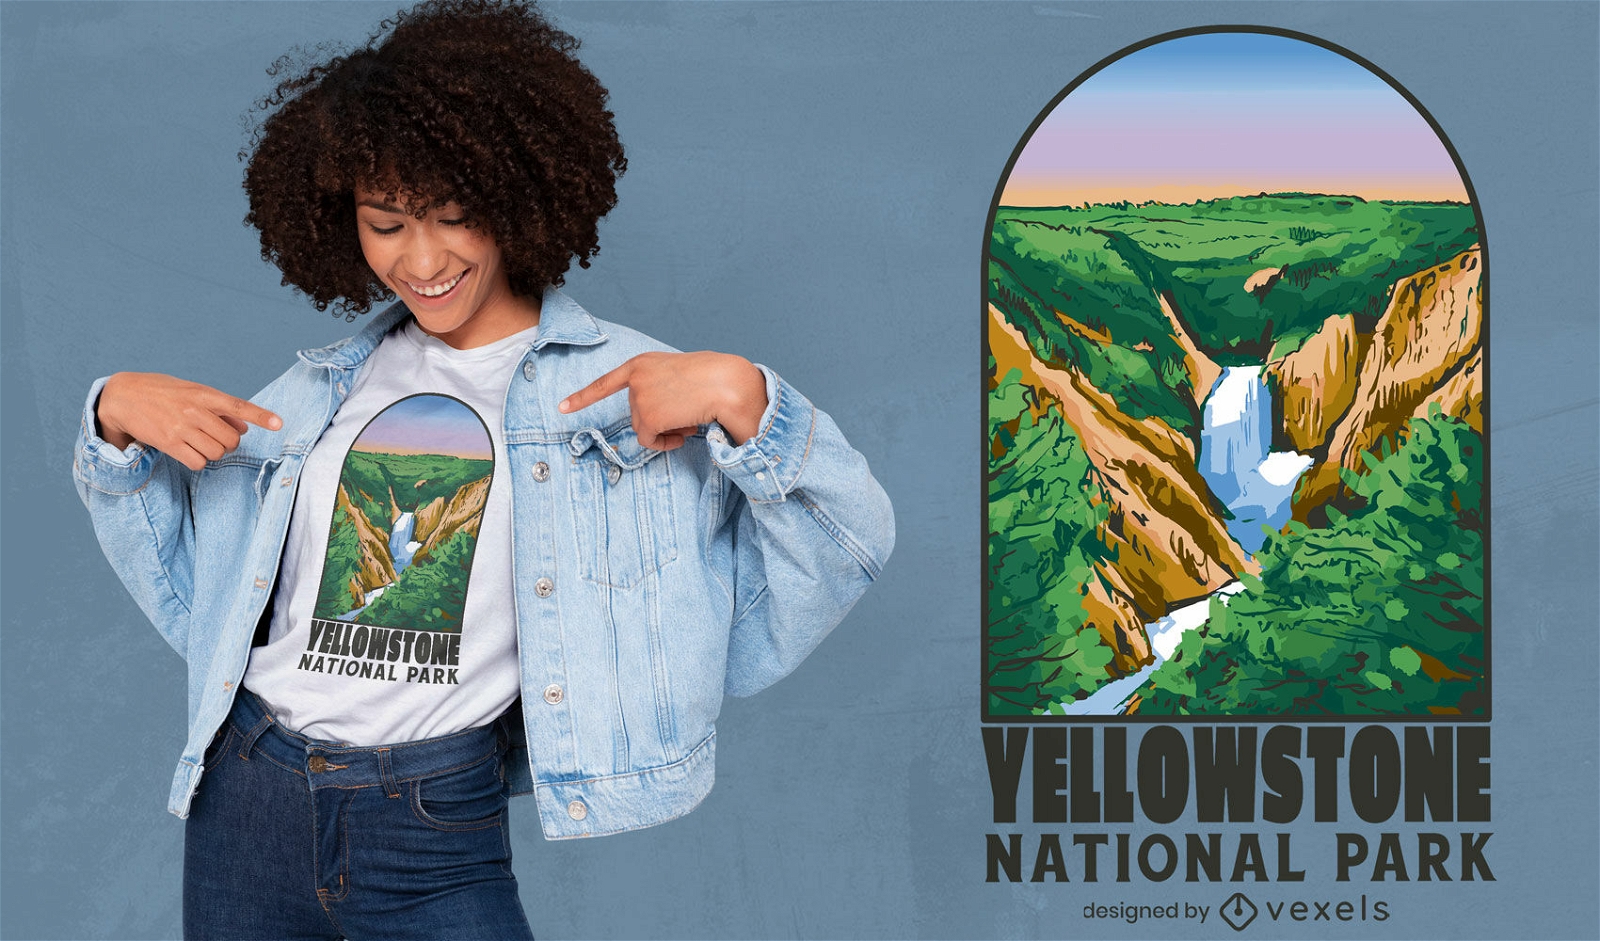
Yellowstone national park usa t-shirt design
Choose a folder
All favorites
Create new
Save
Yellowstone national park usa t-shirt design
Print ready
for Merch
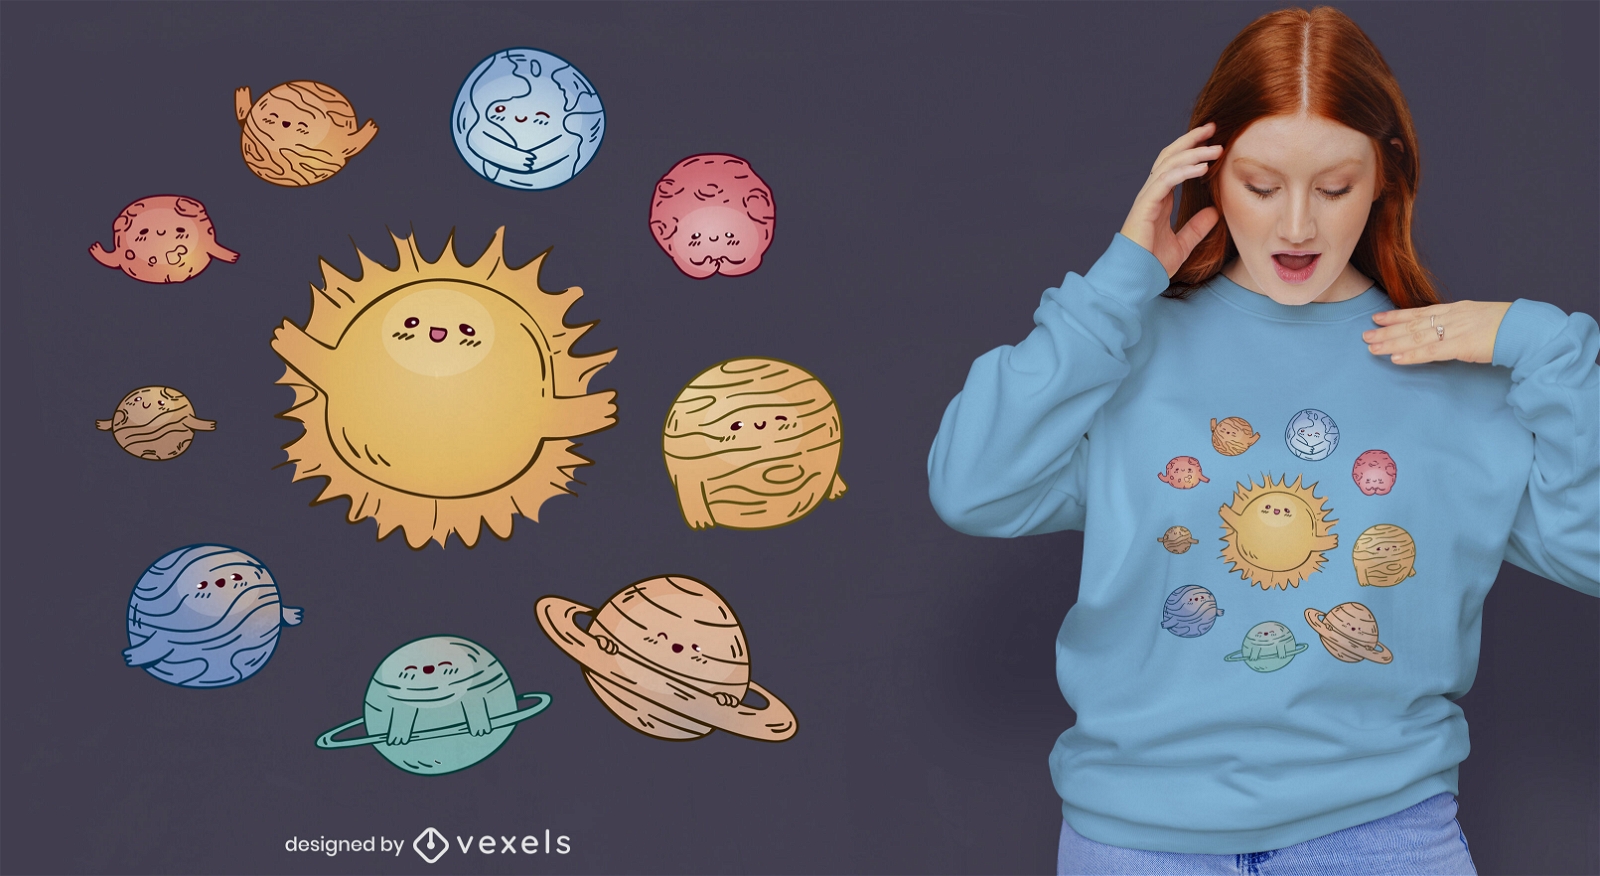
Cute solar system with planets t-shirt design
Choose a folder
All favorites
Create new
Save
Cute solar system with planets t-shirt design
Print ready
for Merch
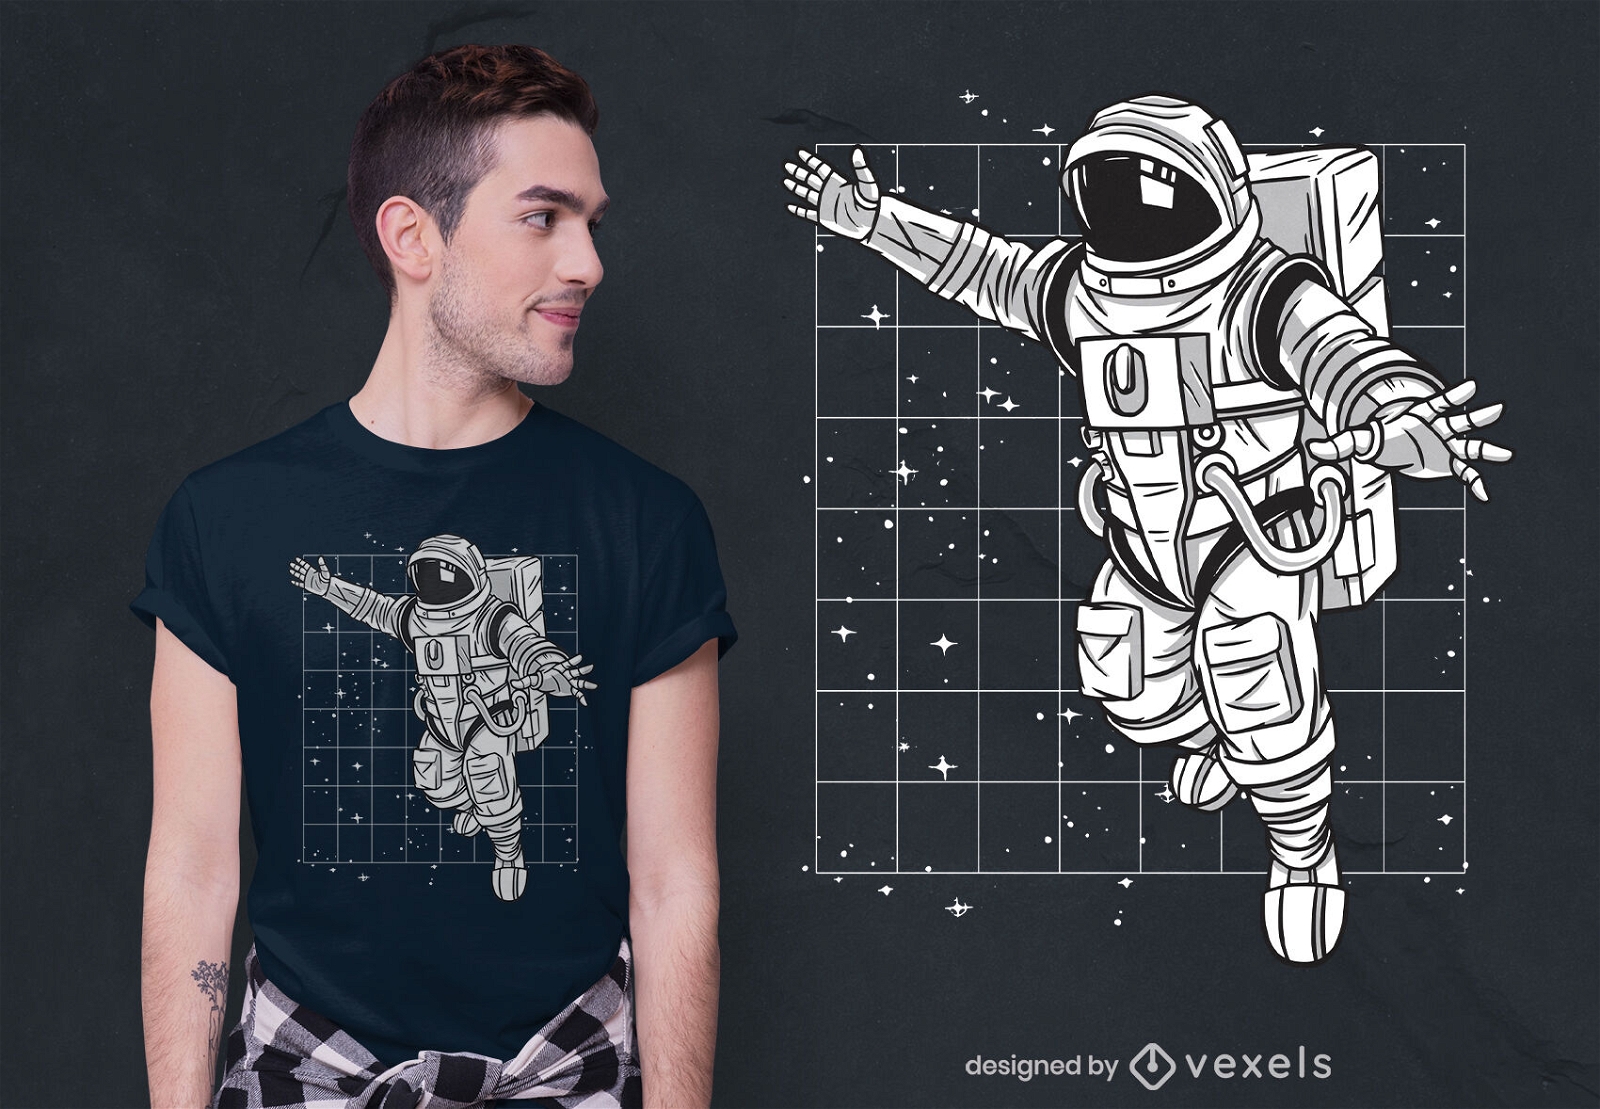
Spaceman floating t-shirt design
Choose a folder
All favorites
Create new
Save
Spaceman floating t-shirt design
Editable text
Print ready
for Merch
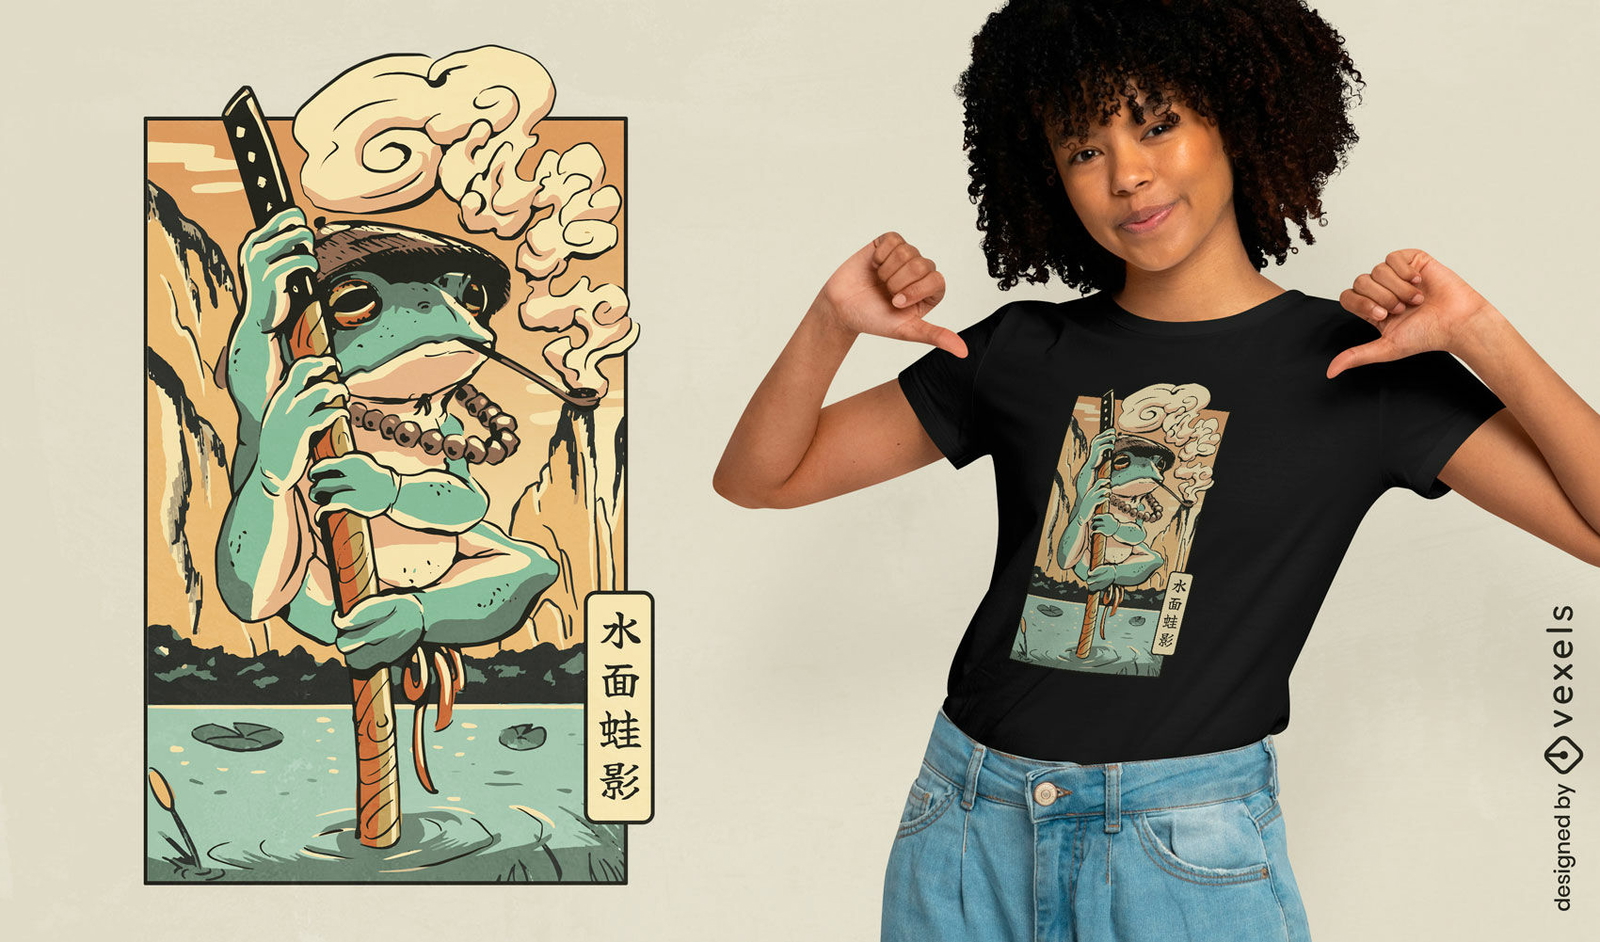
Frog samurai Japanese t-shirt design
Choose a folder
All favorites
Create new
Save
Frog samurai Japanese t-shirt design
Print ready
for Merch
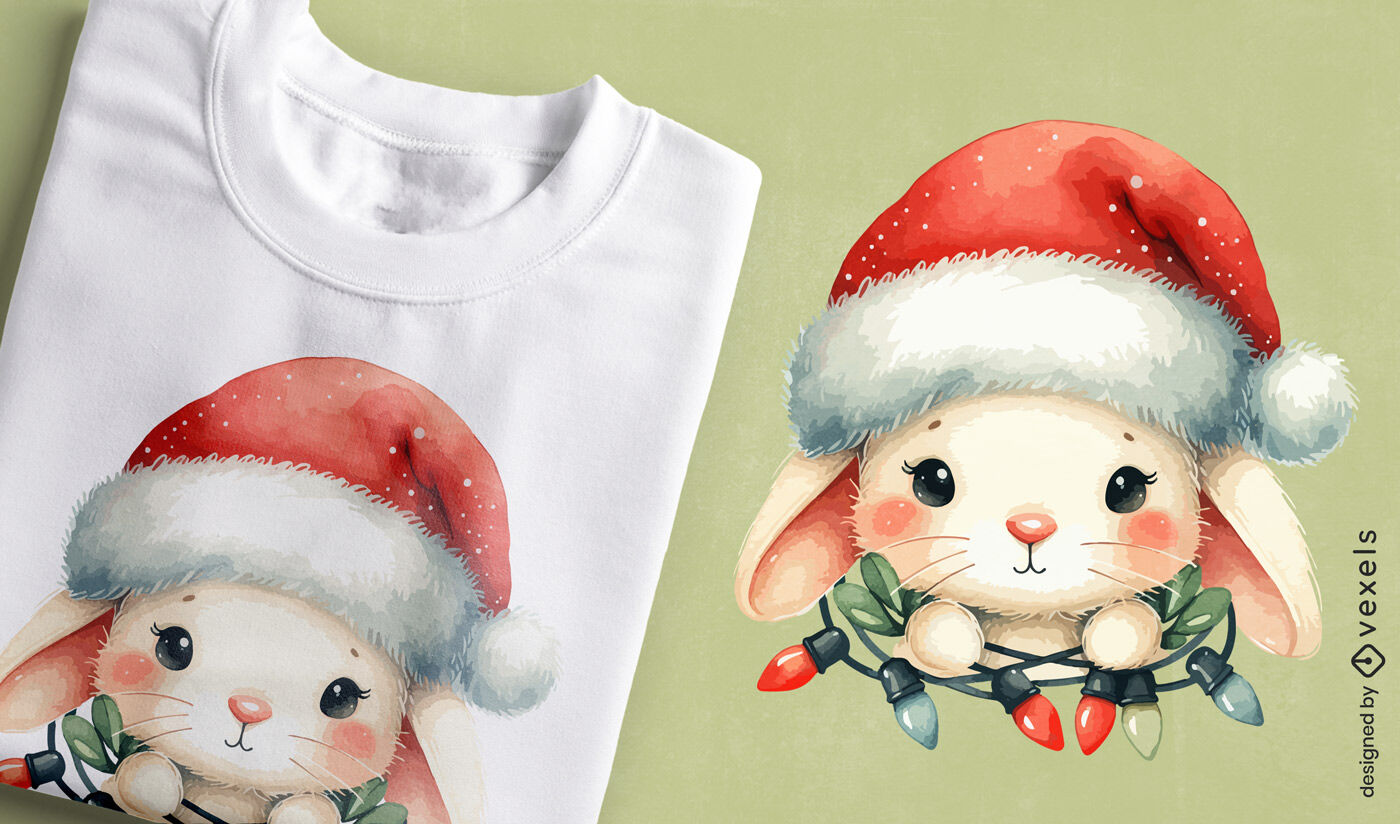
Christmas bunny watercolor t-shirt design
Choose a folder
All favorites
Create new
Save
Christmas bunny watercolor t-shirt design
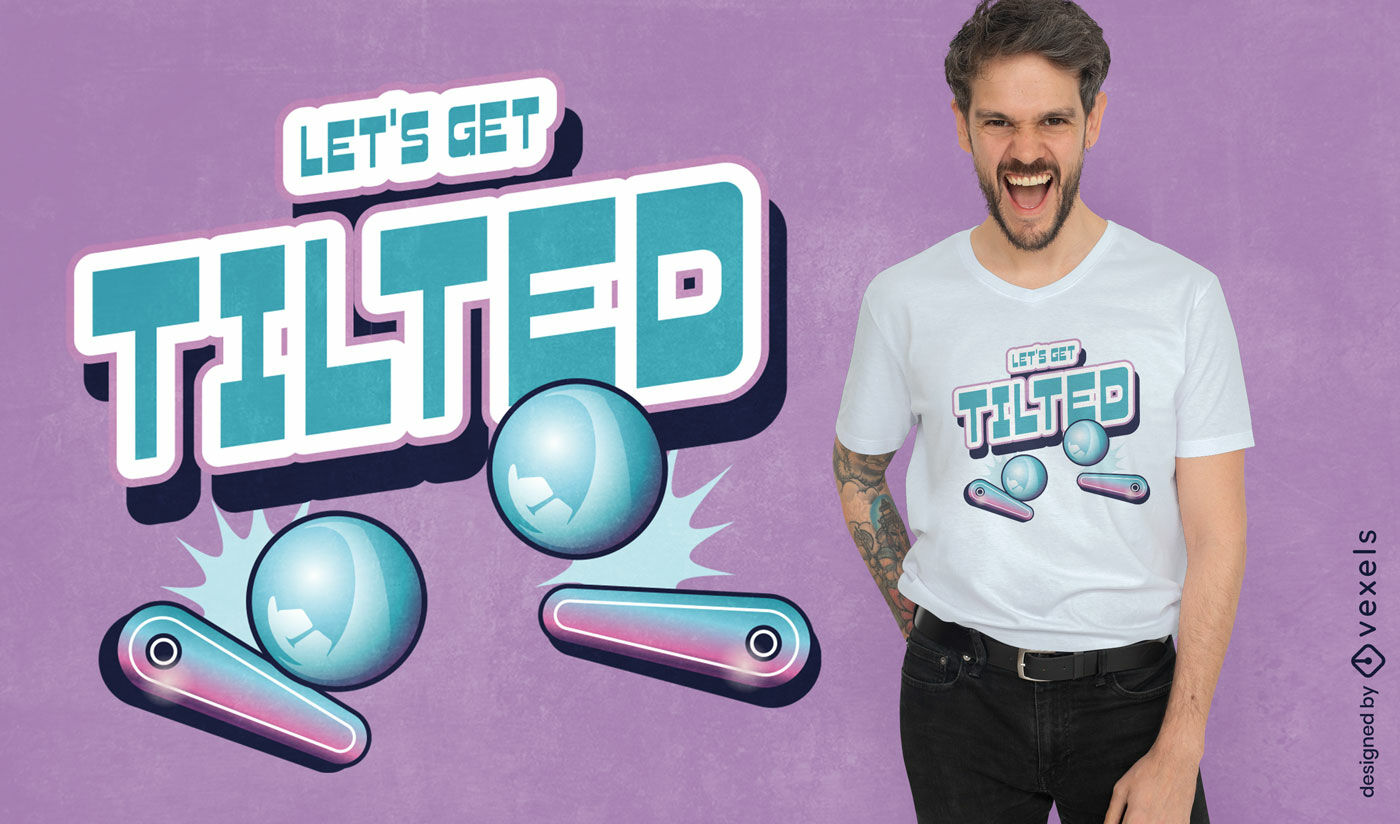
Editable text
Print ready
for Merch
Pinball tilted t-shirt design
Choose a folder
All favorites
Create new
Save
Pinball tilted t-shirt design
Print ready
for Merch
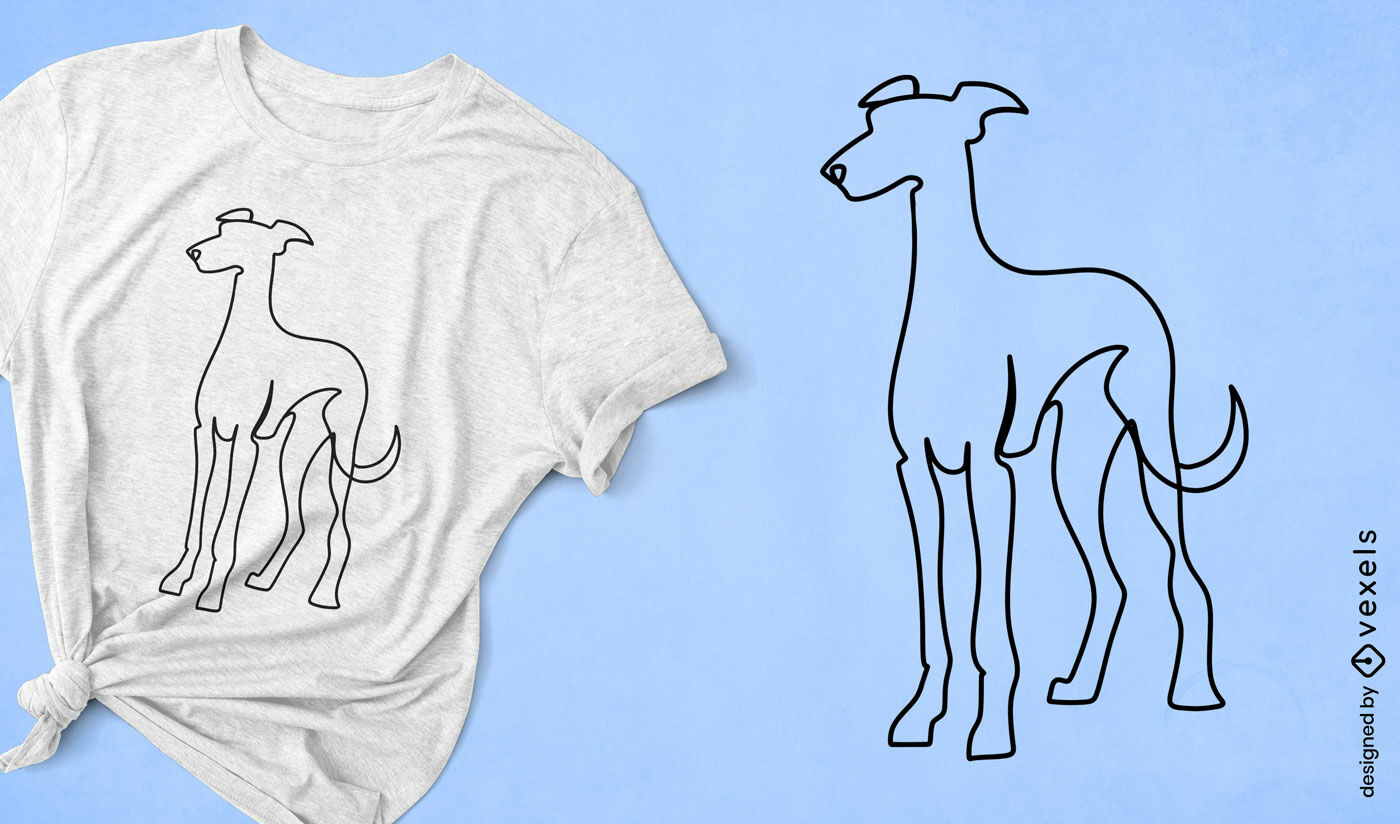
Minimalist continuous line dog t-shirt design
Choose a folder
All favorites
Create new
Save
Minimalist continuous line dog t-shirt design
Print ready
for Merch
Charming cartoon cockatiel t-shirt design
Choose a folder
All favorites
Create new
Save
Charming cartoon cockatiel t-shirt design
Print ready
for Merch
Dice sword tattoo t-shirt design
Choose a folder
All favorites
Create new
Save
Dice sword tattoo t-shirt design
Print ready
for Merch
Strawberry Christmas tree t-shirt design
Choose a folder
All favorites
Create new
Save
Strawberry Christmas tree t-shirt design
Print ready
for Merch
Ghost at phone t-shirt design
Choose a folder
All favorites
Create new
Save
Ghost at phone t-shirt design
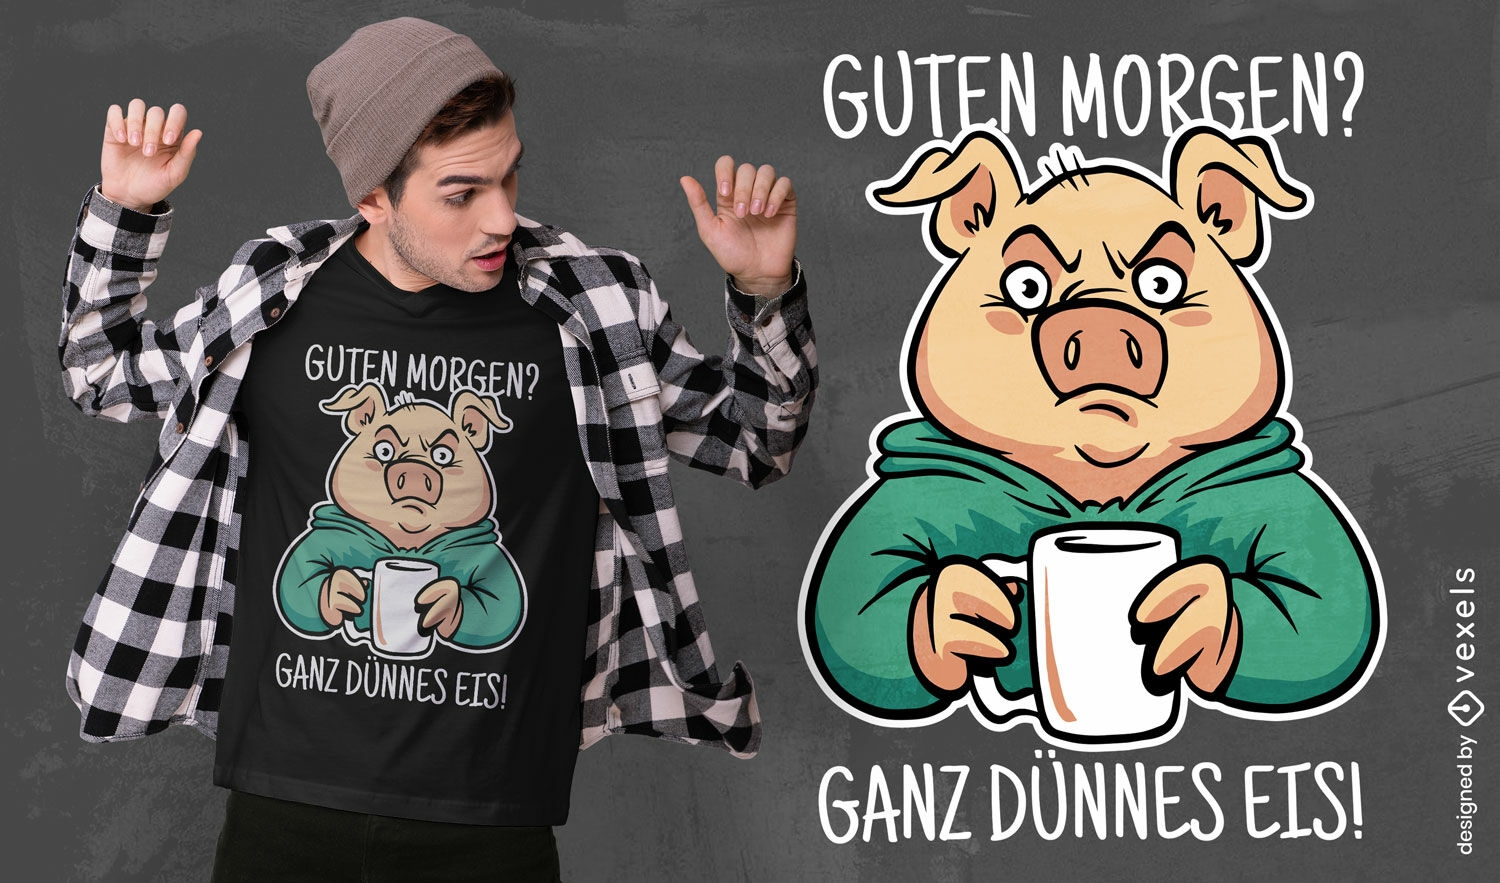
German Content
Print ready
for Merch
Pig having morning coffee t-shirt design
Choose a folder
All favorites
Create new
Save
Pig having morning coffee t-shirt design
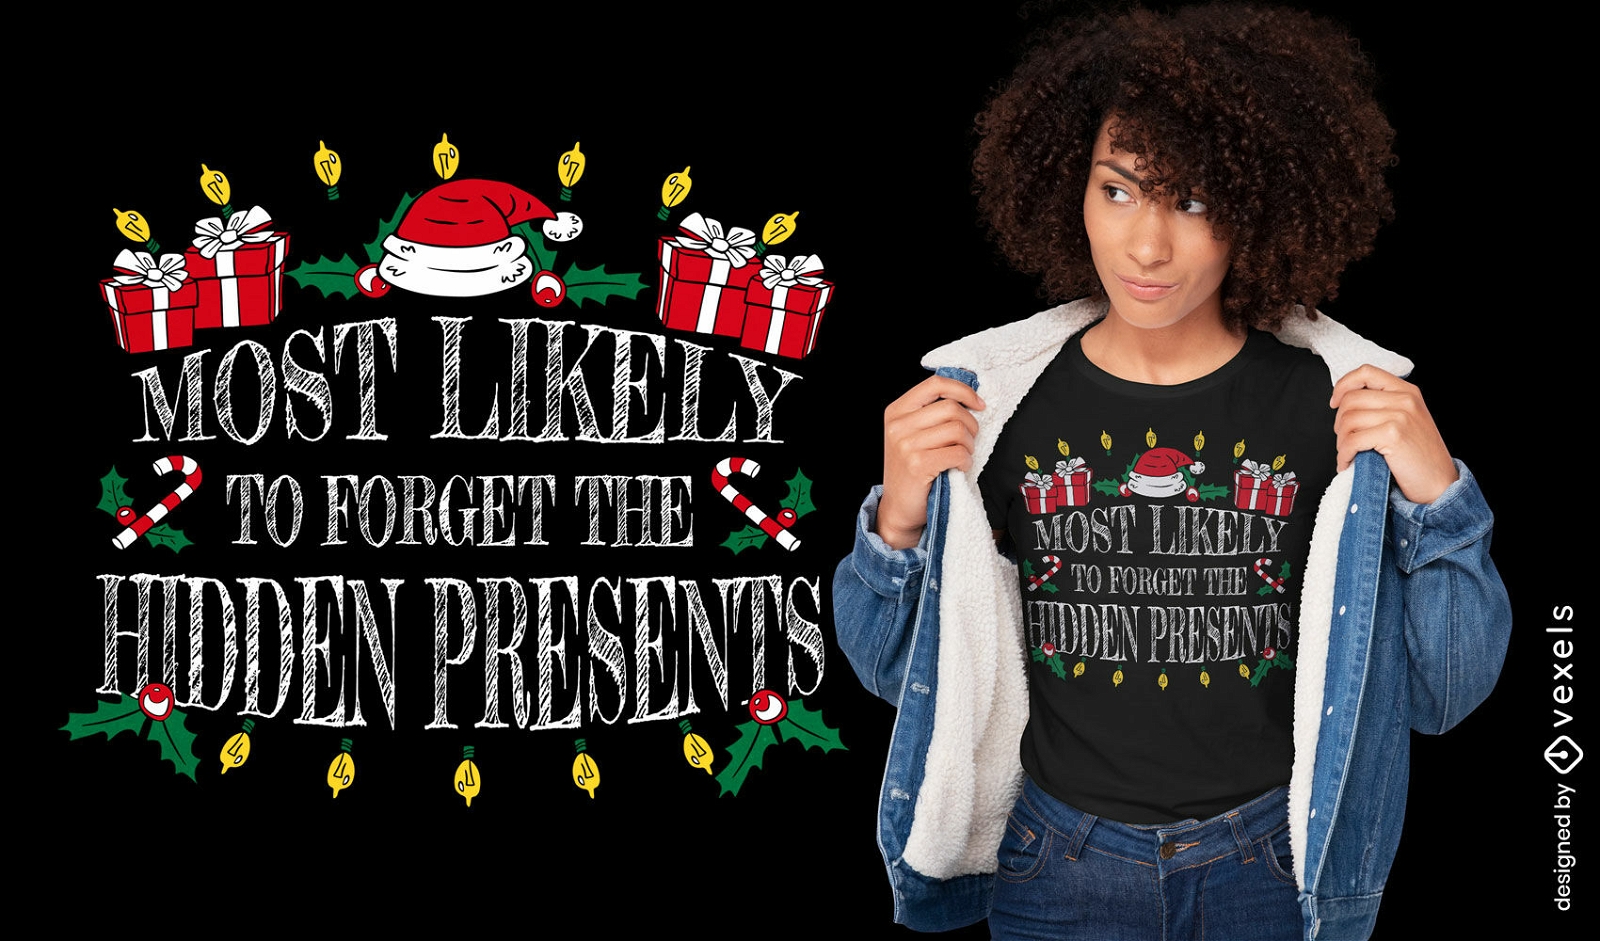
Editable text
Print ready
for Merch
Hidden presents christmas quote t-shirt design
Choose a folder
All favorites
Create new
Save
Hidden presents christmas quote t-shirt design
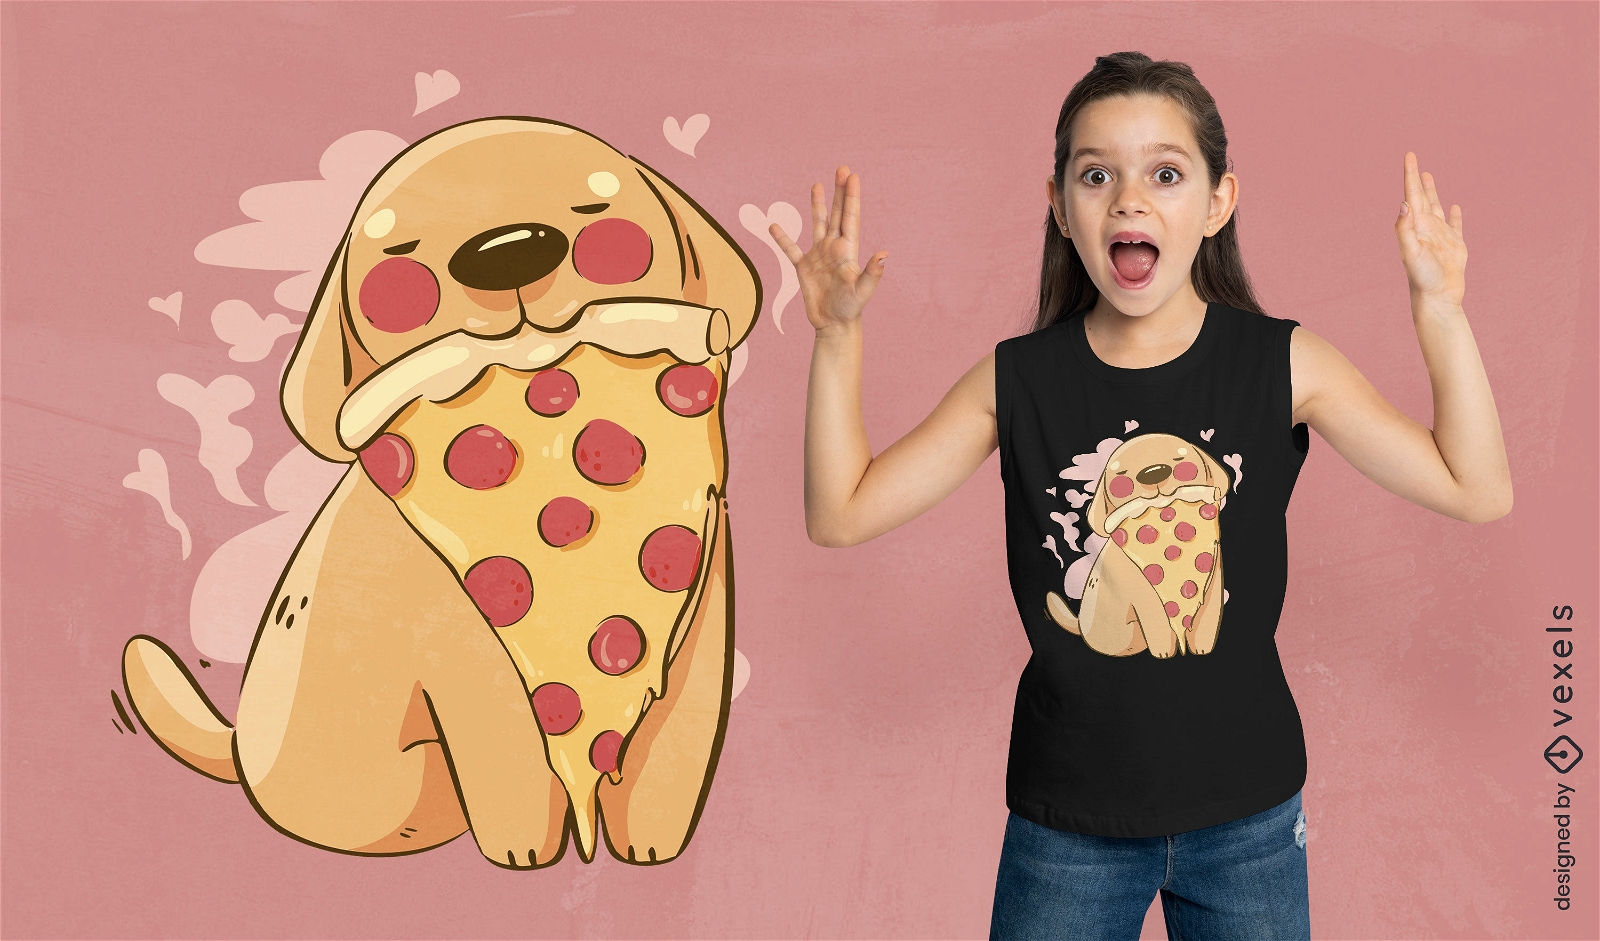
Print ready
for Merch
Cute dog pet eating pizza t-shirt design
Choose a folder
All favorites
Create new
Save
Cute dog pet eating pizza t-shirt design
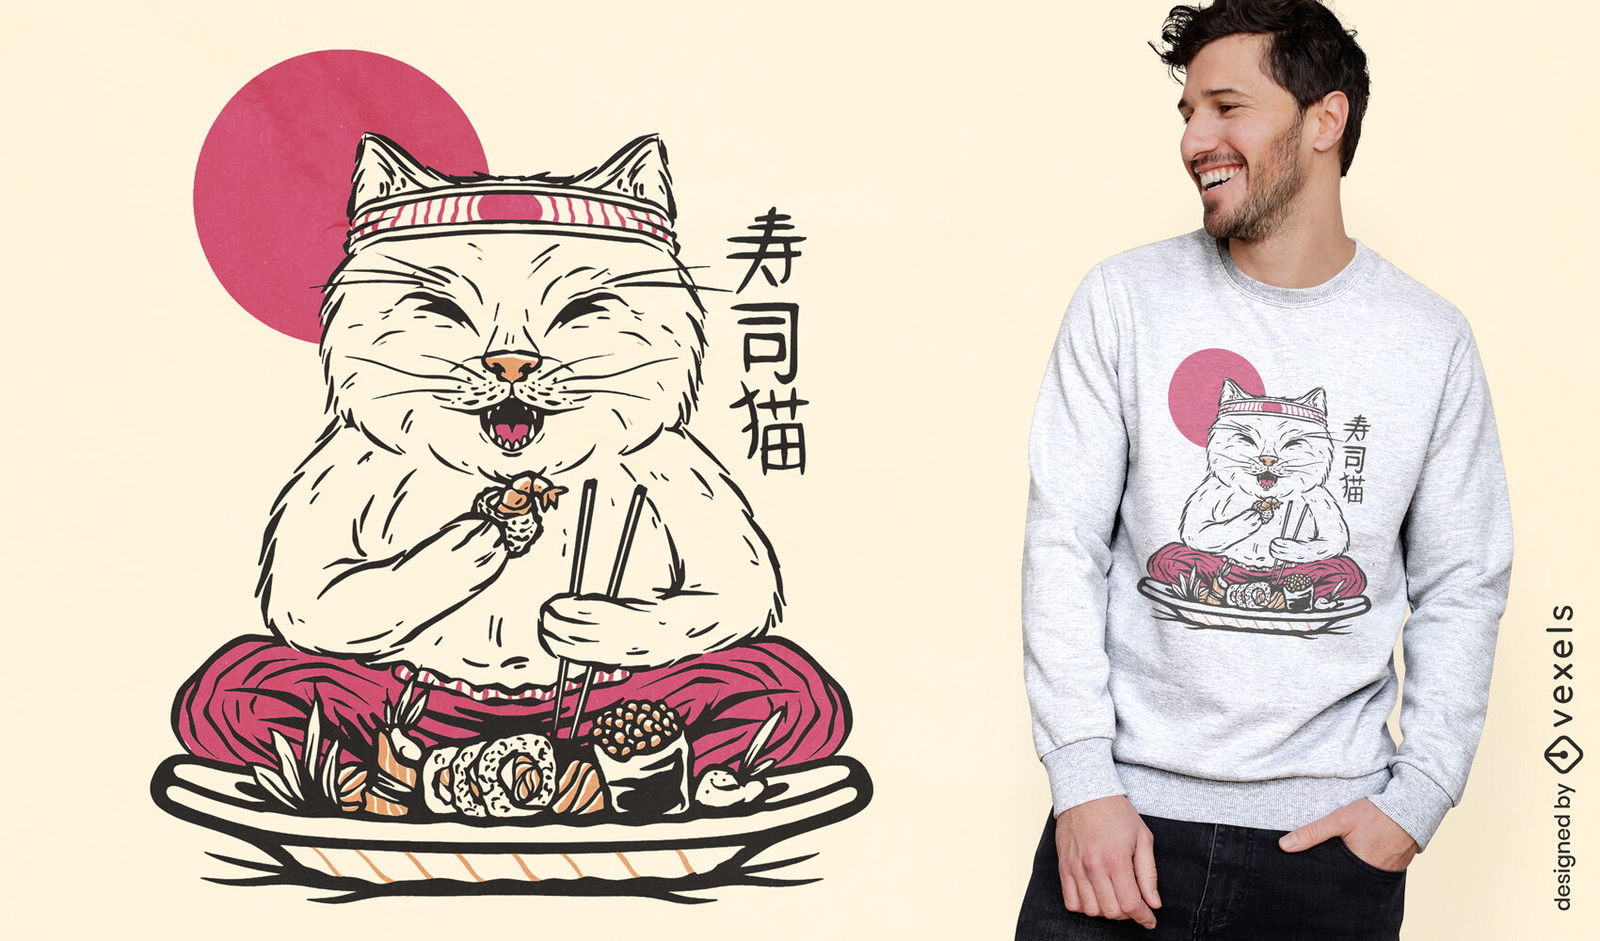
Print ready
for Merch
Cat animal eating sushi t-shirt design
Choose a folder
All favorites
Create new
Save
Cat animal eating sushi t-shirt design
Print ready
for Merch
Dandelions and cats t-shirt design
Choose a folder
All favorites
Create new
Save
Dandelions and cats t-shirt design
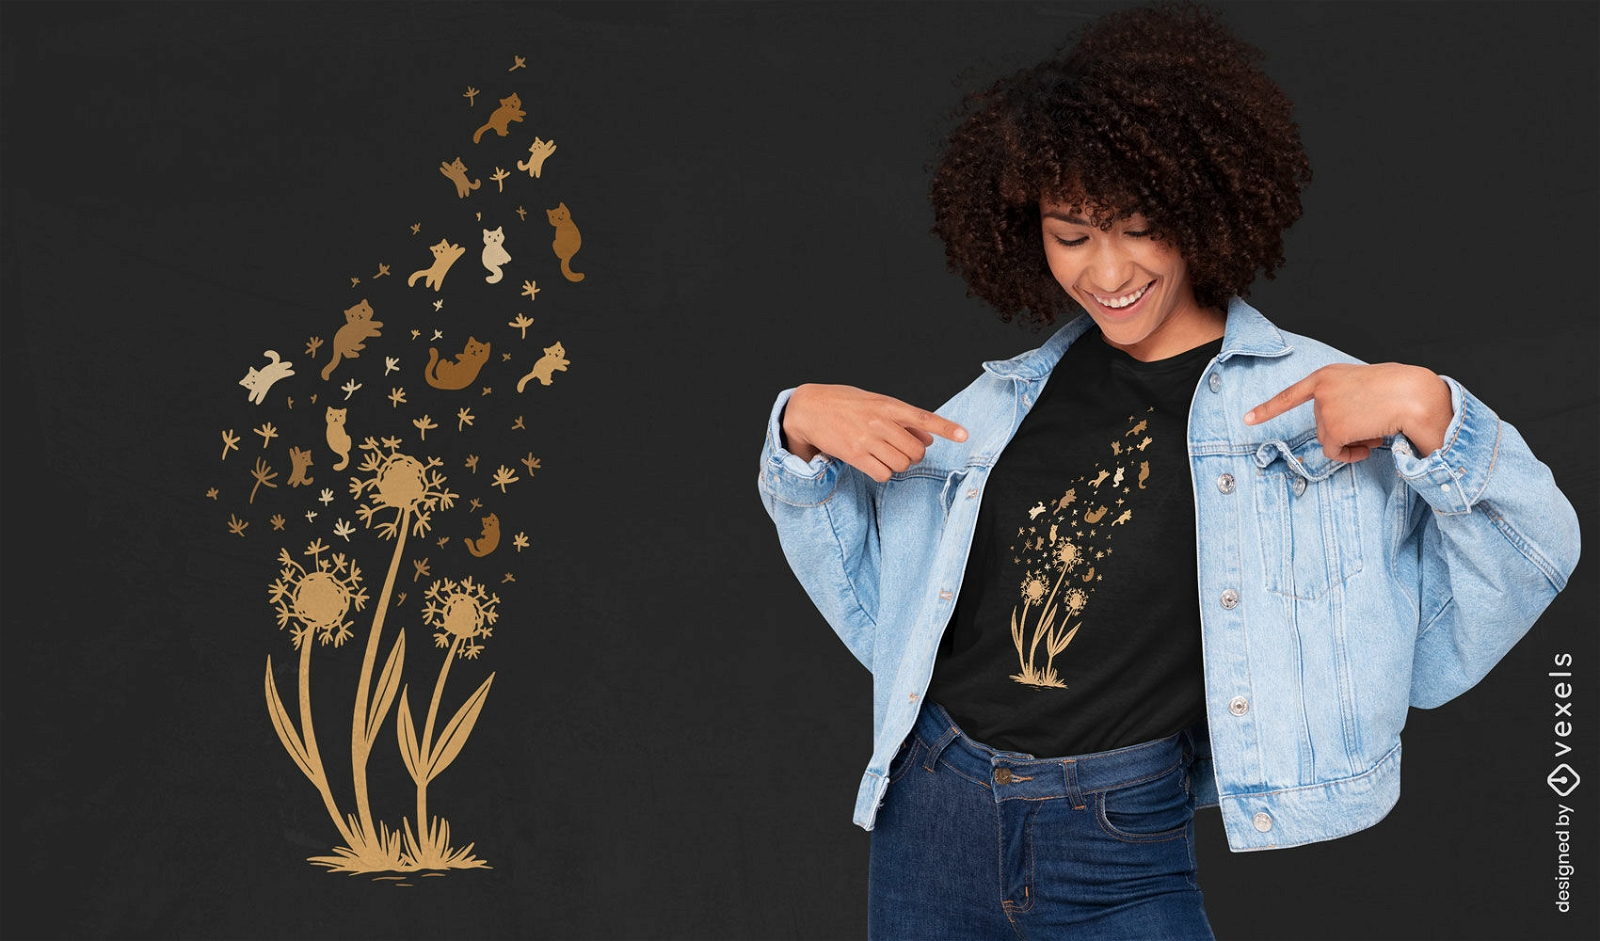
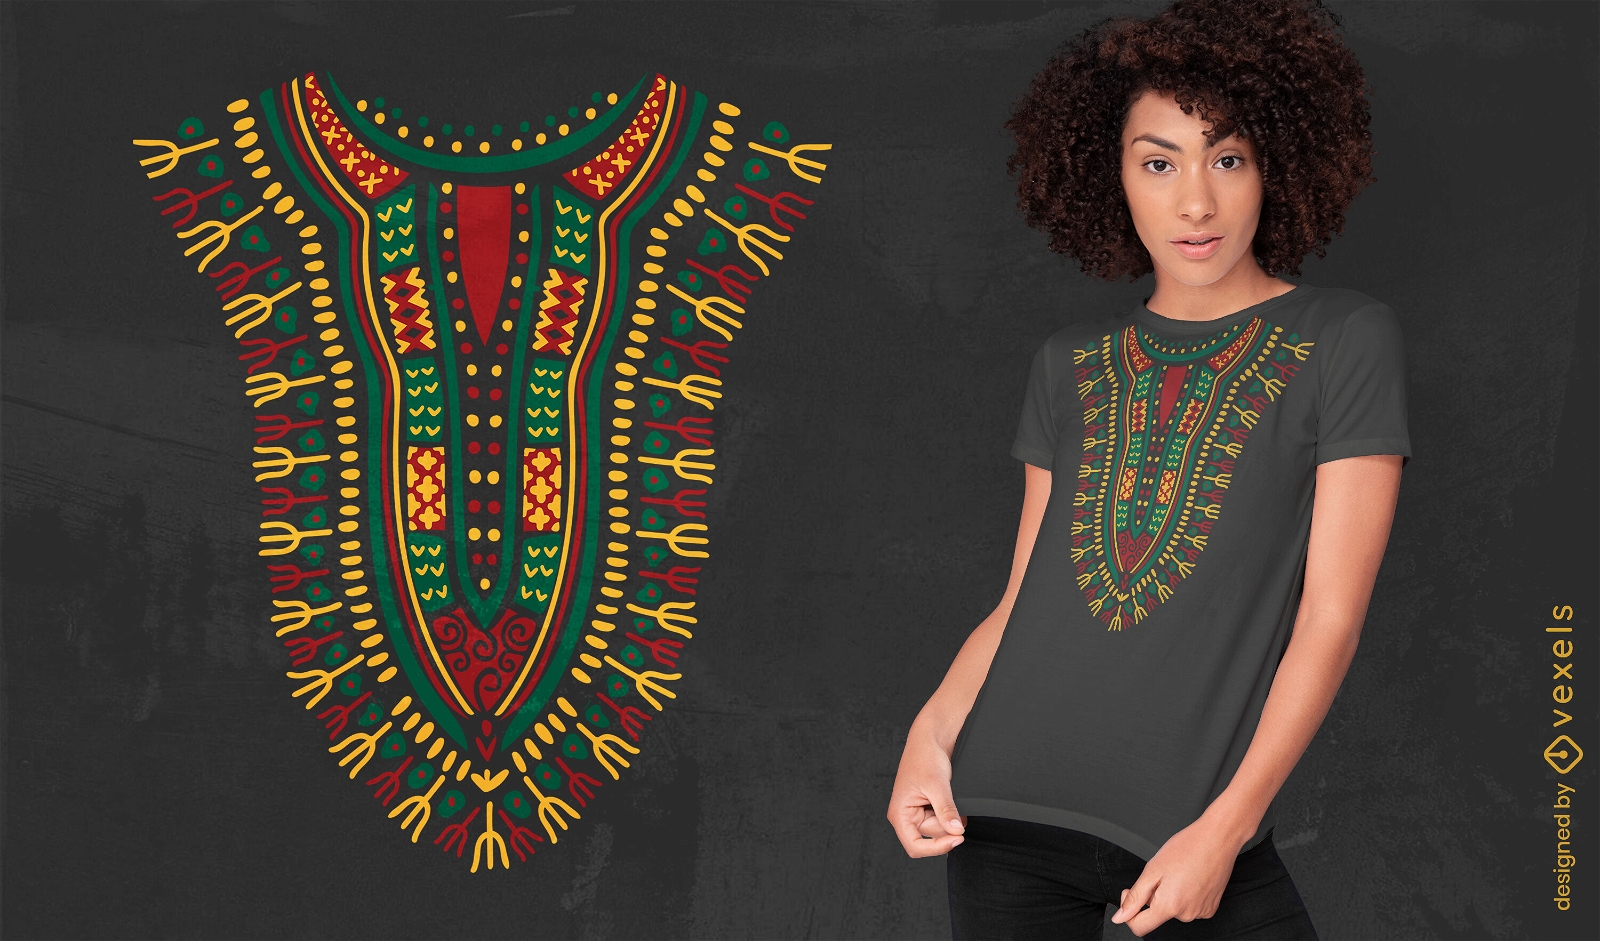
Print ready
for Merch
Dashiki african clothes design t-shirt design
Choose a folder
All favorites
Create new
Save
Dashiki african clothes design t-shirt design
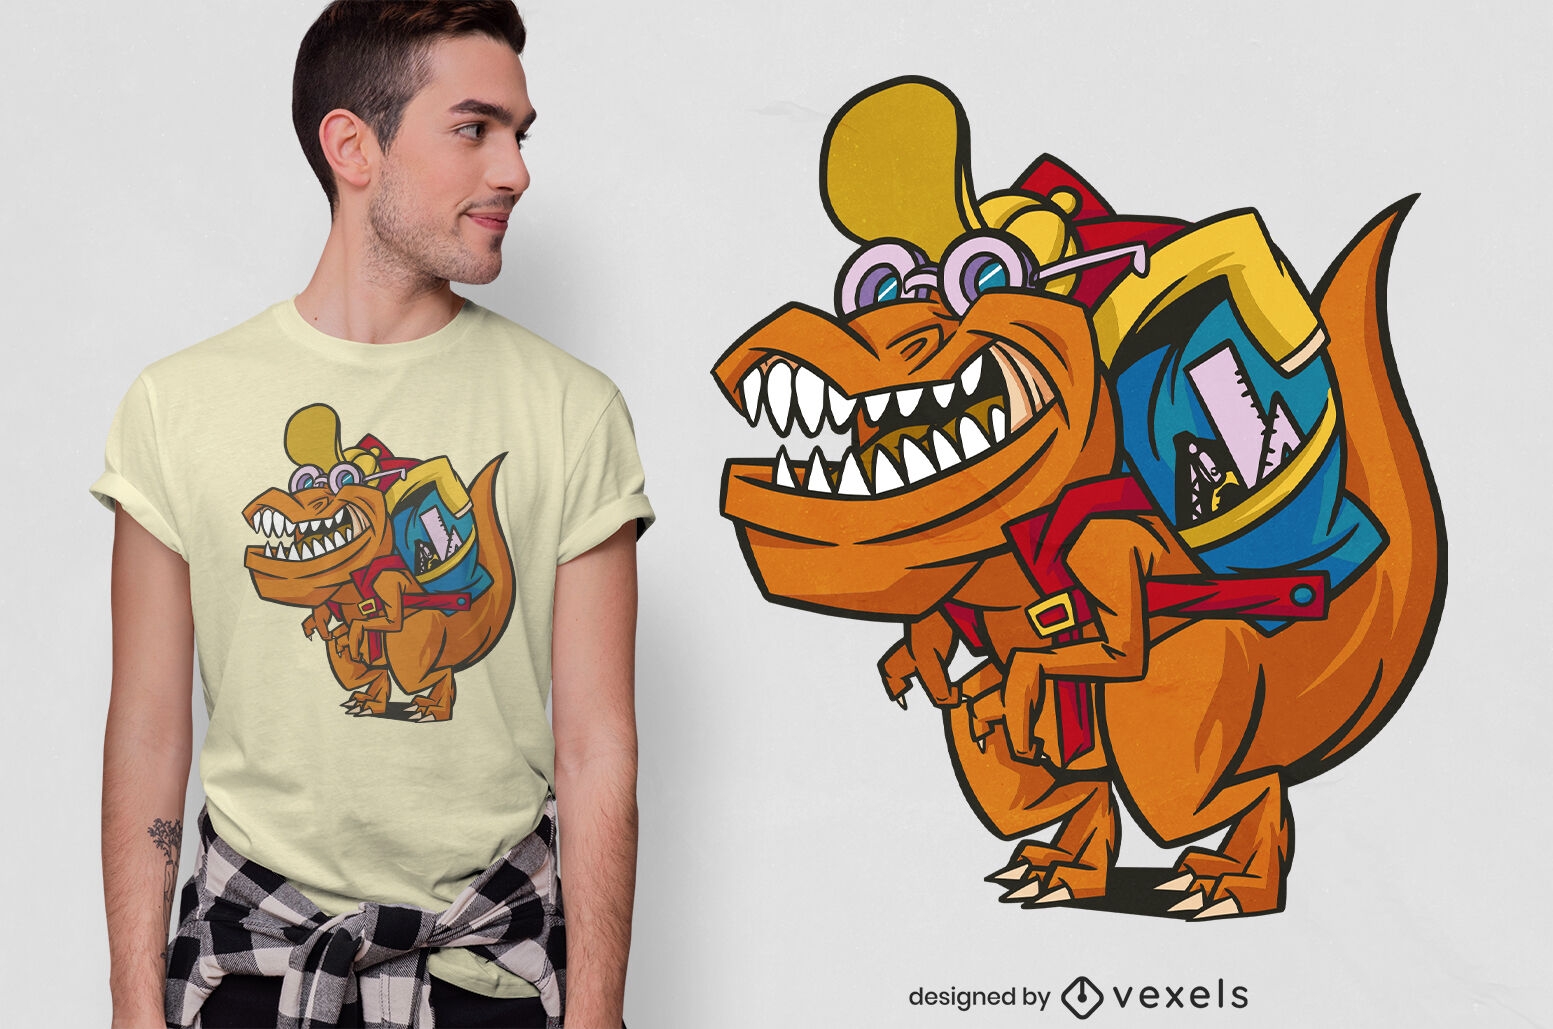
Print ready
for Merch
T-rex dinosaur with school backpack t-shirt design
Choose a folder
All favorites
Create new
Save
T-rex dinosaur with school backpack t-shirt design
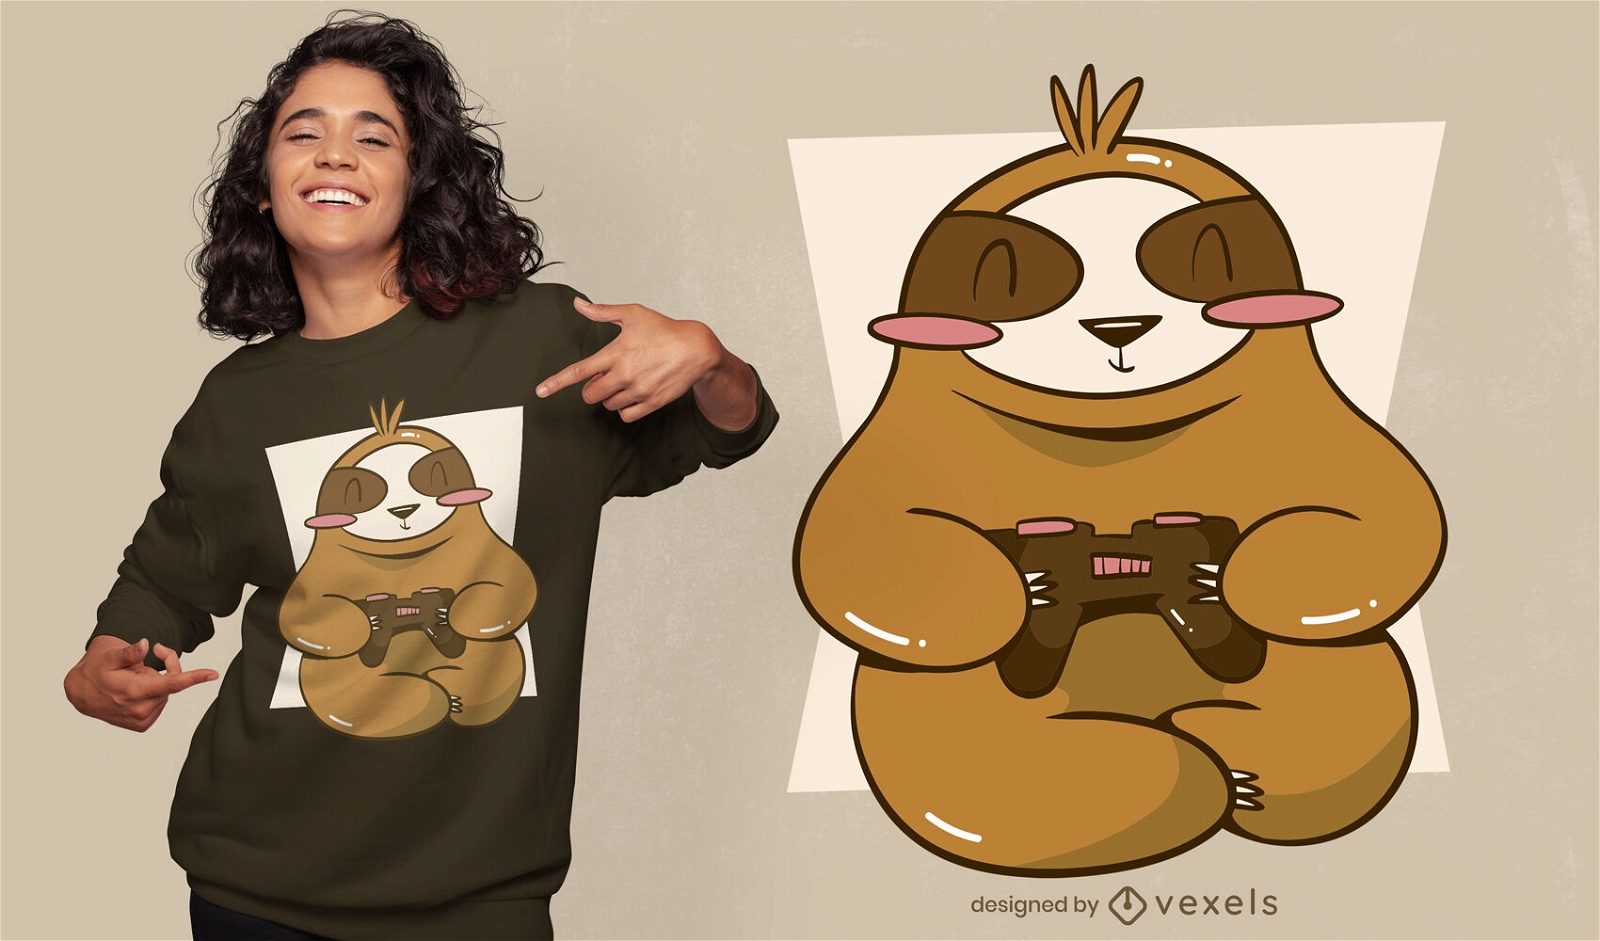
Print ready
for Merch
Gamer sloth with joystick t-shirt design
Choose a folder
All favorites
Create new
Save
Gamer sloth with joystick t-shirt design
Print ready
for Merch
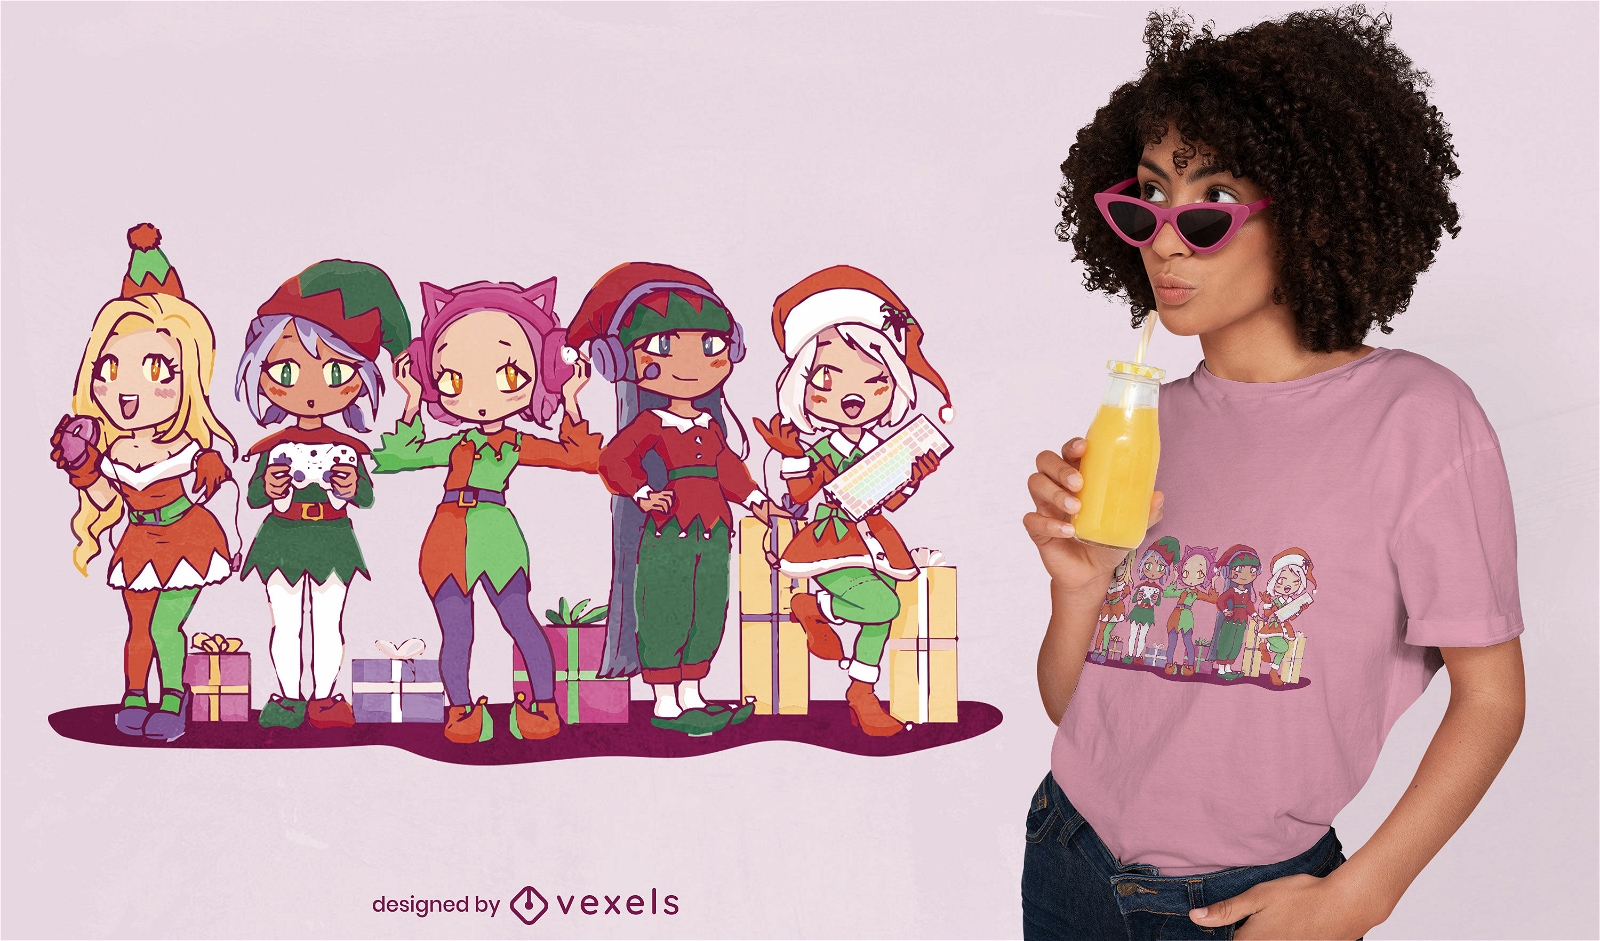
Anime elves Christmas t-shirt design
Choose a folder
All favorites
Create new
Save
Anime elves Christmas t-shirt design
Print ready
for Merch
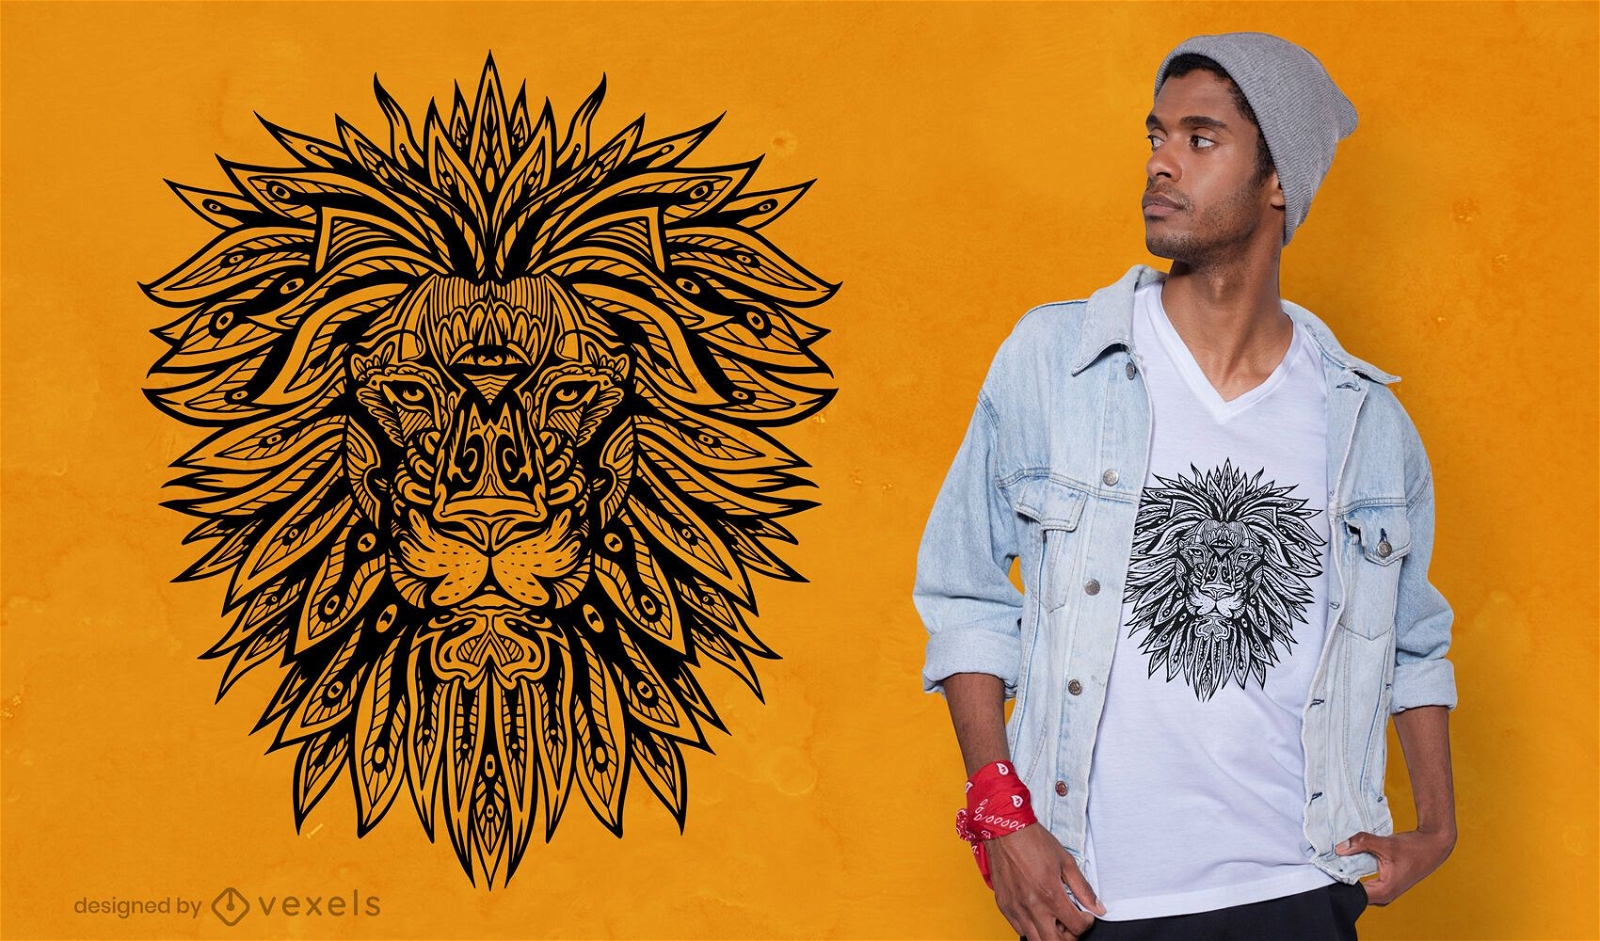
Lion mandala t-shirt design
Choose a folder
All favorites
Create new
Save
Lion mandala t-shirt design
Print ready
for Merch
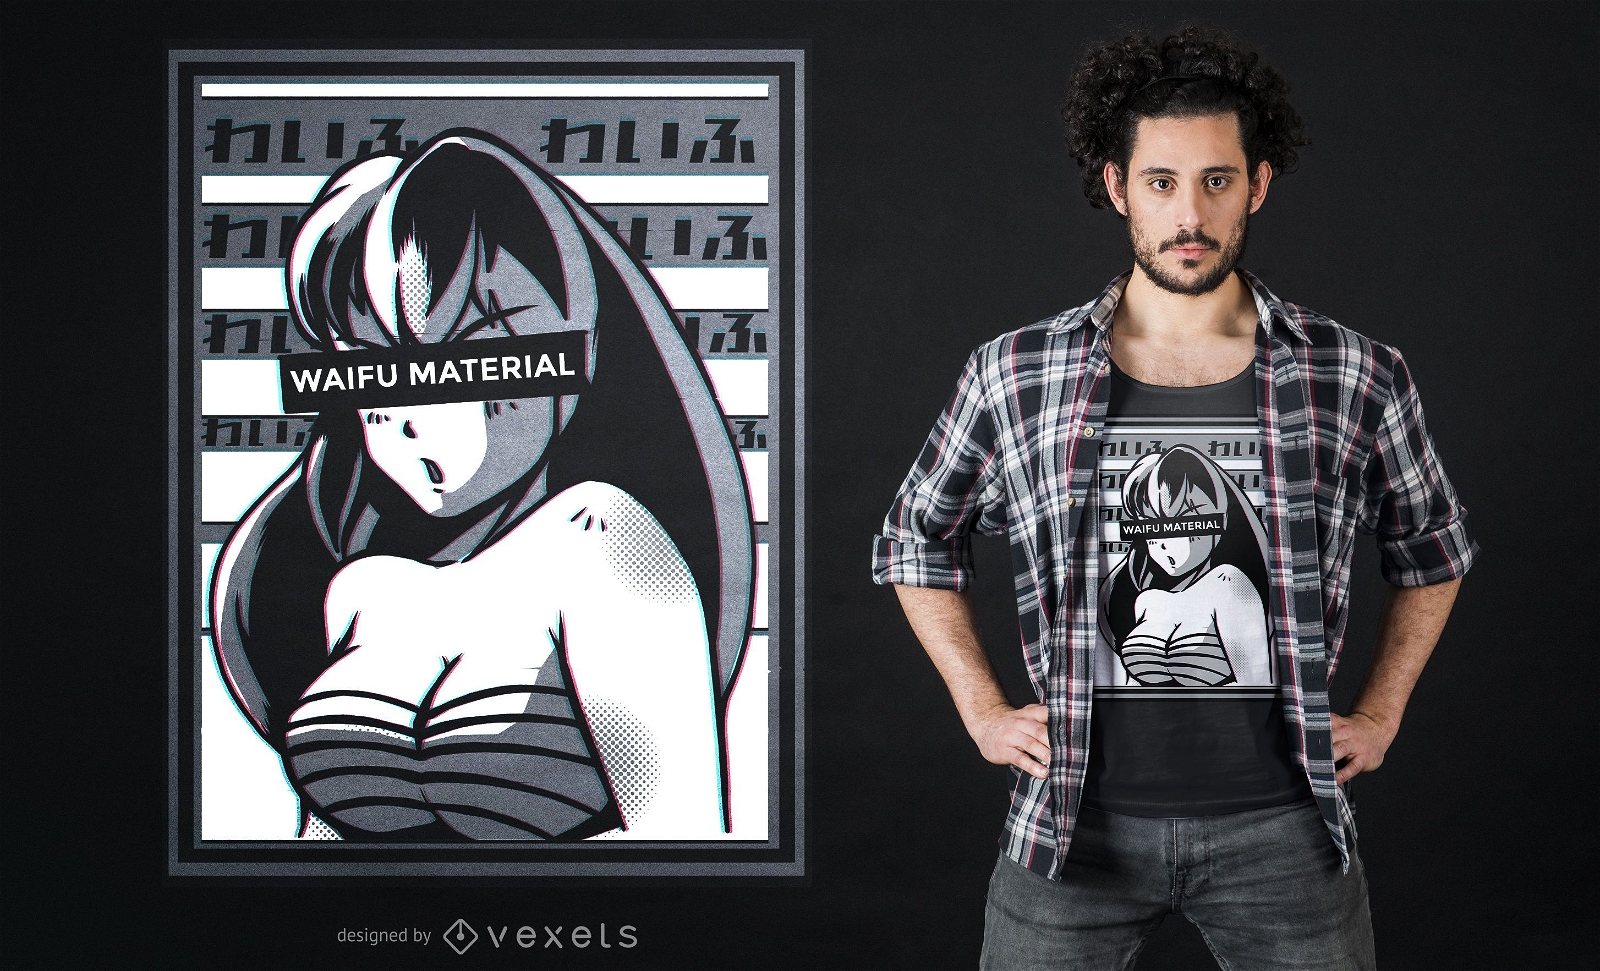
Waifu material anime t-shirt design
Choose a folder
All favorites
Create new
Save
Waifu material anime t-shirt design
Print ready
for Merch
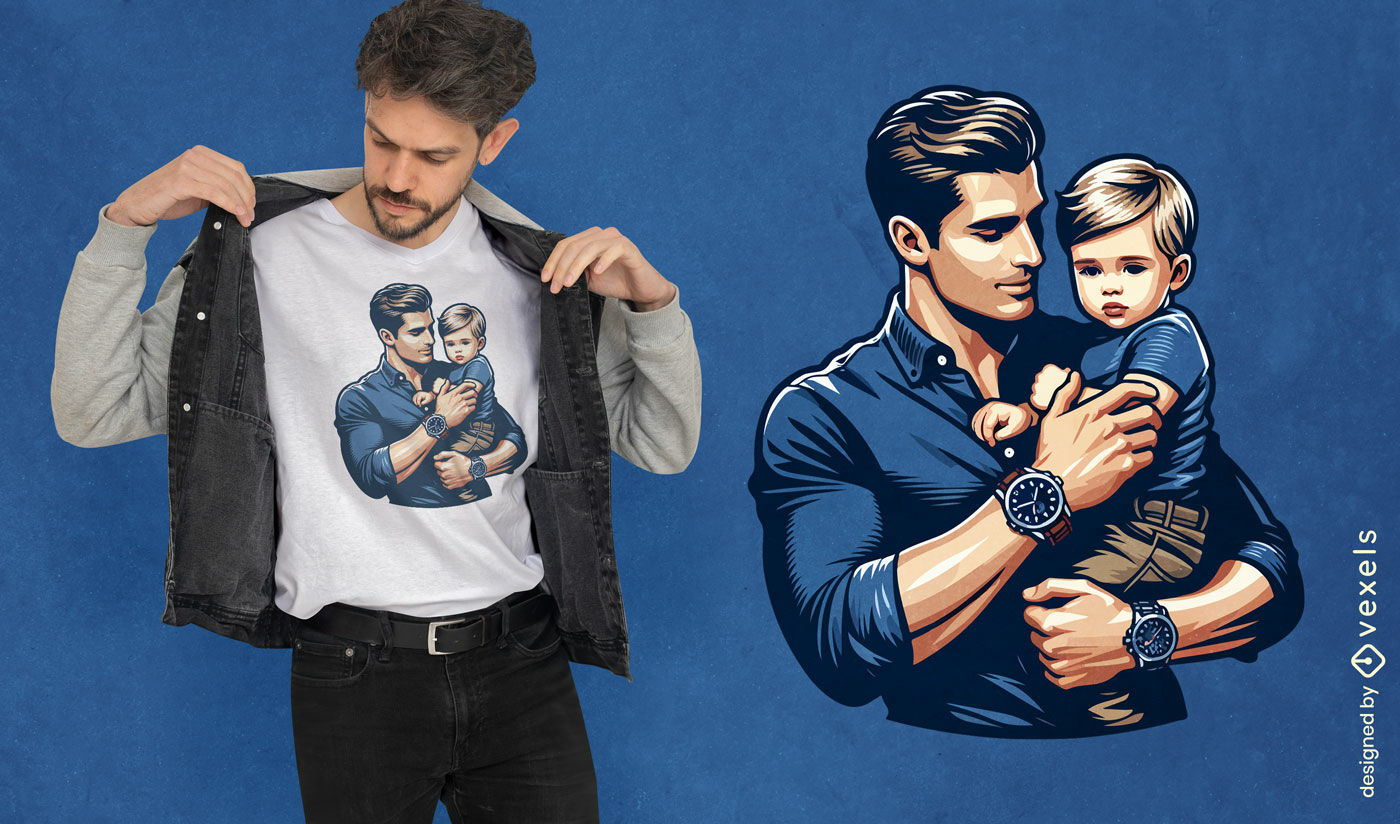
Father and baby portrait t-shirt design
Choose a folder
All favorites
Create new
Save
Father and baby portrait t-shirt design
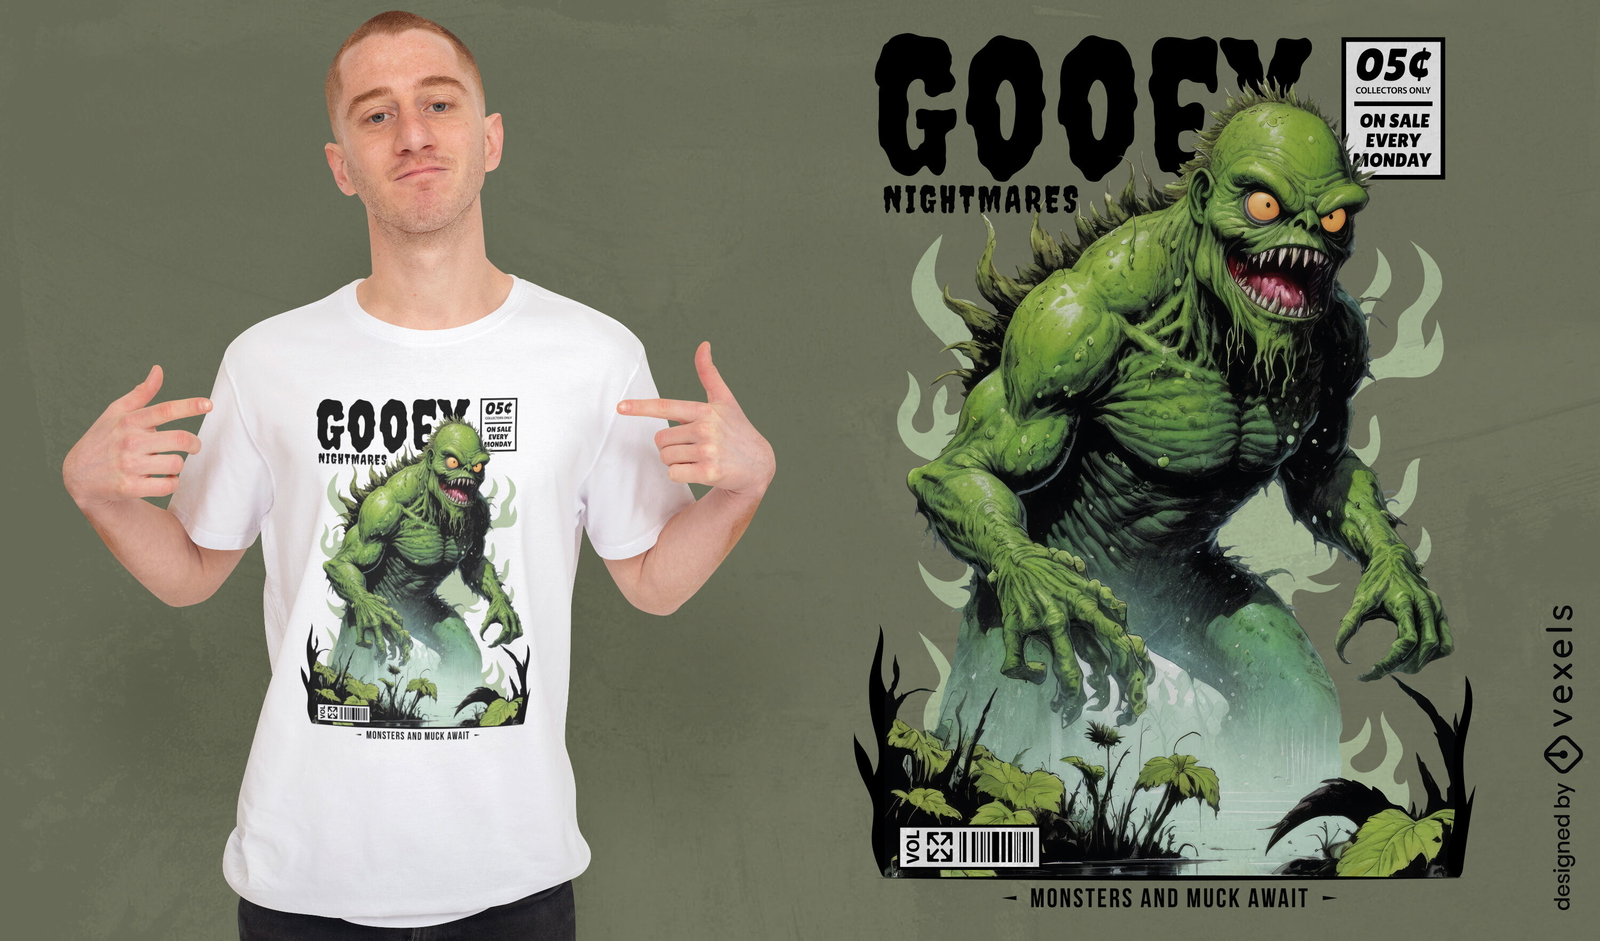
AI generated, curated by our designers
for Merch
Gooey monster comic t-shirt design
Choose a folder
All favorites
Create new
Save
Gooey monster comic t-shirt design
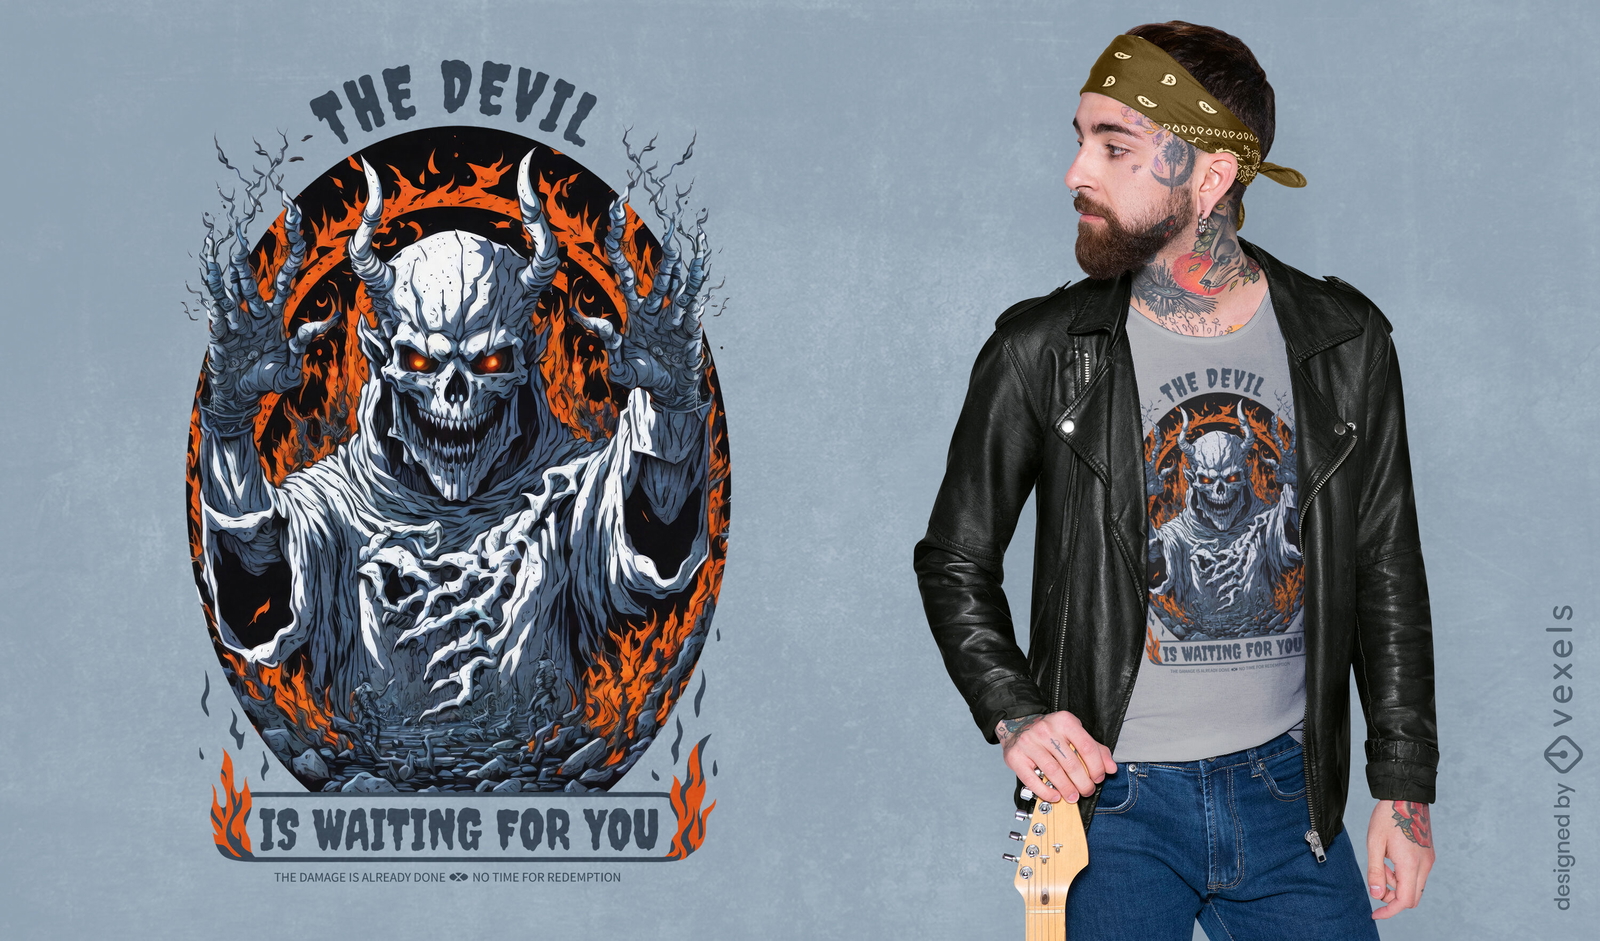
Editable text
Print ready
for Merch
Devil warning t-shirt design
Choose a folder
All favorites
Create new
Save
Devil warning t-shirt design
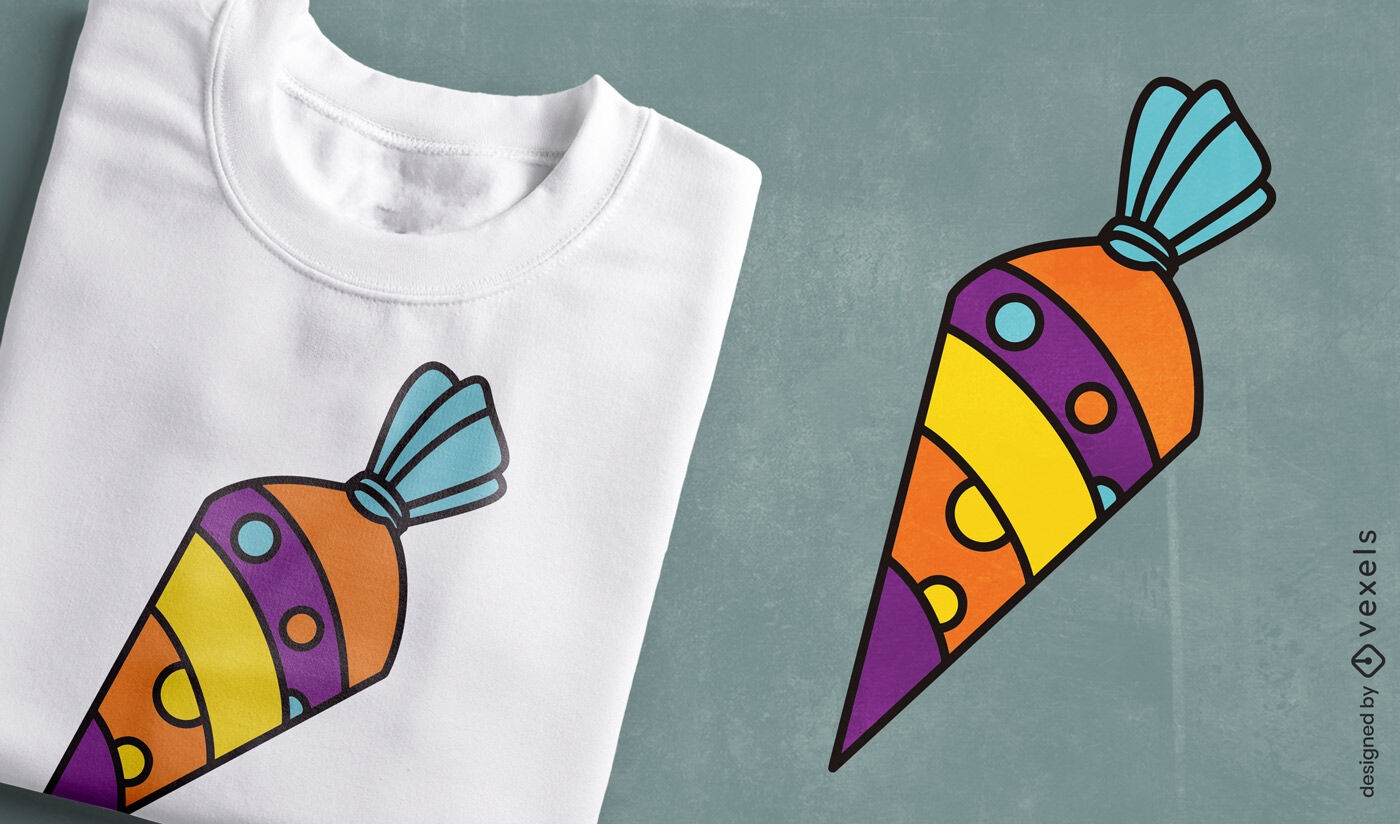
Print ready
for Merch
Colorful sugar cone t-shirt design
Choose a folder
All favorites
Create new
Save
Colorful sugar cone t-shirt design
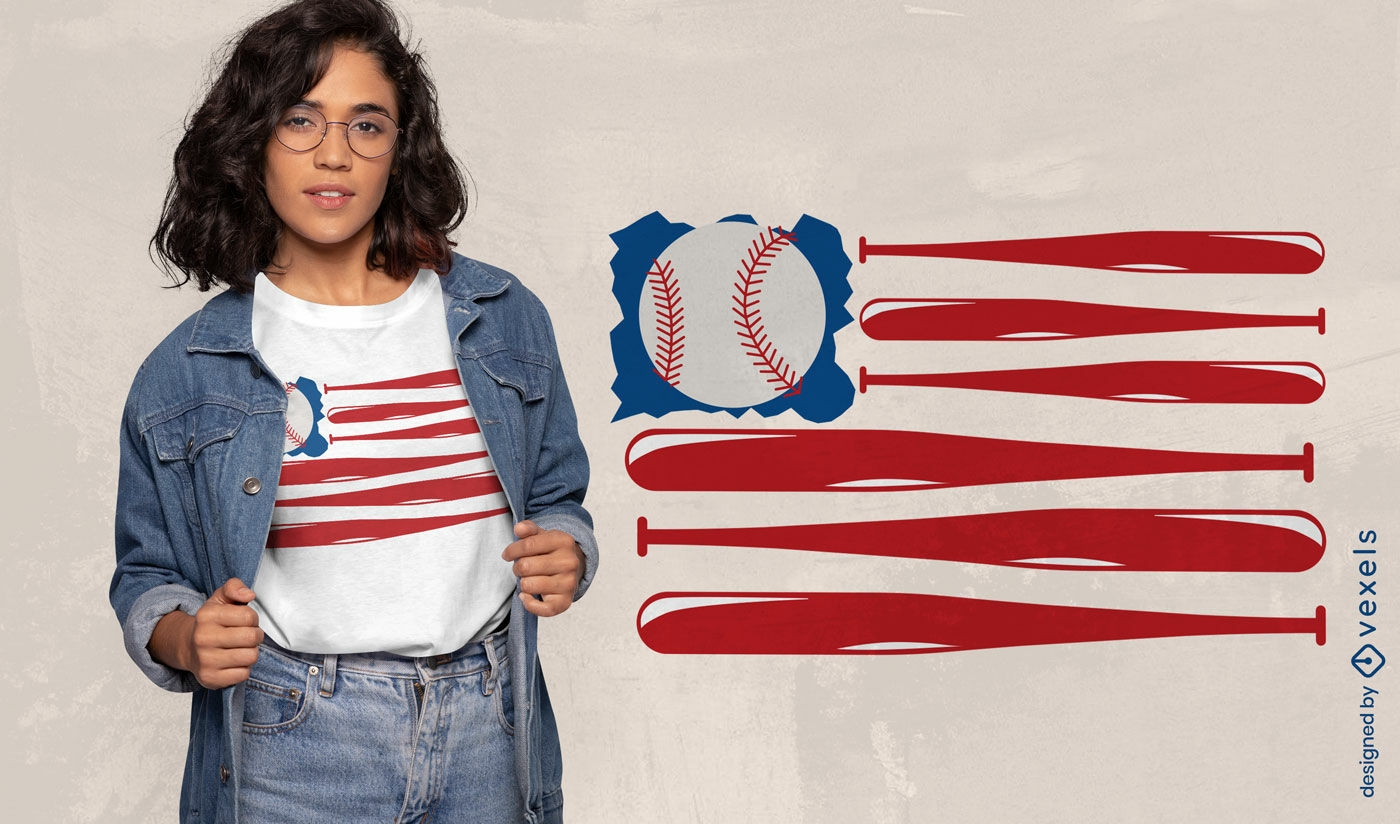
Print ready
for Merch
Baseball pride t-shirt design
Choose a folder
All favorites
Create new
Save
Baseball pride t-shirt design
Print ready
for Merch
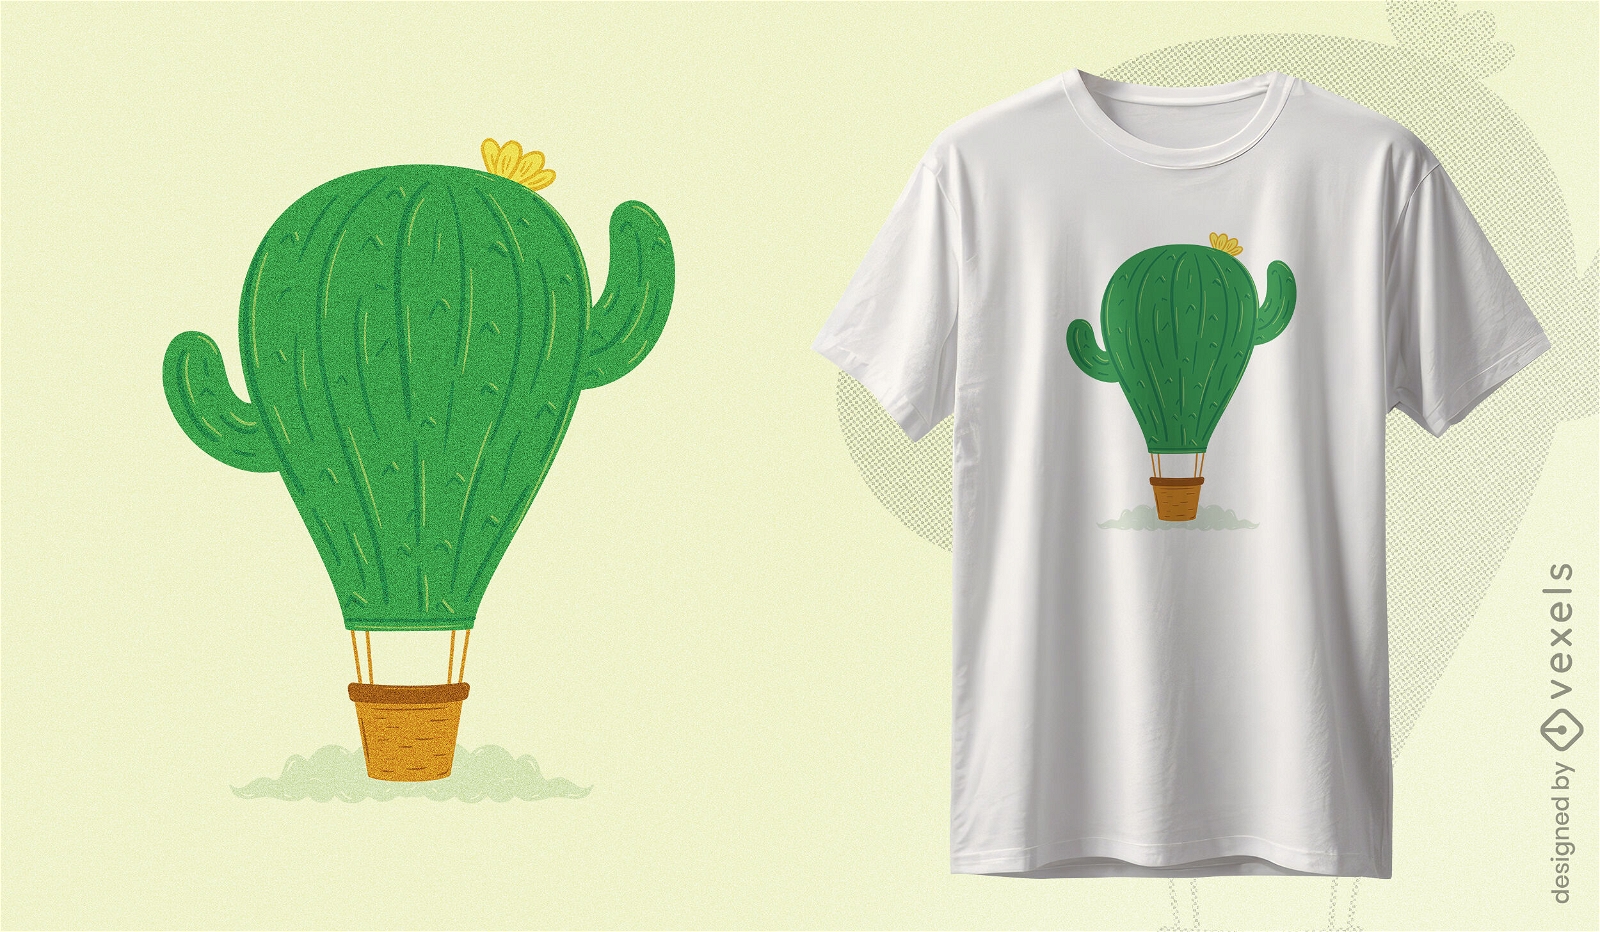
Cactus hot air balloon t-shirt design
Choose a folder
All favorites
Create new
Save
Cactus hot air balloon t-shirt design
Editable text
Print ready
for Merch
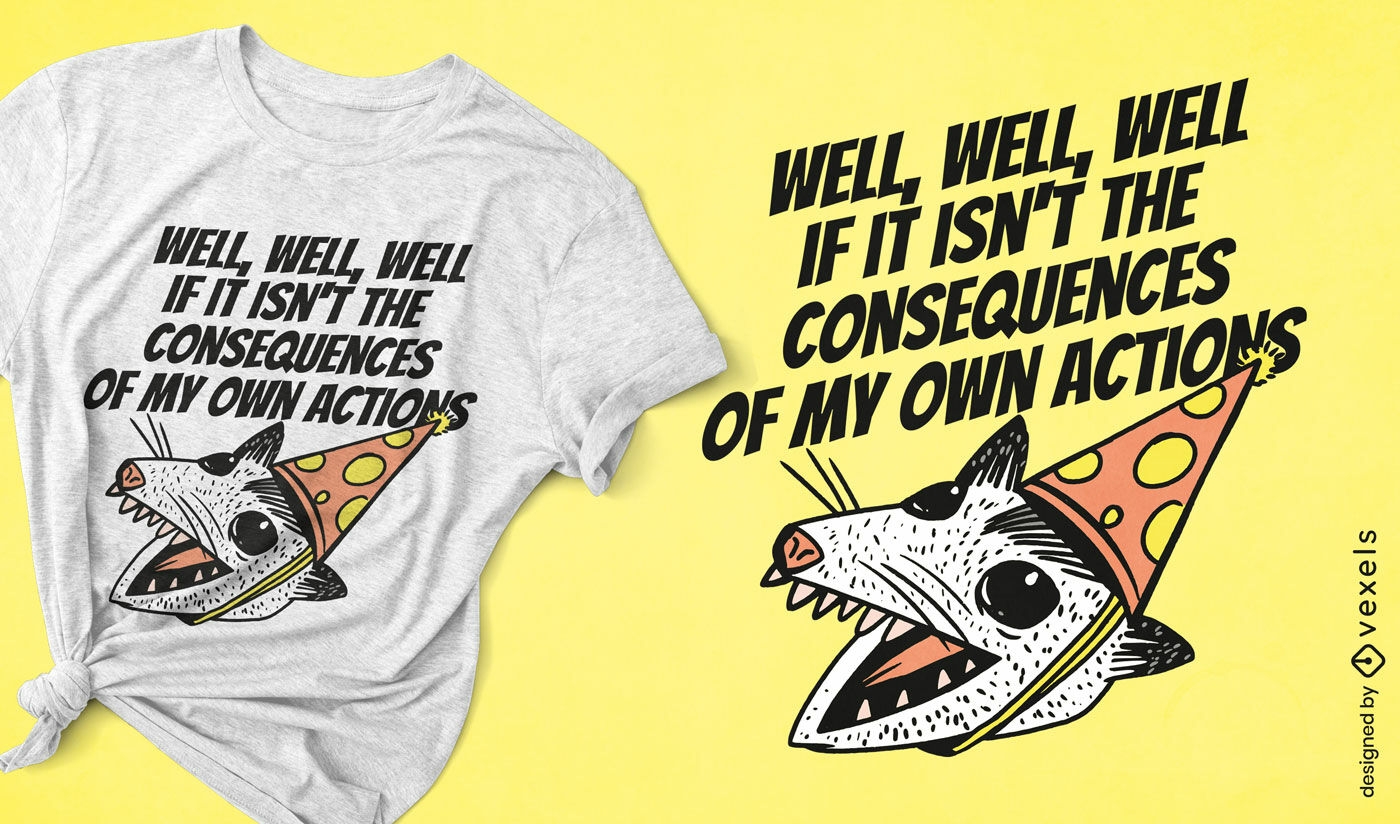
Opossum with party hat t-shirt design
Choose a folder
All favorites
Create new
Save
Opossum with party hat t-shirt design
Print ready
for Merch
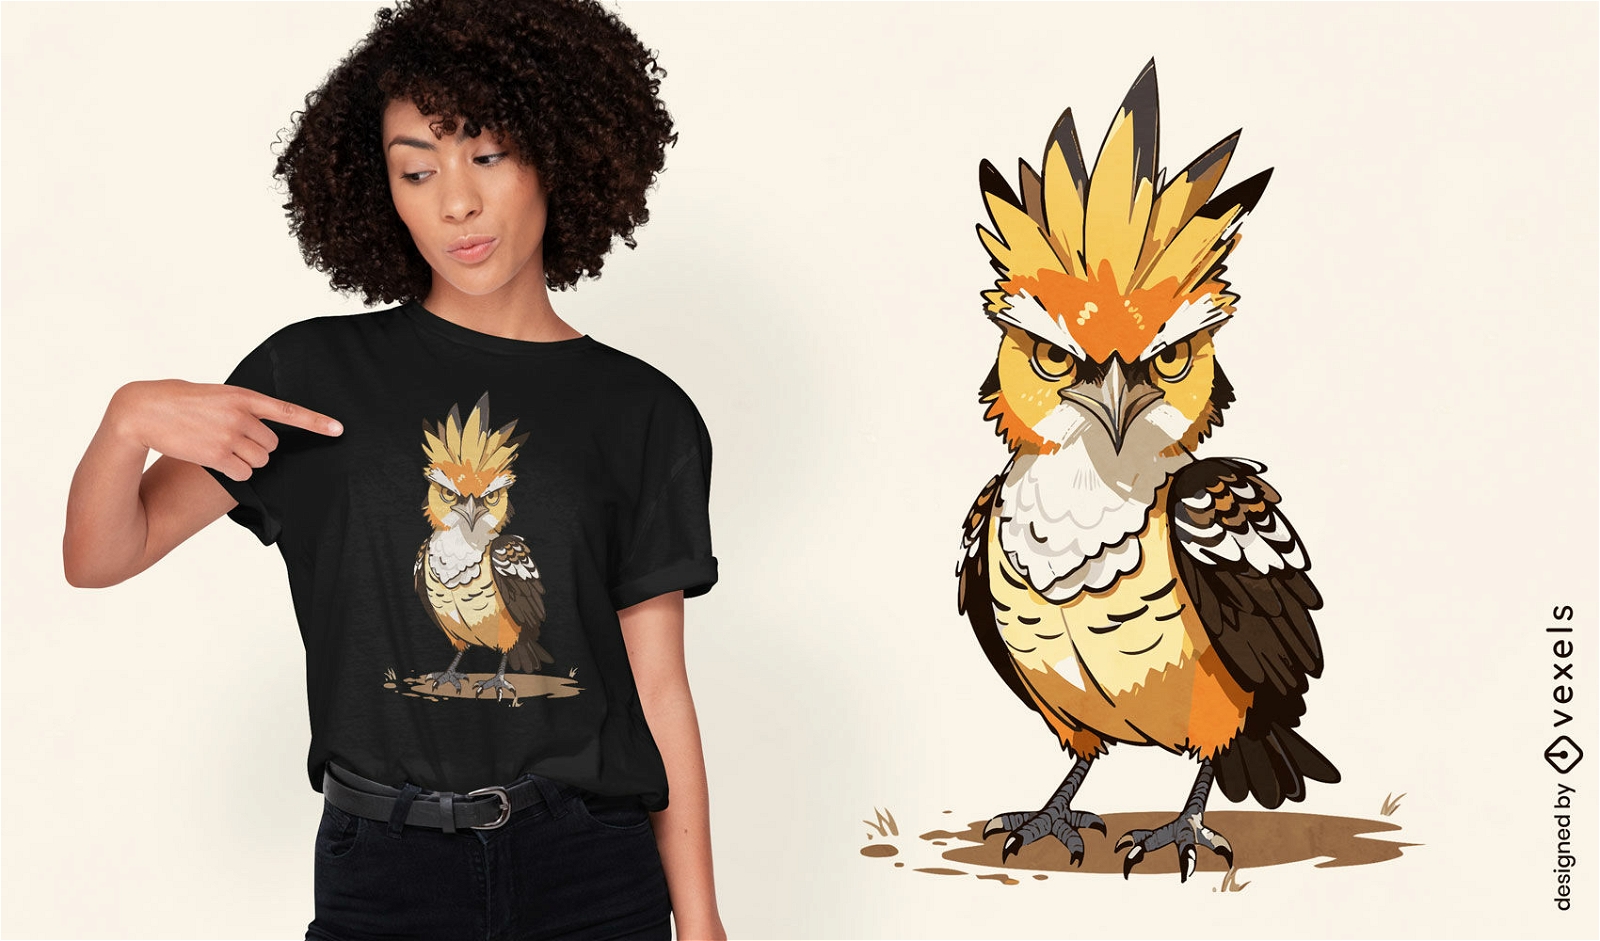
Colorful hoopoe bird t-shirt design
Choose a folder
All favorites
Create new
Save
Colorful hoopoe bird t-shirt design
Editable text
Print ready
for Merch
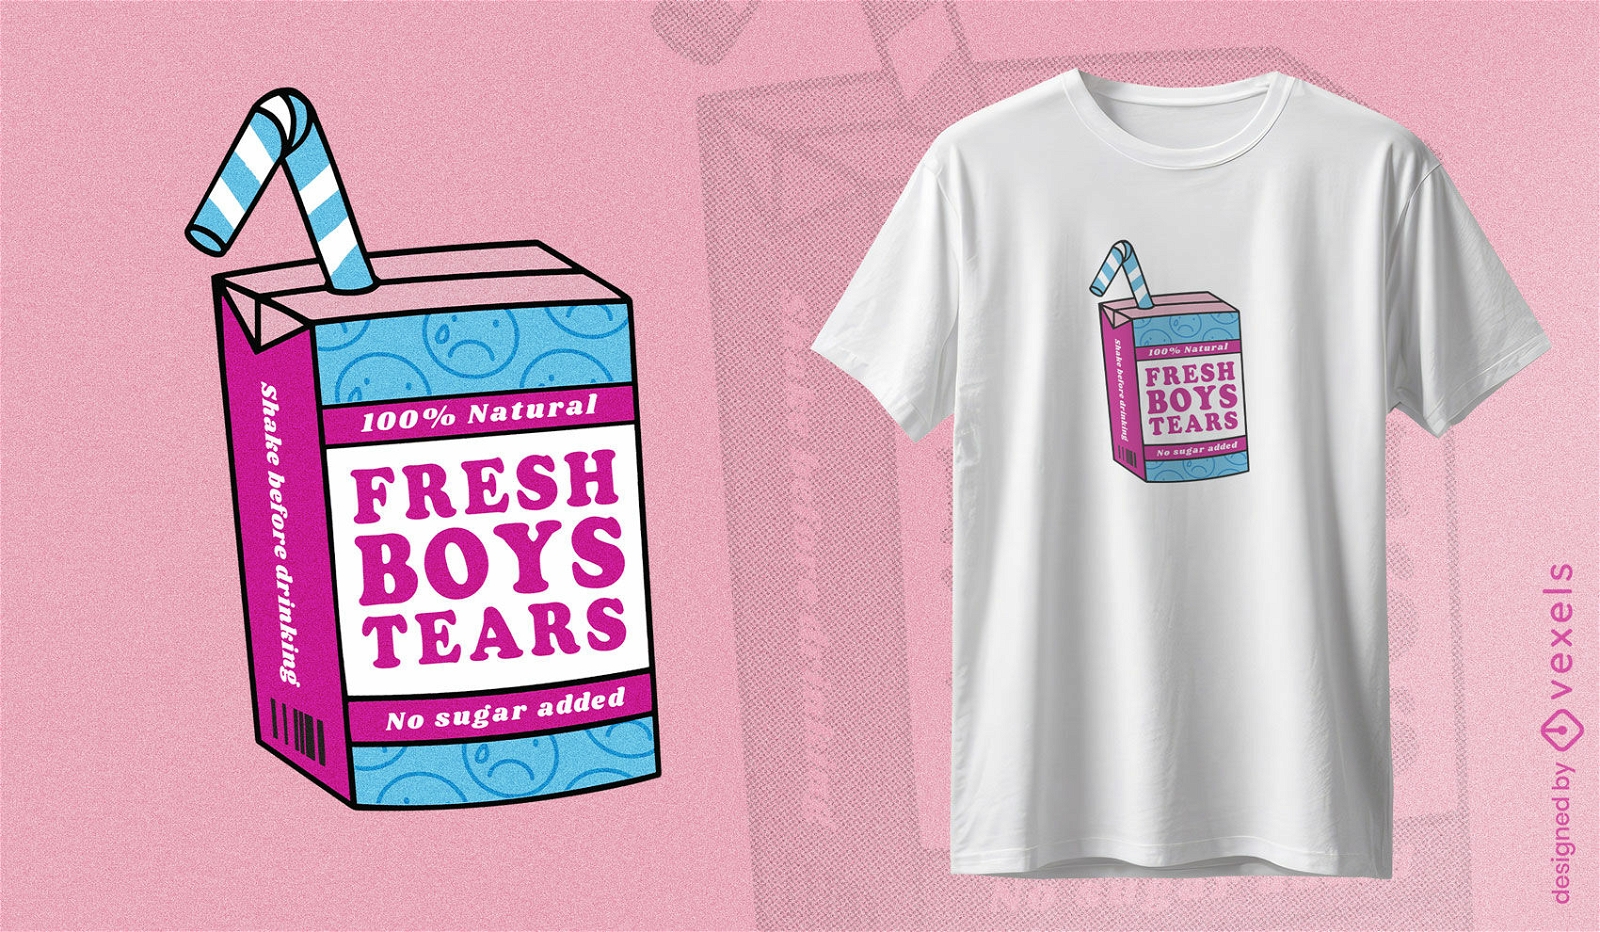
Sassy boys' tears t-shirt design
Choose a folder
All favorites
Create new
Save
Sassy boys' tears t-shirt design
Print ready
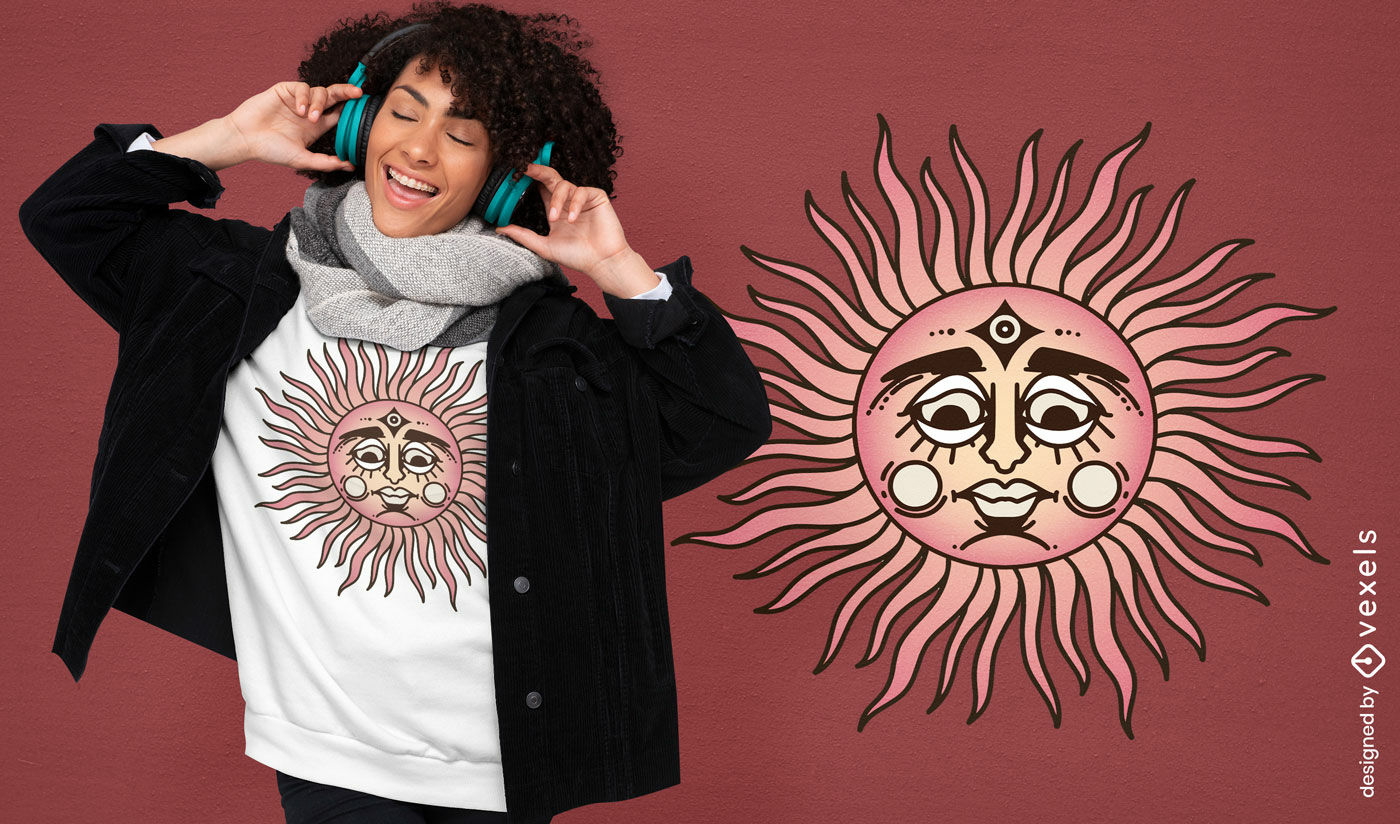
for Merch
Serene esoteric sun t-shirt design
Choose a folder
All favorites
Create new
Save
Serene esoteric sun t-shirt design
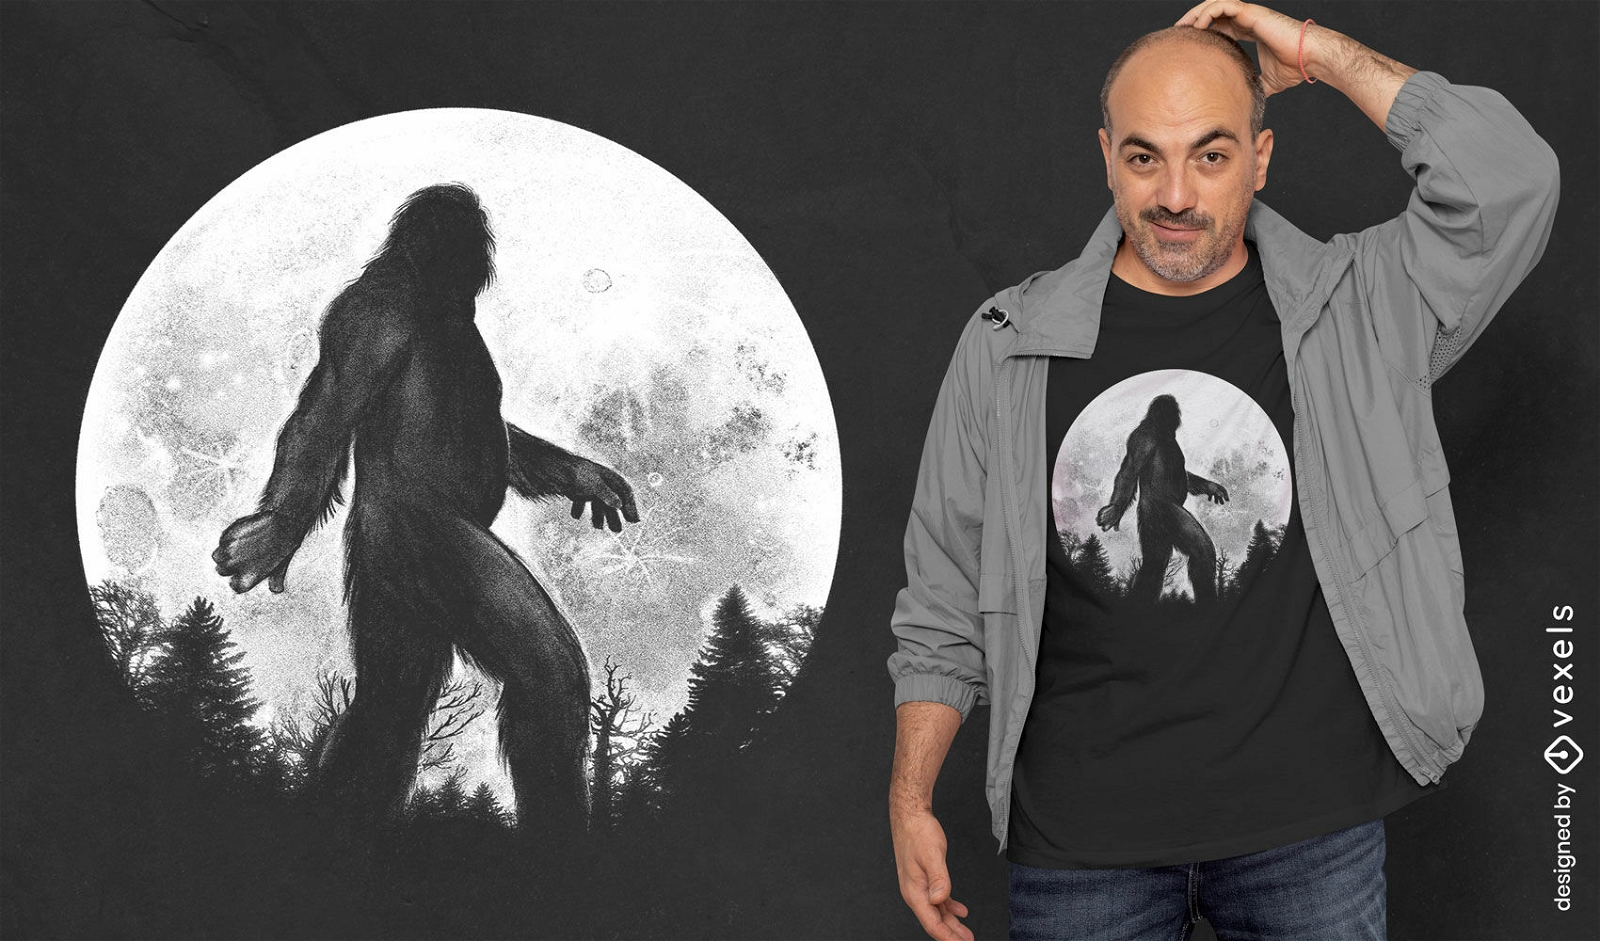
Print ready
for Merch
Bigfoot full moon t-shirt design
Choose a folder
All favorites
Create new
Save
Bigfoot full moon t-shirt design
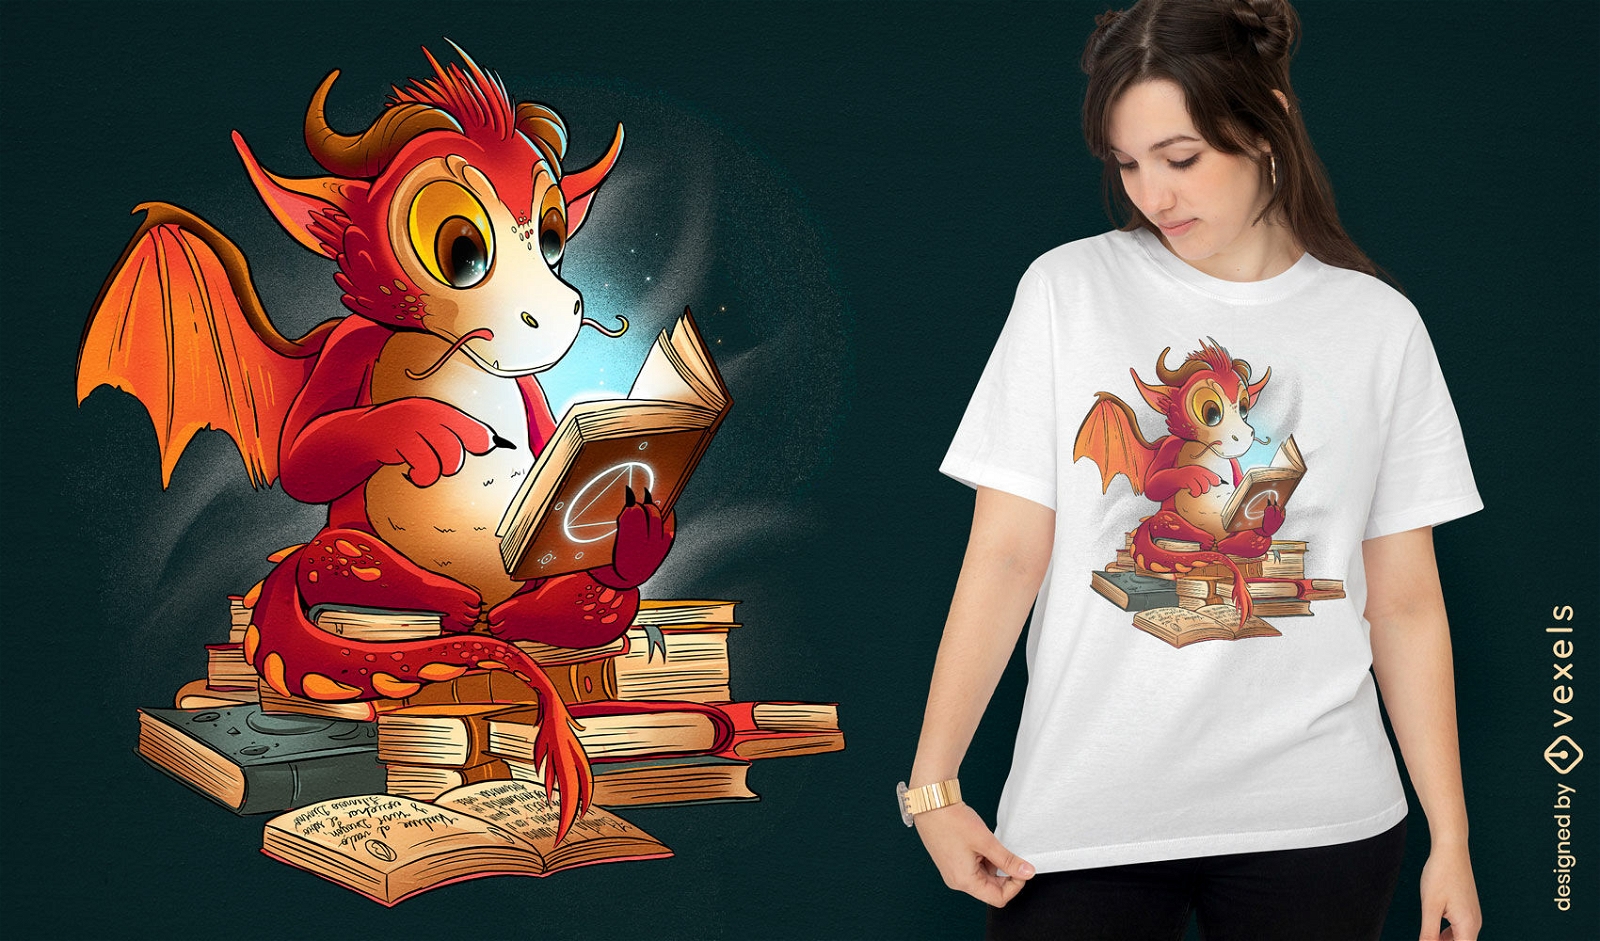
Print ready
for Merch
Reading dragon fantasy t-shirt design
Choose a folder
All favorites
Create new
Save
Reading dragon fantasy t-shirt design
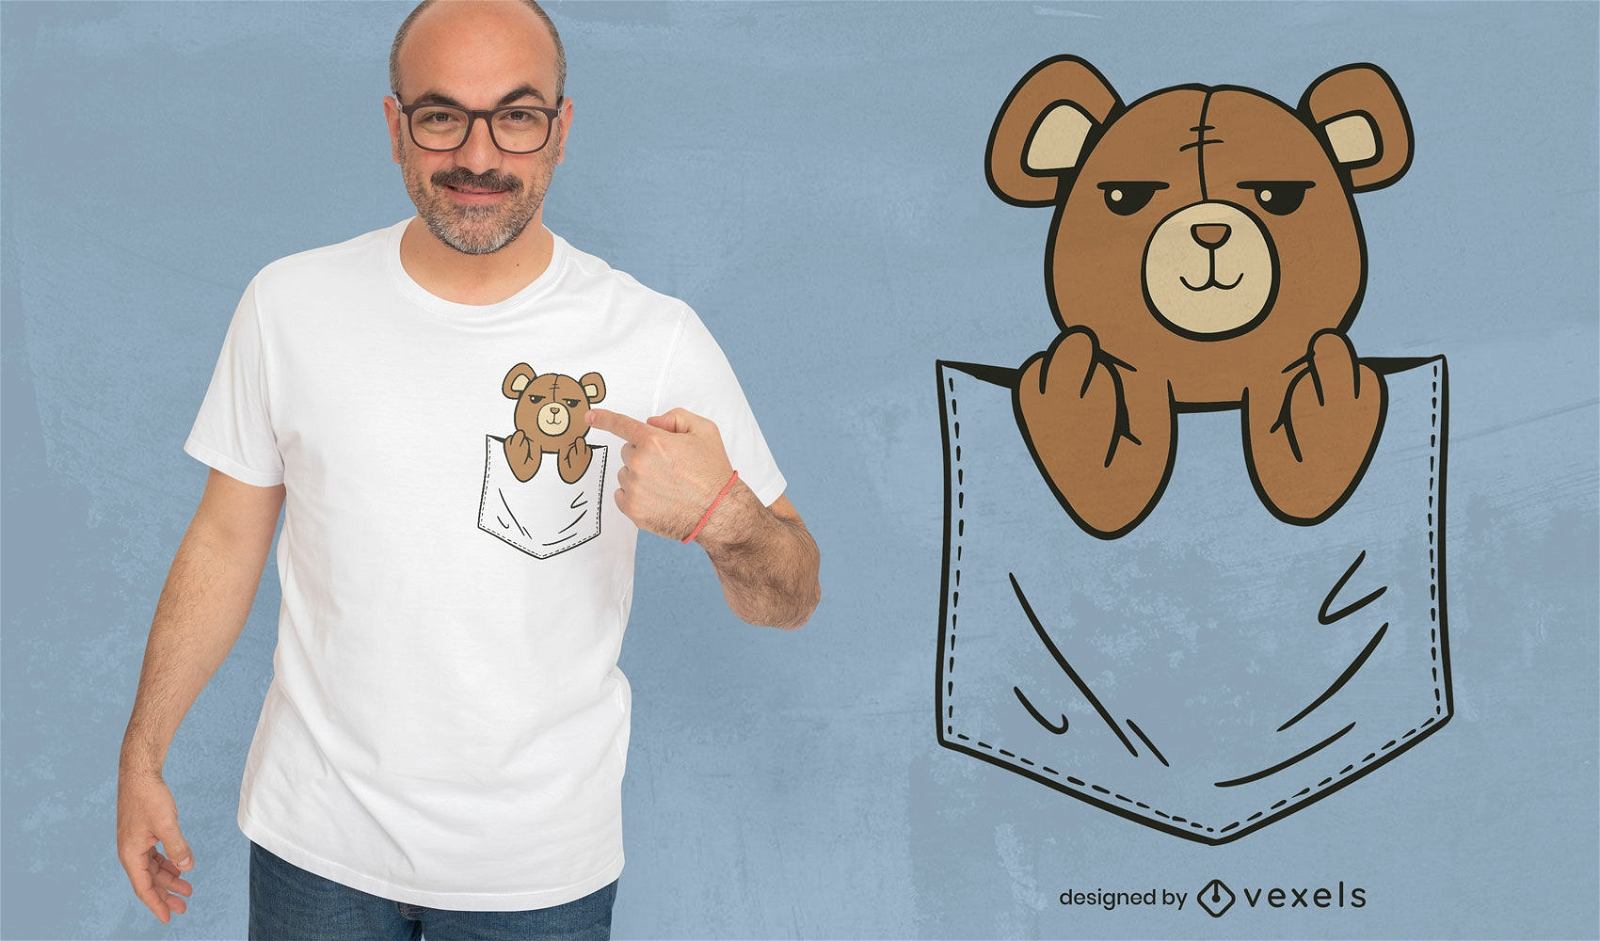
Print ready
for Merch
Cartoon teddy bear on pocket t-shirt design
Choose a folder
All favorites
Create new
Save
Cartoon teddy bear on pocket t-shirt design
Print ready
for Merch
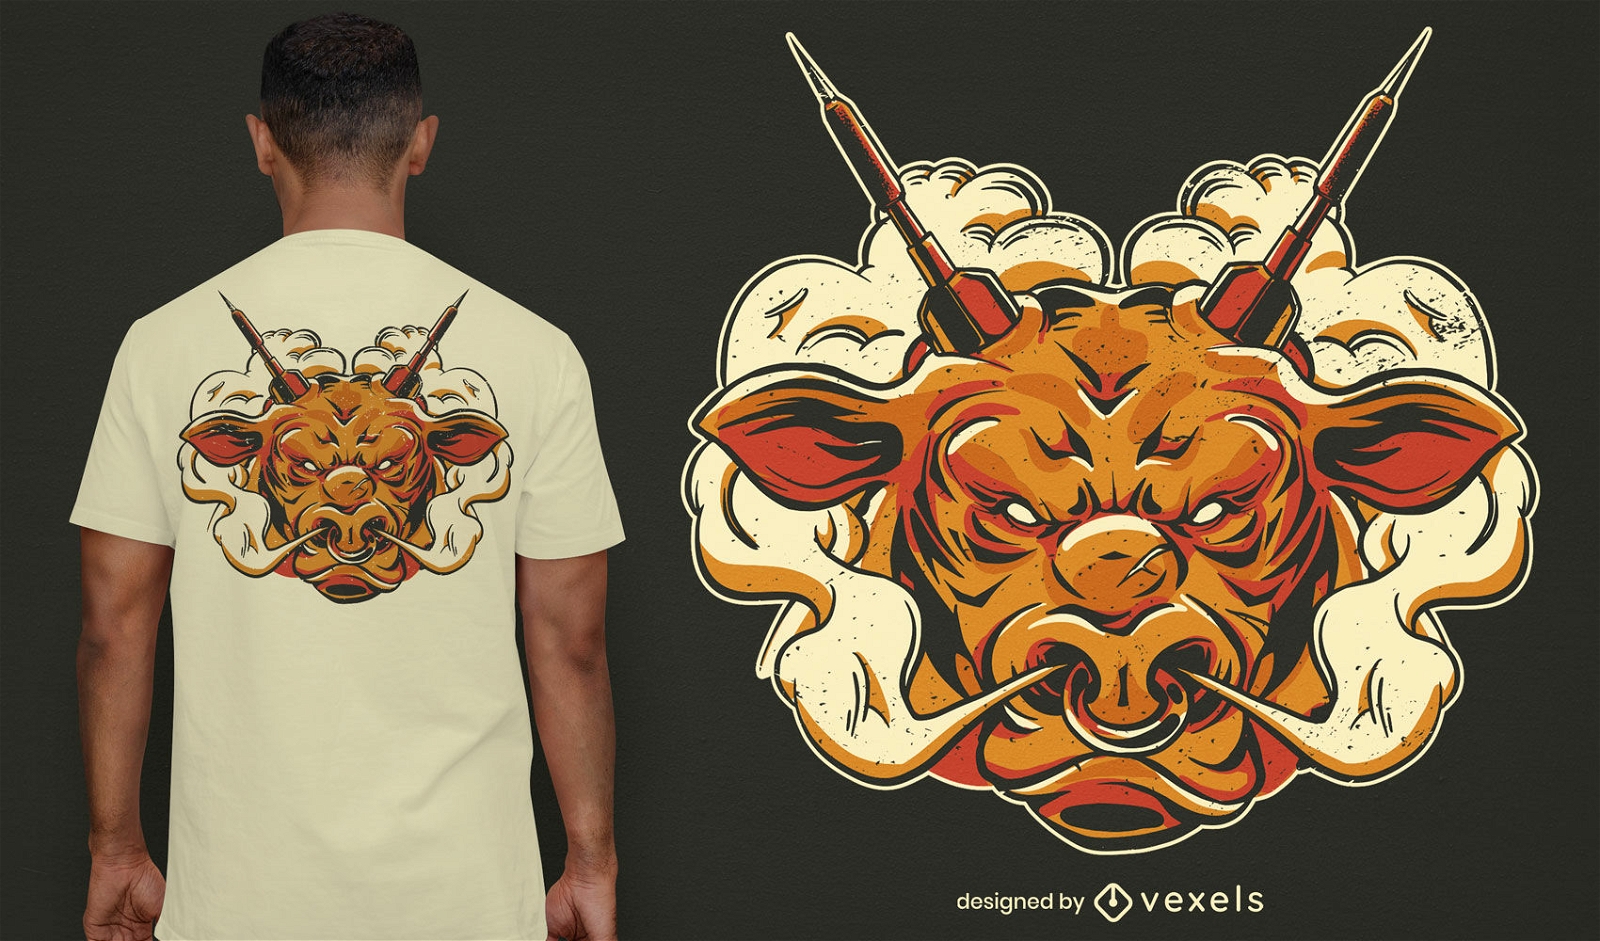
Angry bull animal with darts t-shirt design
Choose a folder
All favorites
Create new
Save
Angry bull animal with darts t-shirt design
Print ready
for Merch
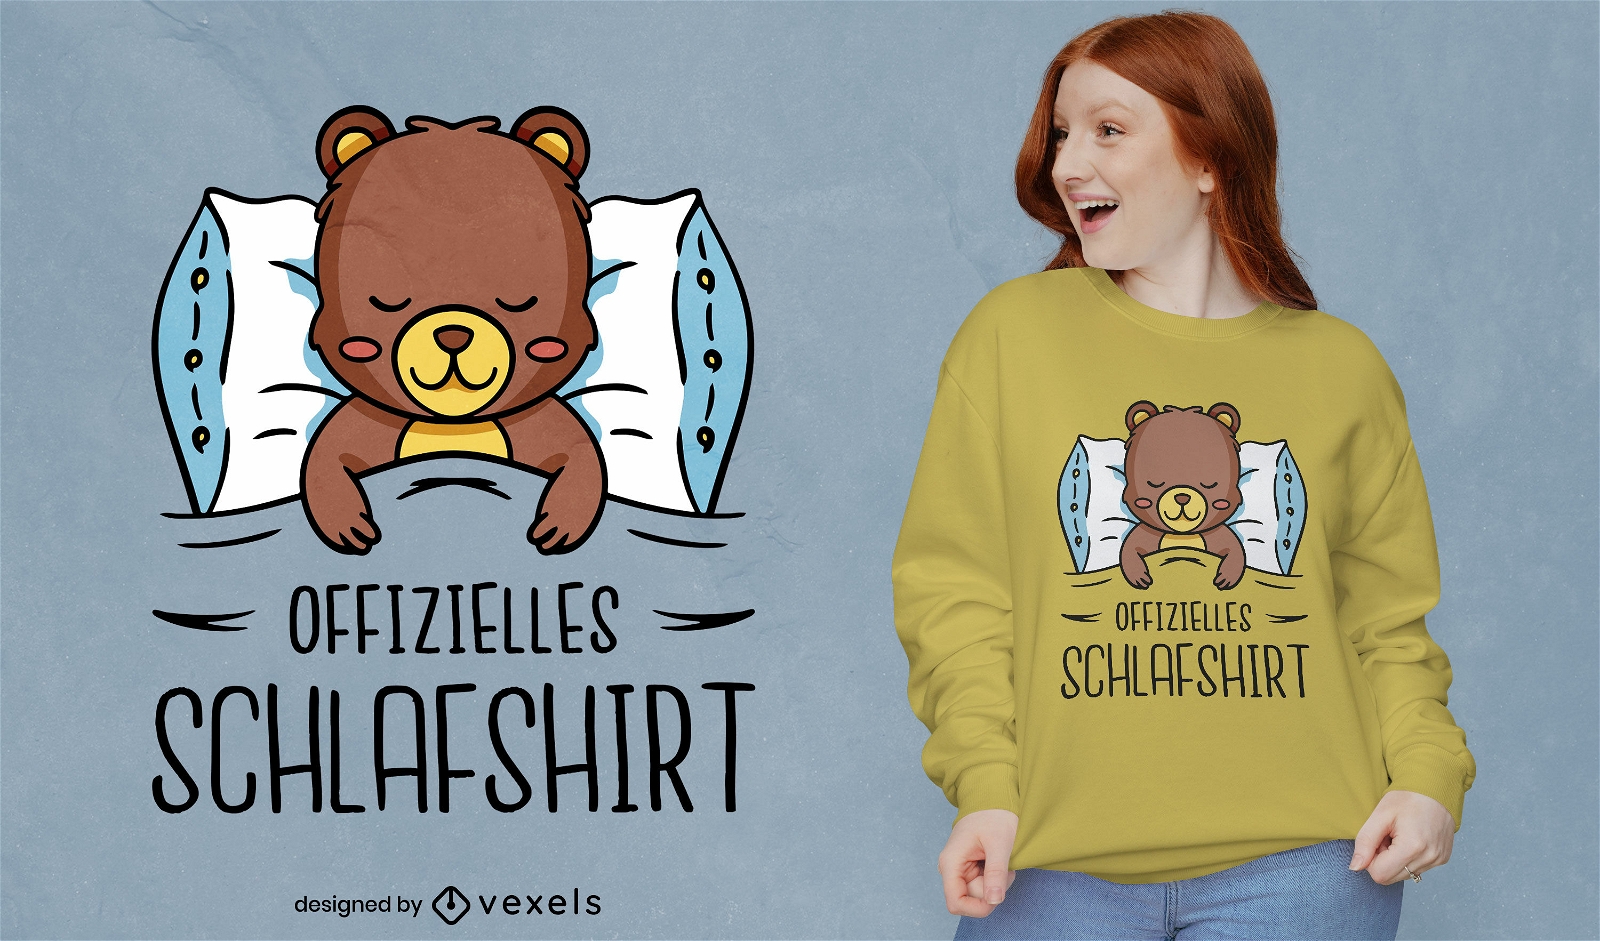
Official sleep shirt cute bear t-shirt design
Choose a folder
All favorites
Create new
Save
Official sleep shirt cute bear t-shirt design
Print ready
for Merch
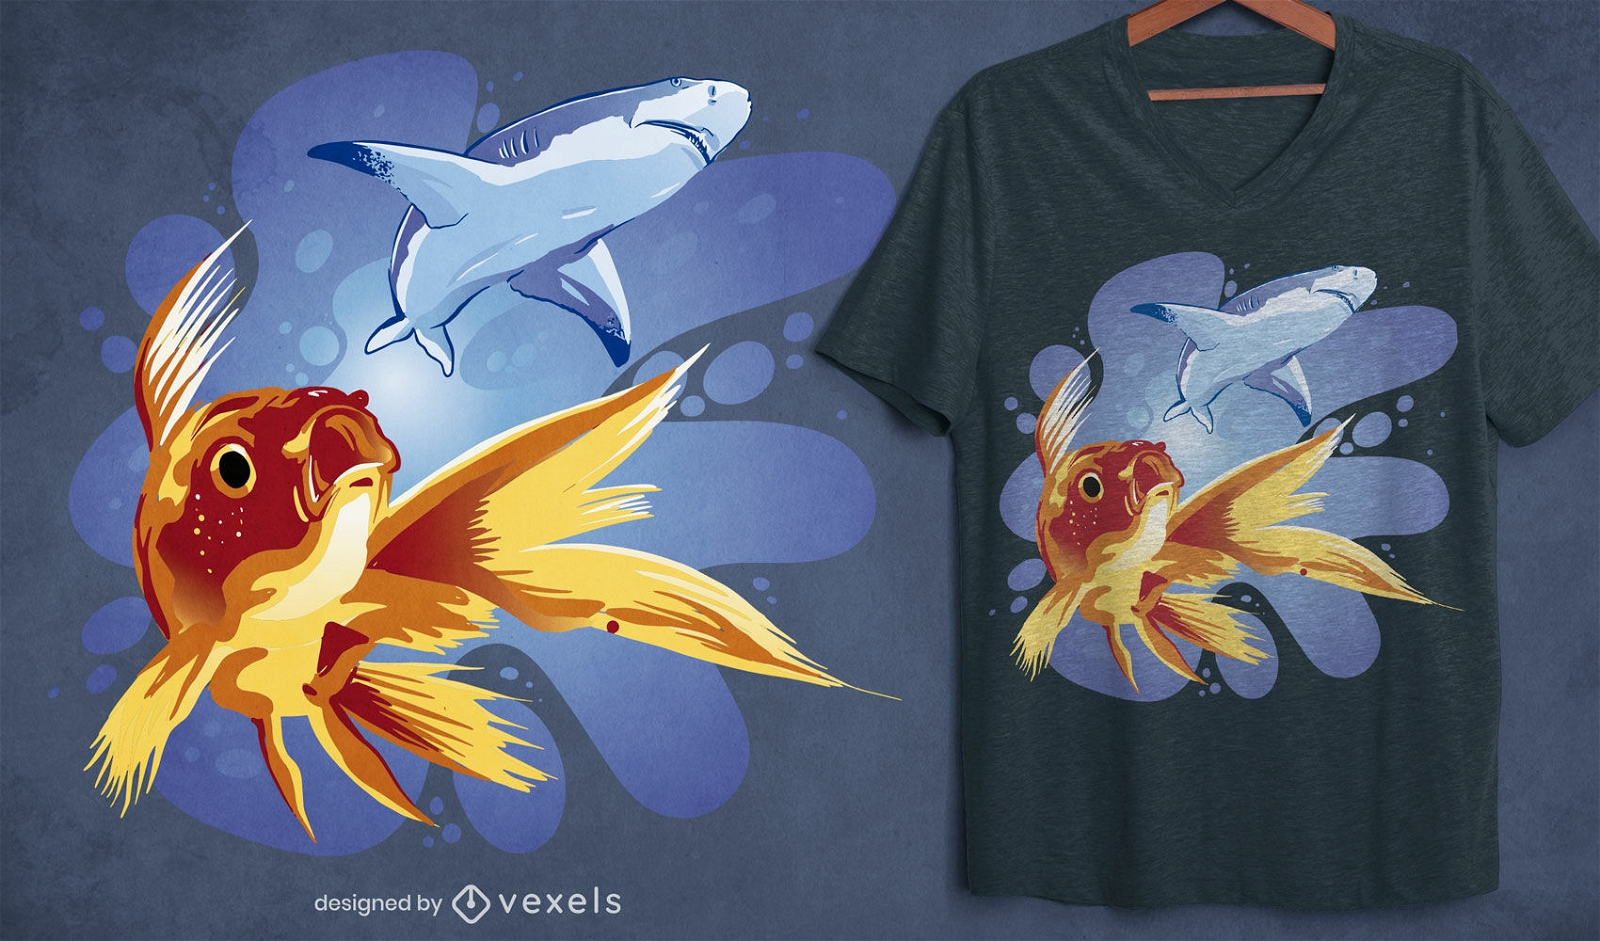
Goldfish and shark swimming t-shirt design
Choose a folder
All favorites
Create new
Save
Goldfish and shark swimming t-shirt design
Print ready
for Merch
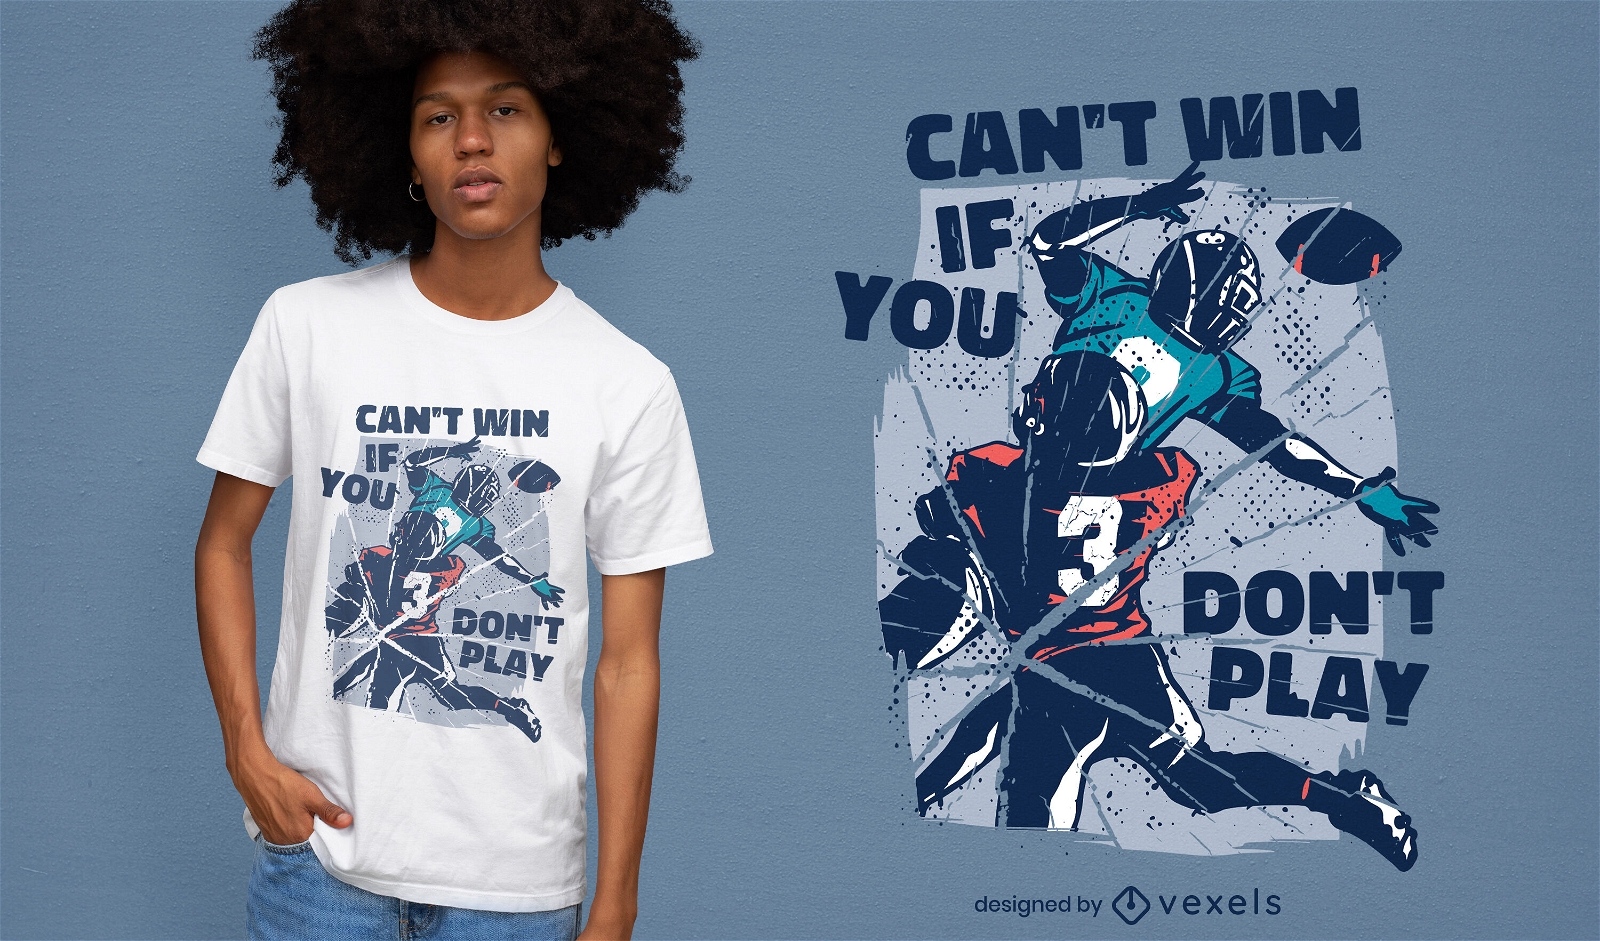
American football quote t-shirt design
Choose a folder
All favorites
Create new
Save
American football quote t-shirt design
Print ready
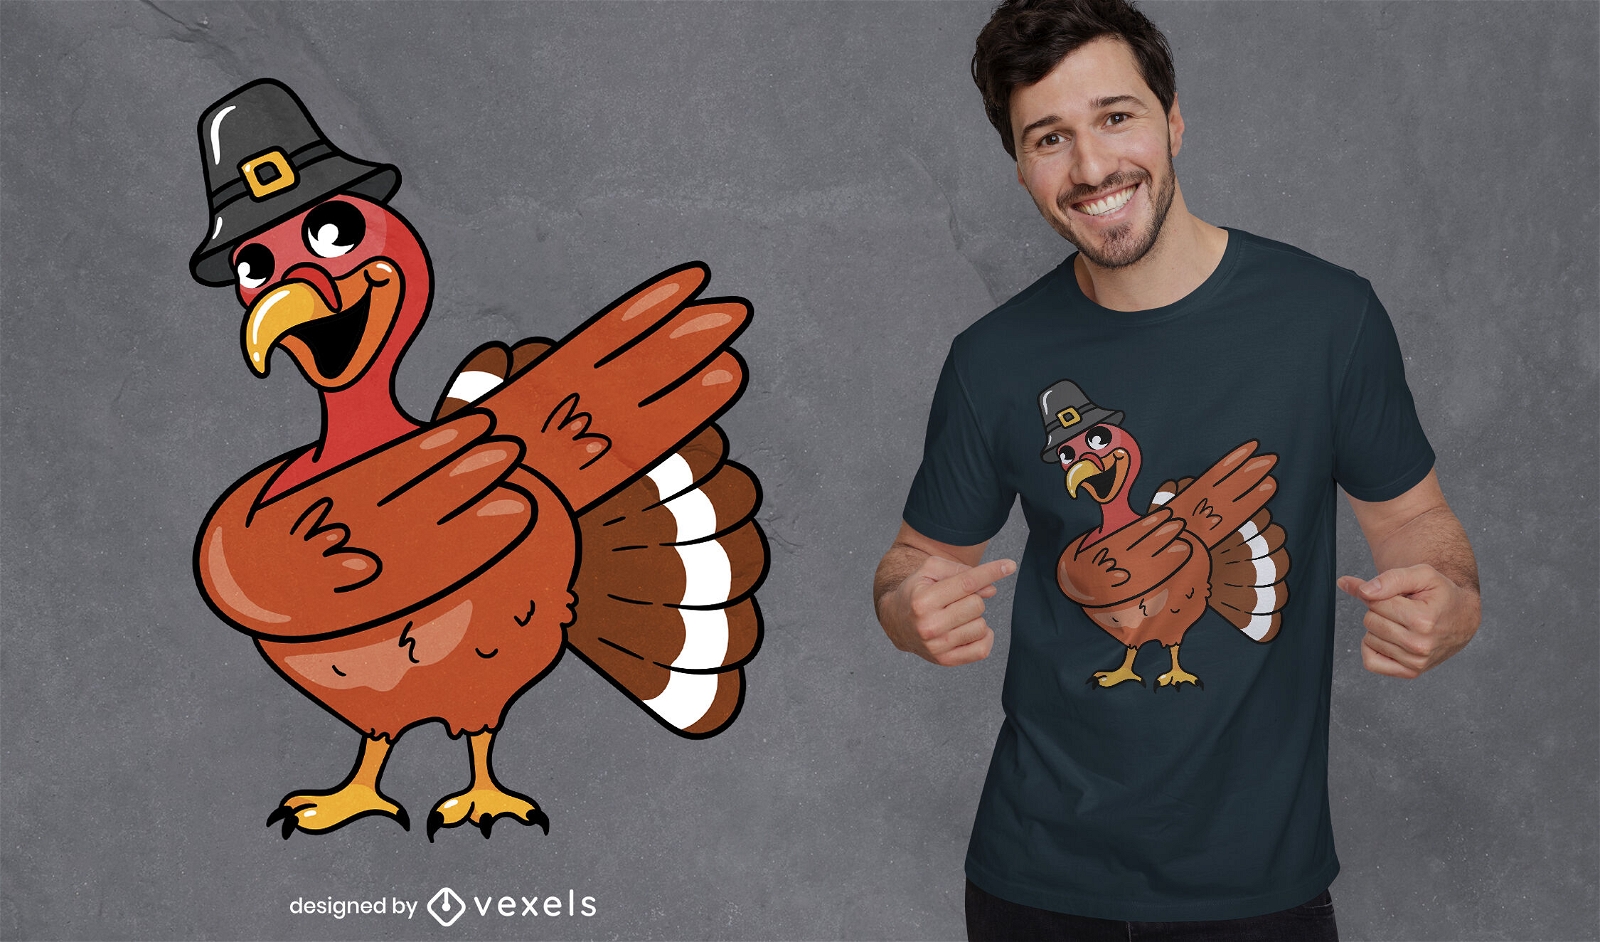
for Merch
Turkey animal dabbing t-shirt design
Choose a folder
All favorites
Create new
Save
Turkey animal dabbing t-shirt design
Print ready
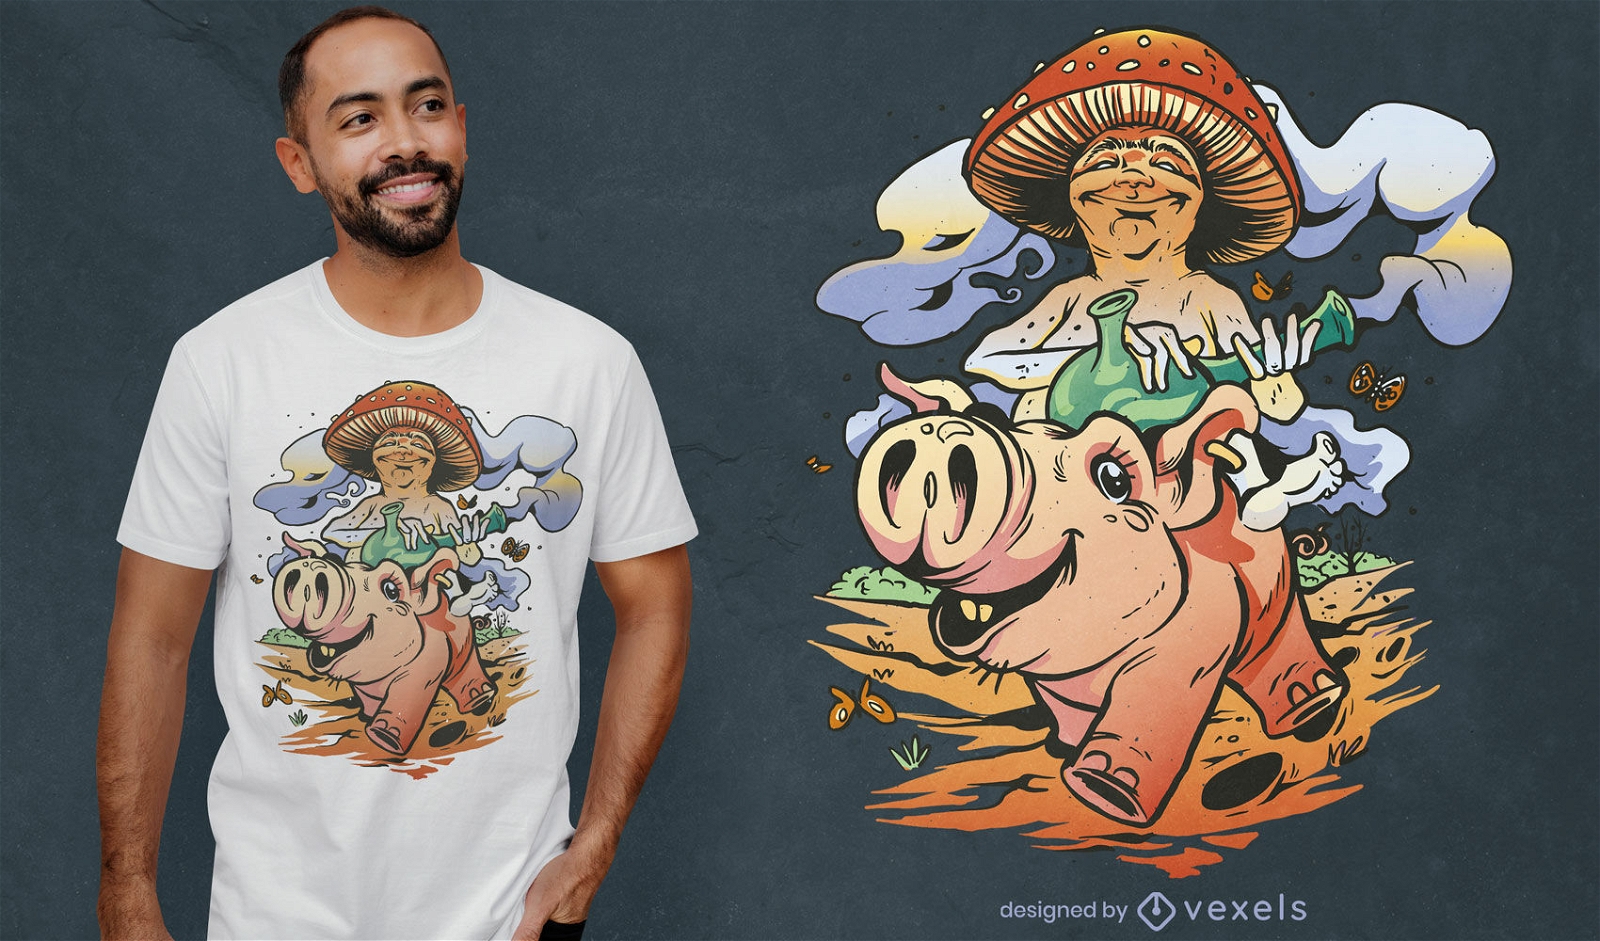
for Merch
Mushroom on pig cartoon t-shirt design
Choose a folder
All favorites
Create new
Save
Mushroom on pig cartoon t-shirt design
Boost Your Business
With The Leading Graphic Platform For Merch.
SEE PLANS
Next
of 720
prev page
next page