Design Library
Explore Designs
New Merch Designs
Trending Merch Designs
Vectors
PNGs & SVGs
Mockups
T-Shirts
T-Shirt PSD Templates
KDP Designs
Phone Cases
Pillows
Tote Bags
Posters
Mugs
Design Tools
Designer
New!
T-shirt Maker
Mockup Generator
Quote Generator
Logo Maker
Resources
Merch Digest
Blog
Help Center
Creators Program
Learn About Merch
Changelog
API Access
Pricing
Loading...
Sign Up
Login
PSD Templates
grafico
Design Library
Explore Designs
New Merch Designs
Trending Merch Designs
Vectors
PNGs & SVGs
Mockups
T-Shirts
T-Shirt PSD Templates
KDP Designs
Phone Cases
Pillows
Tote Bags
Posters
Mugs
Design Tools
Designer
New!
T-shirt Maker
Mockup Generator
Quote Generator
Logo Maker
Resources
Merch Digest
Blog
Help Center
Creators Program
Learn About Merch
Changelog
API Access
PLANS
PSD Templates
grafico
4214 grafico PSD T Shirt Designs and Mockups
Download editable grafico PSD t shirt designs or mockups
Sort by
Most relevant
Sponsored results by
Get 15% off with code: VEXELS15
Show more
Editable text
Print ready
for Merch
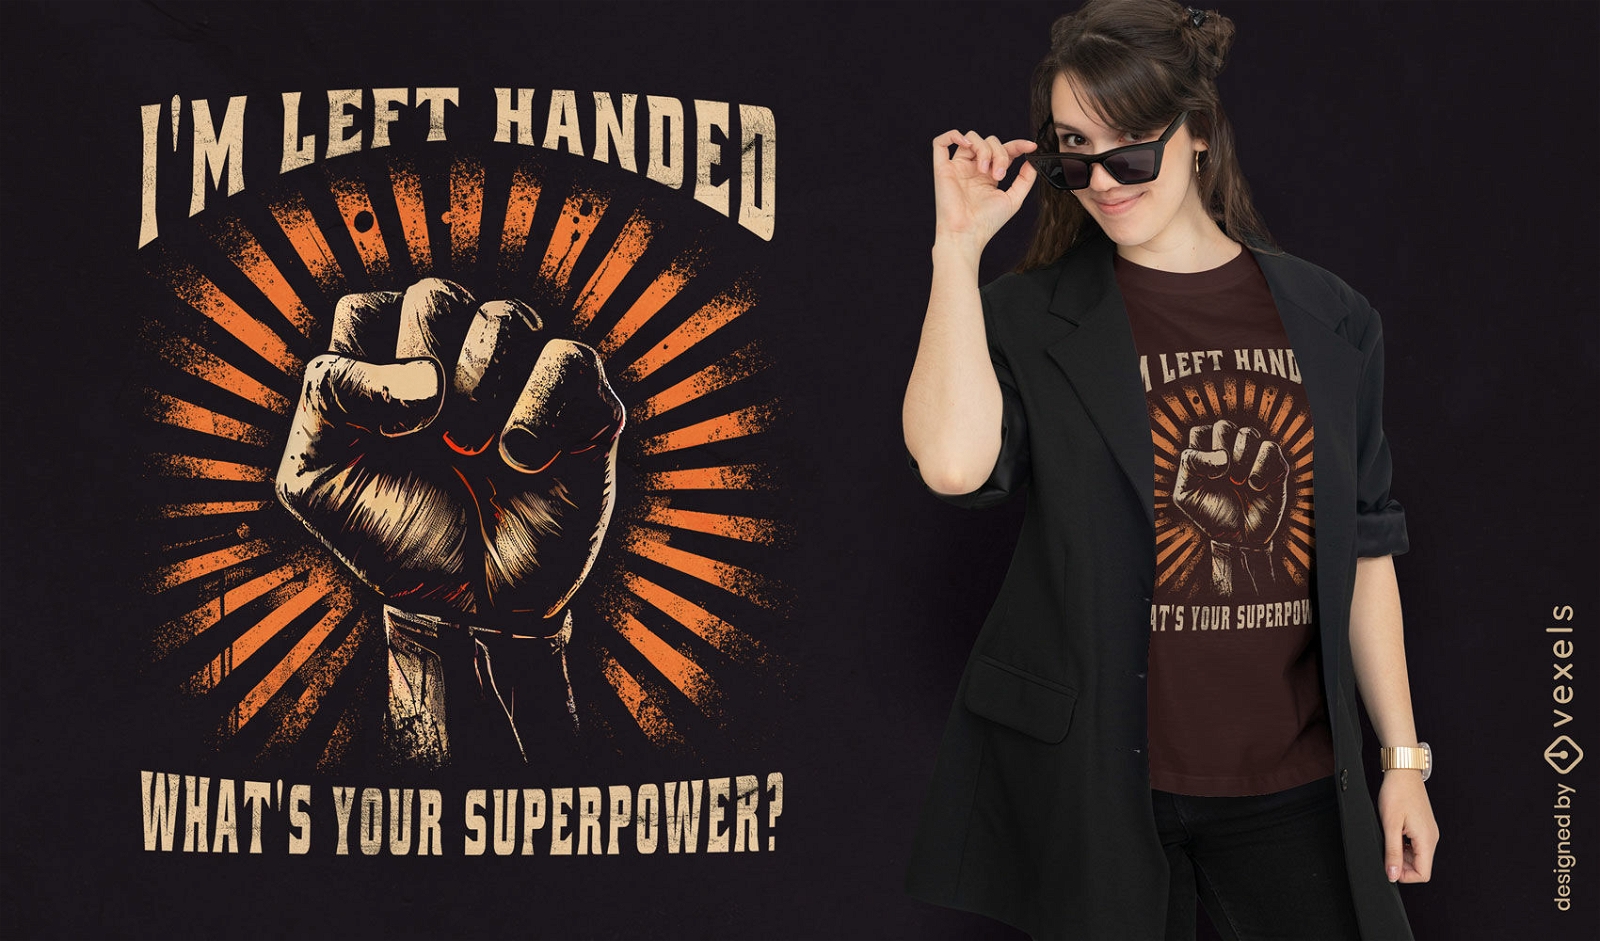
Left-handed pride t-shirt design
Choose a folder
All favorites
Create new
Save
Left-handed pride t-shirt design
Editable text
for Merch
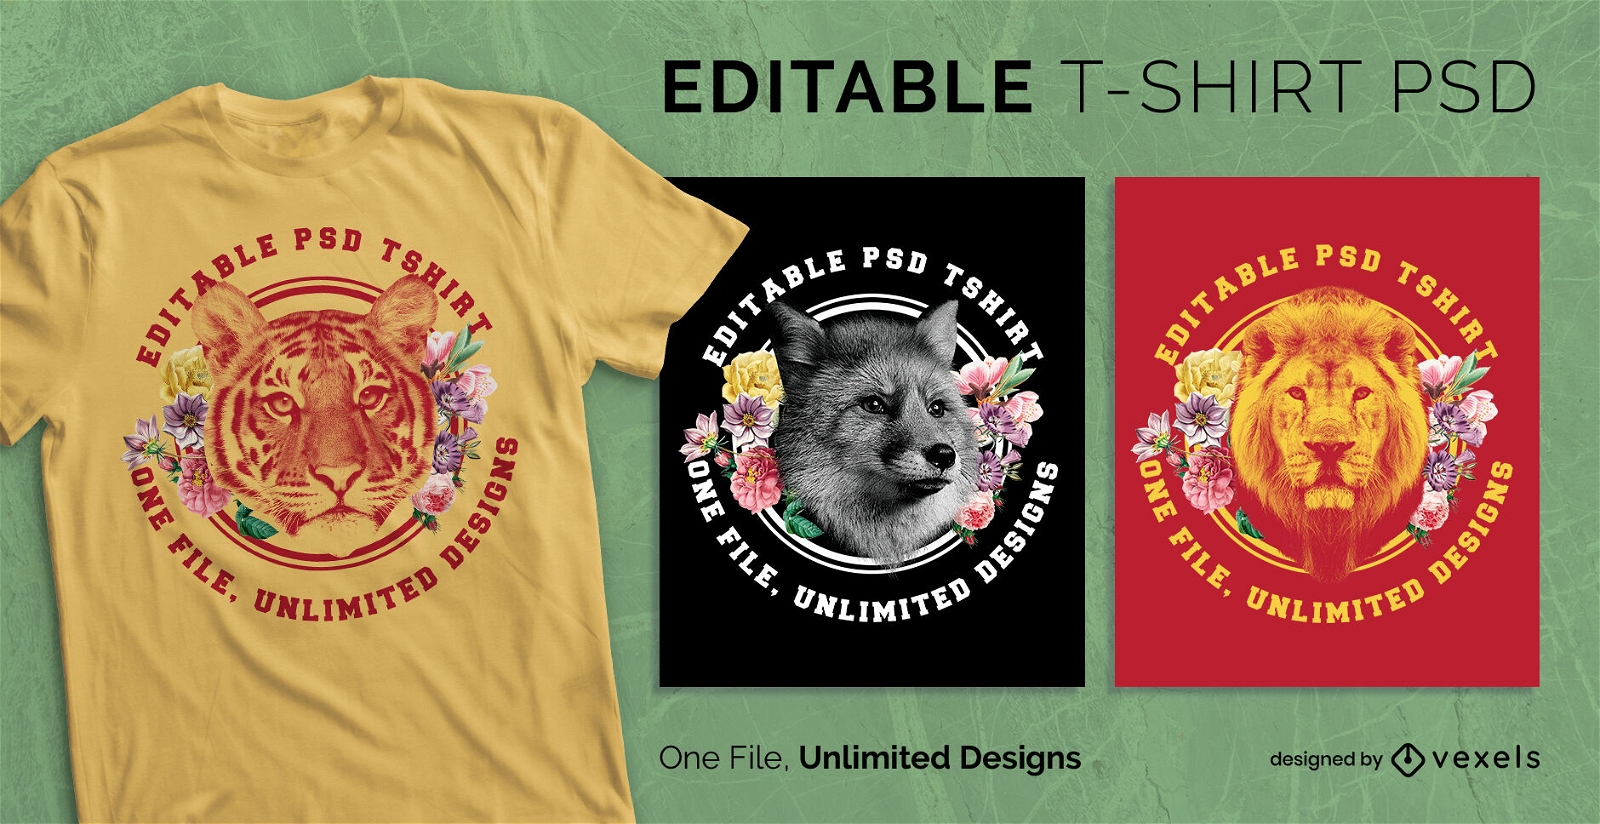
Wild animals with flowers scalable t-shirt psd
Choose a folder
All favorites
Create new
Save
Wild animals with flowers scalable t-shirt psd
Print ready
for Merch
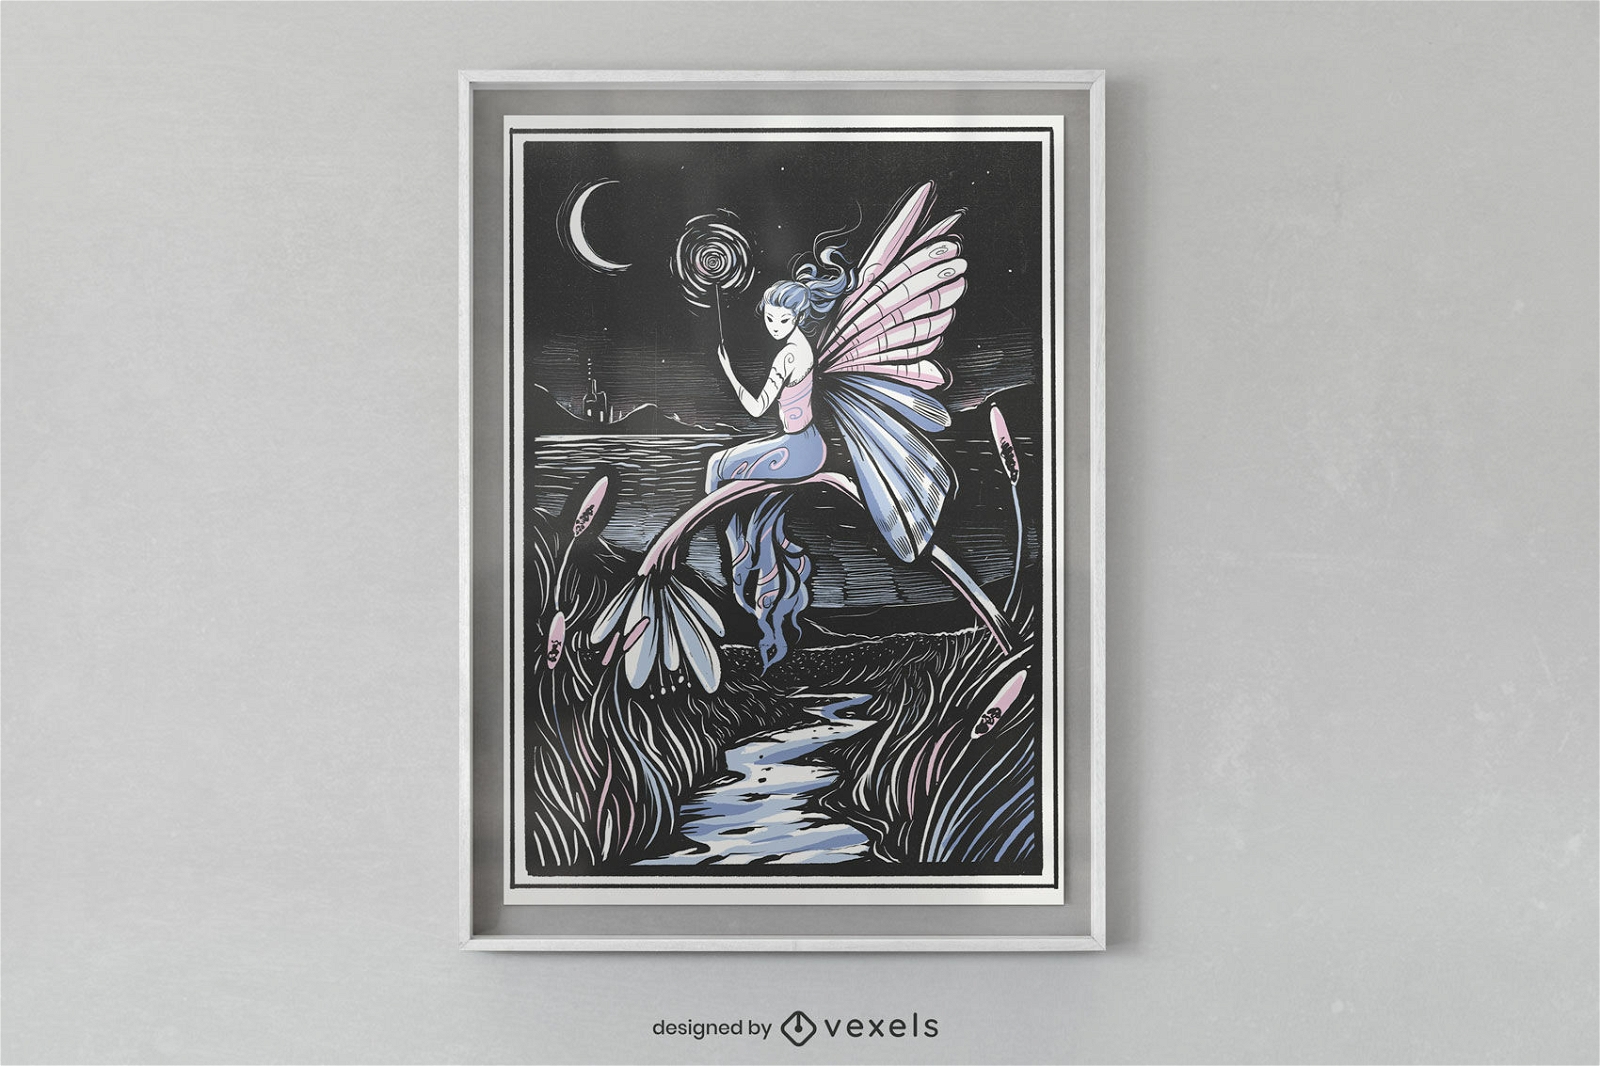
Fairy at night fantasy poster design
Choose a folder
All favorites
Create new
Save
Fairy at night fantasy poster design
Print ready
for Merch
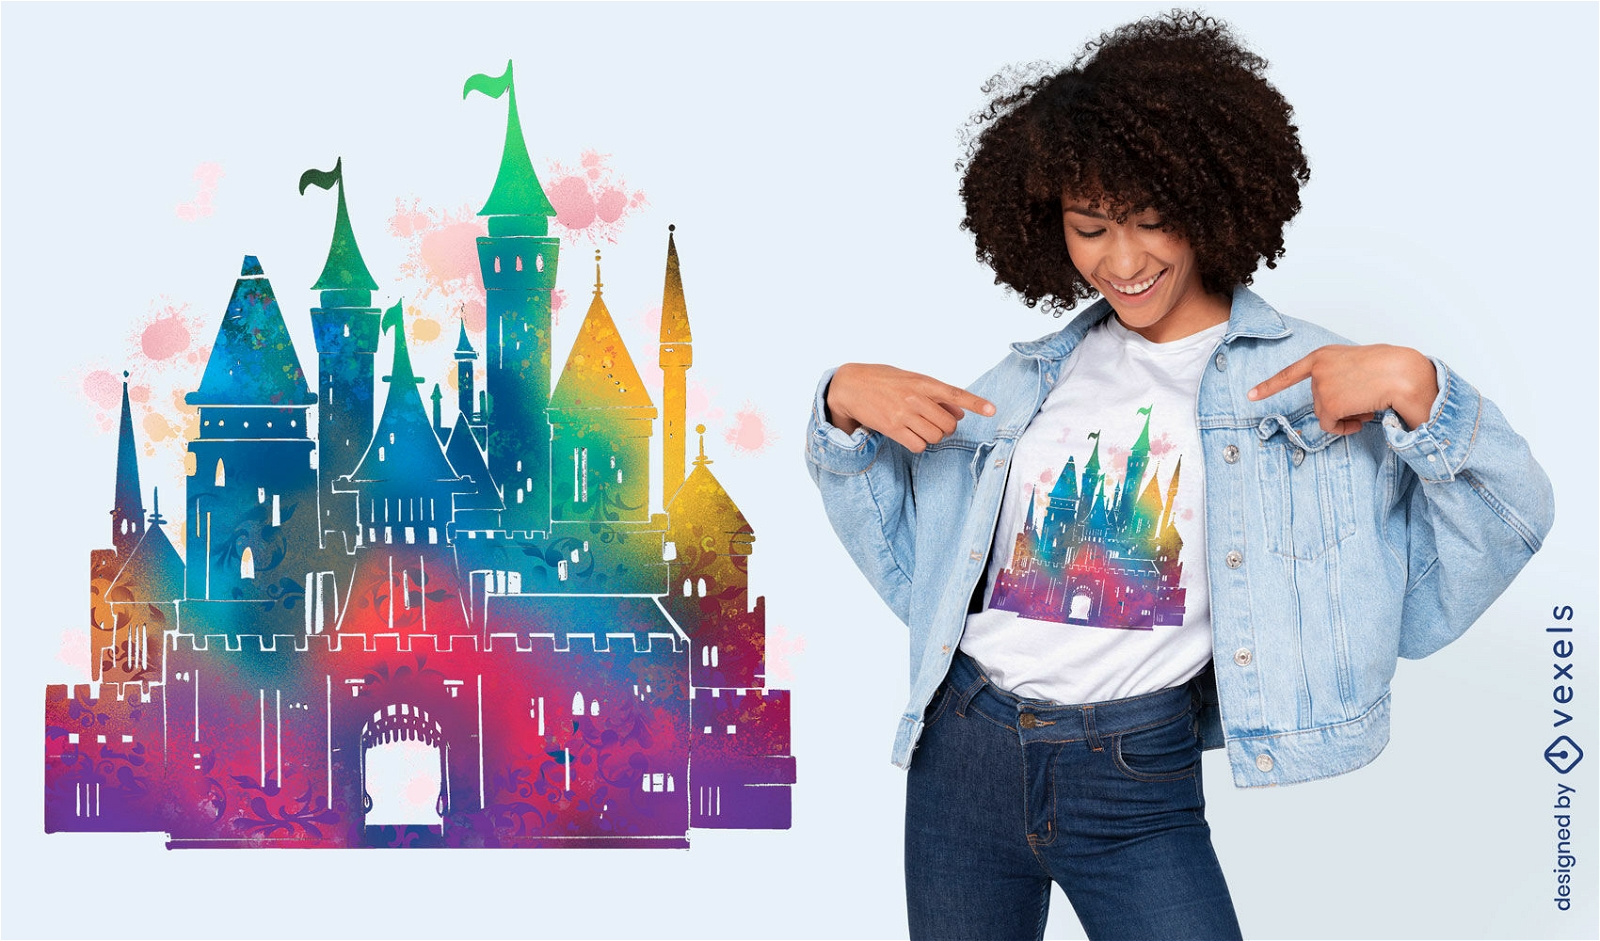
Colorful gradient castle t-shirt design
Choose a folder
All favorites
Create new
Save
Colorful gradient castle t-shirt design
Print ready
for Merch
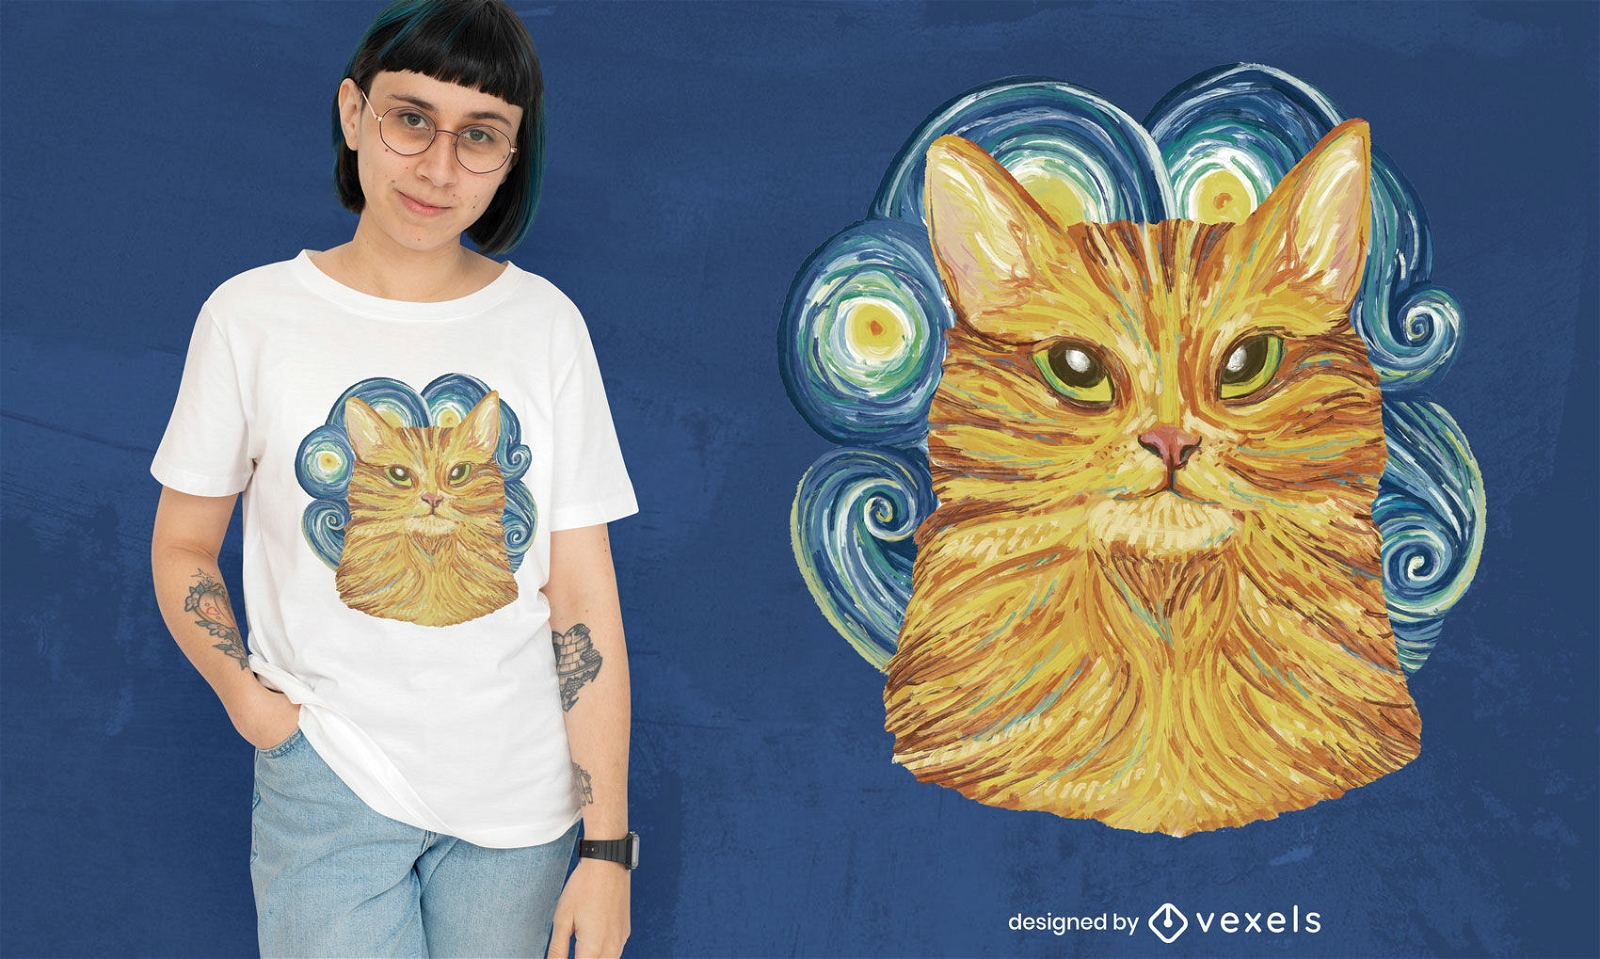
Golden cat post-impressionism t-shirt design
Choose a folder
All favorites
Create new
Save
Golden cat post-impressionism t-shirt design
Print ready
for Merch
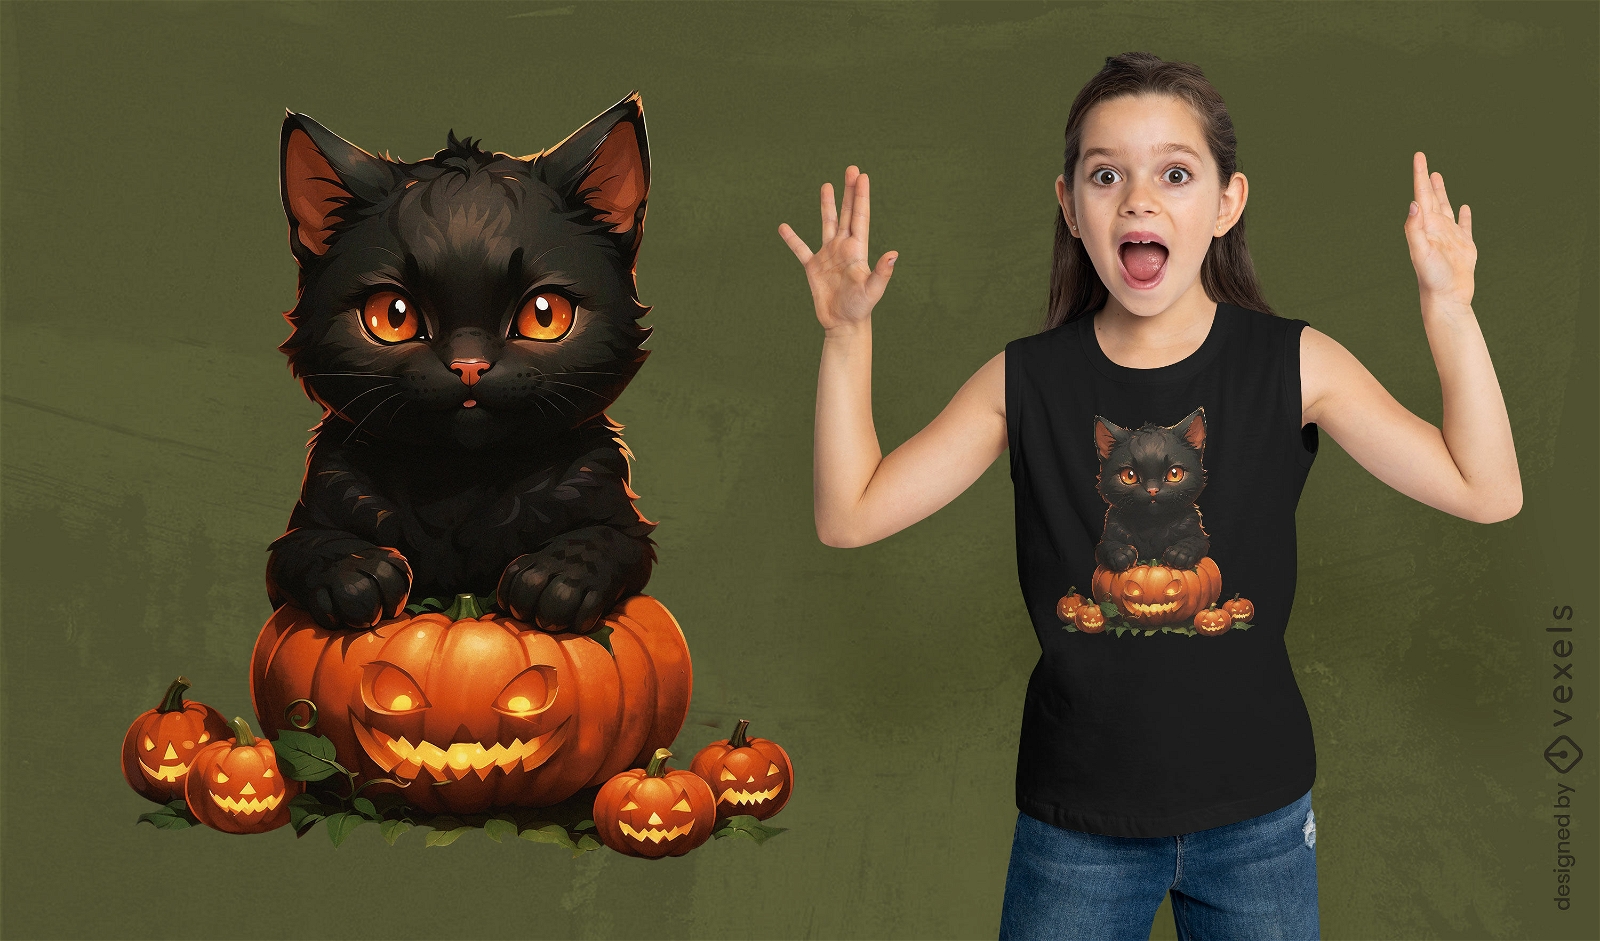
Halloween black cat t-shirt design
Choose a folder
All favorites
Create new
Save
Halloween black cat t-shirt design
Editable text
Print ready
for Merch
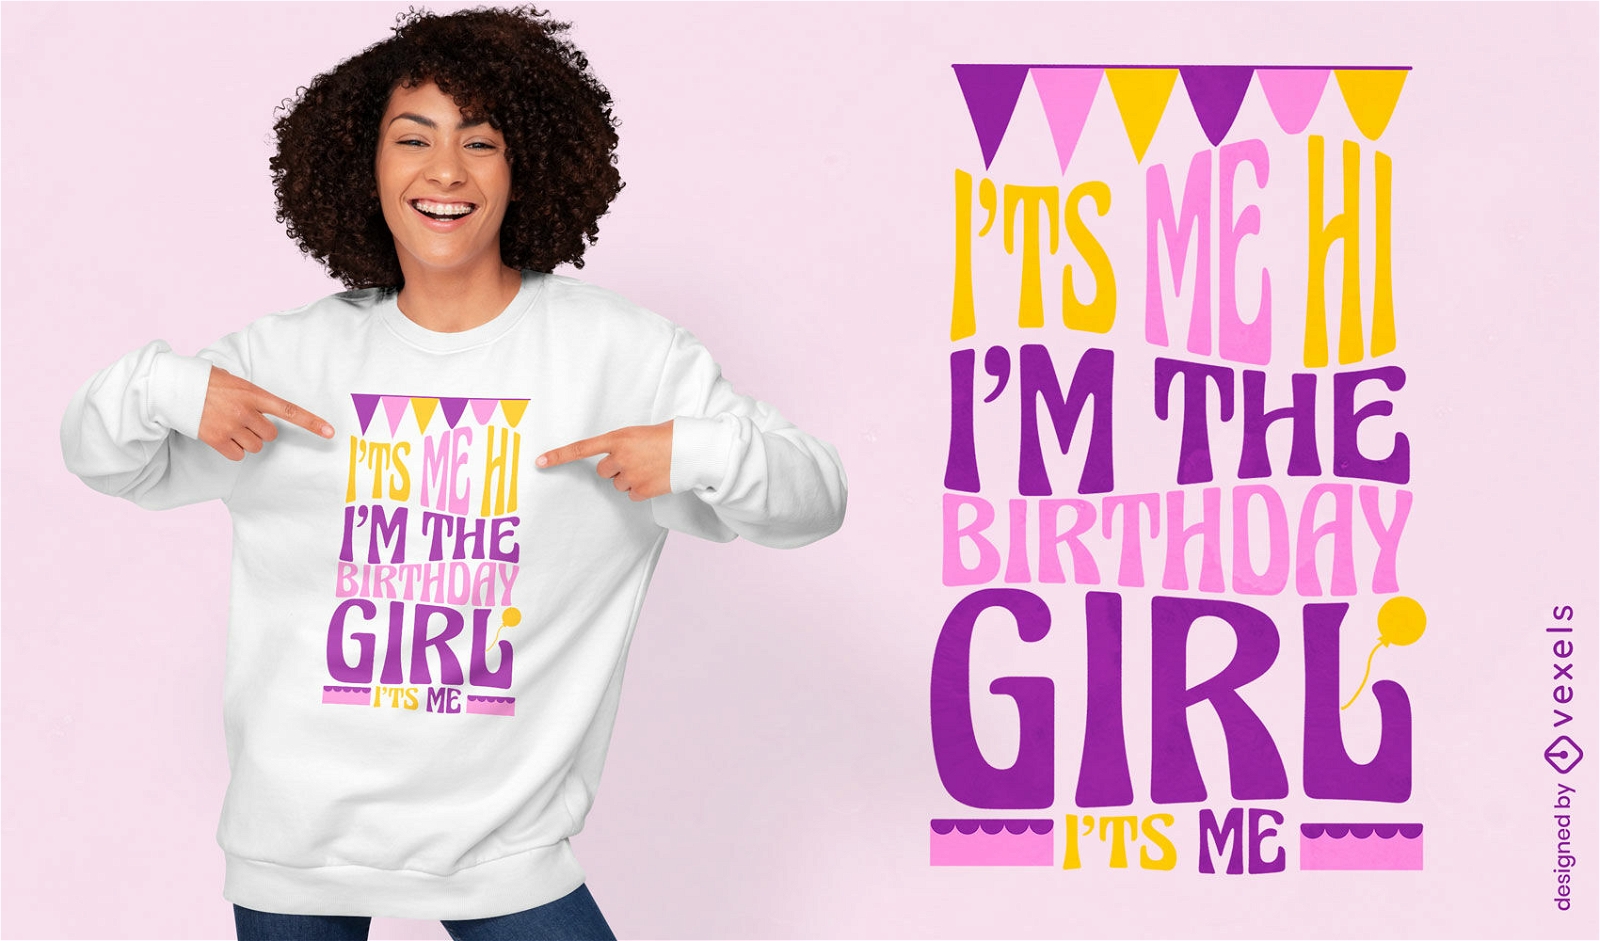
Birthday girl celebration t-shirt design
Choose a folder
All favorites
Create new
Save
Birthday girl celebration t-shirt design
Print ready
for Merch
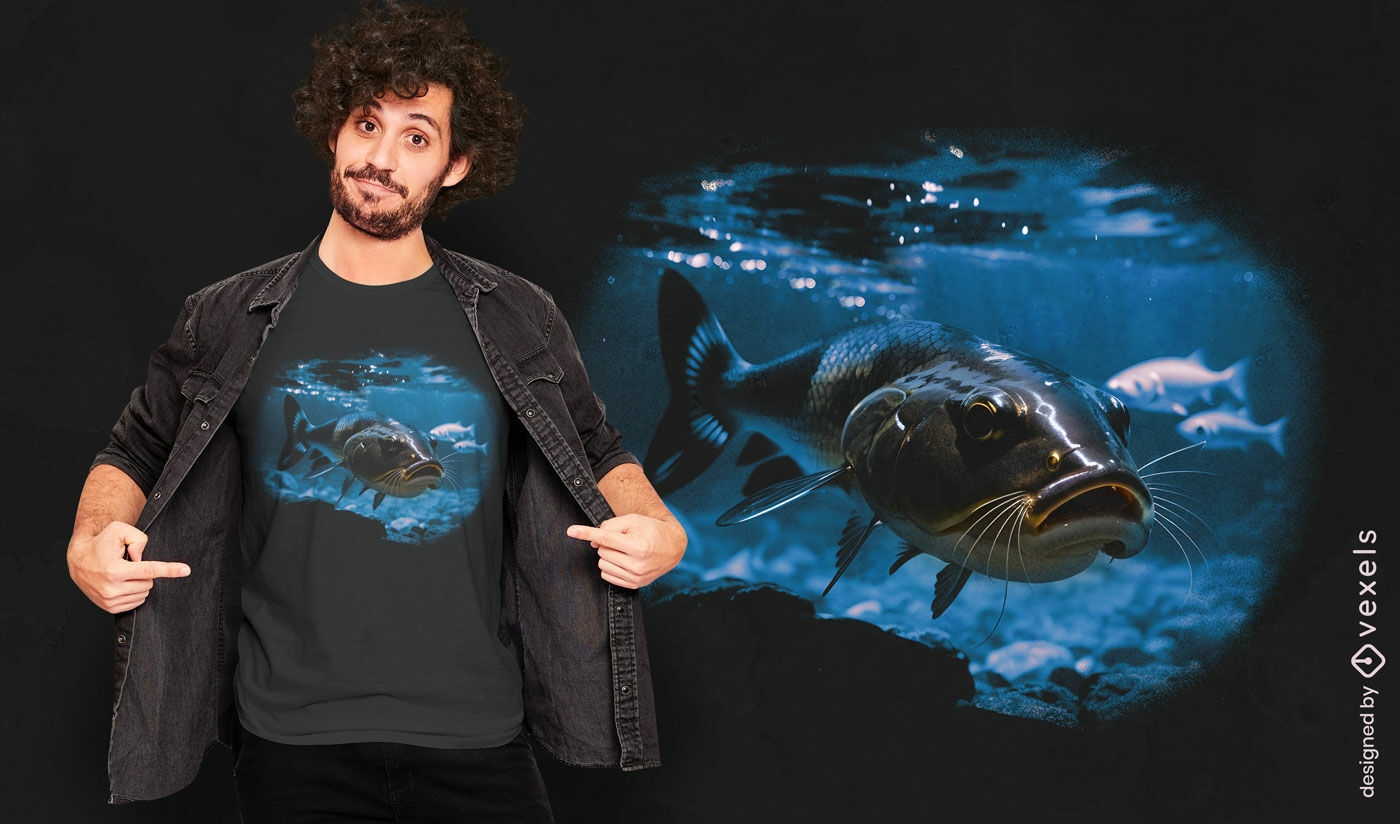
Realistic catfish illustration t-shirt design
Choose a folder
All favorites
Create new
Save
Realistic catfish illustration t-shirt design
Print ready
for Merch
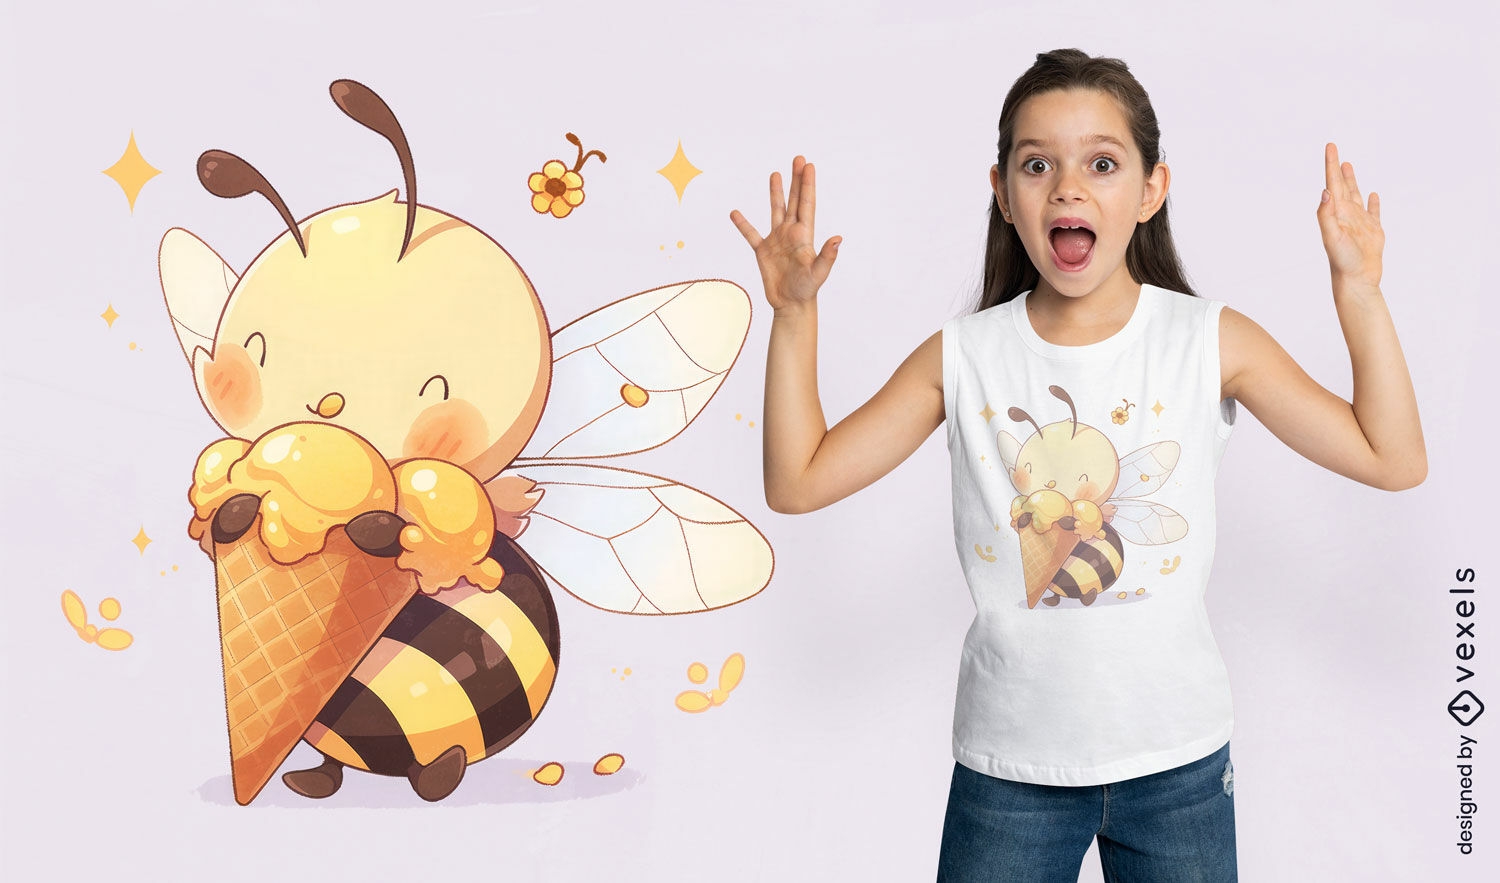
Sweet bee t-shirt design
Choose a folder
All favorites
Create new
Save
Sweet bee t-shirt design
Print ready
for Merch
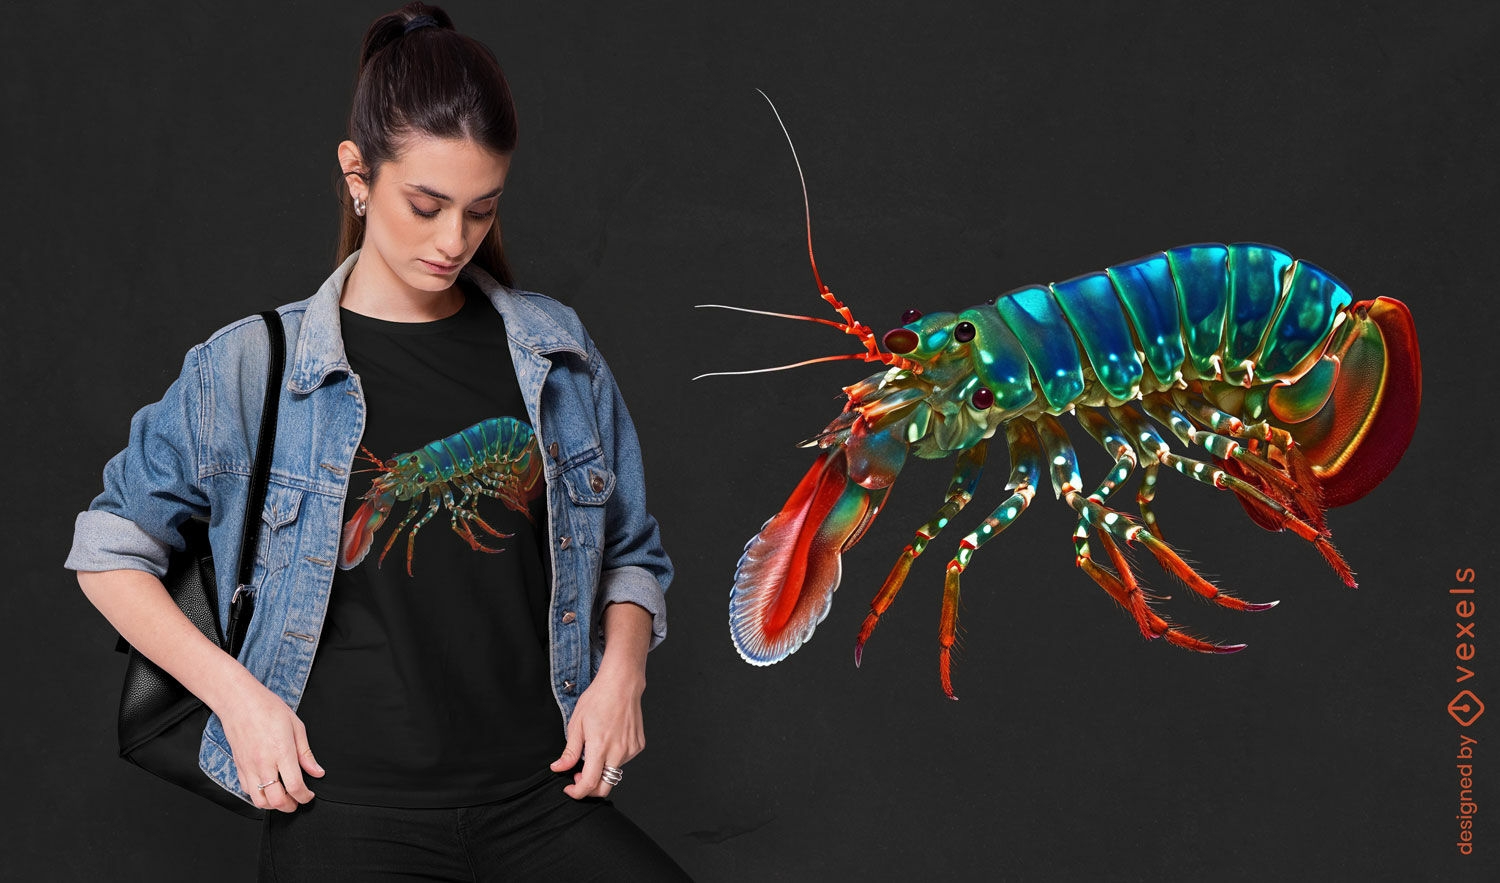
Colorful mantis shrimp t-shirt design
Choose a folder
All favorites
Create new
Save
Colorful mantis shrimp t-shirt design
Print ready
for Merch
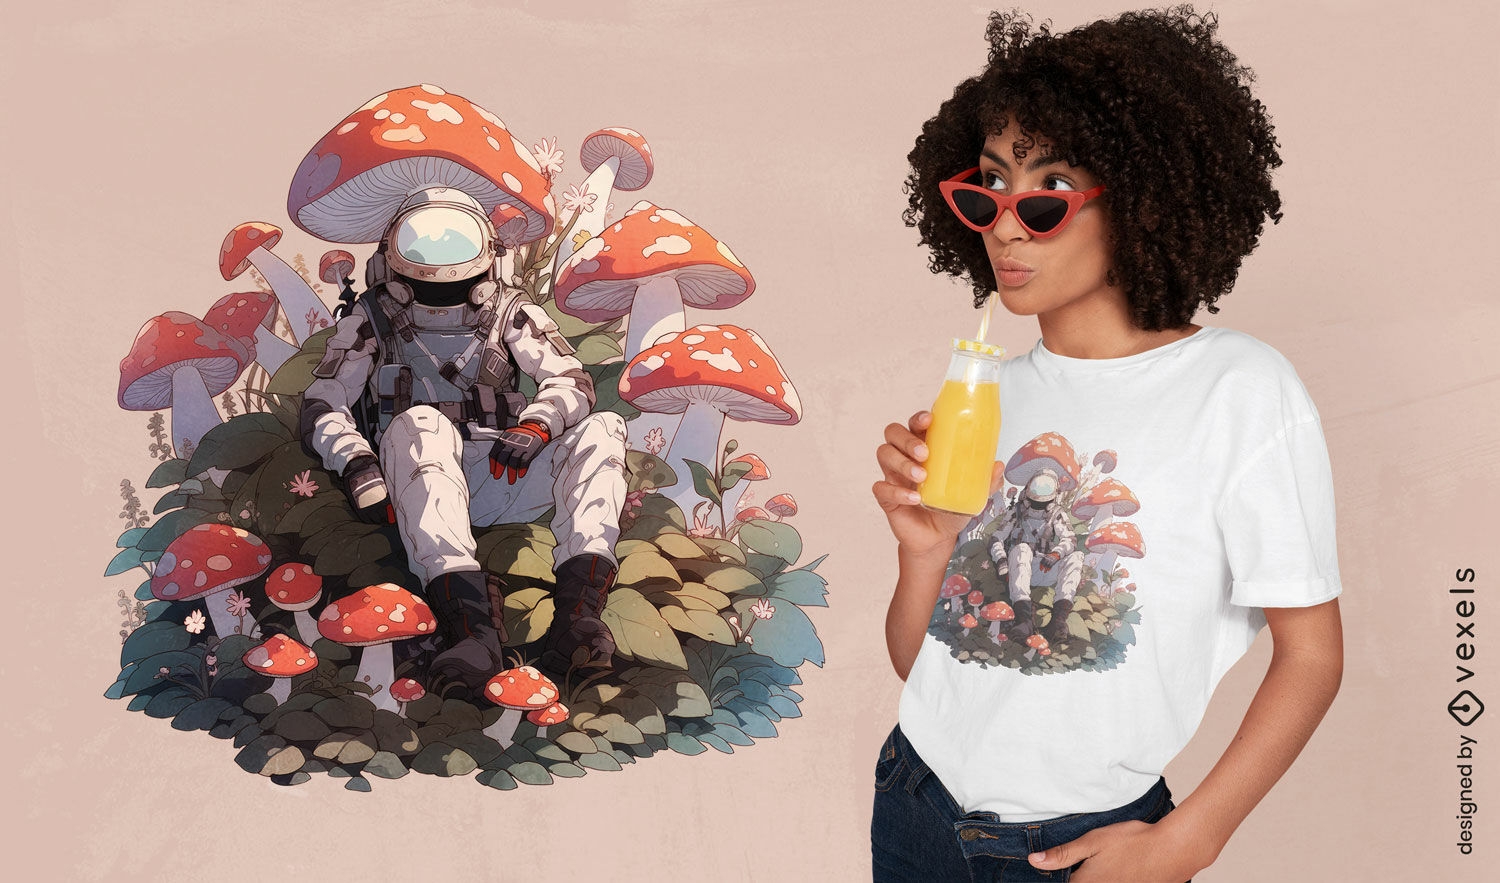
Astronaut on mushroom planet t-shirt design
Choose a folder
All favorites
Create new
Save
Astronaut on mushroom planet t-shirt design
Print ready
for Merch
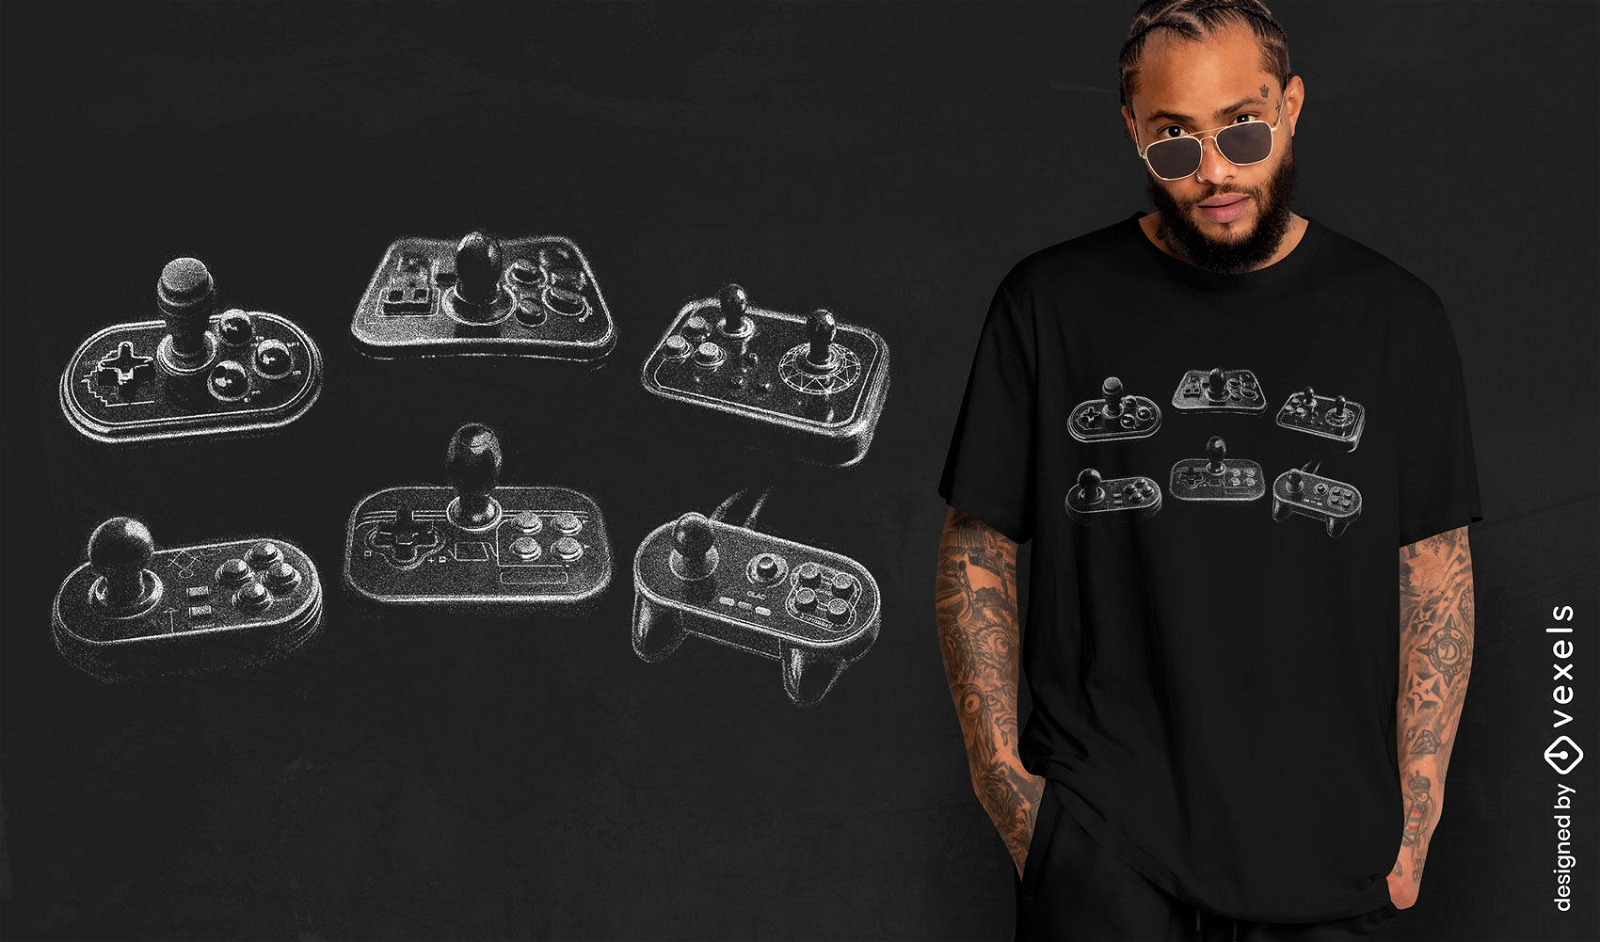
Vintage game controllers t-shirt design
Choose a folder
All favorites
Create new
Save
Vintage game controllers t-shirt design
Print ready
for Merch
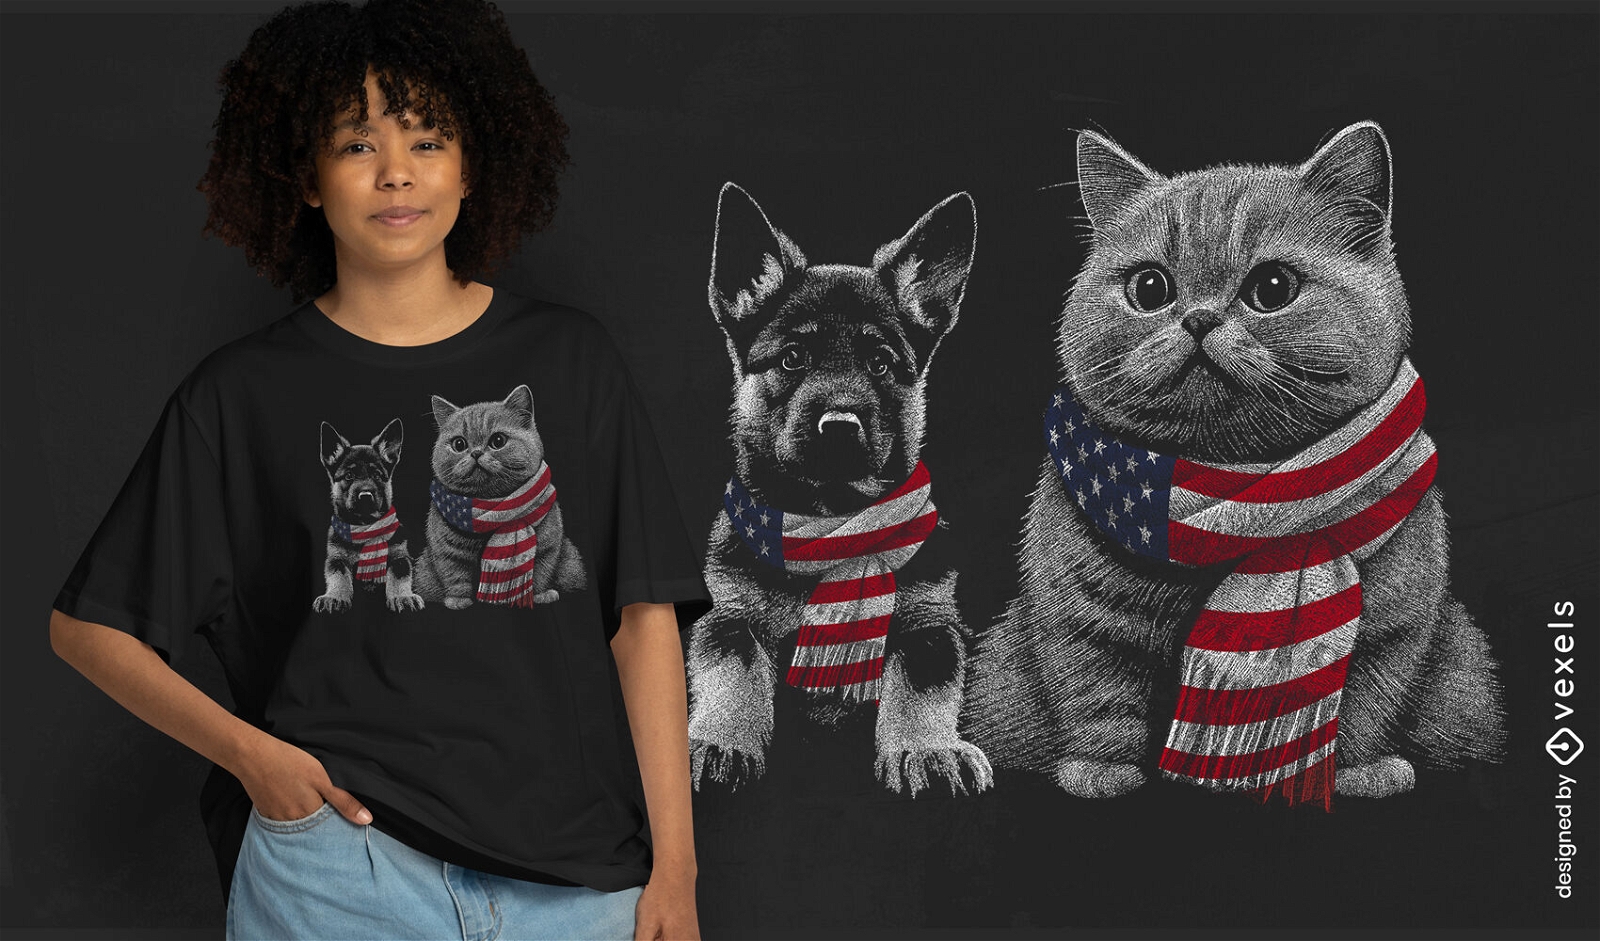
Patriotic animals in USA flag t-shirt design
Choose a folder
All favorites
Create new
Save
Patriotic animals in USA flag t-shirt design
Print ready
for Merch
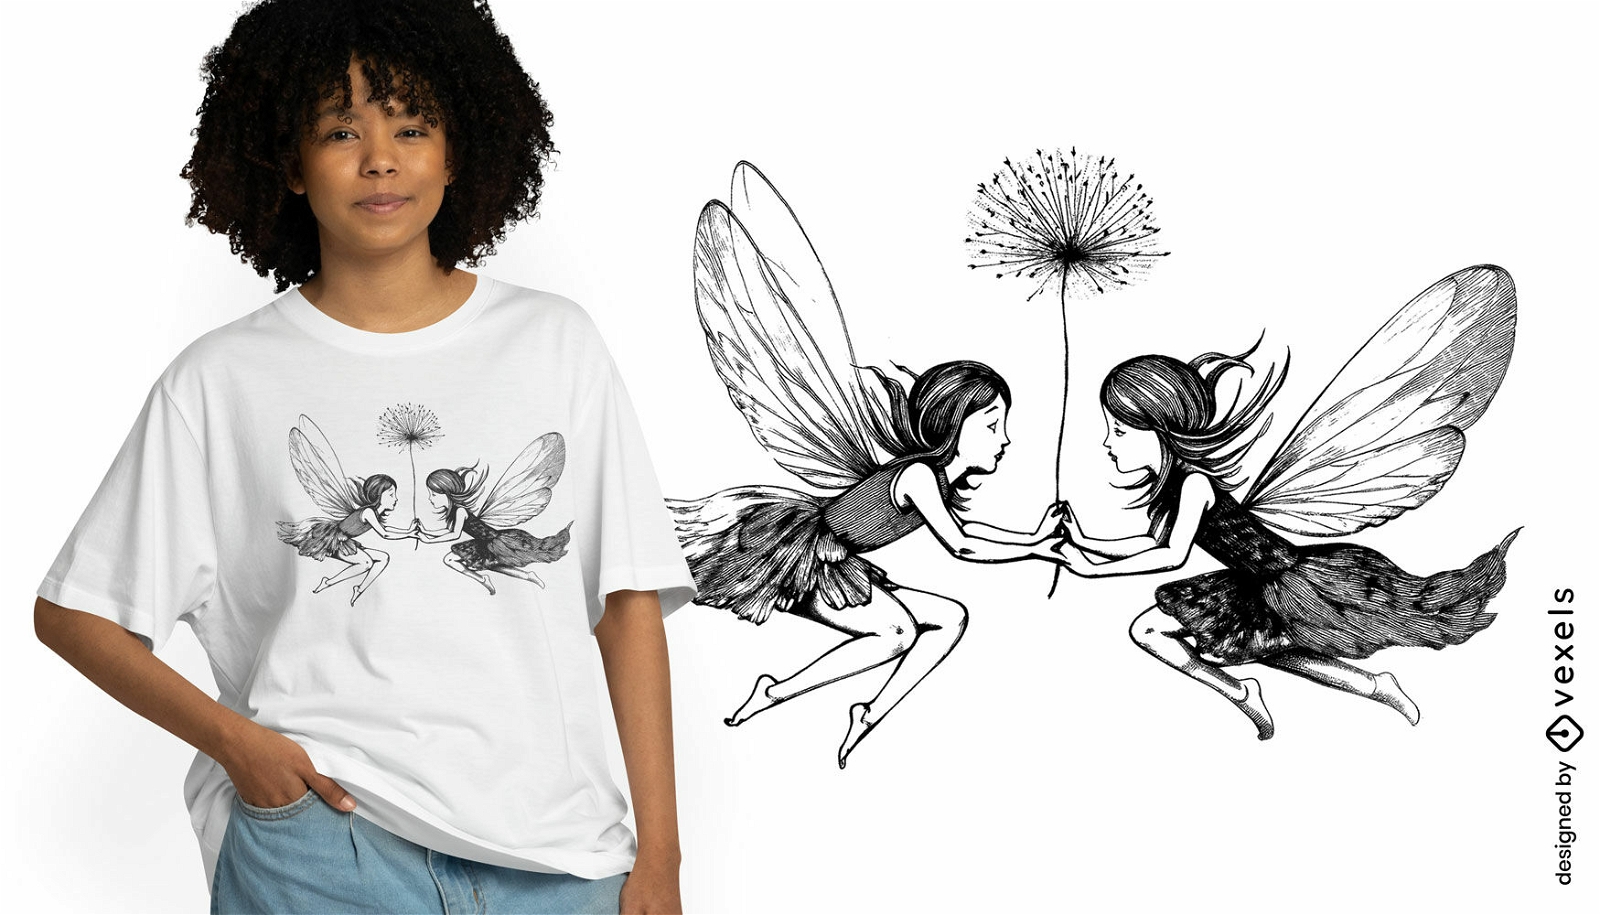
Whimsical fairies t-shirt design
Choose a folder
All favorites
Create new
Save
Whimsical fairies t-shirt design
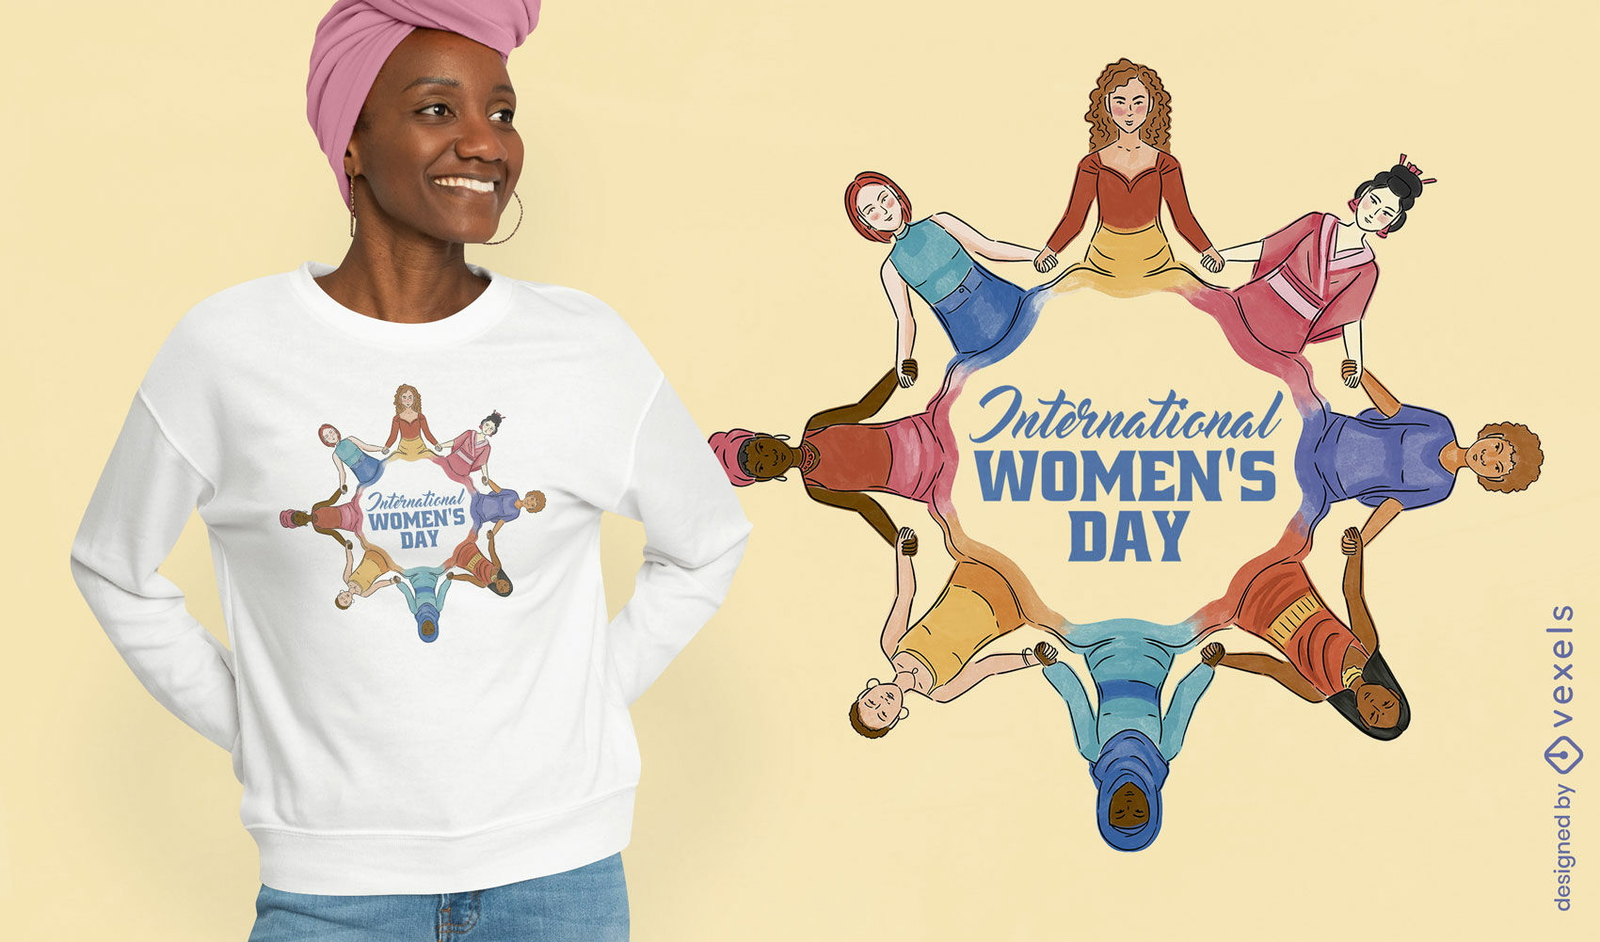
Editable text
Print ready
for Merch
International Women's Day t-shirt design
Choose a folder
All favorites
Create new
Save
International Women's Day t-shirt design
Print ready
for Merch
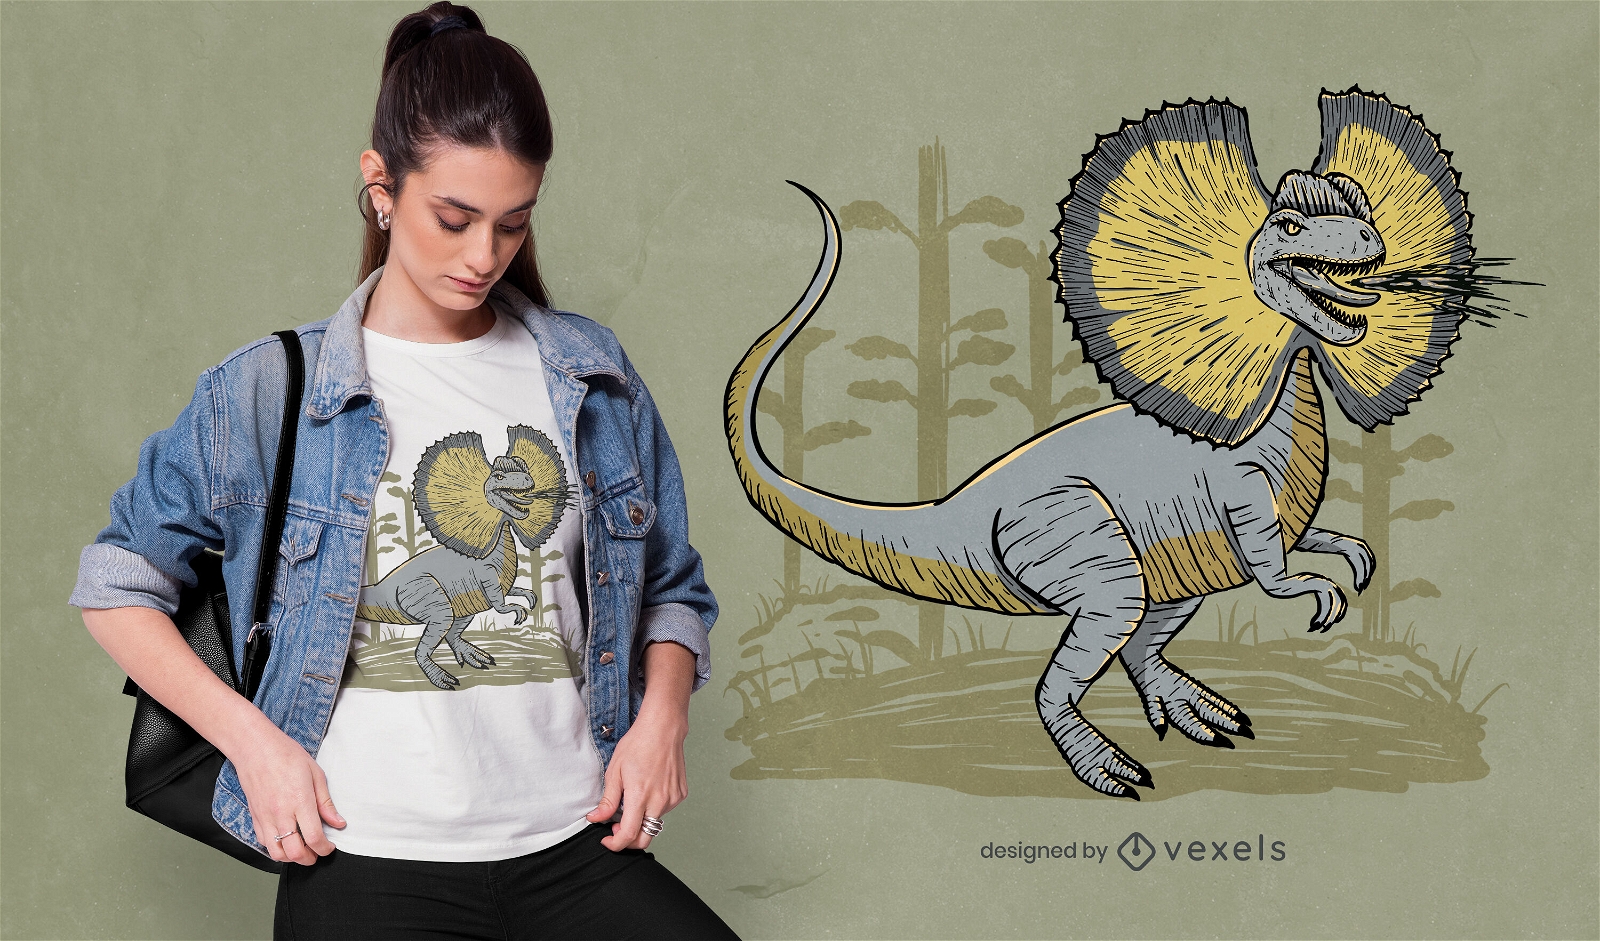
Dilophosaurus dinosaur t-shirt design
Choose a folder
All favorites
Create new
Save
Dilophosaurus dinosaur t-shirt design
Print ready
for Merch
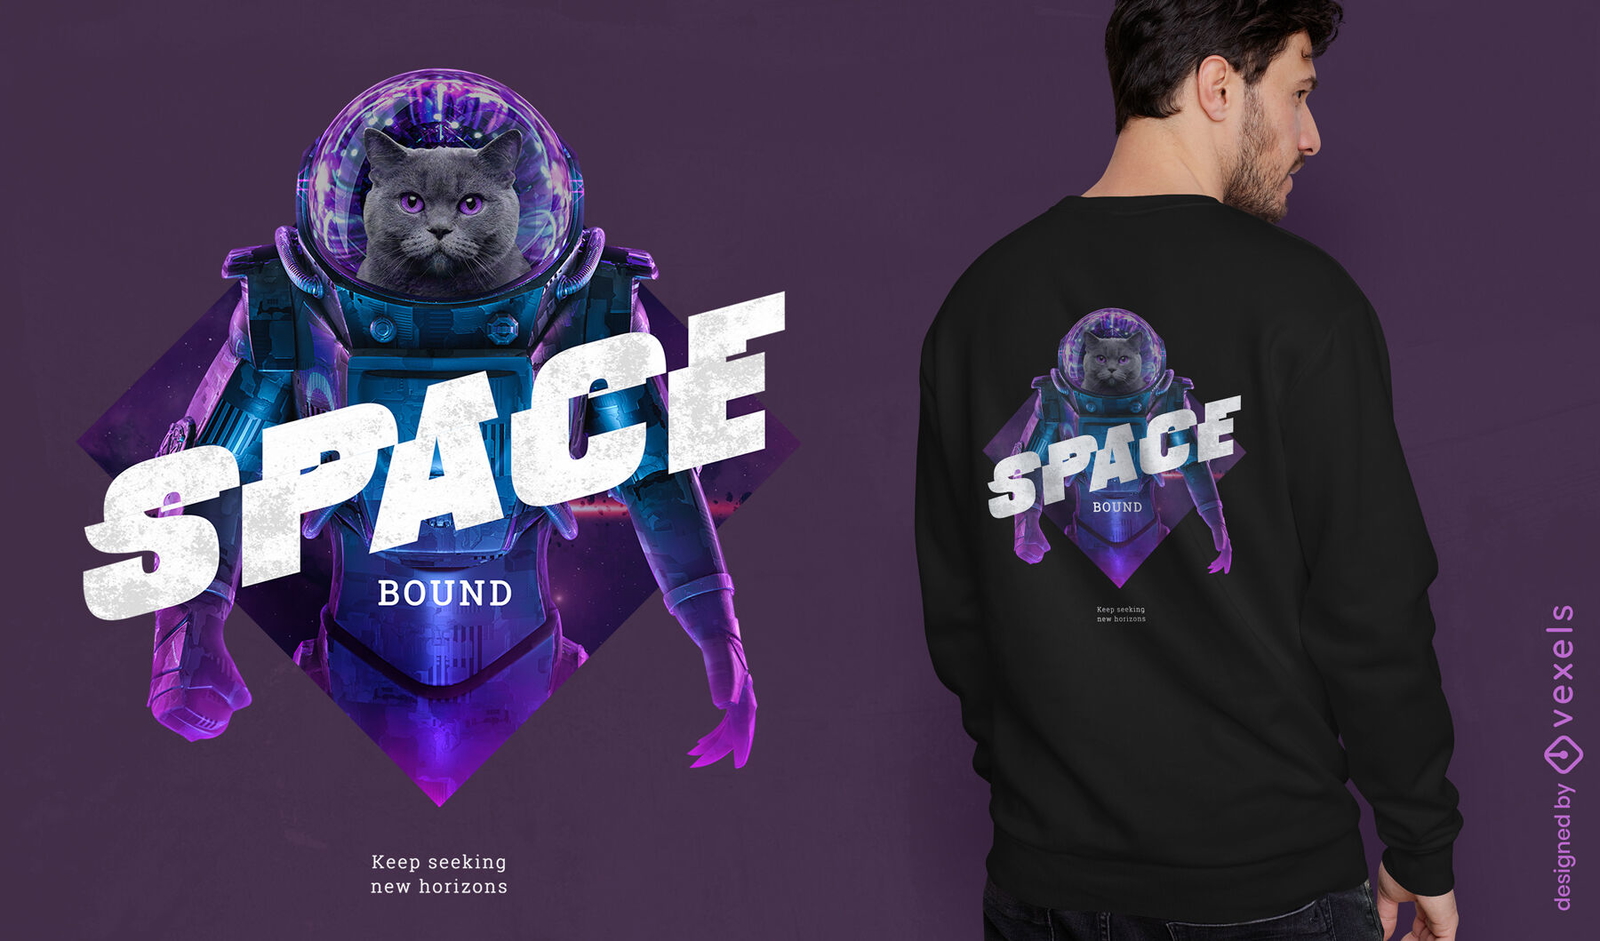
Astronaut cat animal PSD t-shirt design
Choose a folder
All favorites
Create new
Save
Astronaut cat animal PSD t-shirt design
Print ready
for Merch
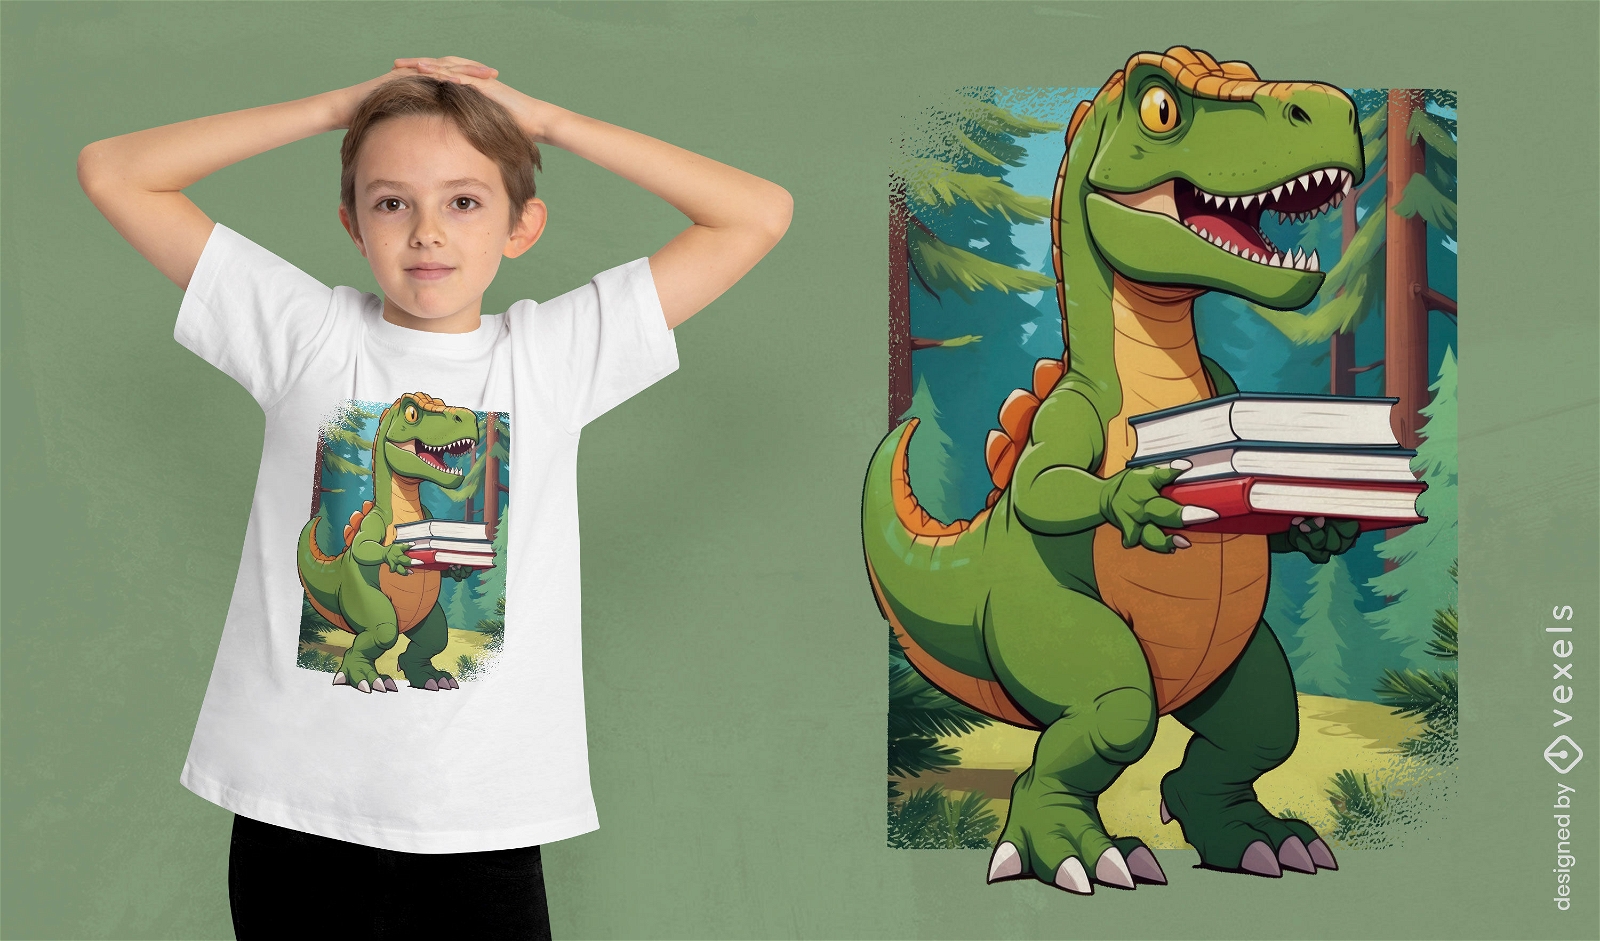
Reading dinosaur t-shirt design
Choose a folder
All favorites
Create new
Save
Reading dinosaur t-shirt design
Editable text
Print ready
for Merch
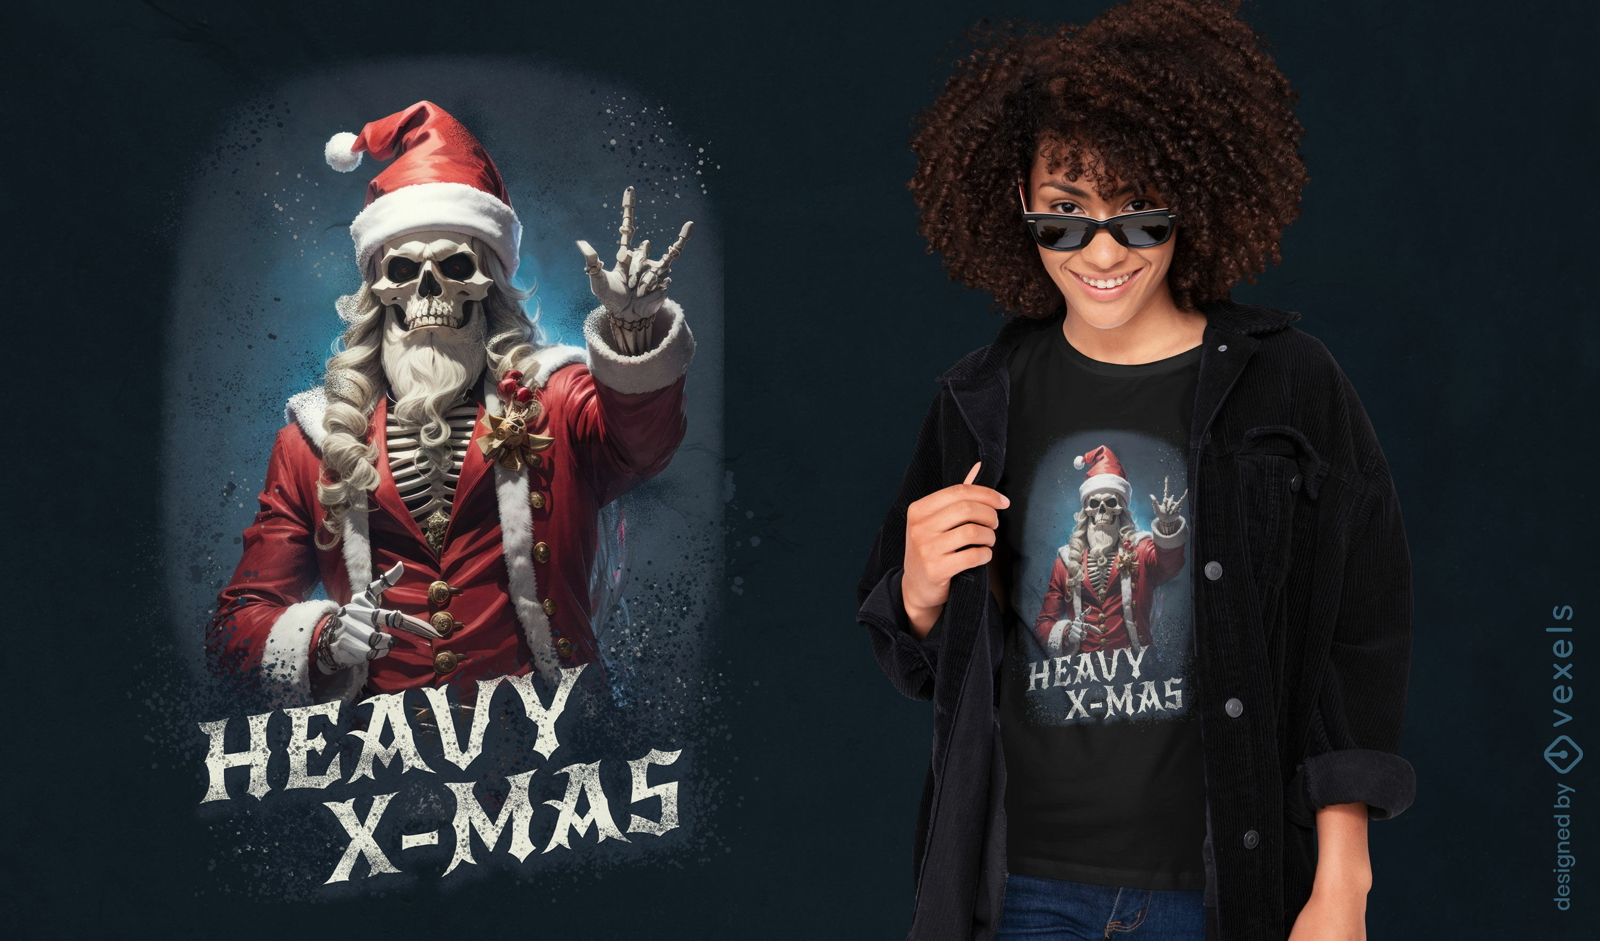
Rock and roll santa t-shirt design
Choose a folder
All favorites
Create new
Save
Rock and roll santa t-shirt design
Print ready
for Merch
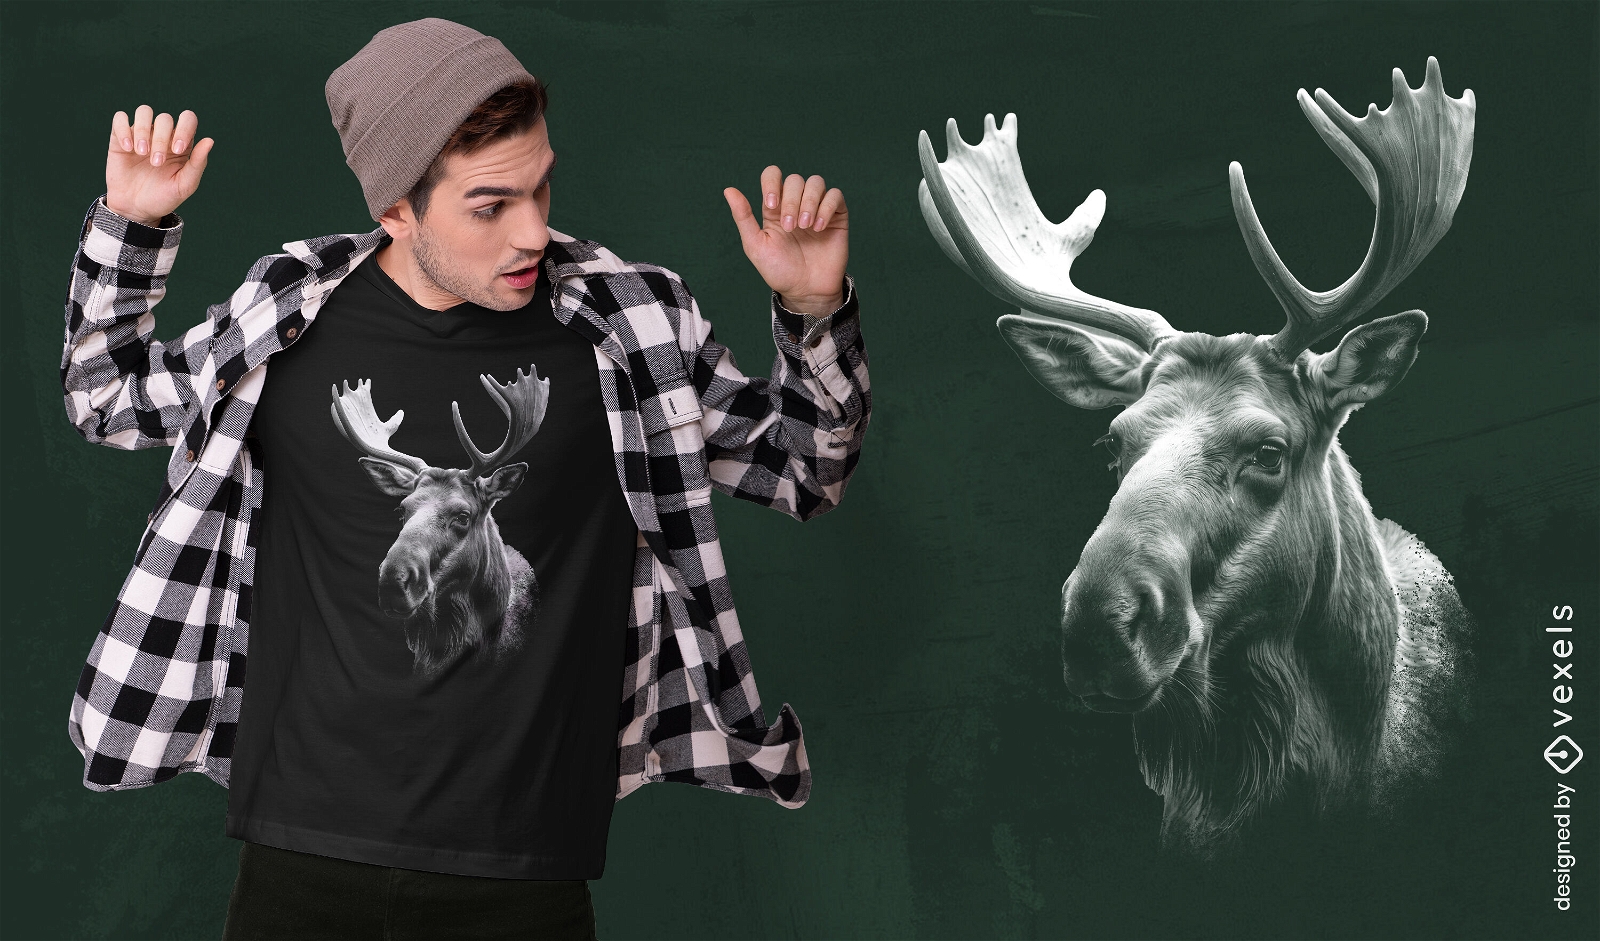
Majestic moose t-shirt design
Choose a folder
All favorites
Create new
Save
Majestic moose t-shirt design
Print ready
for Merch
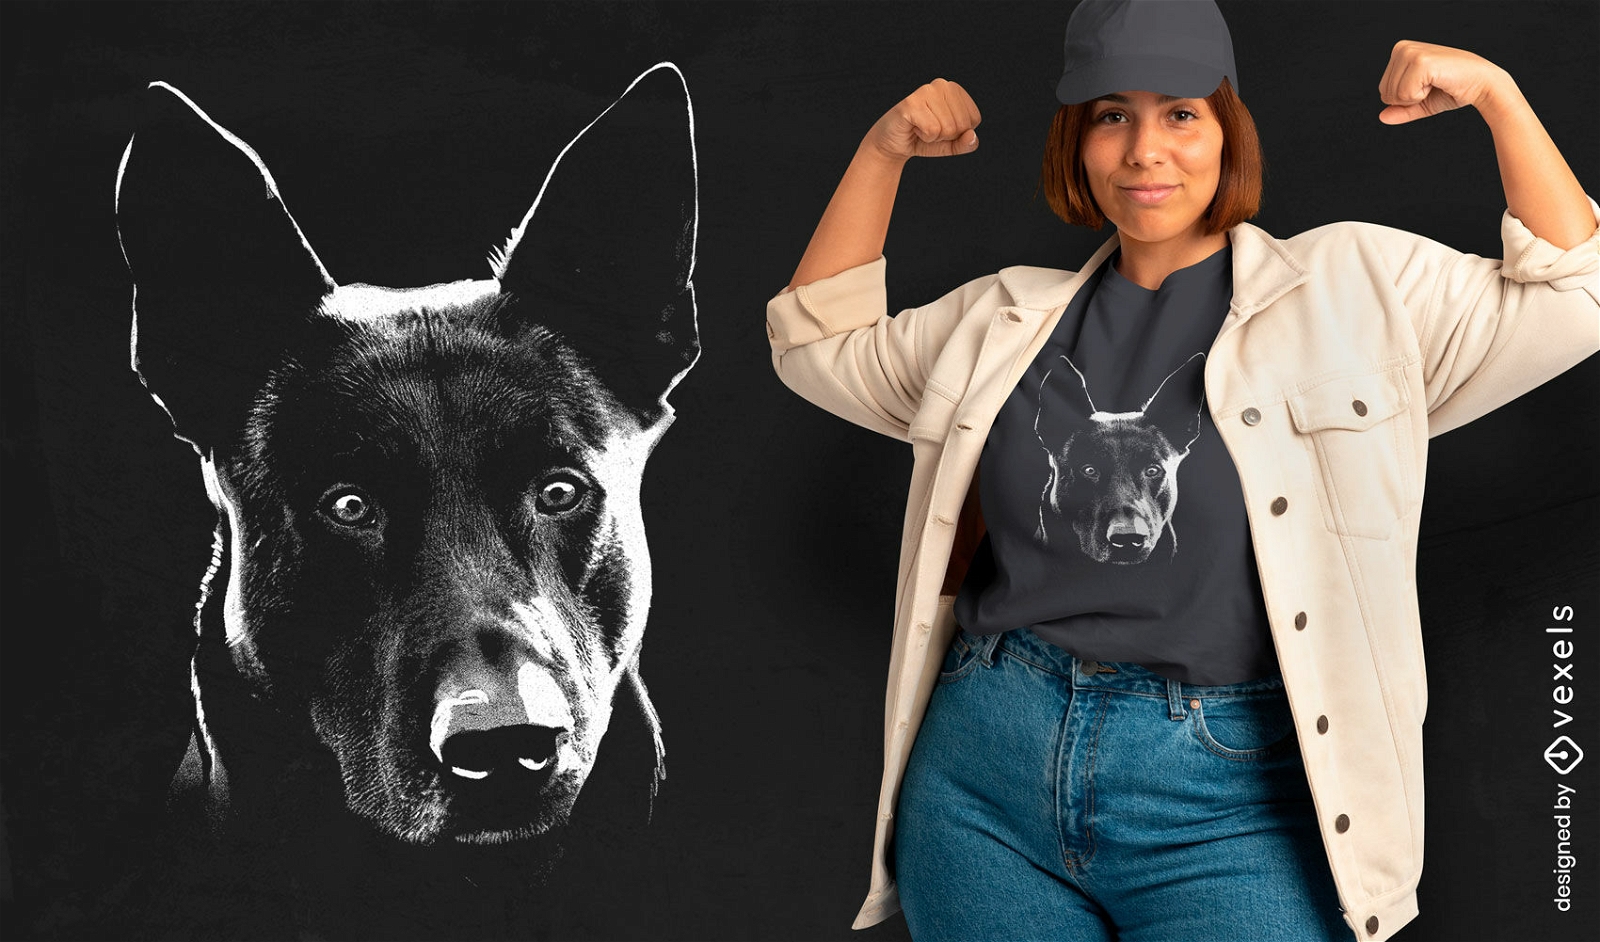
Dog portrait monochrome t-shirt design
Choose a folder
All favorites
Create new
Save
Dog portrait monochrome t-shirt design
Print ready
for Merch
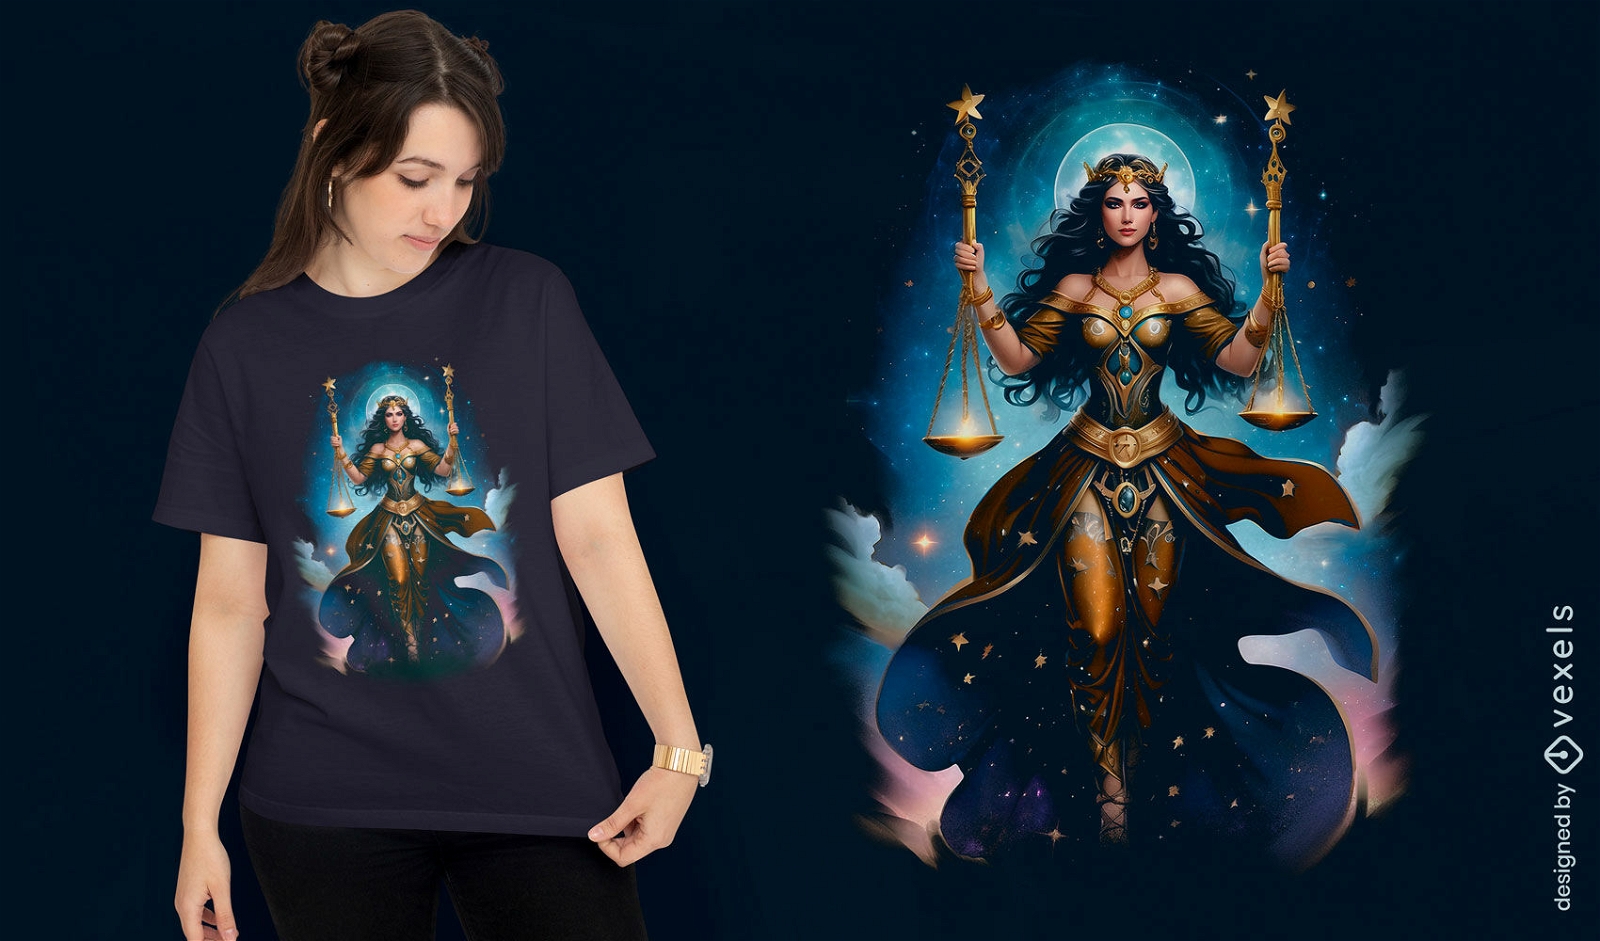
Libra zodiac sign illustration t-shirt design
Choose a folder
All favorites
Create new
Save
Libra zodiac sign illustration t-shirt design
Print ready
for Merch
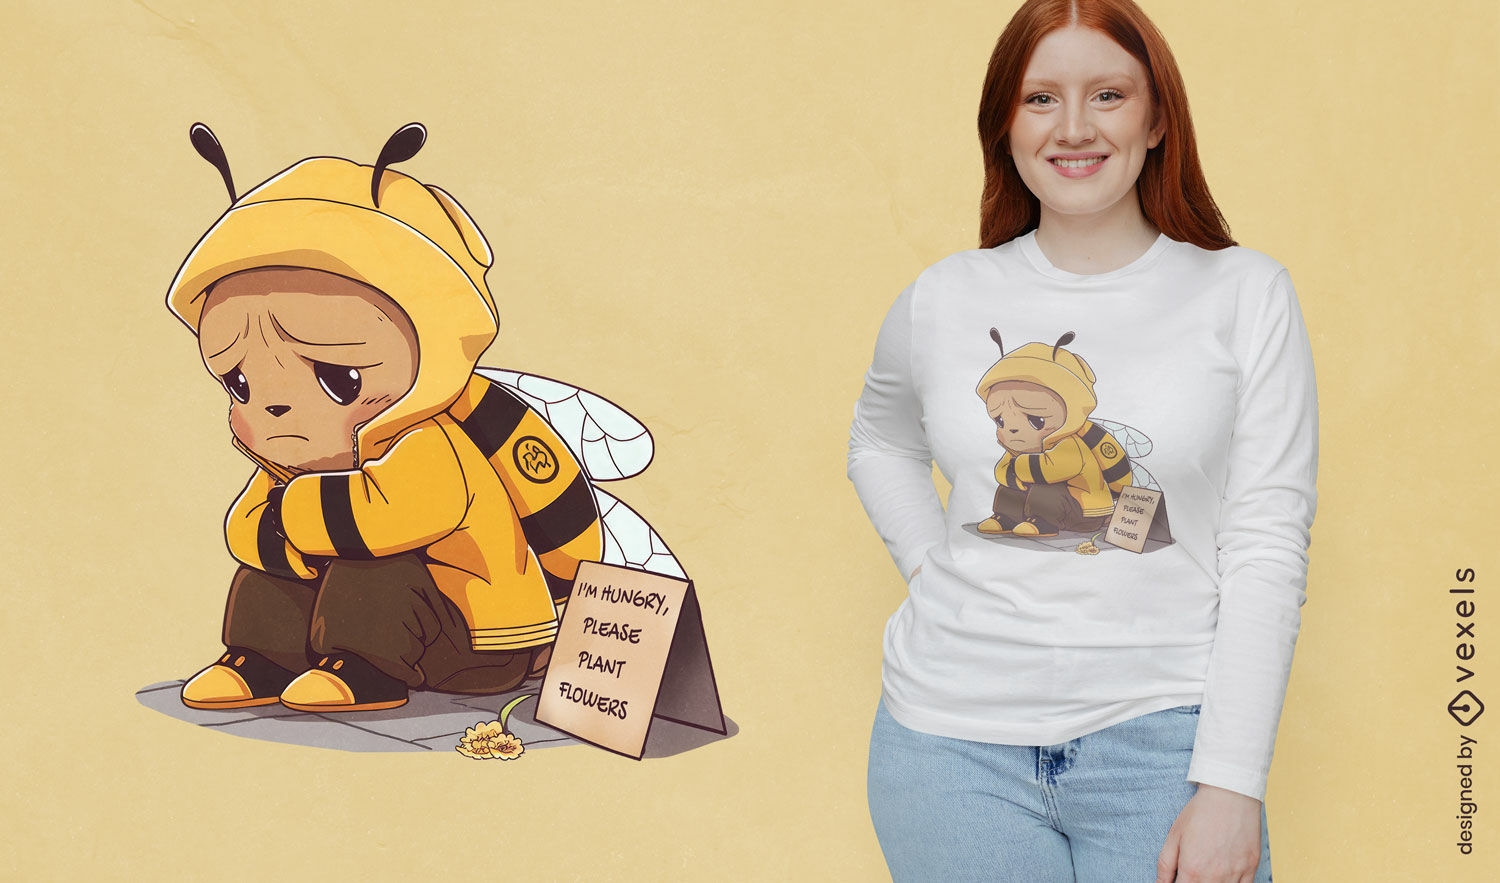
Beggar bee t-shirt design
Choose a folder
All favorites
Create new
Save
Beggar bee t-shirt design
Print ready
for Merch
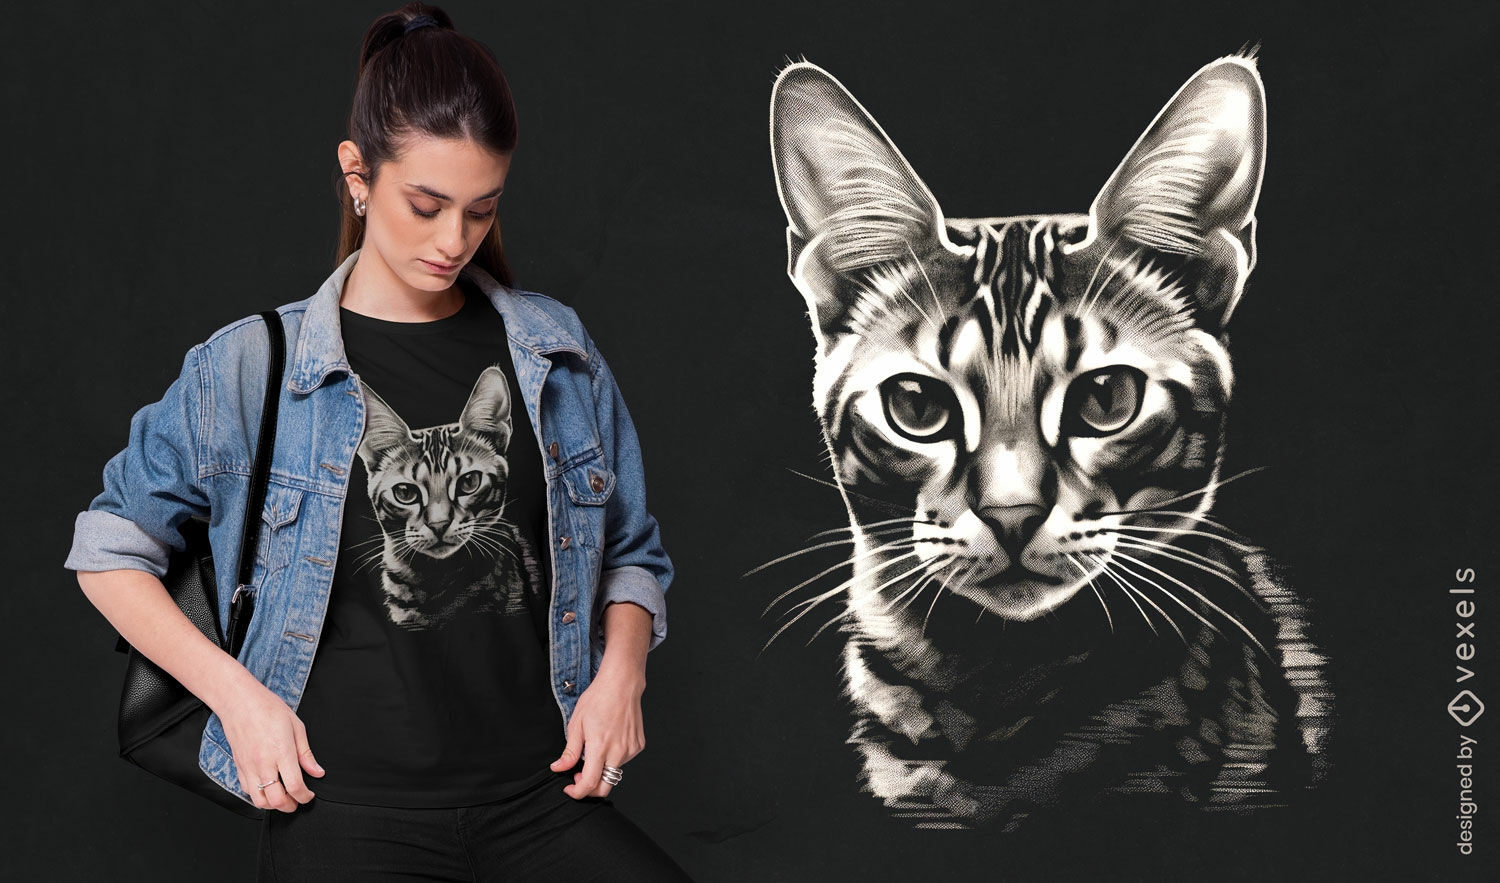
Detailed cat face t-shirt design
Choose a folder
All favorites
Create new
Save
Detailed cat face t-shirt design
Print ready
for Merch
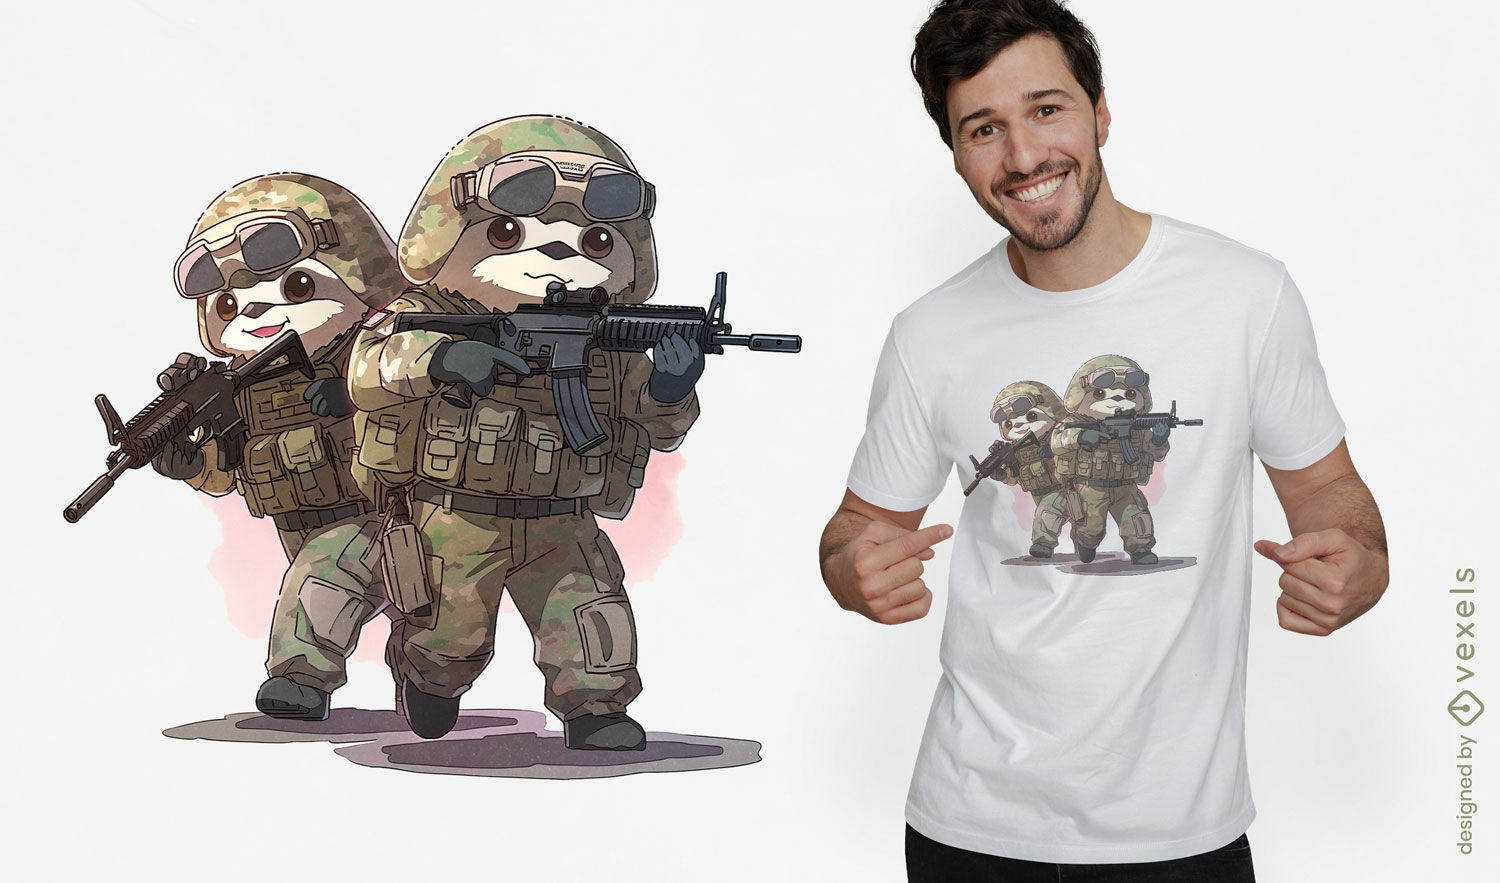
Military sloths t-shirt design
Choose a folder
All favorites
Create new
Save
Military sloths t-shirt design
Print ready
for Merch
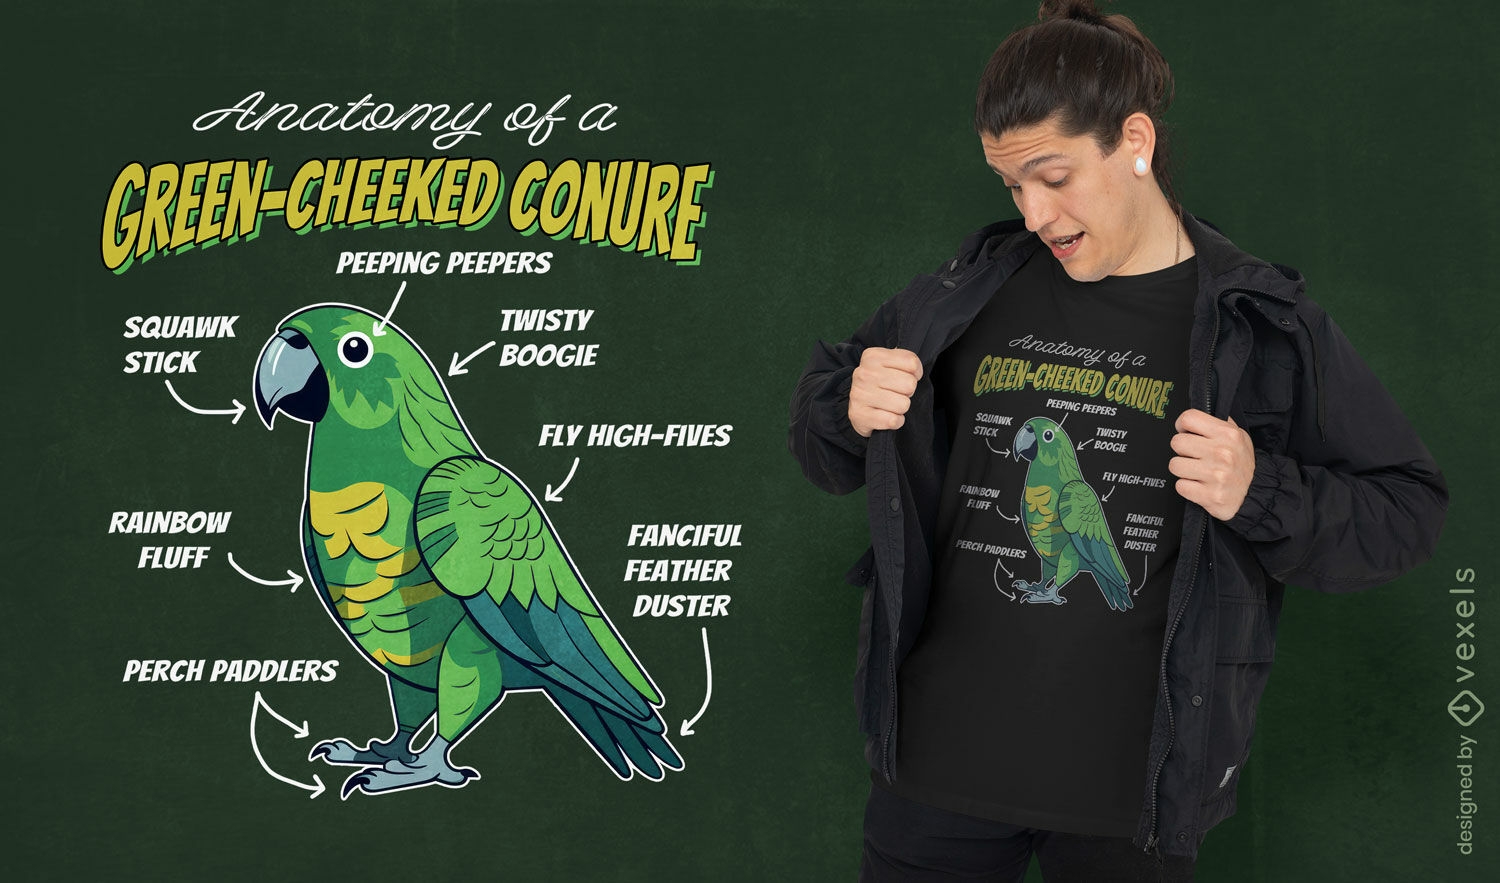
Green-cheeked conure anatomy t-shirt design
Choose a folder
All favorites
Create new
Save
Green-cheeked conure anatomy t-shirt design
Print ready
for Merch
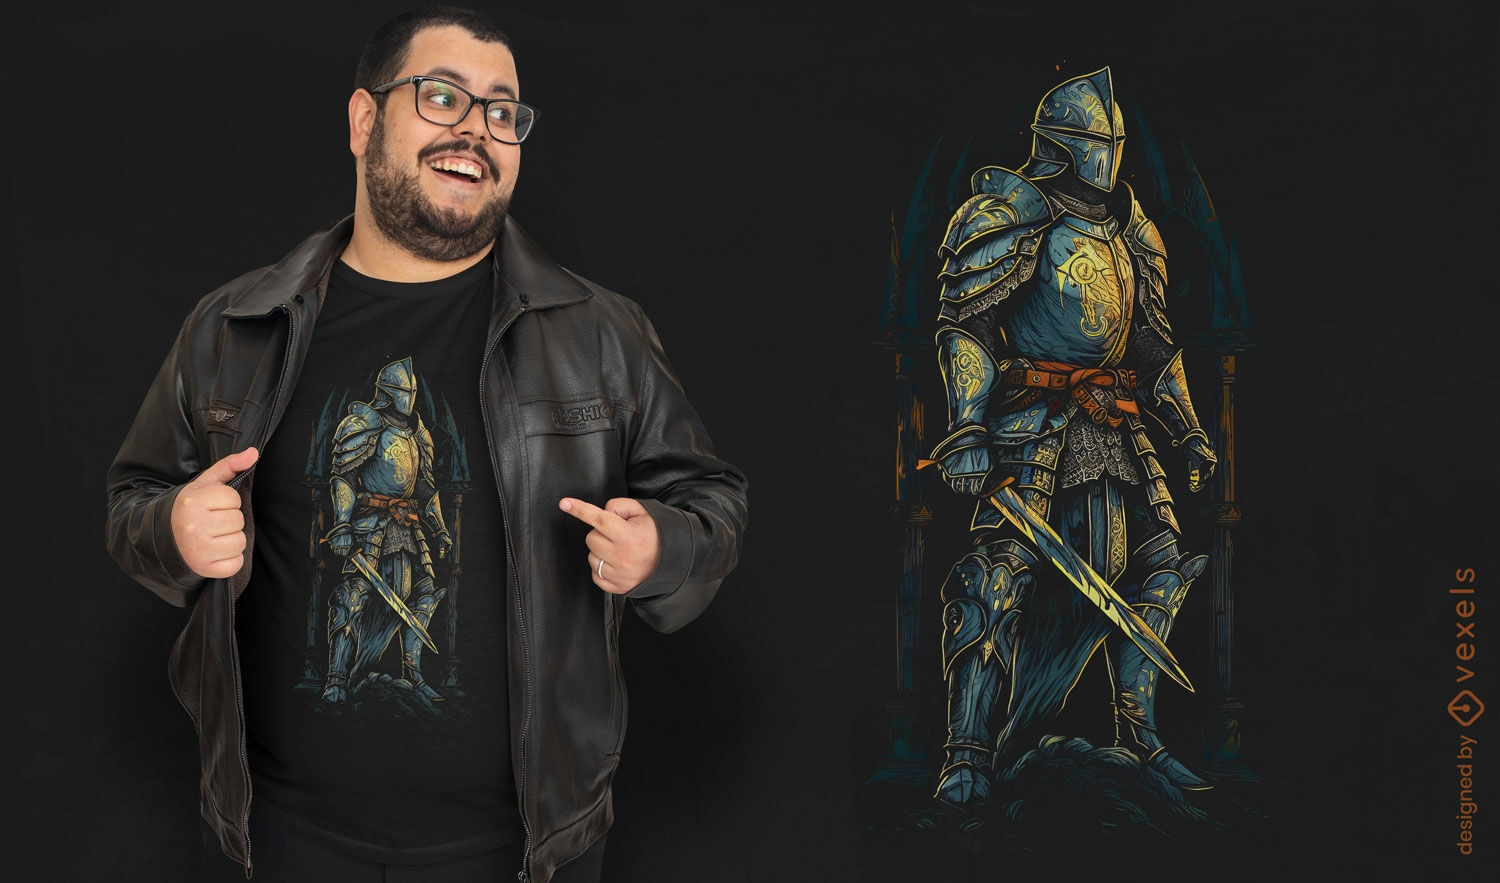
Medieval knight armor t-shirt design
Choose a folder
All favorites
Create new
Save
Medieval knight armor t-shirt design
Print ready
for Merch
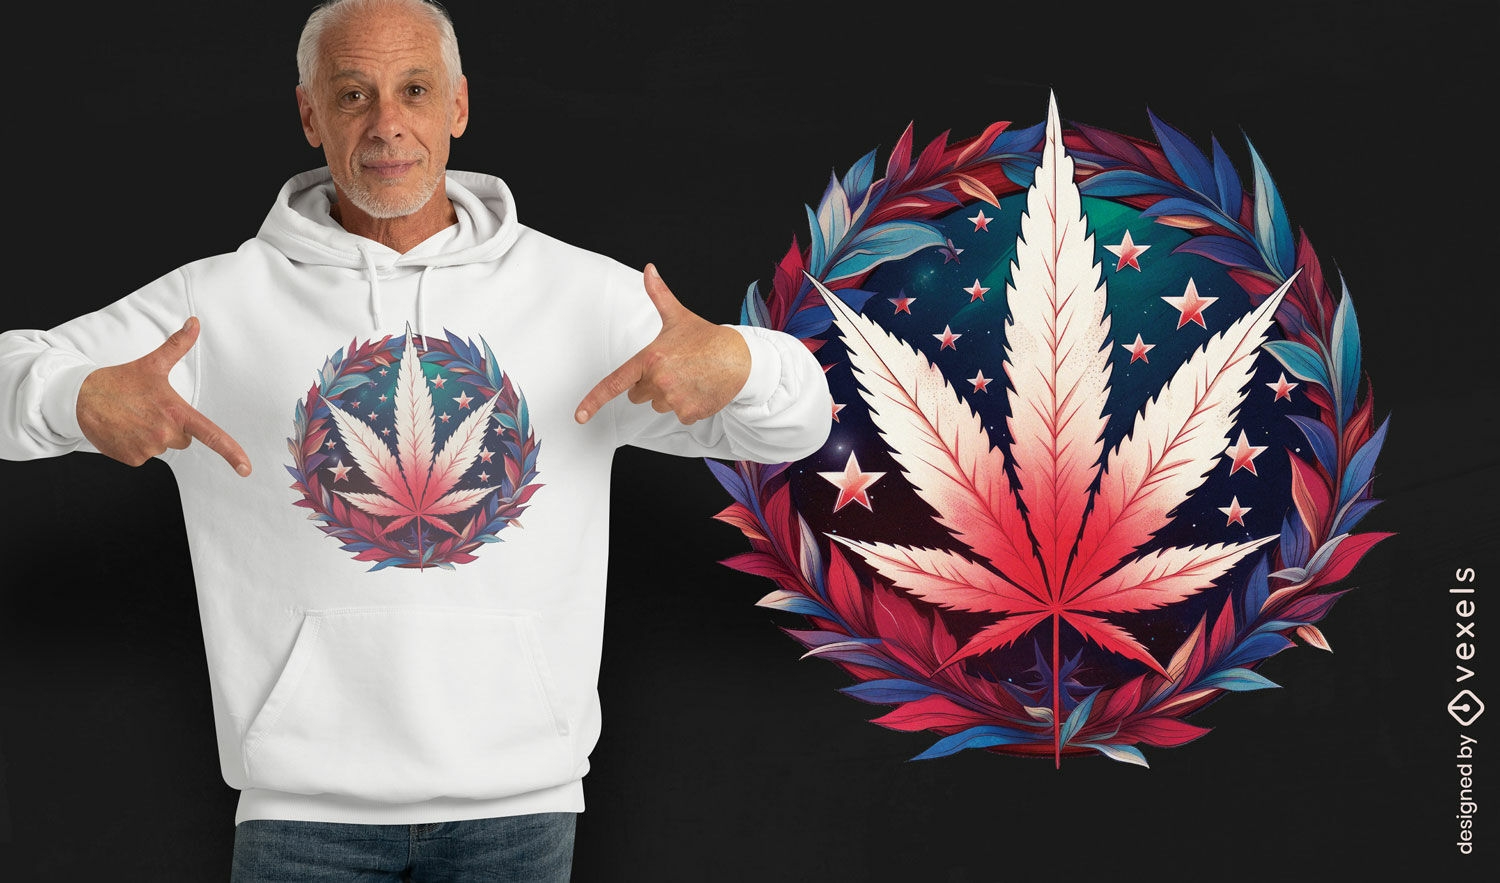
Patriotic cannabis leaf t-shirt design
Choose a folder
All favorites
Create new
Save
Patriotic cannabis leaf t-shirt design
Print ready
for Merch
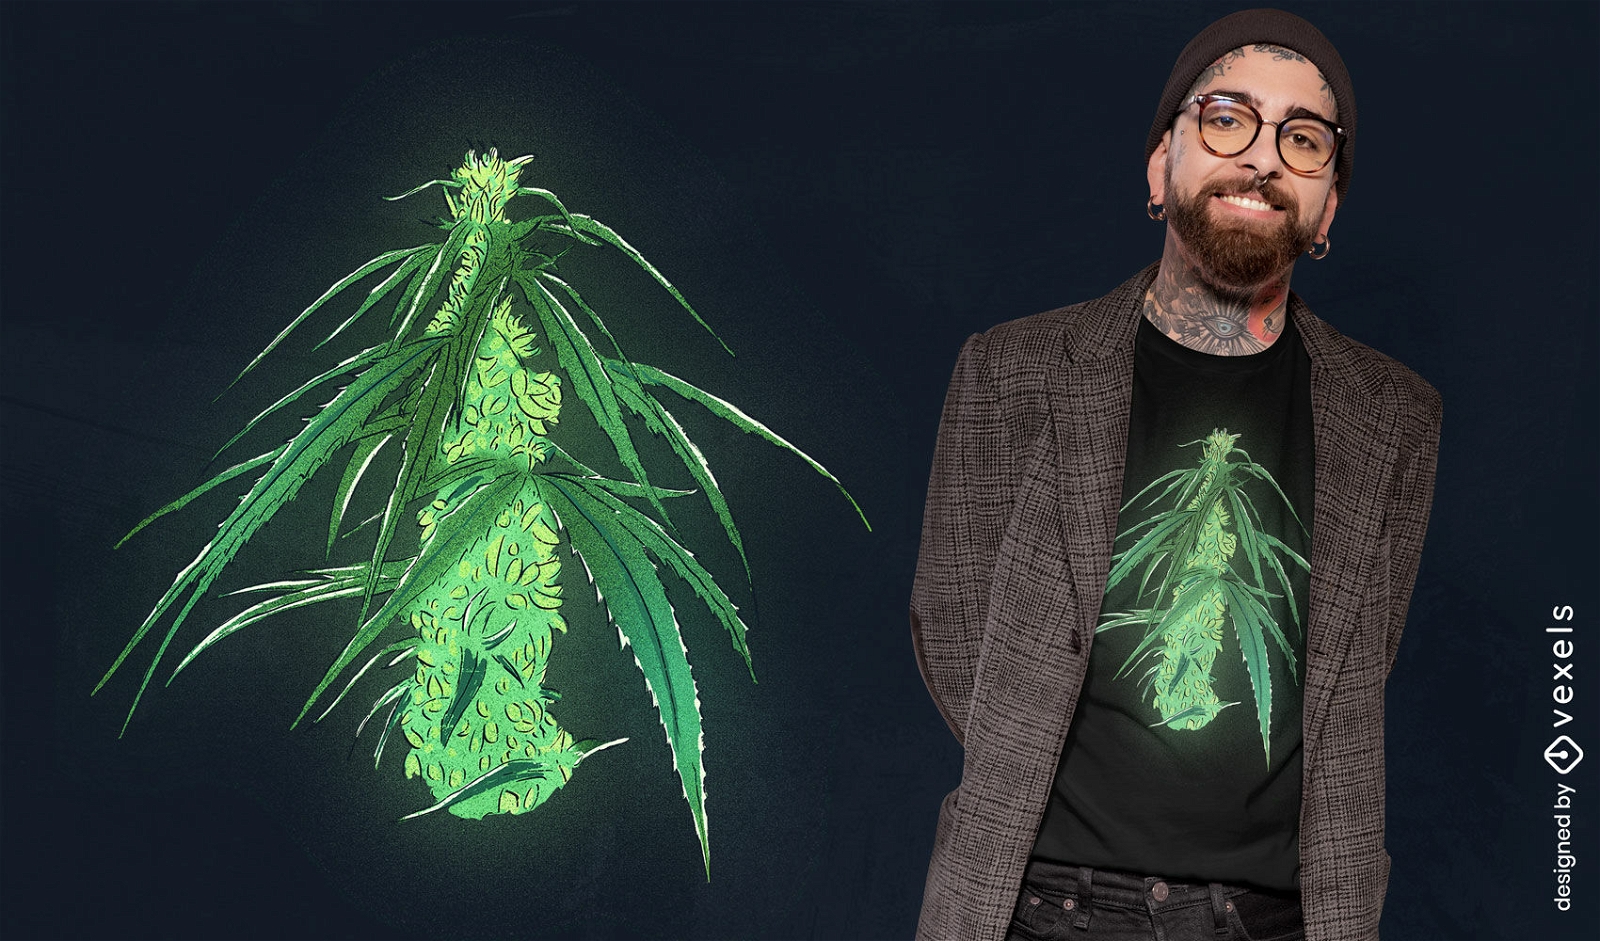
Radioactive cannabis plant t-shirt design
Choose a folder
All favorites
Create new
Save
Radioactive cannabis plant t-shirt design
Editable text
for Merch
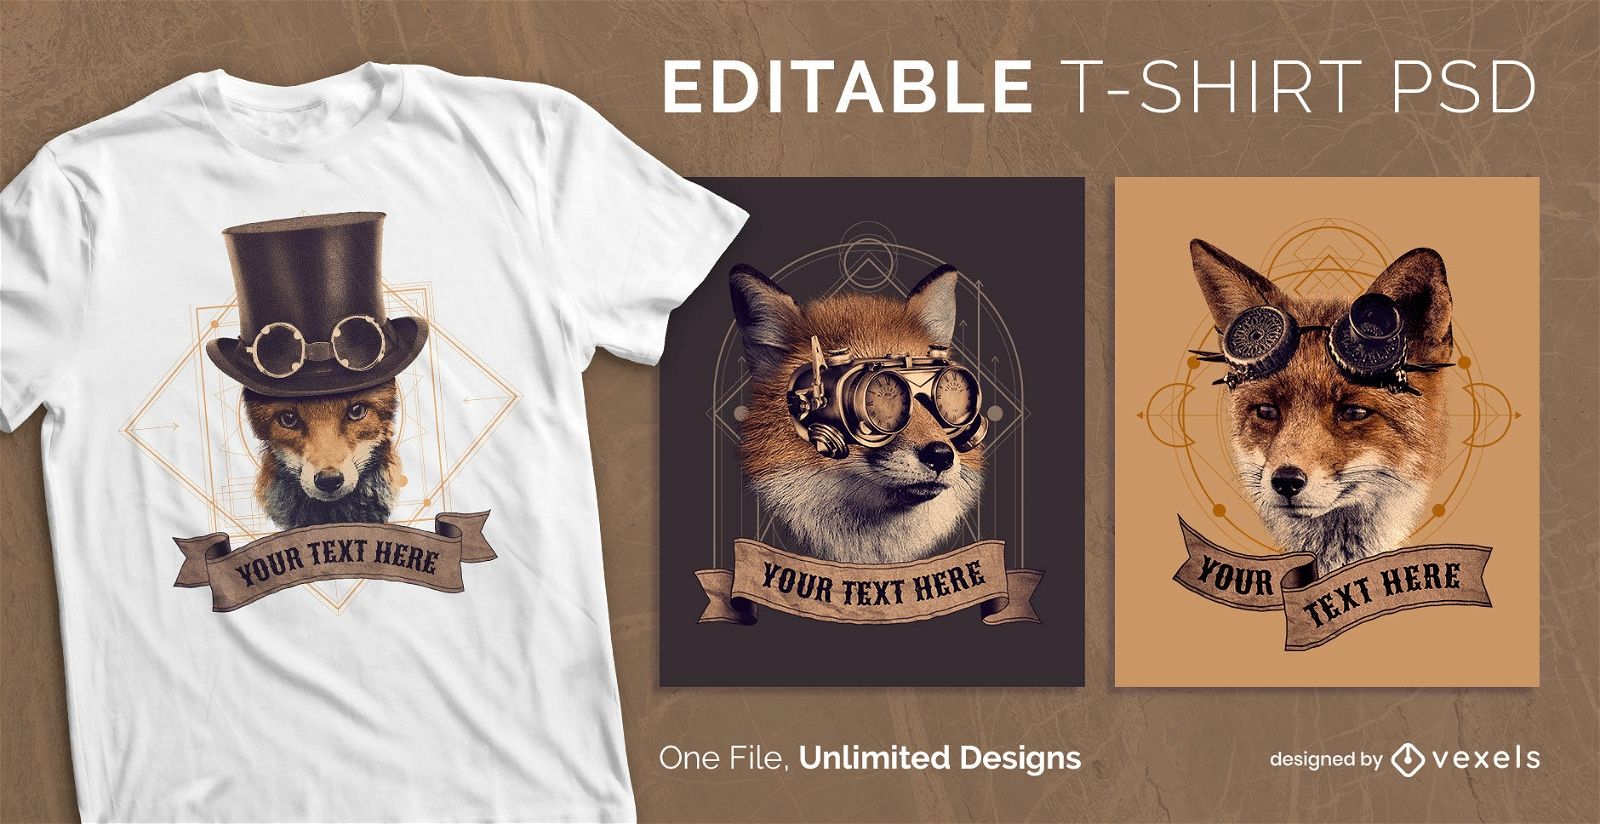
Steampunk fox animal scalable t-shirt psd
Choose a folder
All favorites
Create new
Save
Steampunk fox animal scalable t-shirt psd
Editable text
for Merch
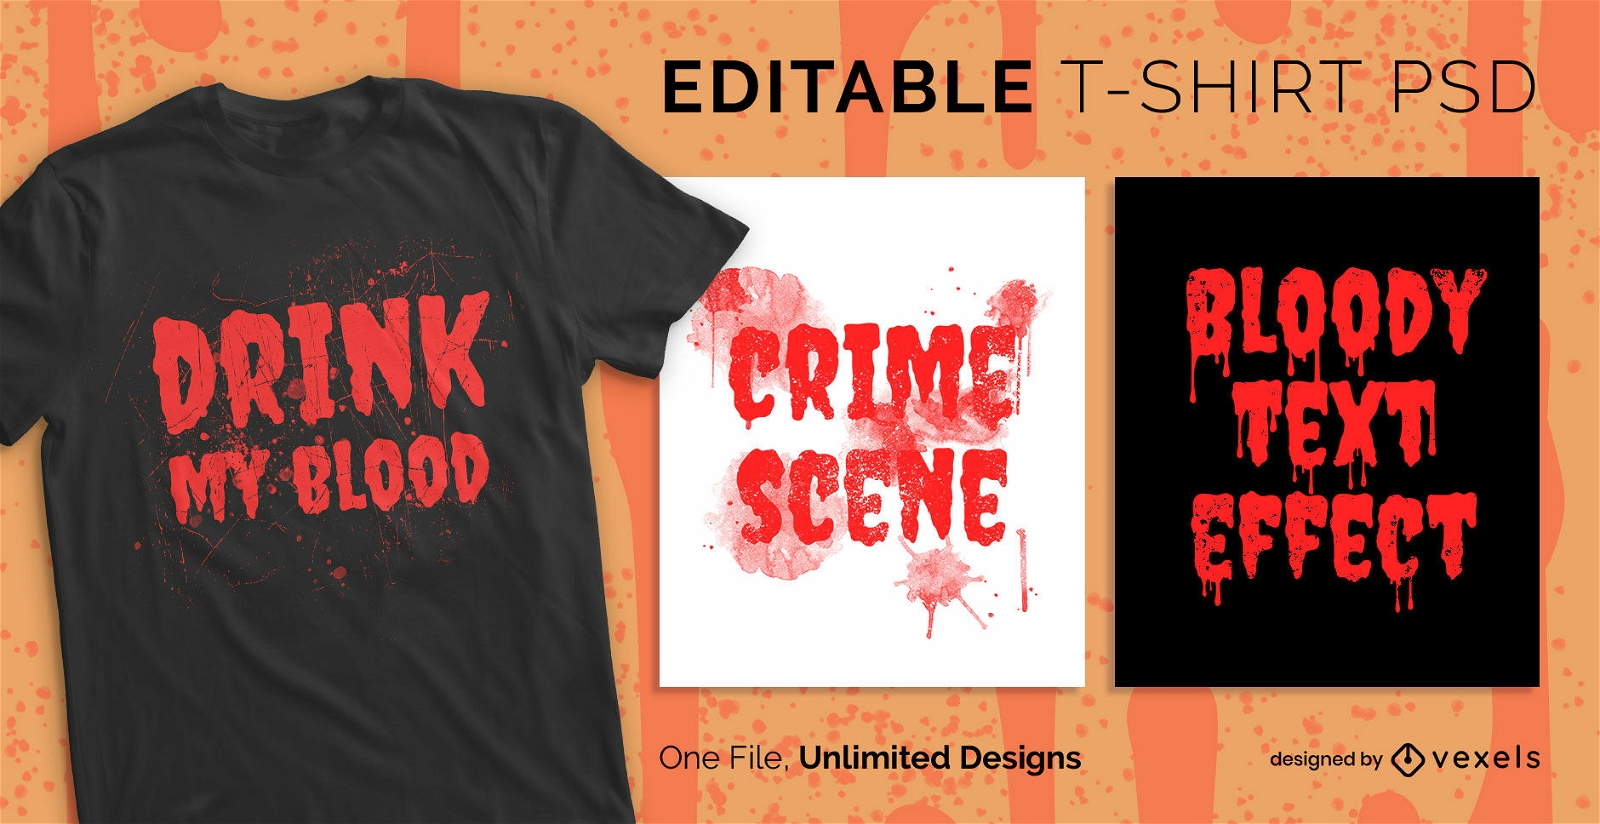
Bloody text scalable t-shirt psd
Choose a folder
All favorites
Create new
Save
Bloody text scalable t-shirt psd
Editable text
Print ready
for Merch
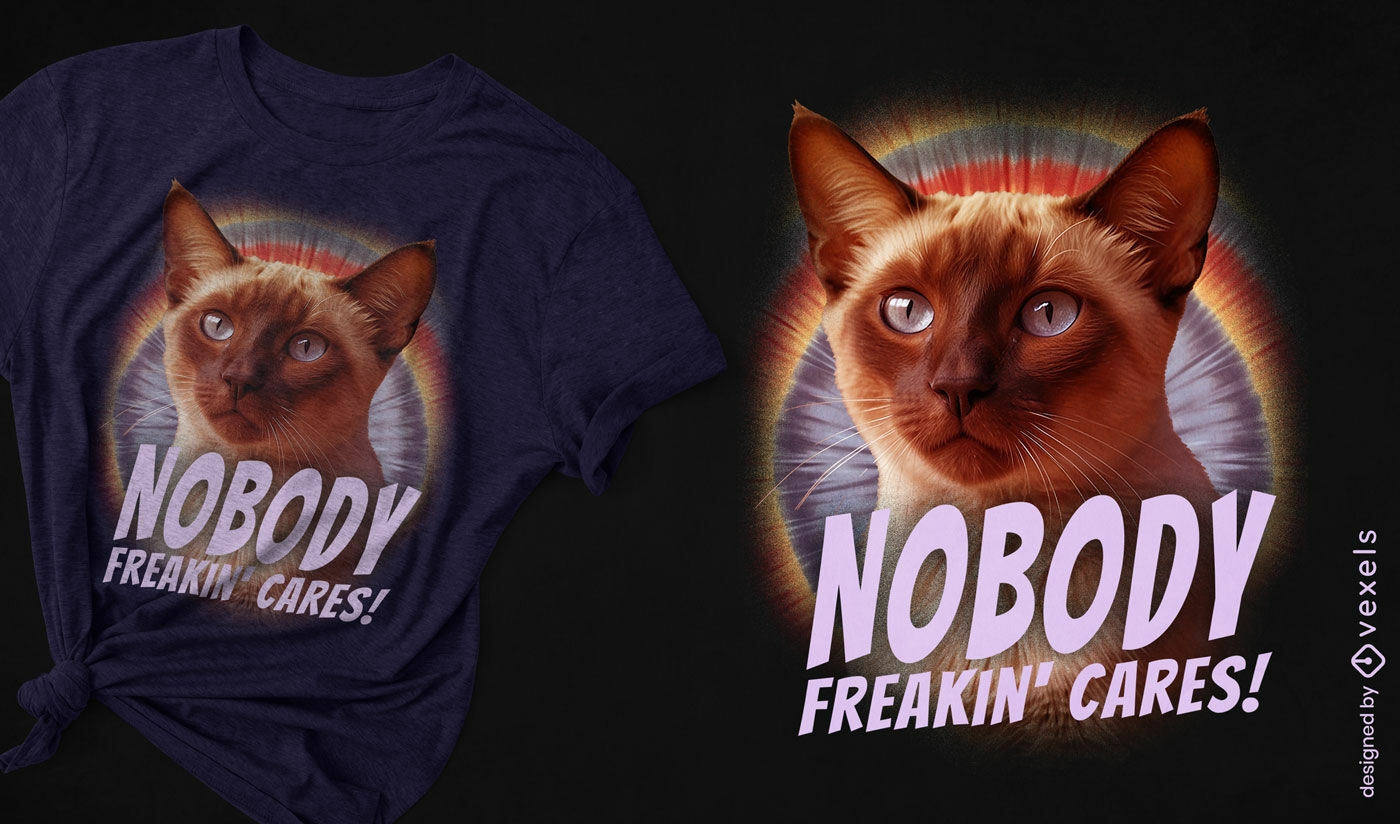
Angry cat quote t-shirt design
Choose a folder
All favorites
Create new
Save
Angry cat quote t-shirt design
Print ready
for Merch
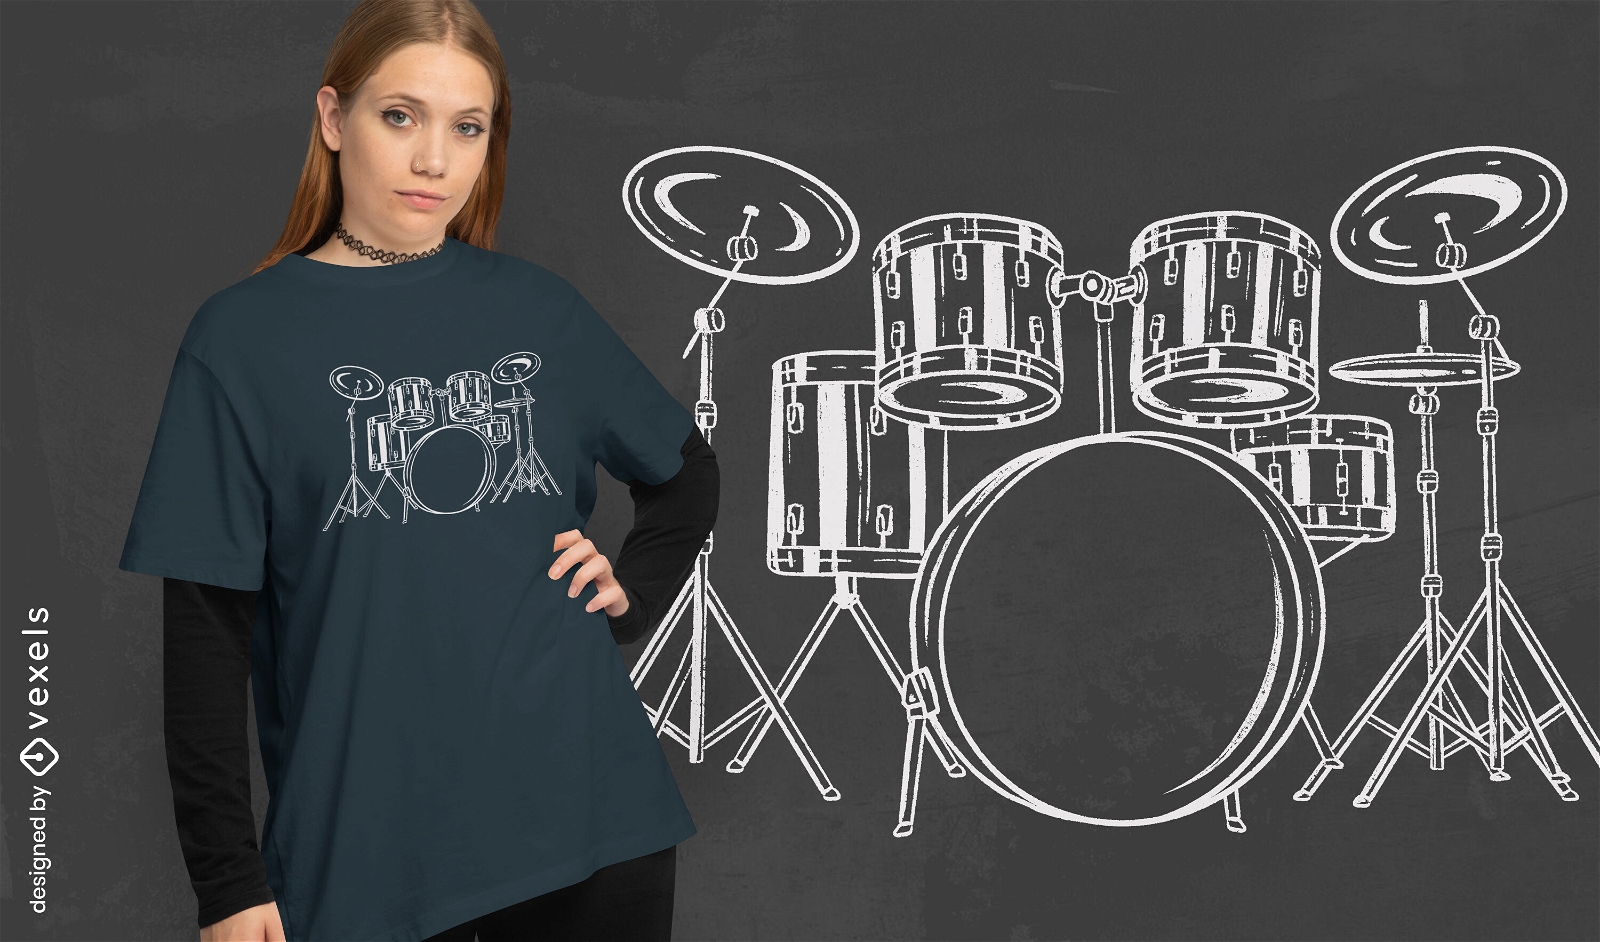
Music drum set t-shirt design
Choose a folder
All favorites
Create new
Save
Music drum set t-shirt design
Print ready
for Merch
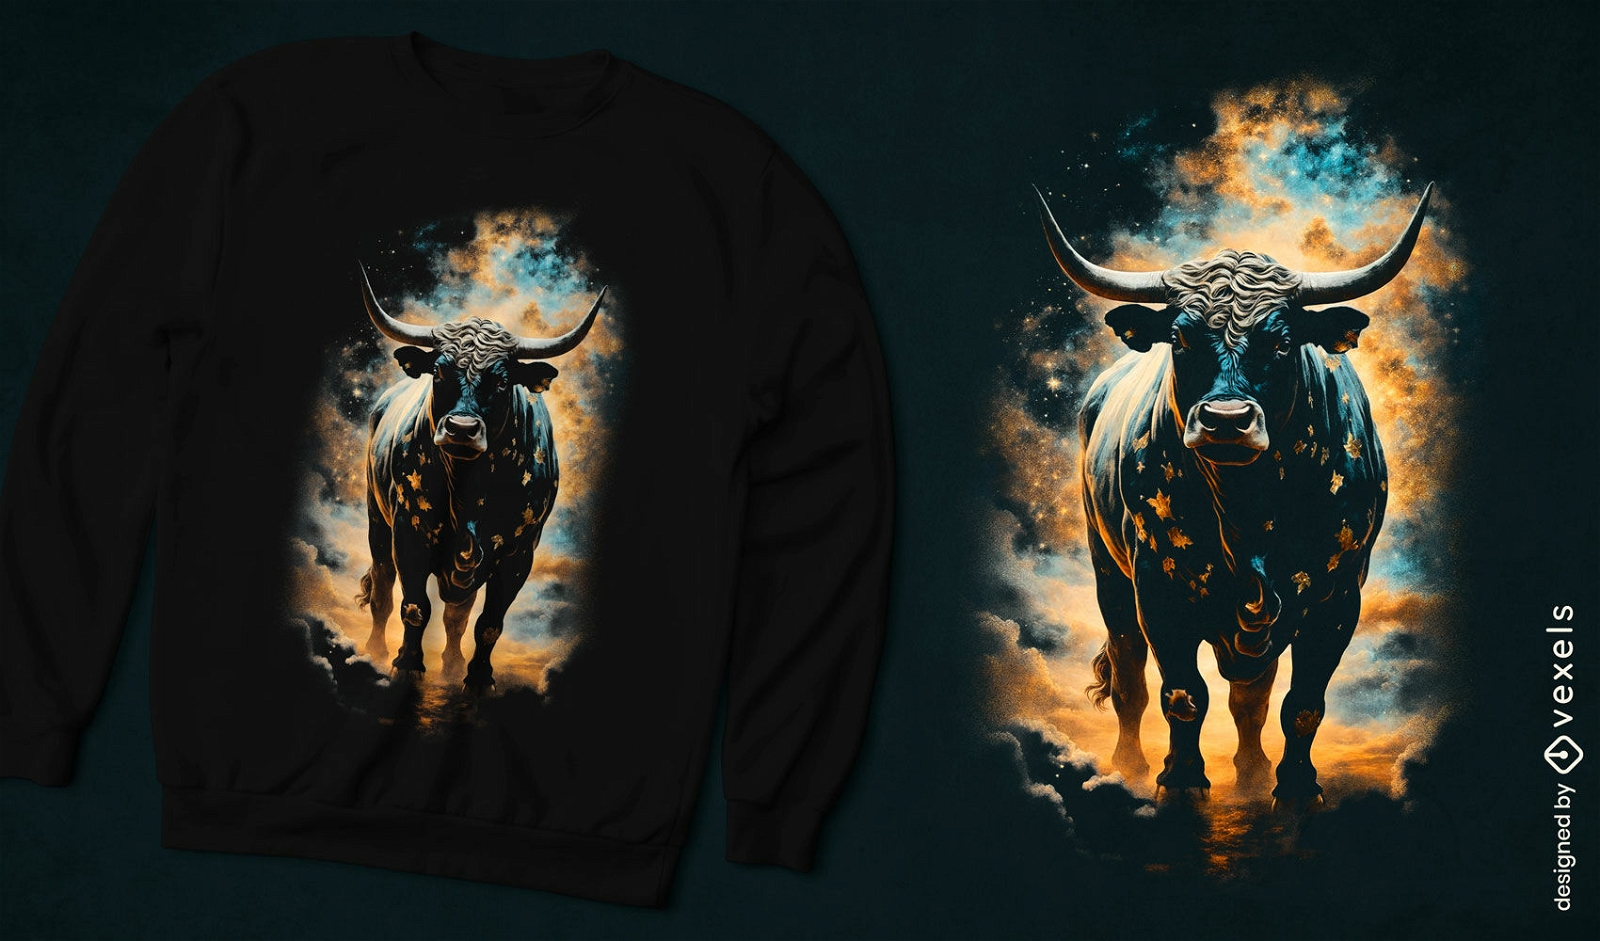
Majestic zodiac taurus t-shirt design
Choose a folder
All favorites
Create new
Save
Majestic zodiac taurus t-shirt design
Print ready
for Merch
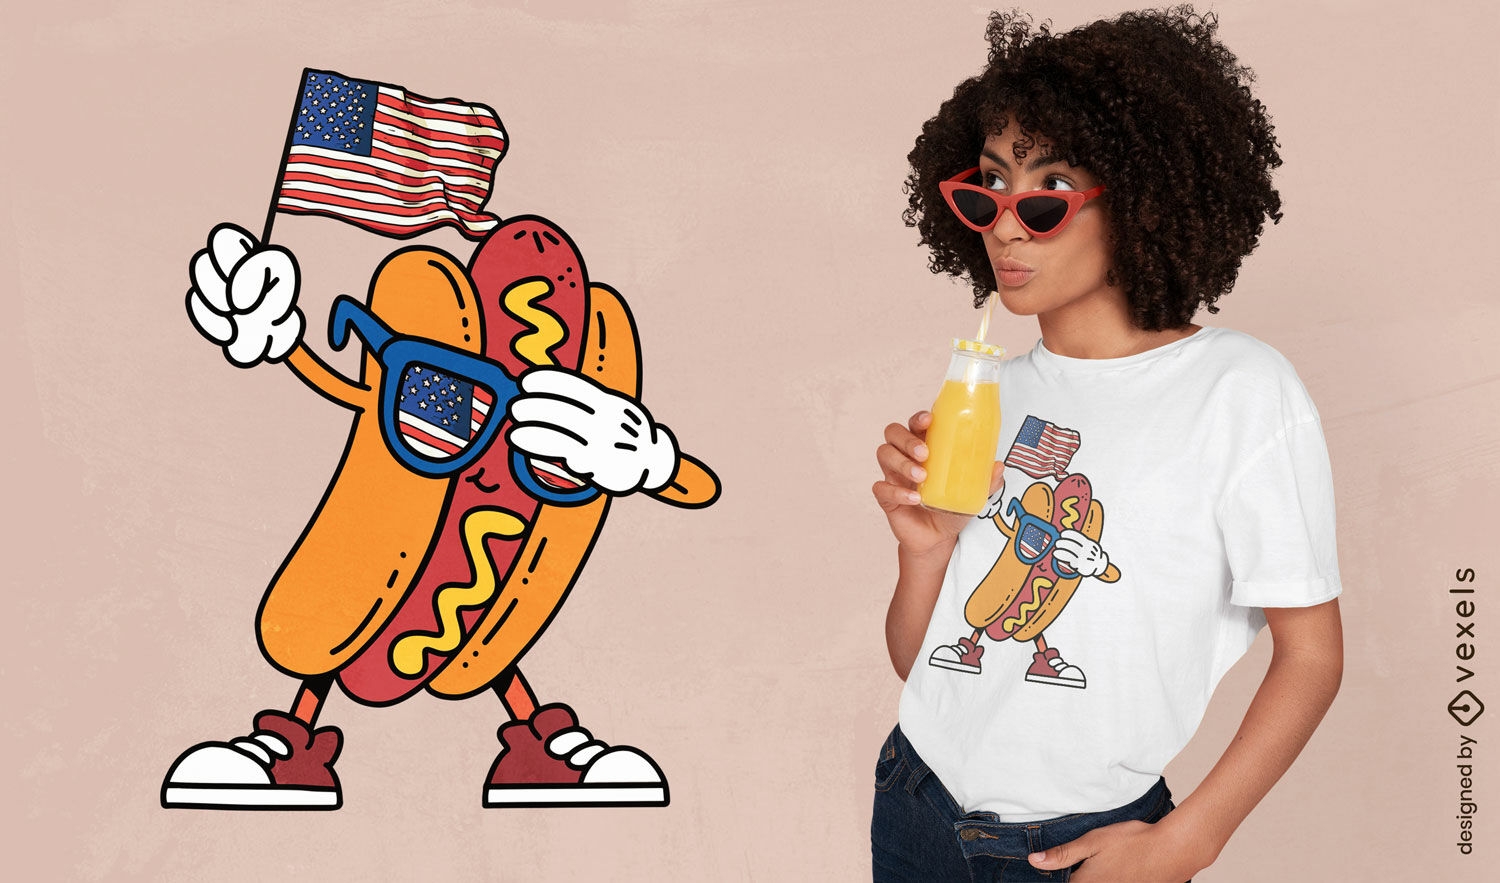
Patriotic hotdog t-shirt design
Choose a folder
All favorites
Create new
Save
Patriotic hotdog t-shirt design
Print ready
for Merch
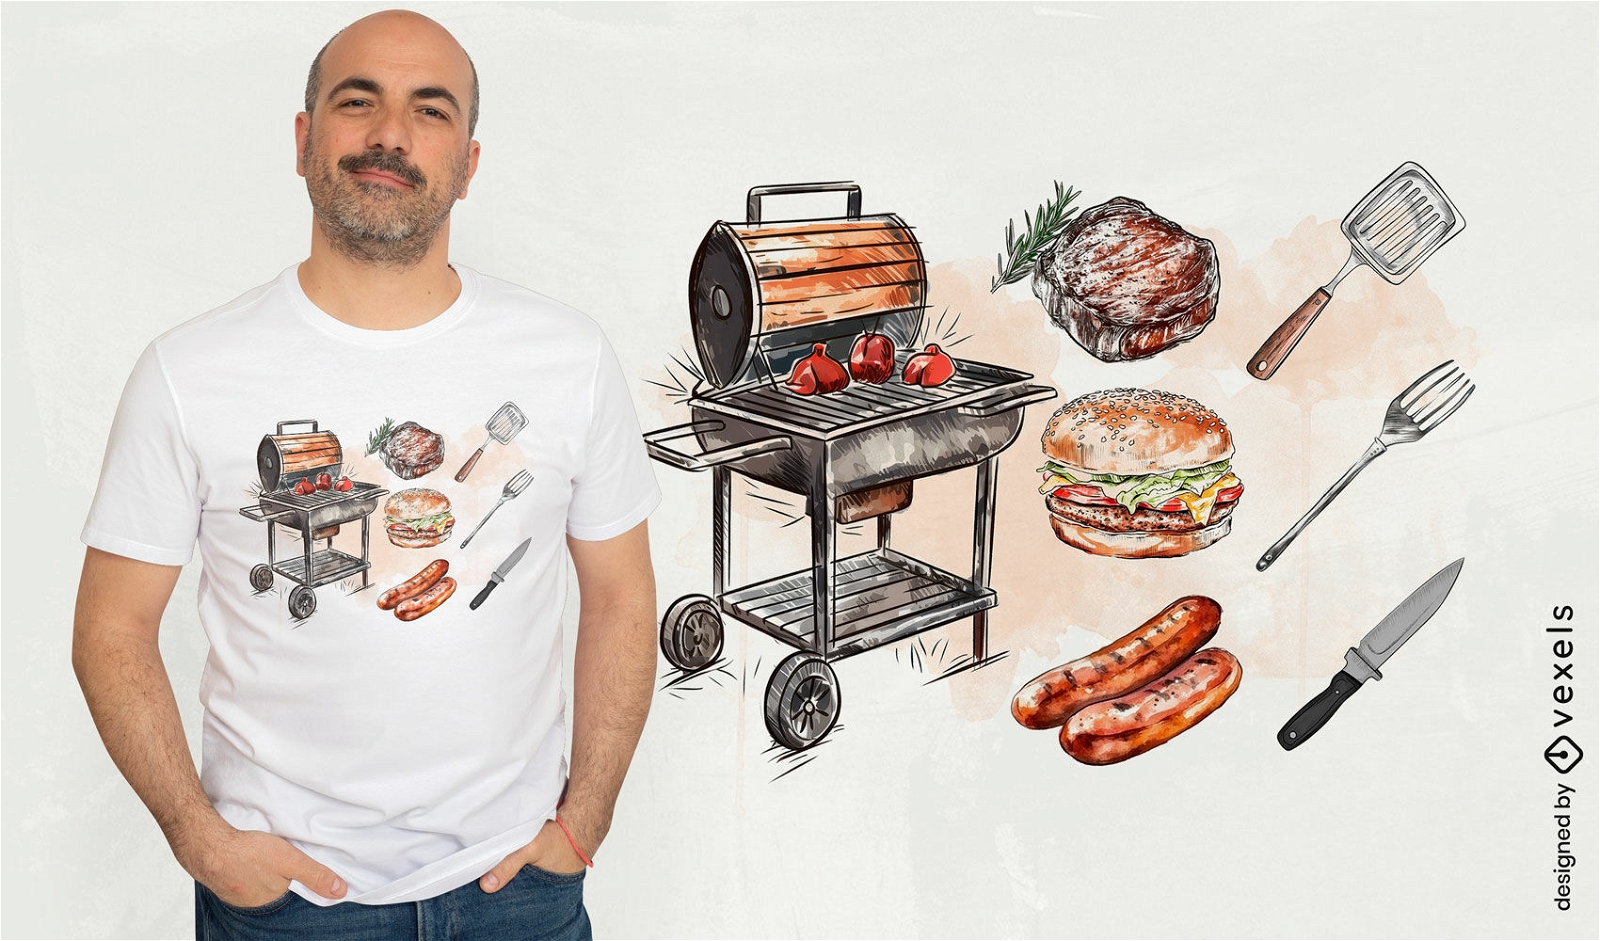
BBQ elements t-shirt design
Choose a folder
All favorites
Create new
Save
BBQ elements t-shirt design
Print ready
for Merch
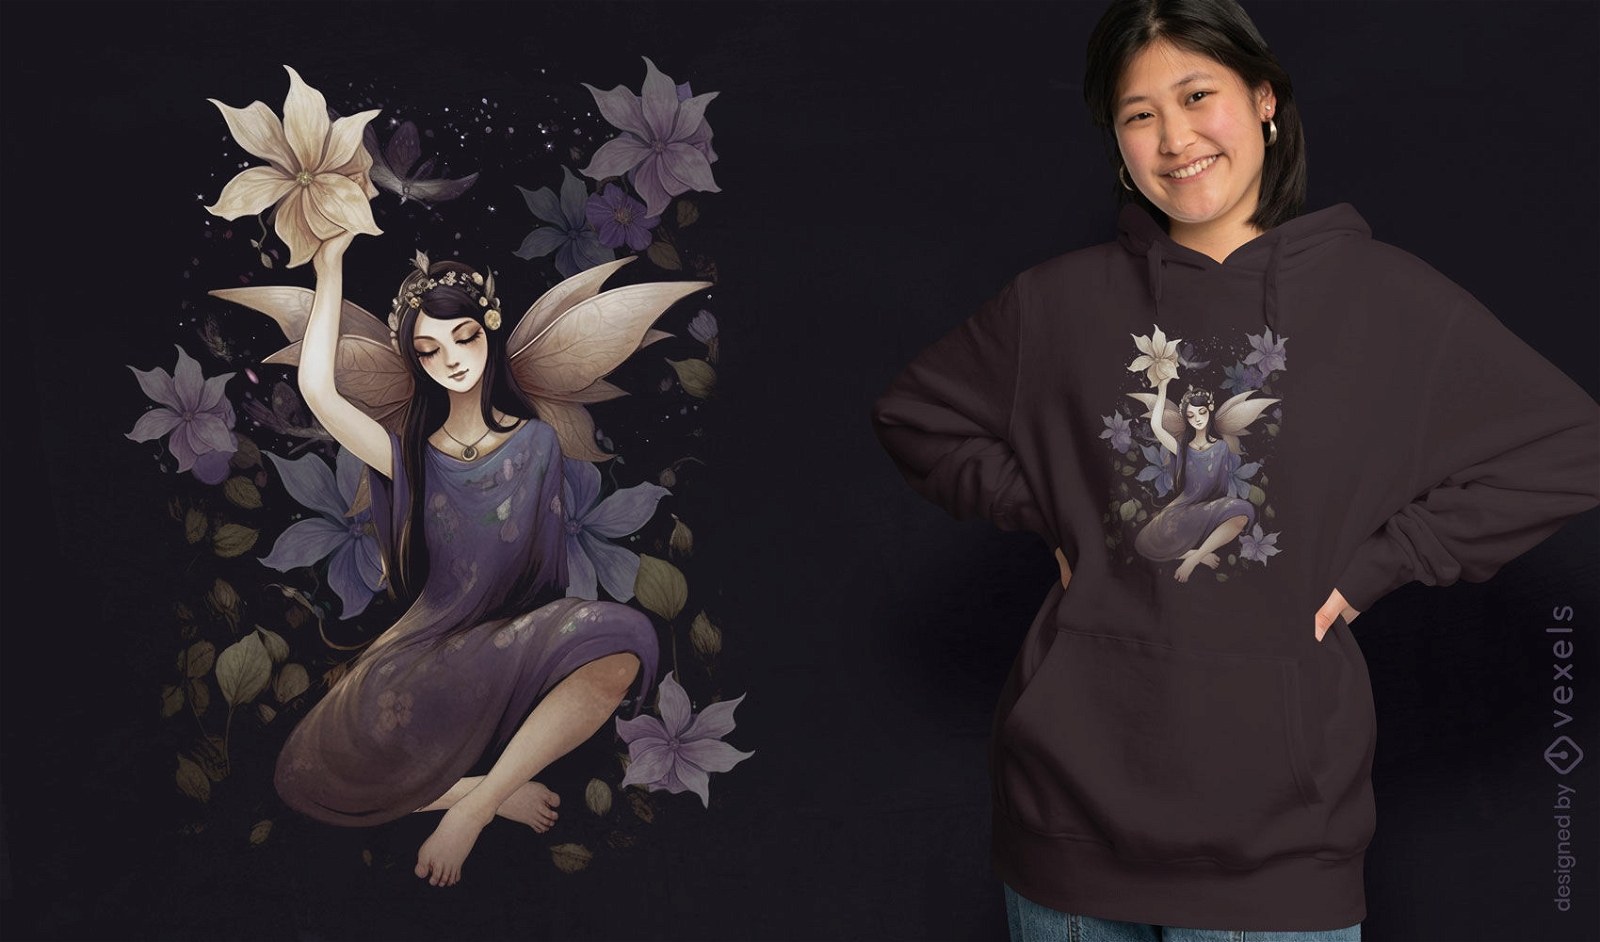
Nightshade fairy t-shirt design
Choose a folder
All favorites
Create new
Save
Nightshade fairy t-shirt design
Print ready
for Merch
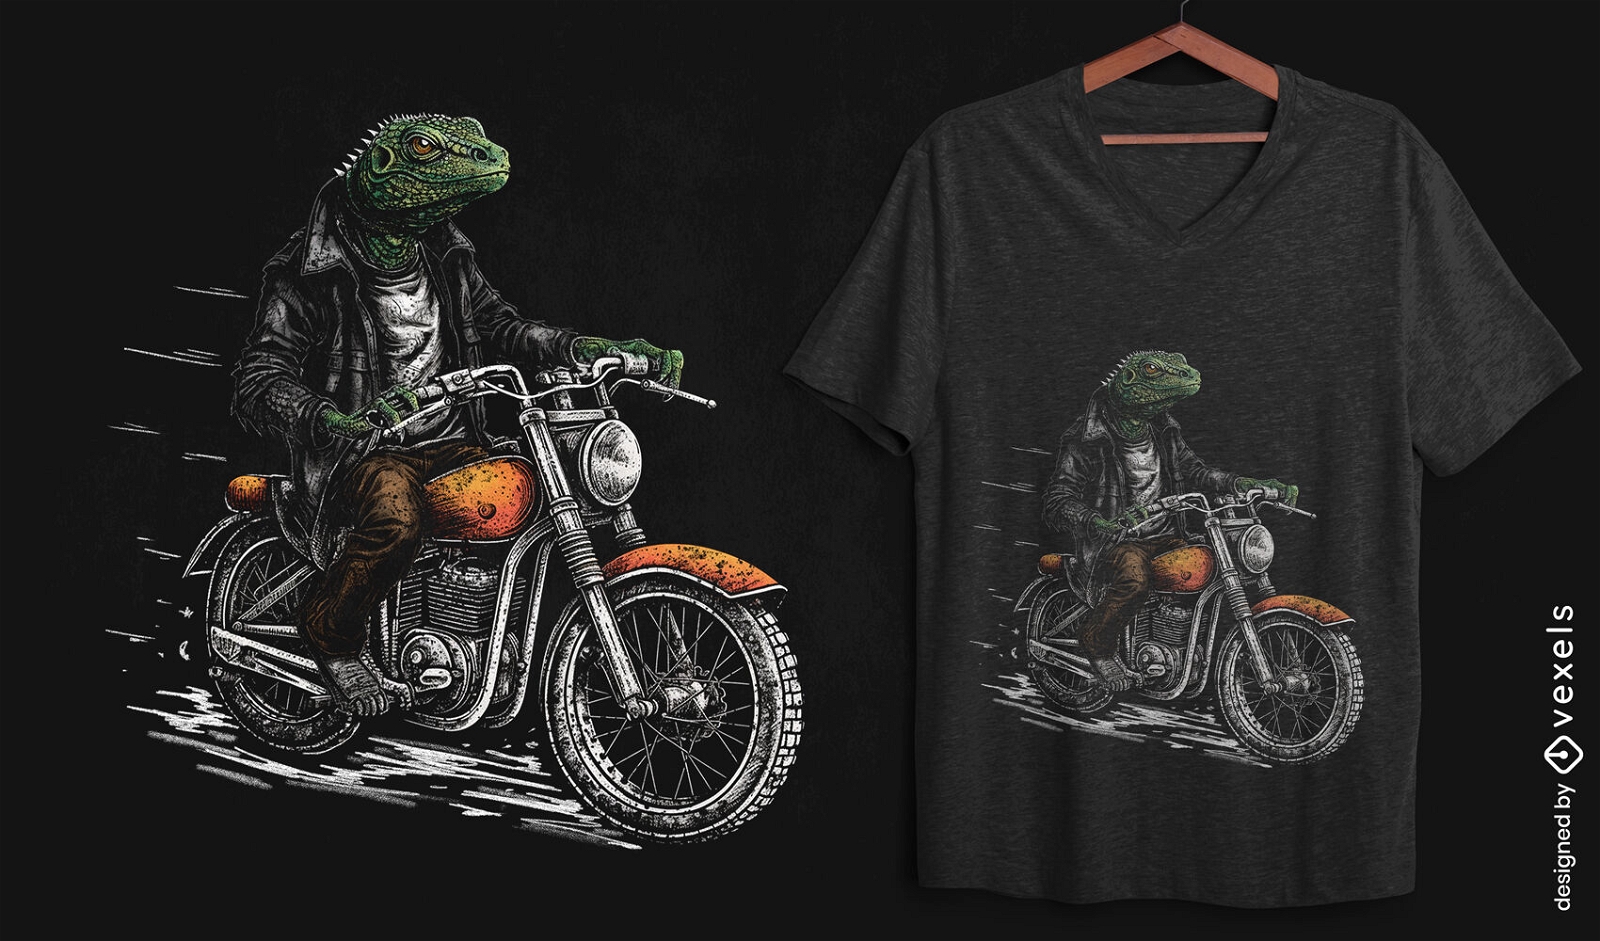
Reptile biker t-shirt design
Choose a folder
All favorites
Create new
Save
Reptile biker t-shirt design
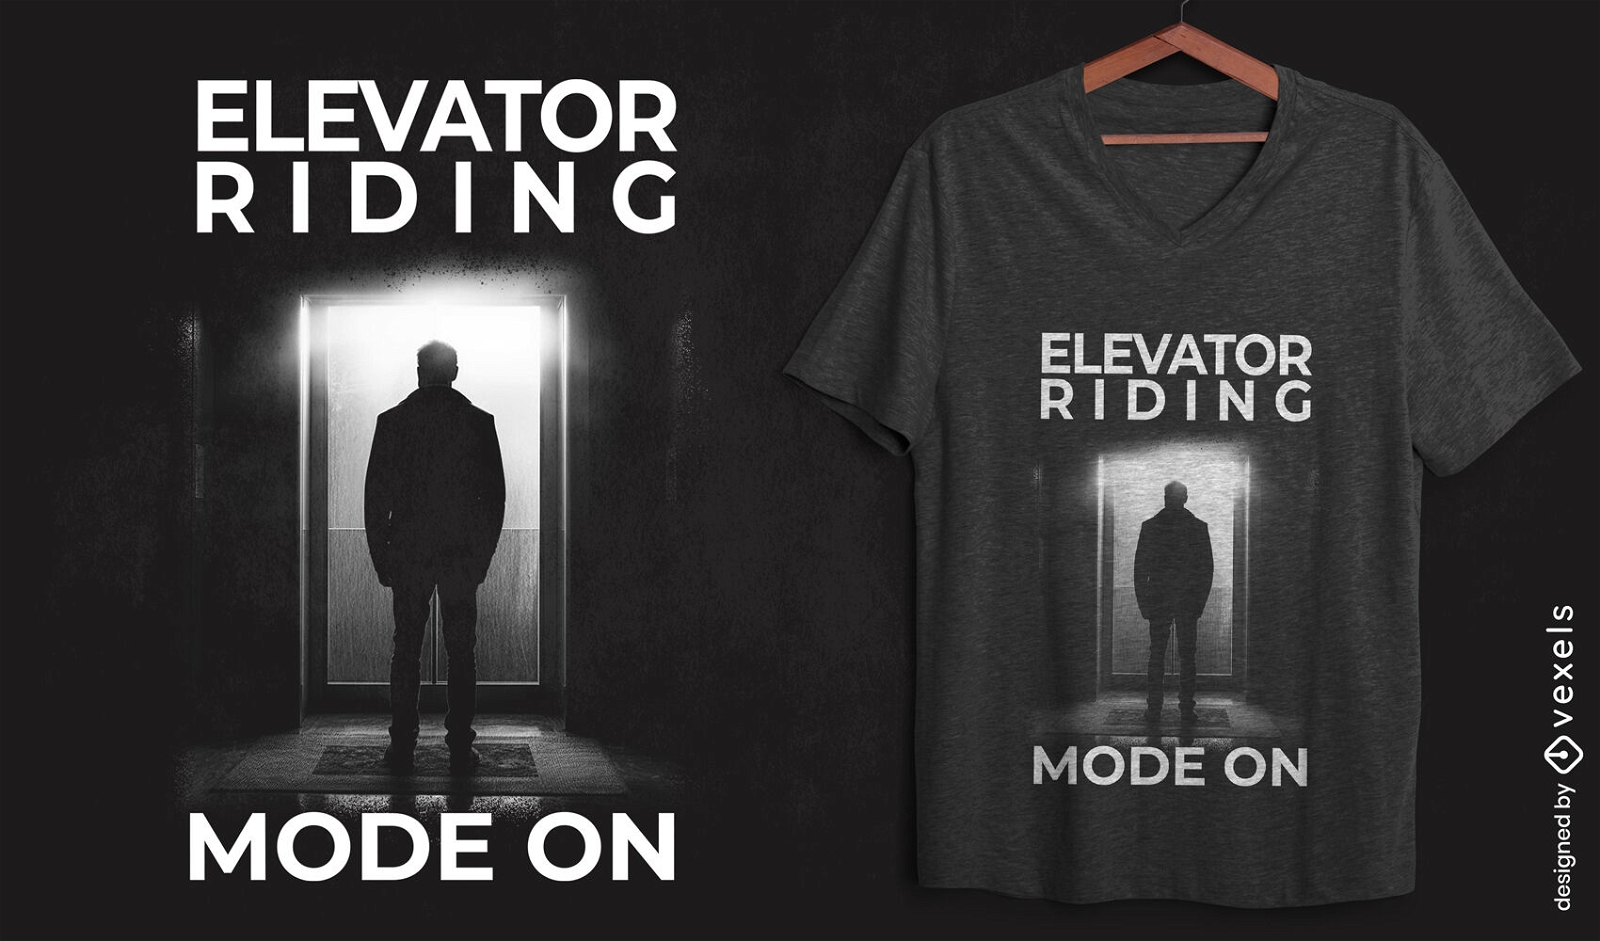
Editable text
Print ready
for Merch
Elevator solitude t-shirt design
Choose a folder
All favorites
Create new
Save
Elevator solitude t-shirt design
Print ready
for Merch
Wise owl with gum t-shirt design
Choose a folder
All favorites
Create new
Save
Wise owl with gum t-shirt design
Print ready
for Merch
Italian welder t-shirt design
Choose a folder
All favorites
Create new
Save
Italian welder t-shirt design
Print ready
for Merch
Angry kitten illustration t-shirt design
Choose a folder
All favorites
Create new
Save
Angry kitten illustration t-shirt design
Print ready
for Merch
Retro sunset forest t-shirt design
Choose a folder
All favorites
Create new
Save
Retro sunset forest t-shirt design
Print ready
for Merch
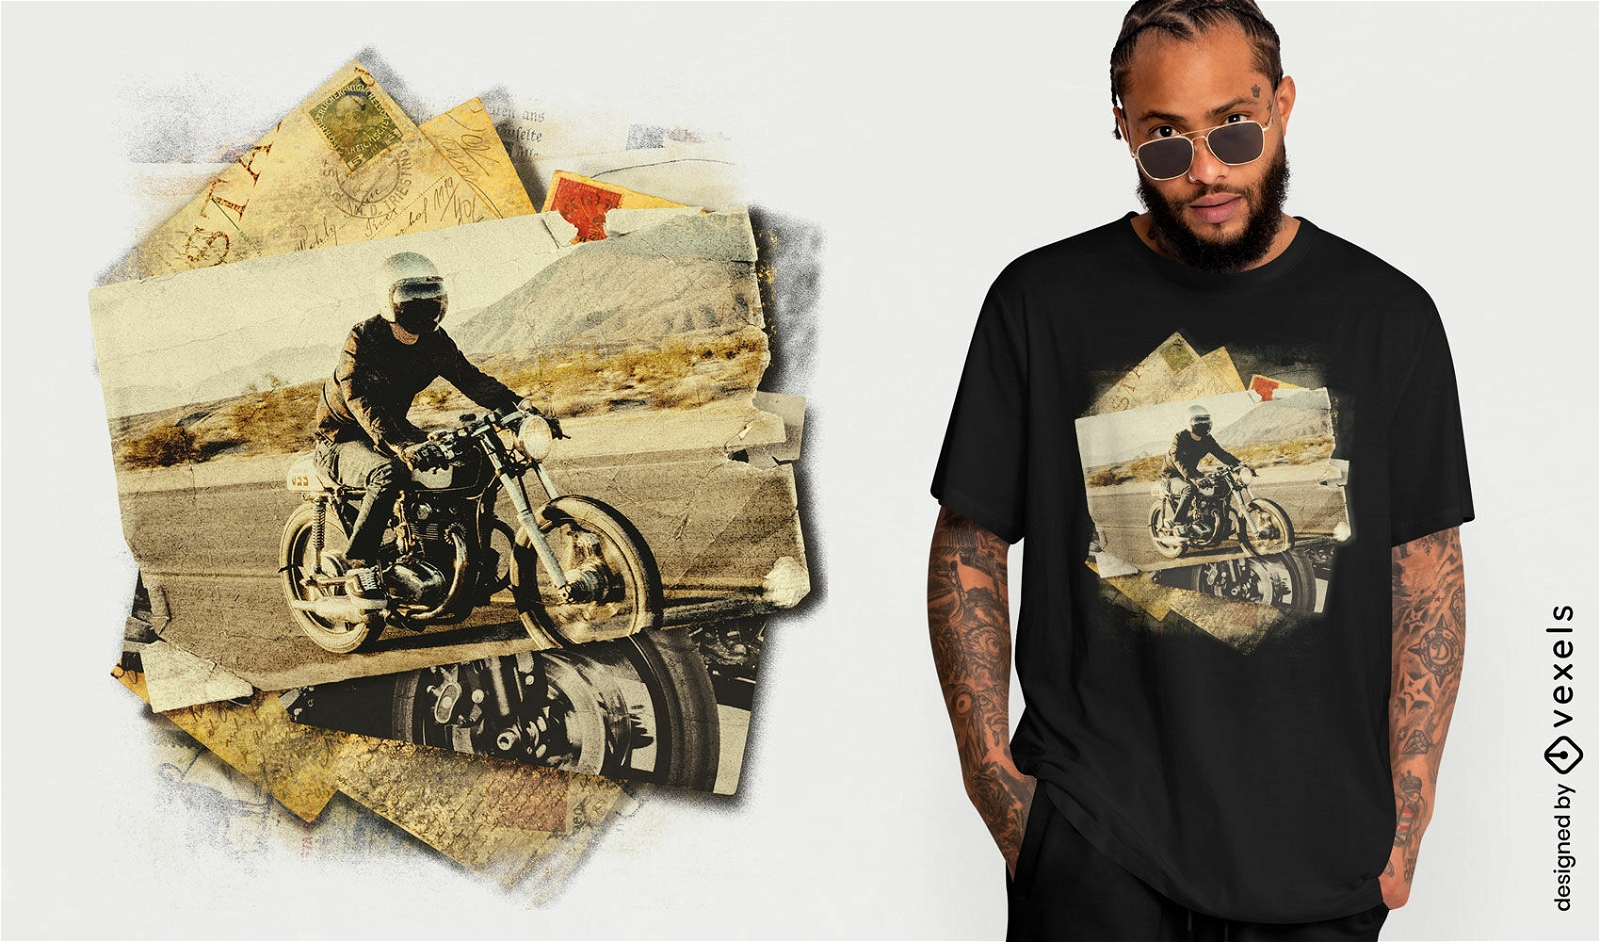
Motorcicle photography collage t-shirt design
Choose a folder
All favorites
Create new
Save
Motorcicle photography collage t-shirt design
Print ready
for Merch
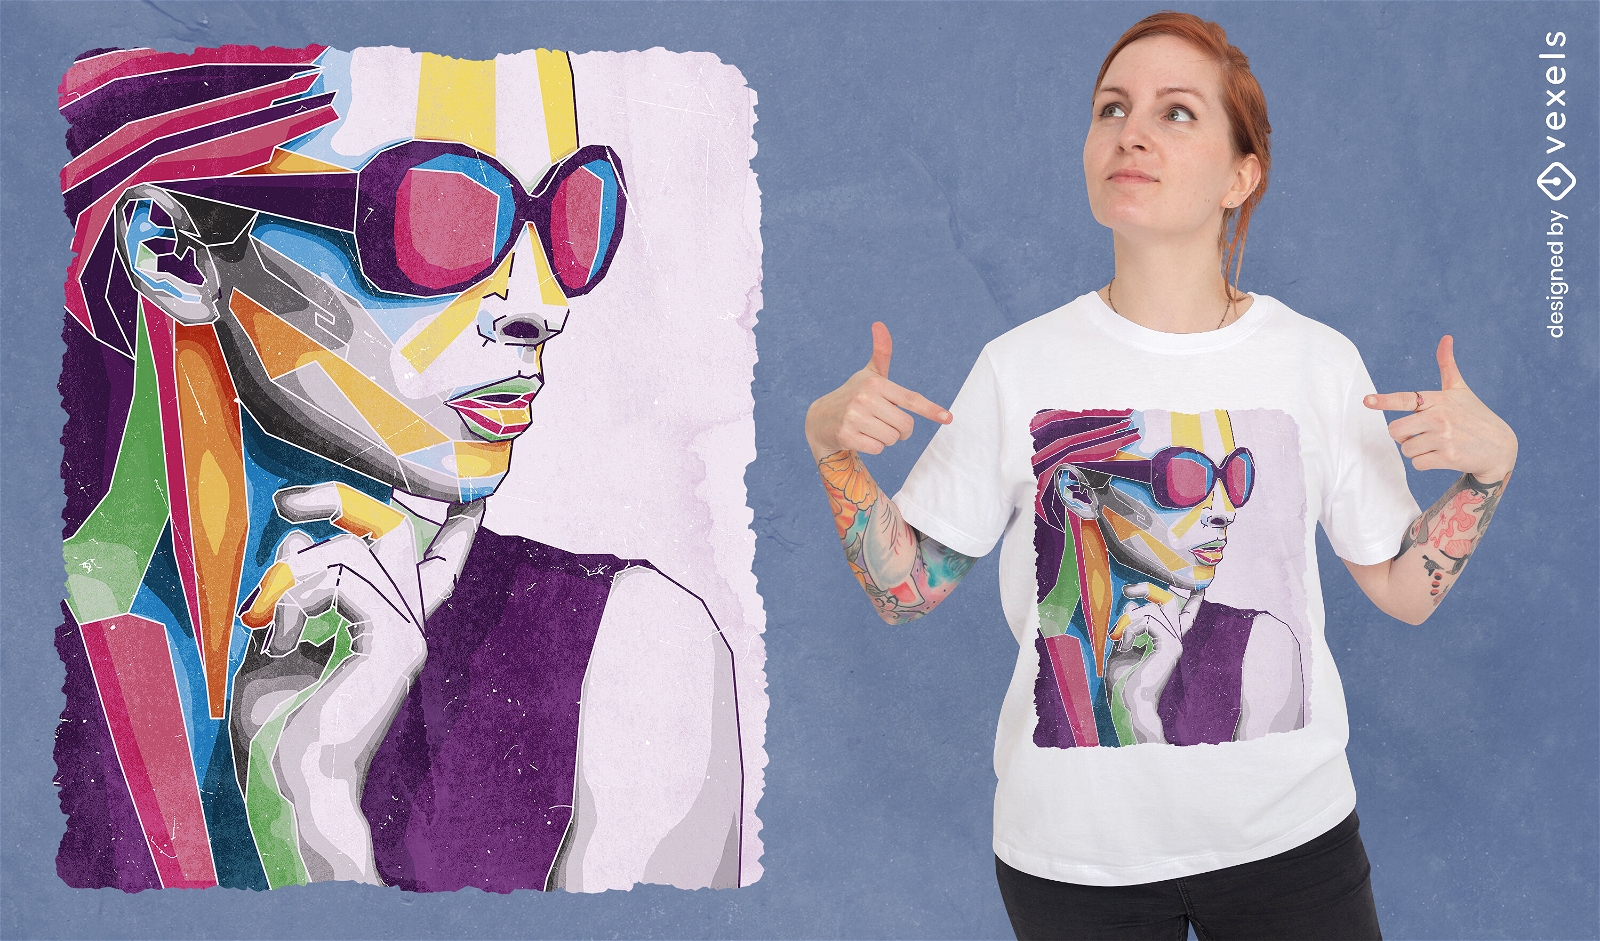
Colorful abstract woman face t-shirt design
Choose a folder
All favorites
Create new
Save
Colorful abstract woman face t-shirt design
Print ready
for Merch
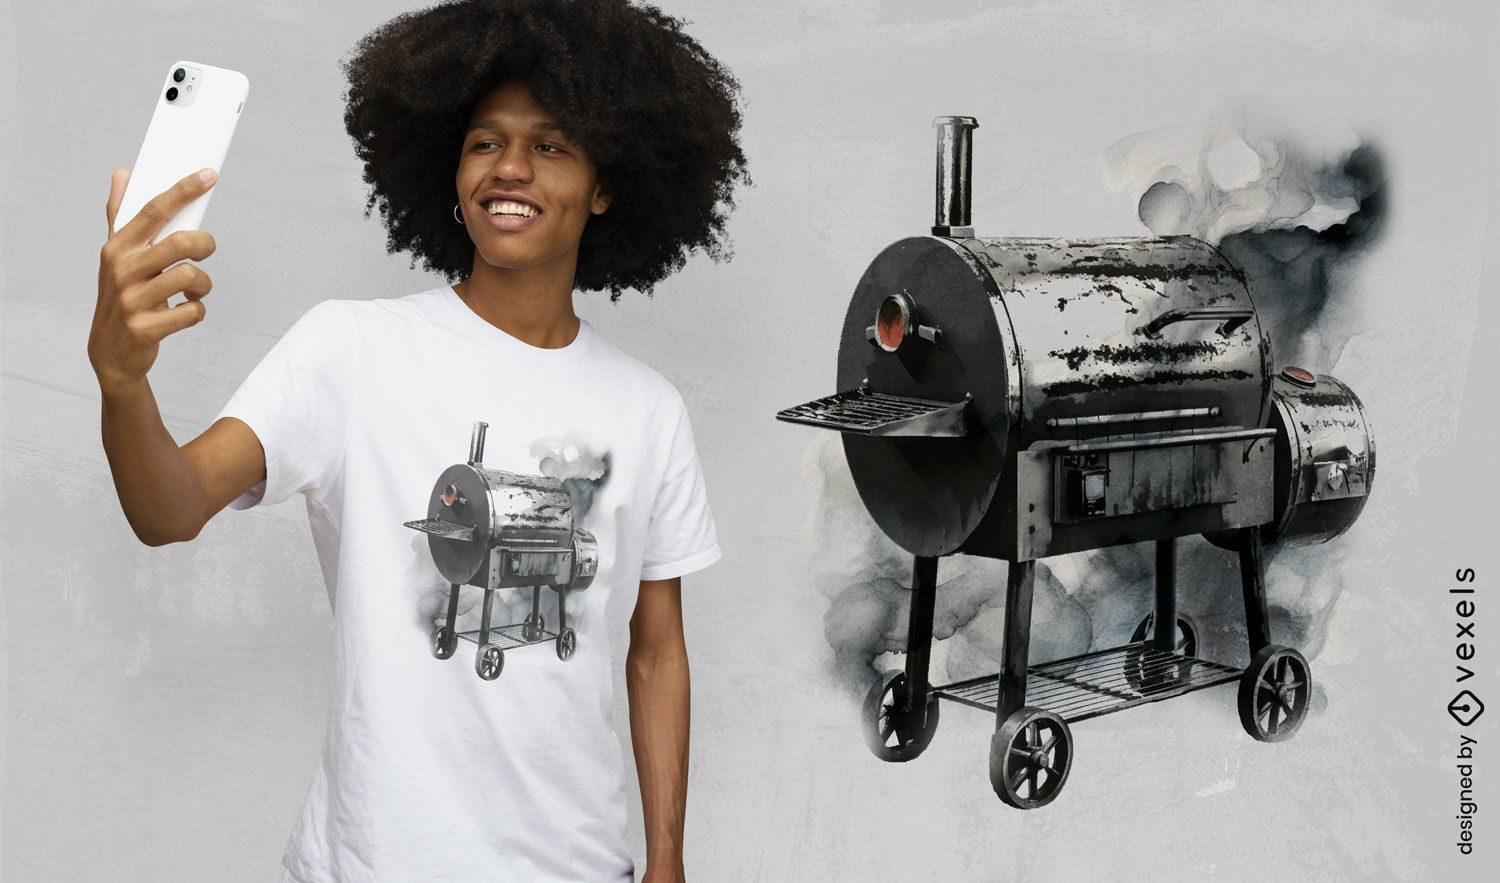
Smoky BBQ smoker t-shirt design
Choose a folder
All favorites
Create new
Save
Smoky BBQ smoker t-shirt design
Print ready
for Merch
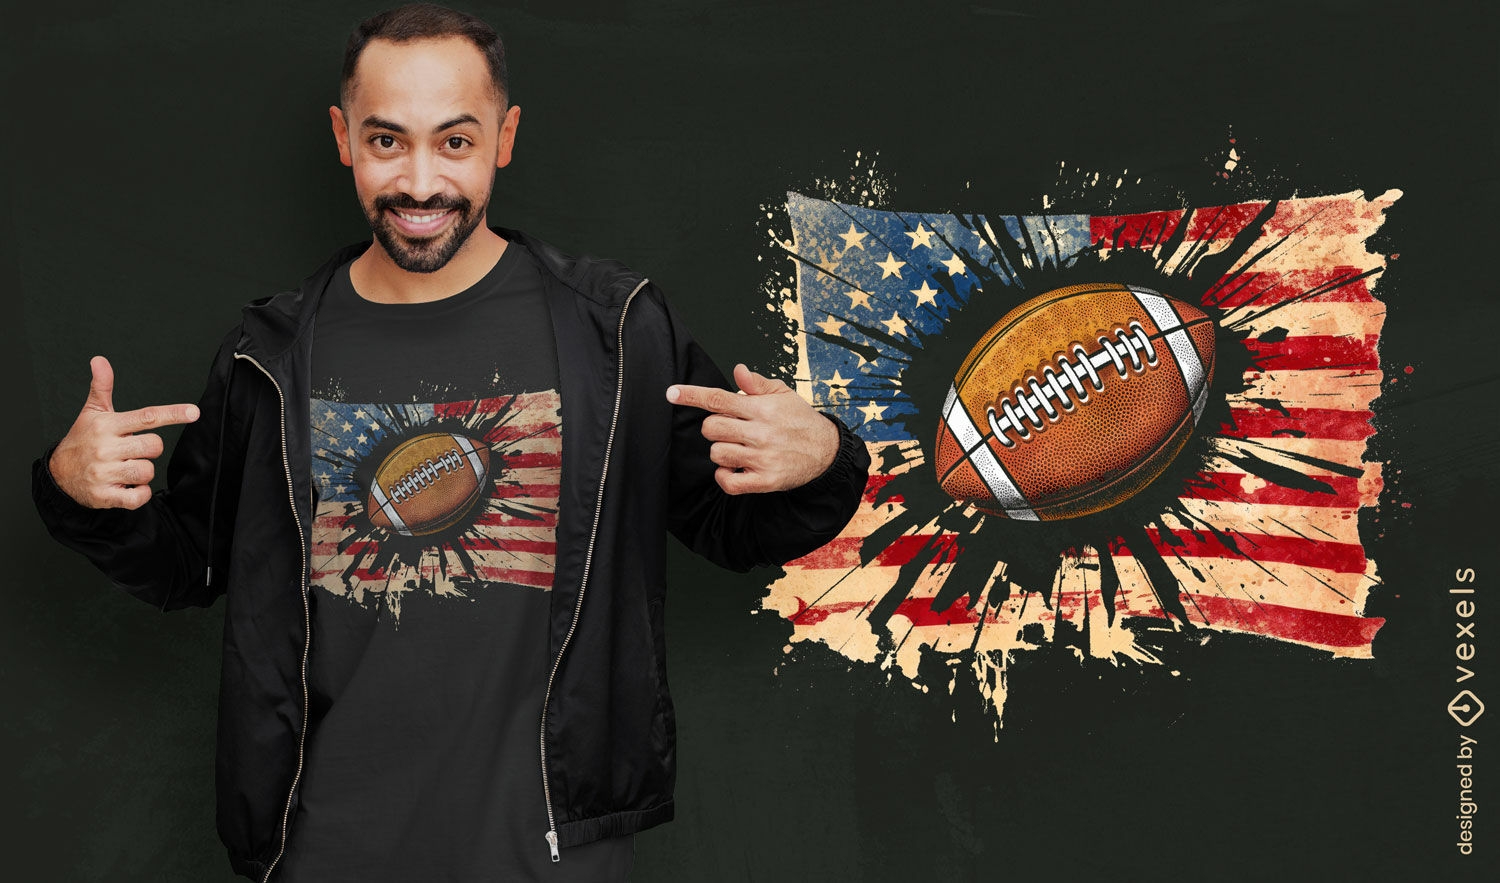
Patriotic football t-shirt design
Choose a folder
All favorites
Create new
Save
Patriotic football t-shirt design
Print ready
for Merch
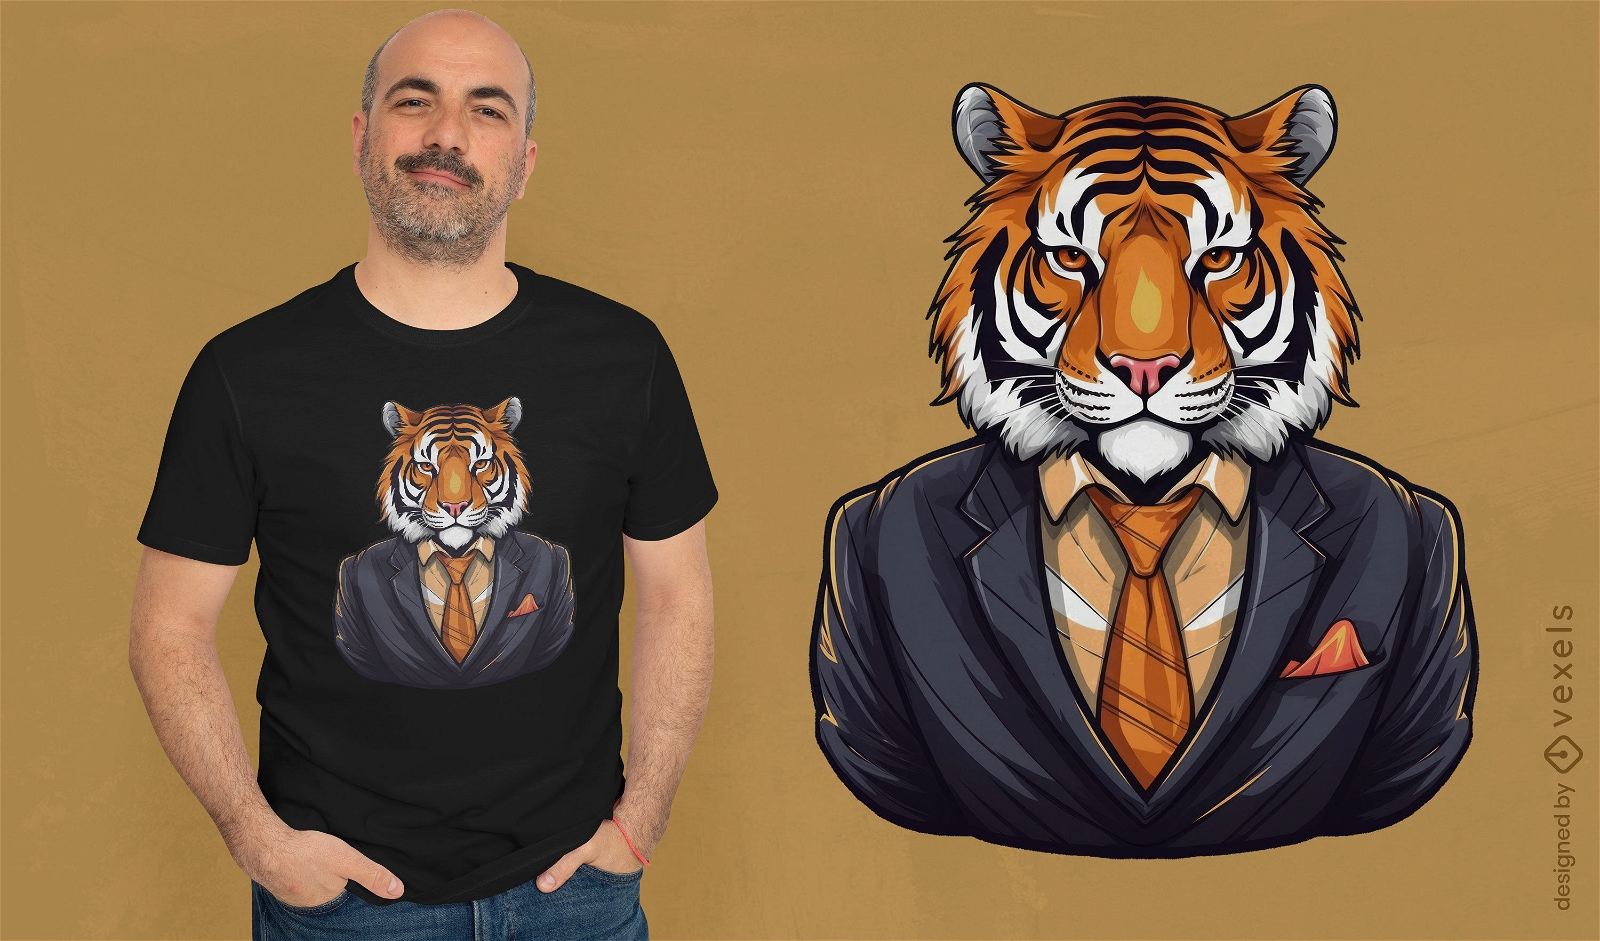
Suited tiger t-shirt design
Choose a folder
All favorites
Create new
Save
Suited tiger t-shirt design
Editable text
Print ready
for Merch
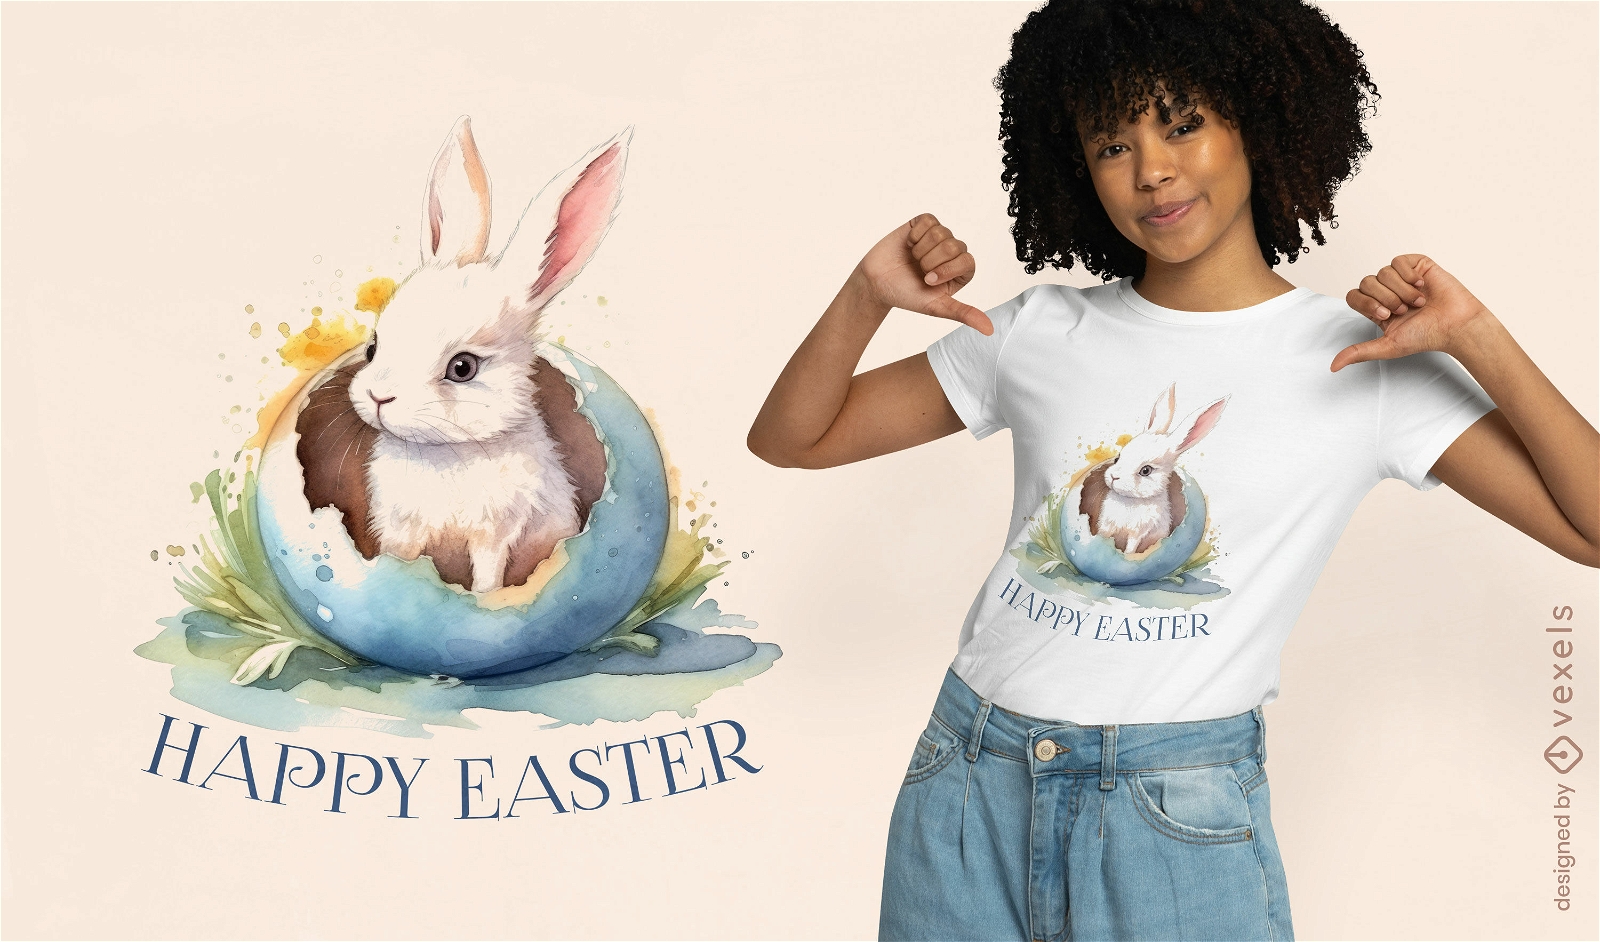
Festive Easter bunny t-shirt design
Choose a folder
All favorites
Create new
Save
Festive Easter bunny t-shirt design
Print ready
for Merch
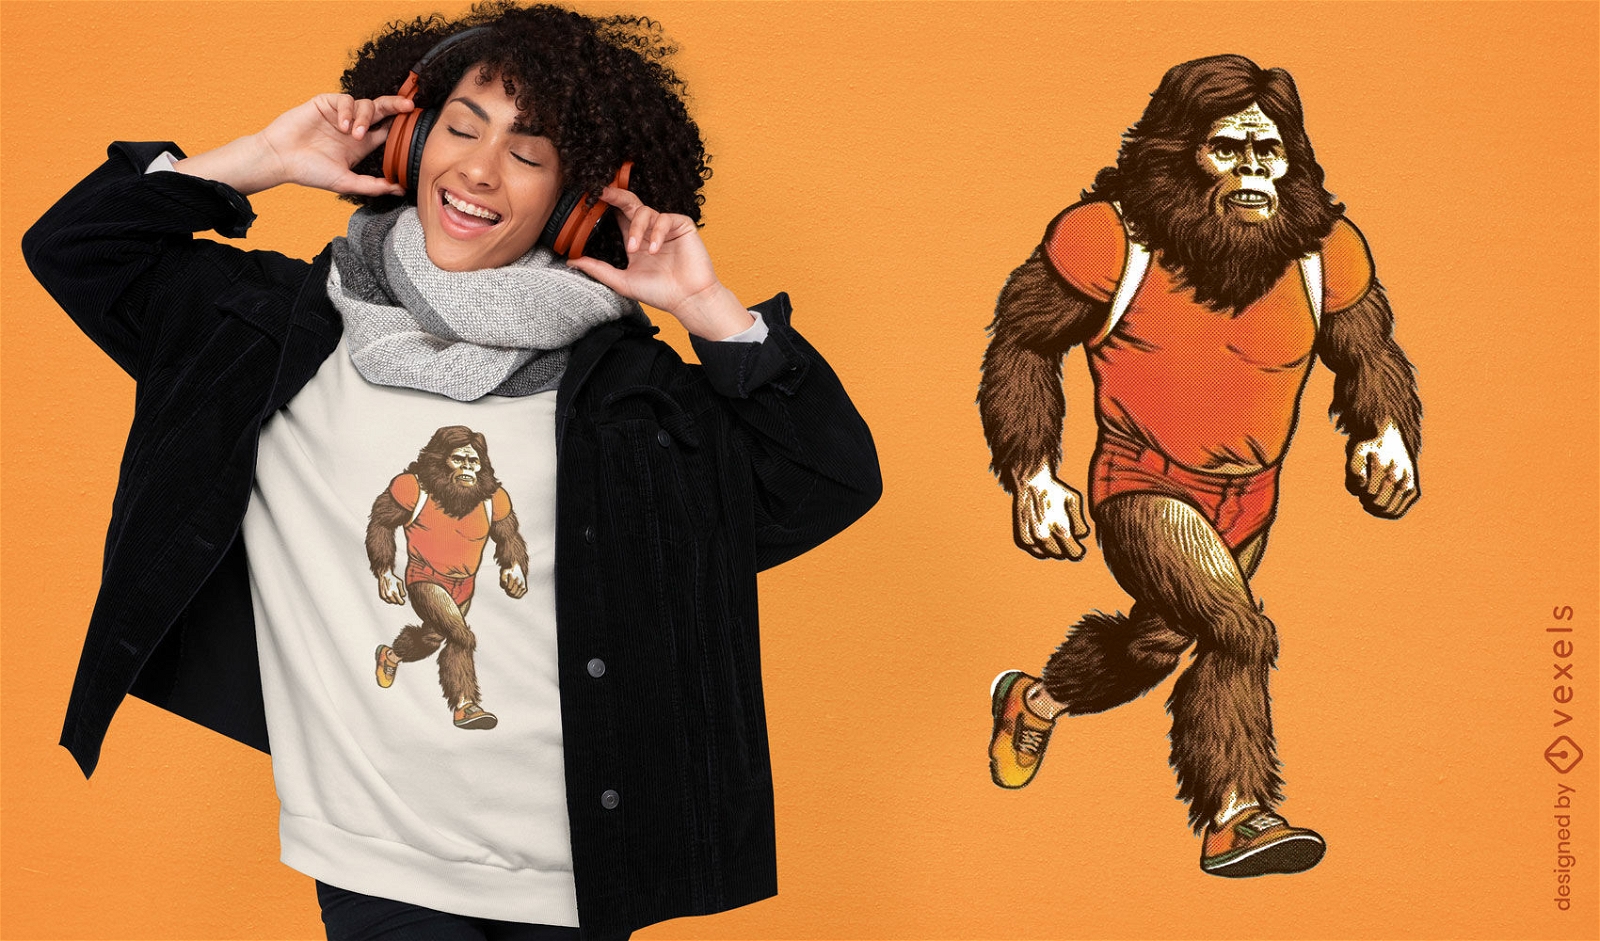
Running Bigfoot t-shirt design
Choose a folder
All favorites
Create new
Save
Running Bigfoot t-shirt design
Boost Your Business
With The Leading Graphic Platform For Merch.
SEE PLANS
Next
of 85
prev page
next page