Design Library
Explore Designs
New Merch Designs
Trending Merch Designs
Vectors
PNGs & SVGs
Mockups
T-Shirts
T-Shirt PSD Templates
KDP Designs
Phone Cases
Pillows
Tote Bags
Posters
Mugs
Design Tools
Designer
New!
T-shirt Maker
Mockup Generator
Quote Generator
Logo Maker
Resources
Merch Digest
Blog
Help Center
Creators Program
Learn About Merch
Changelog
API Access
Pricing
Loading...
Sign Up
Login
PSD Templates
grafico
Design Library
Explore Designs
New Merch Designs
Trending Merch Designs
Vectors
PNGs & SVGs
Mockups
T-Shirts
T-Shirt PSD Templates
KDP Designs
Phone Cases
Pillows
Tote Bags
Posters
Mugs
Design Tools
Designer
New!
T-shirt Maker
Mockup Generator
Quote Generator
Logo Maker
Resources
Merch Digest
Blog
Help Center
Creators Program
Learn About Merch
Changelog
API Access
PLANS
PSD Templates
grafico
4214 grafico PSD T Shirt Designs and Mockups
Download editable grafico PSD t shirt designs or mockups
Sort by
Most relevant
Sponsored results by
Get 15% off with code: VEXELS15
Show more
Print ready
for Merch
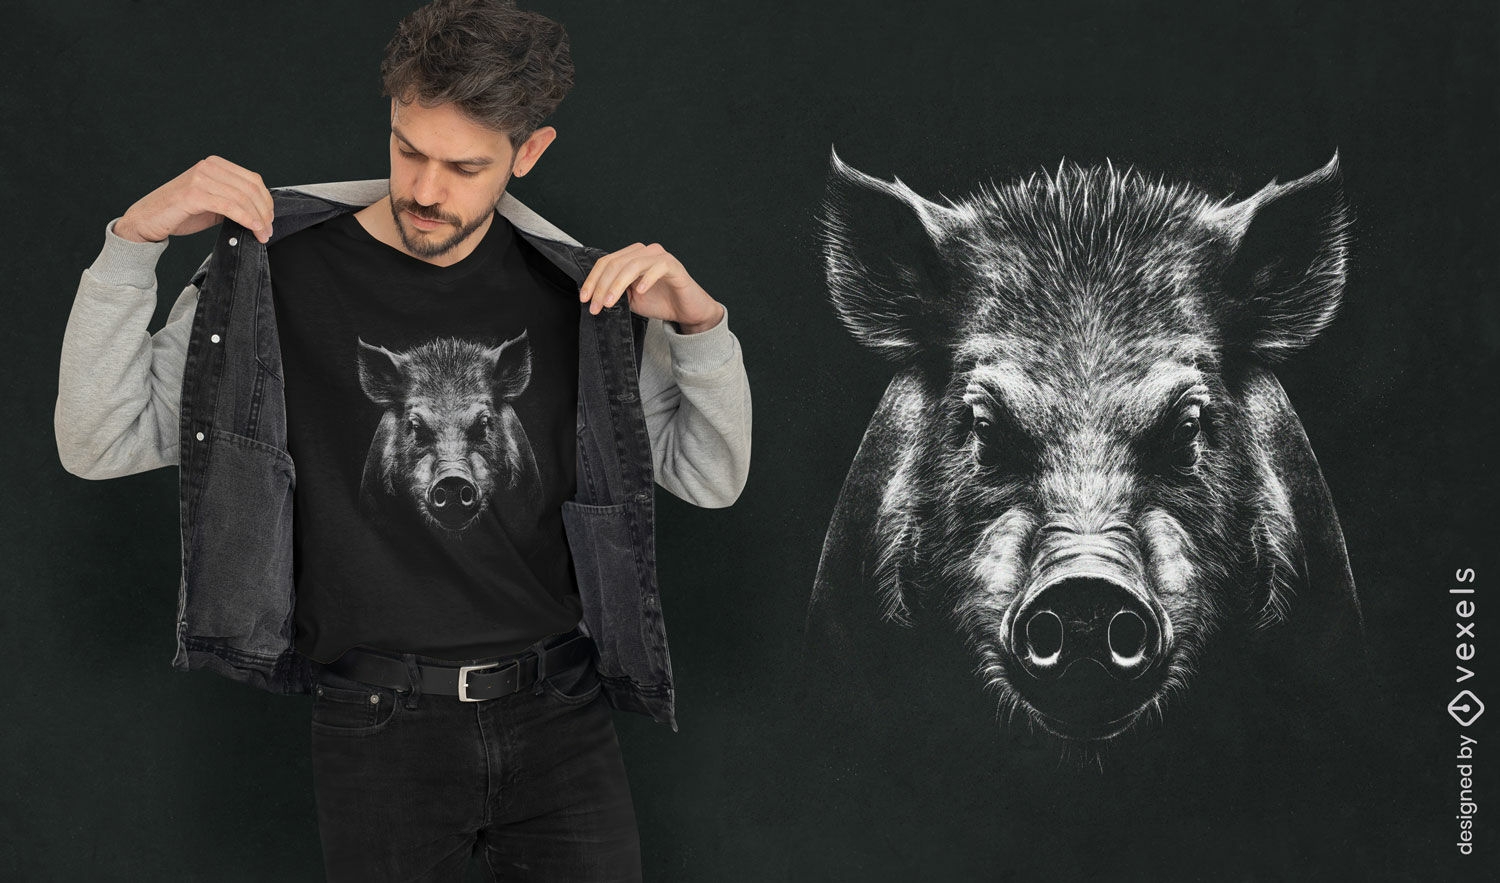
Fierce boar t-shirt design
Choose a folder
All favorites
Create new
Save
Fierce boar t-shirt design
Print ready
for Merch
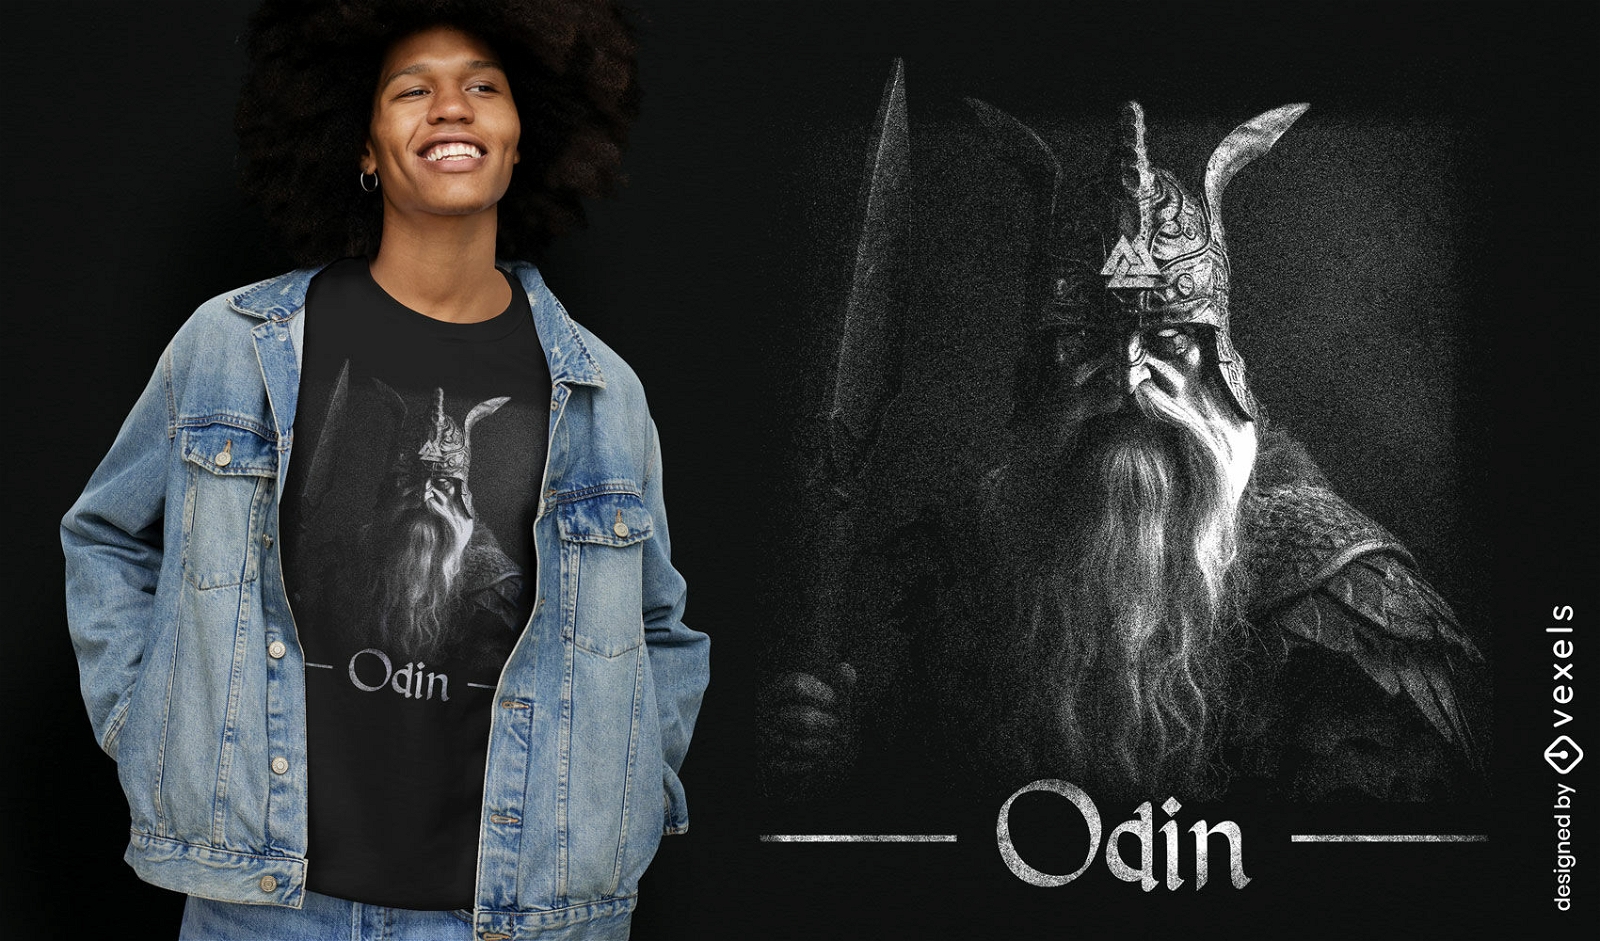
Norse god Odin t-shirt design
Choose a folder
All favorites
Create new
Save
Norse god Odin t-shirt design
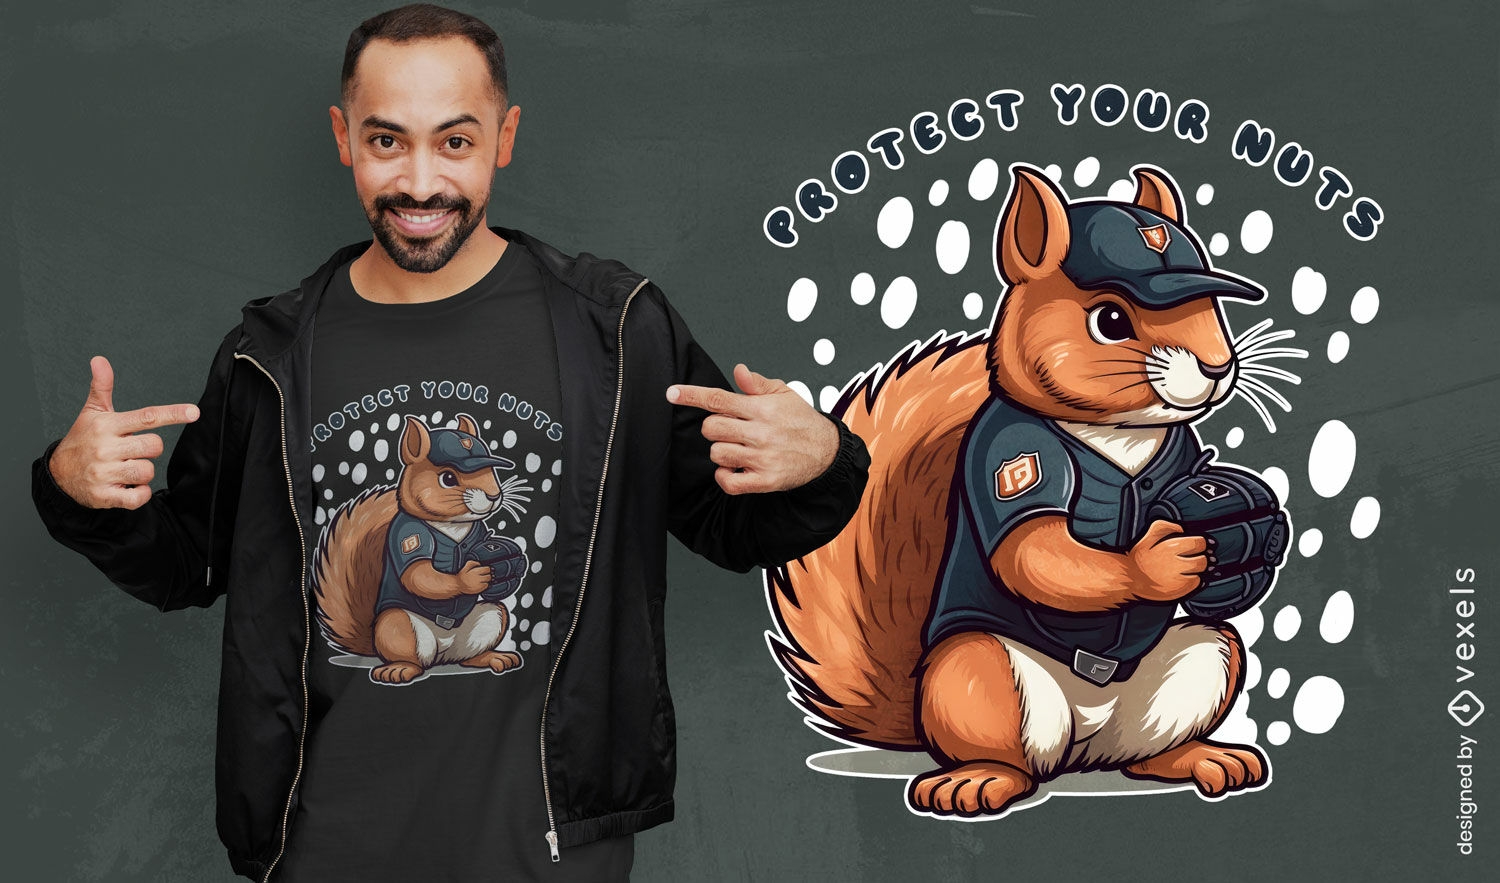
Print ready
for Merch
Baseball squirrel t-shirt design
Choose a folder
All favorites
Create new
Save
Baseball squirrel t-shirt design
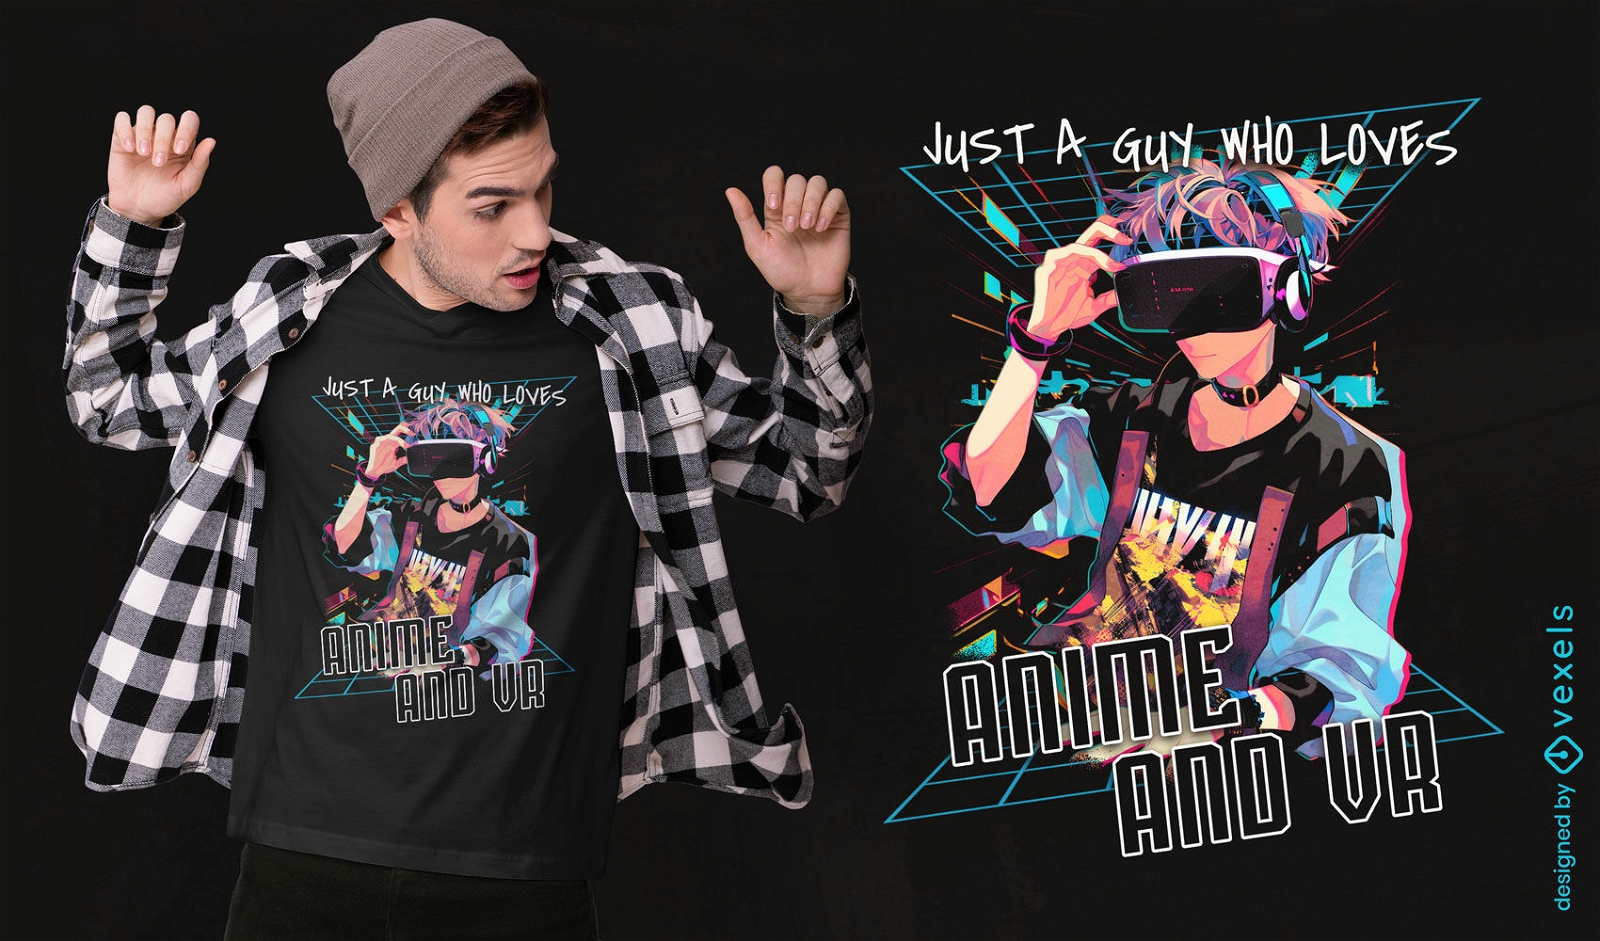
Print ready
for Merch
Anime VR t-shirt design
Choose a folder
All favorites
Create new
Save
Anime VR t-shirt design
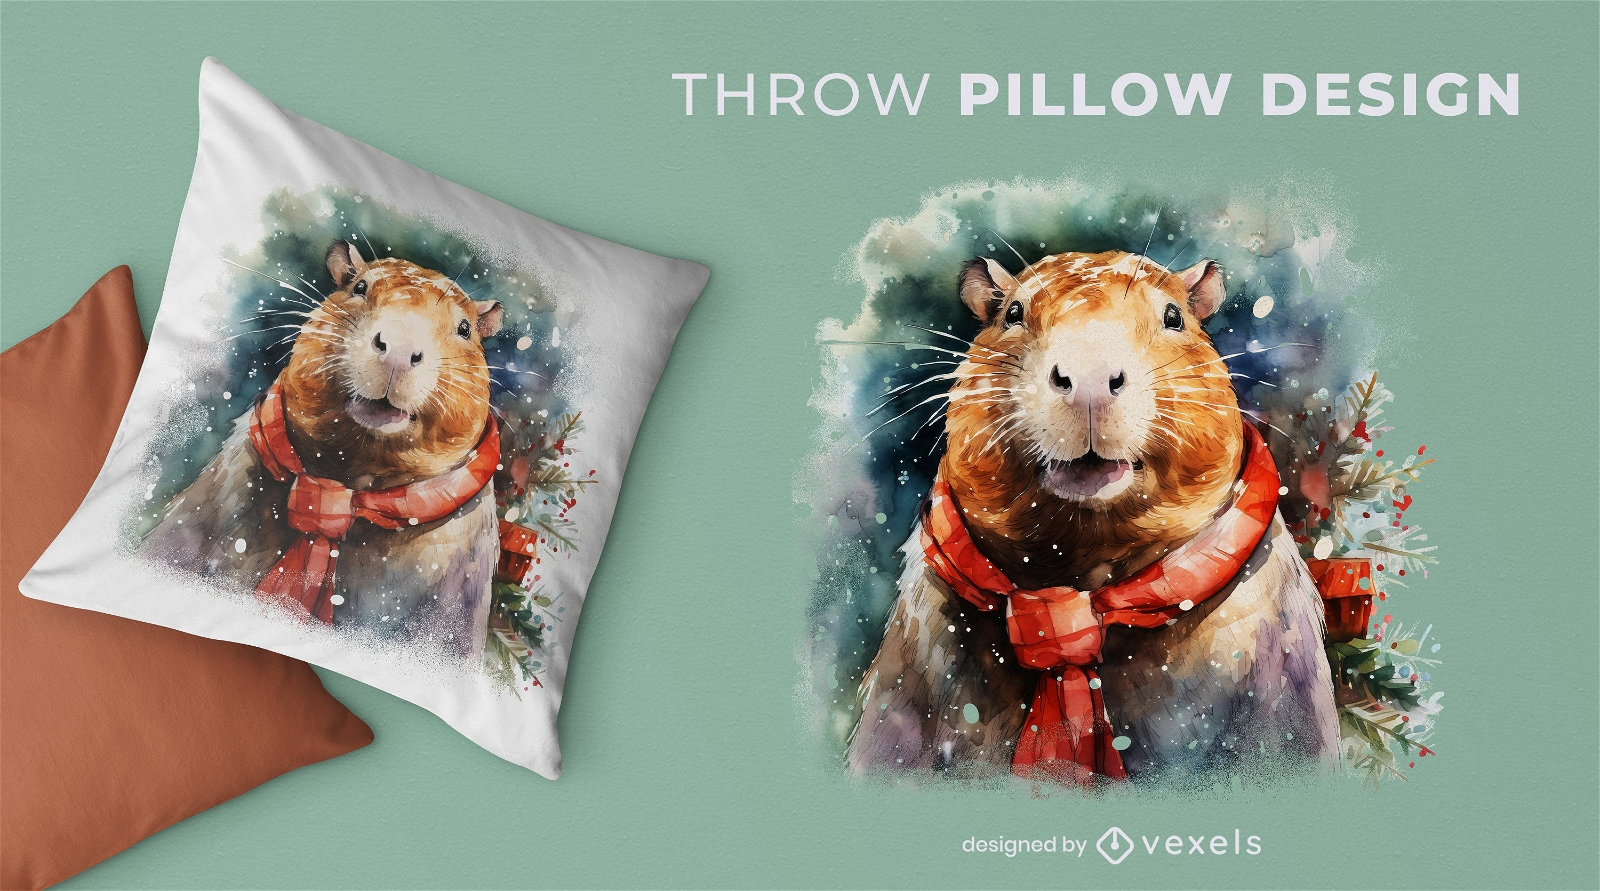
Print ready
for Merch
Capybara christmas throw pillow design
Choose a folder
All favorites
Create new
Save
Capybara christmas throw pillow design
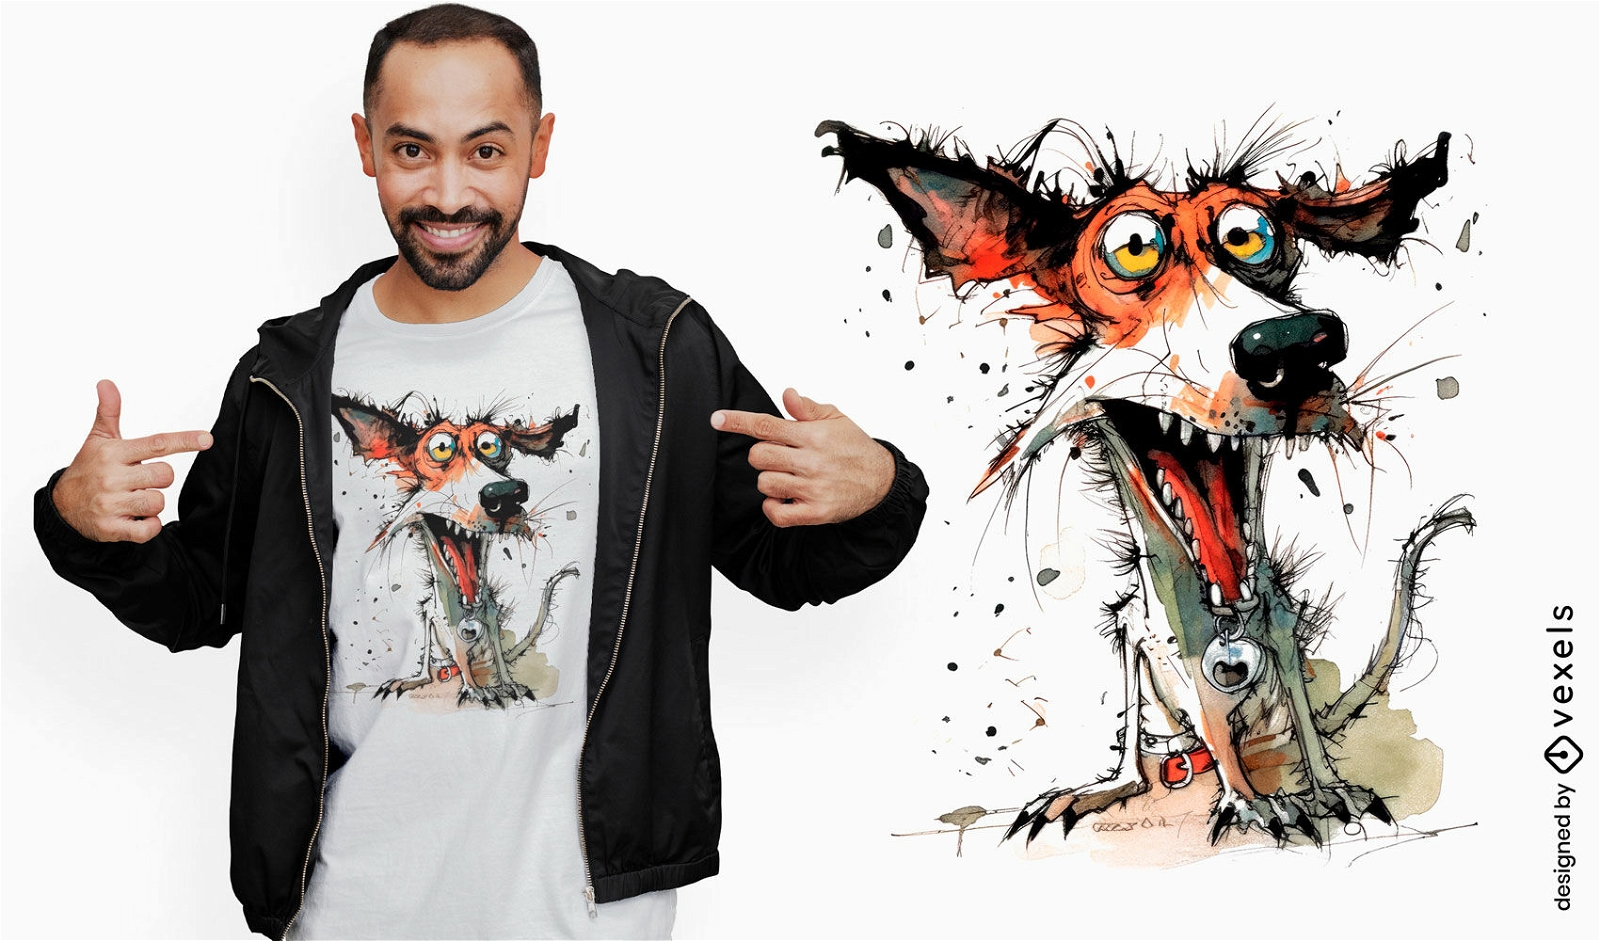
Print ready
for Merch
Crazy dog painting t-shirt design
Choose a folder
All favorites
Create new
Save
Crazy dog painting t-shirt design
Print ready
for Merch
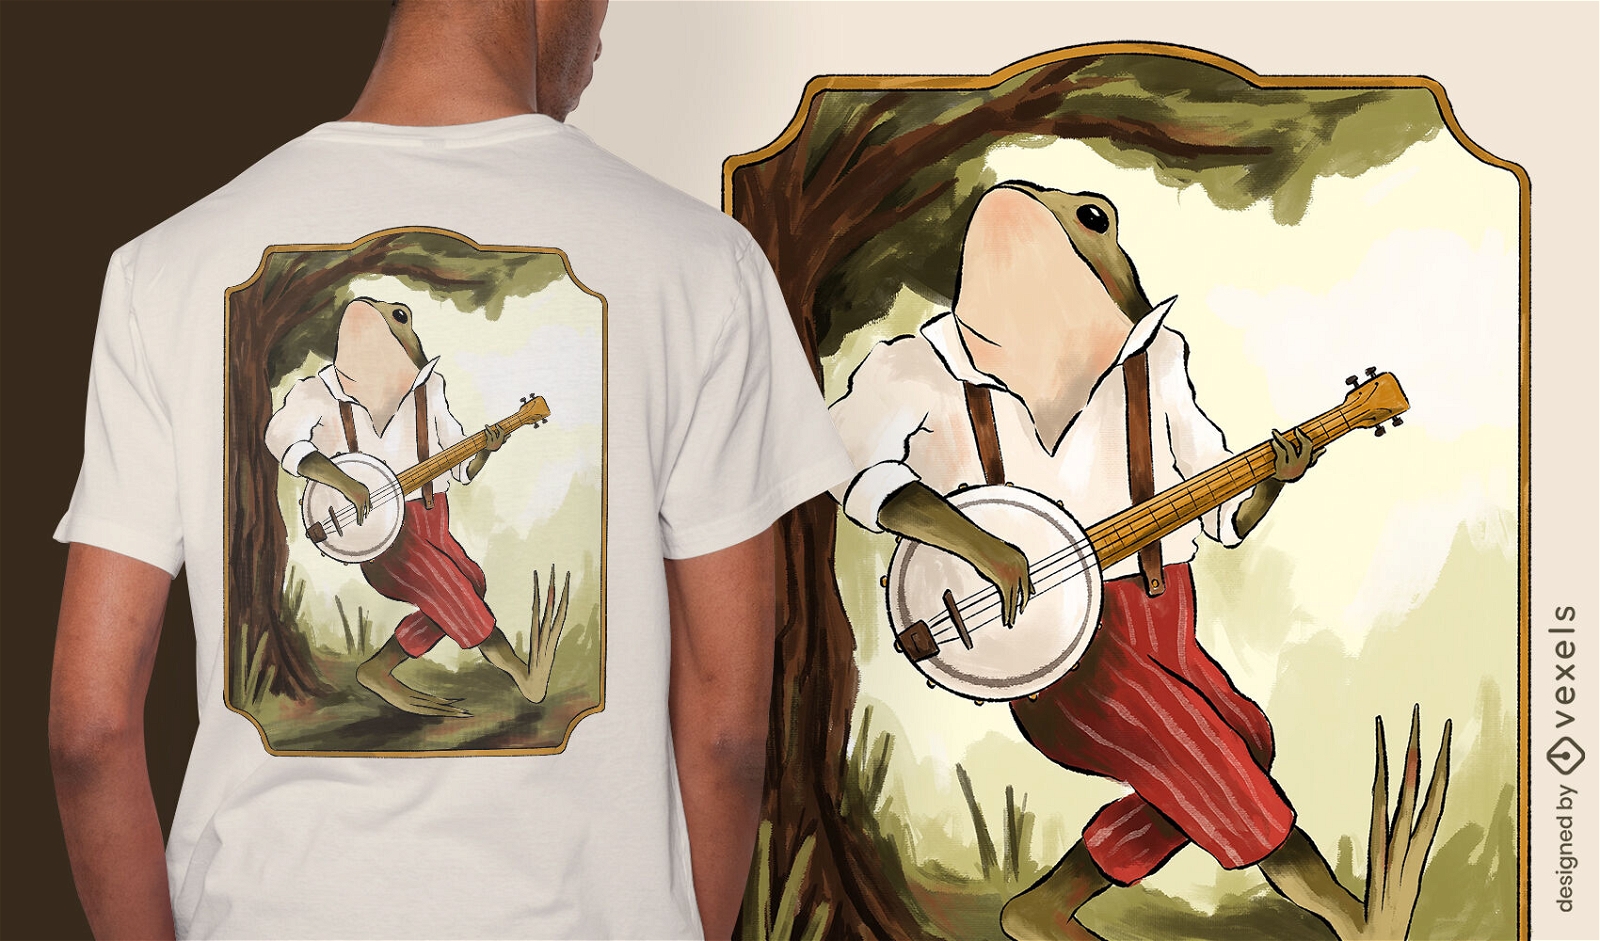
Banjo frog t-shirt design
Choose a folder
All favorites
Create new
Save
Banjo frog t-shirt design
Print ready
for Merch
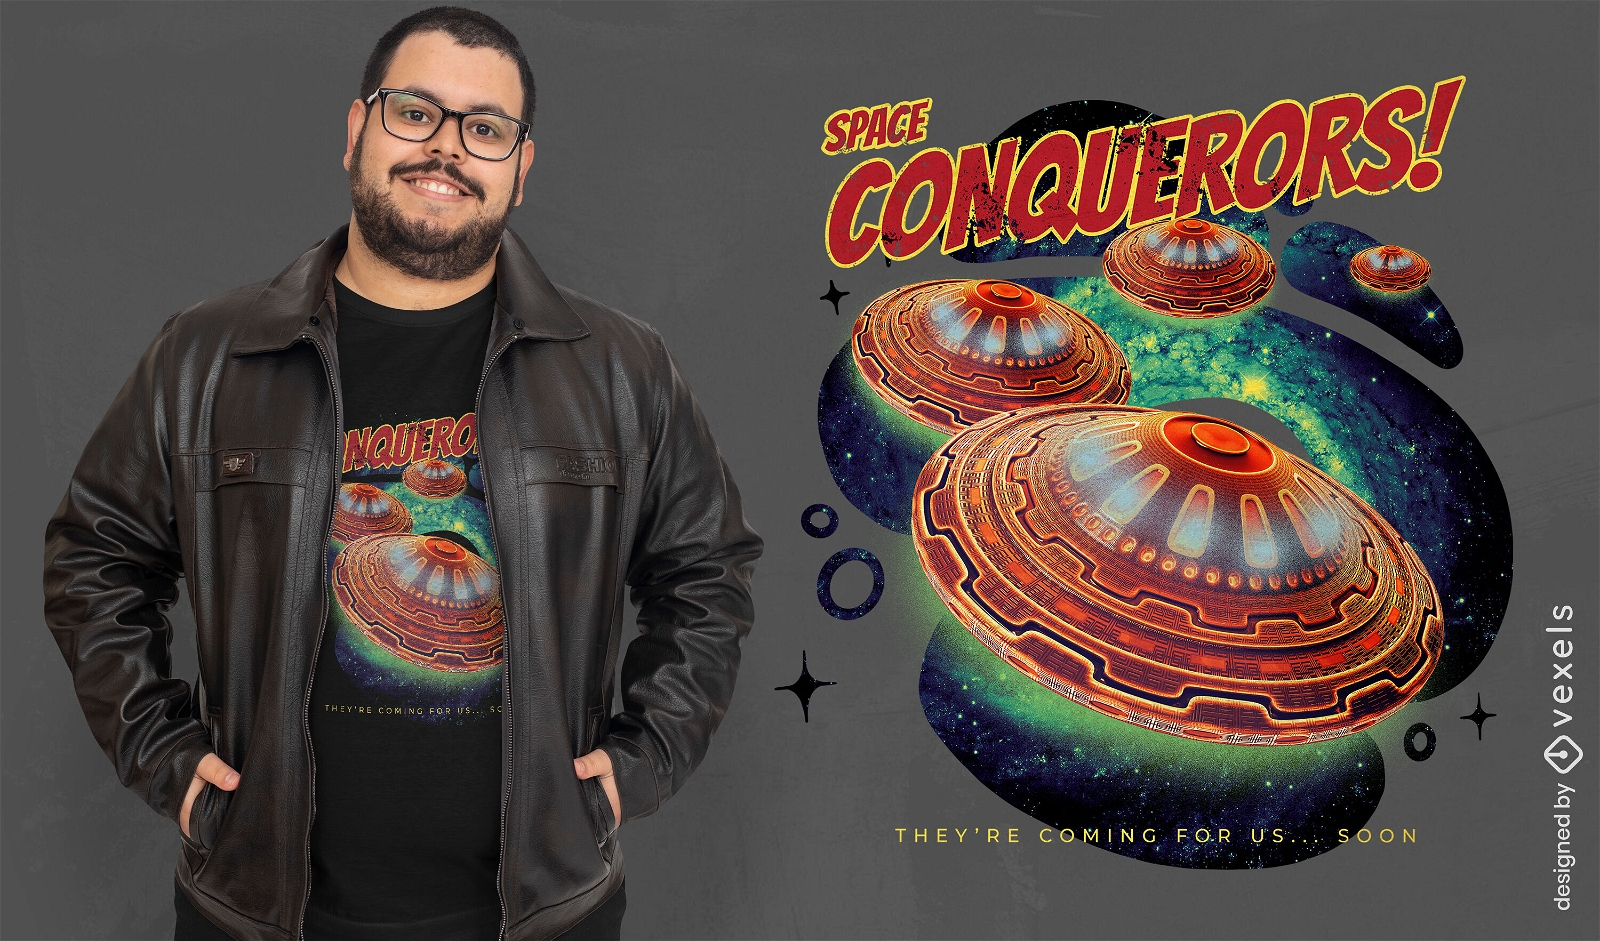
UFO space conquerors t-shirt design
Choose a folder
All favorites
Create new
Save
UFO space conquerors t-shirt design
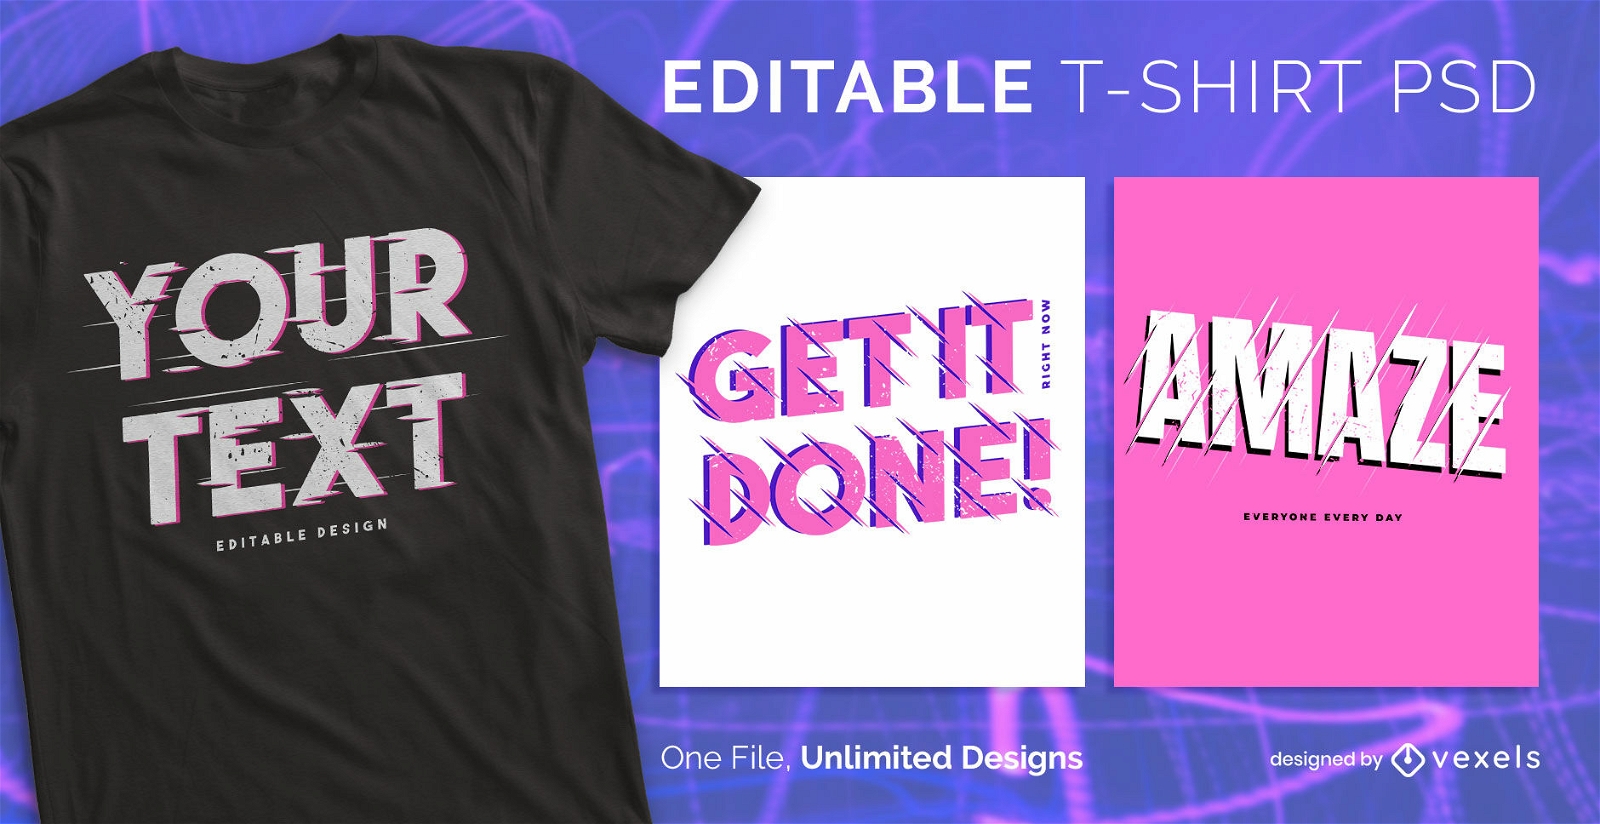
Scalable PSD T-Shirt
for Merch
Dynamic text psd editable t-shirt design
Choose a folder
All favorites
Create new
Save
Dynamic text psd editable t-shirt design
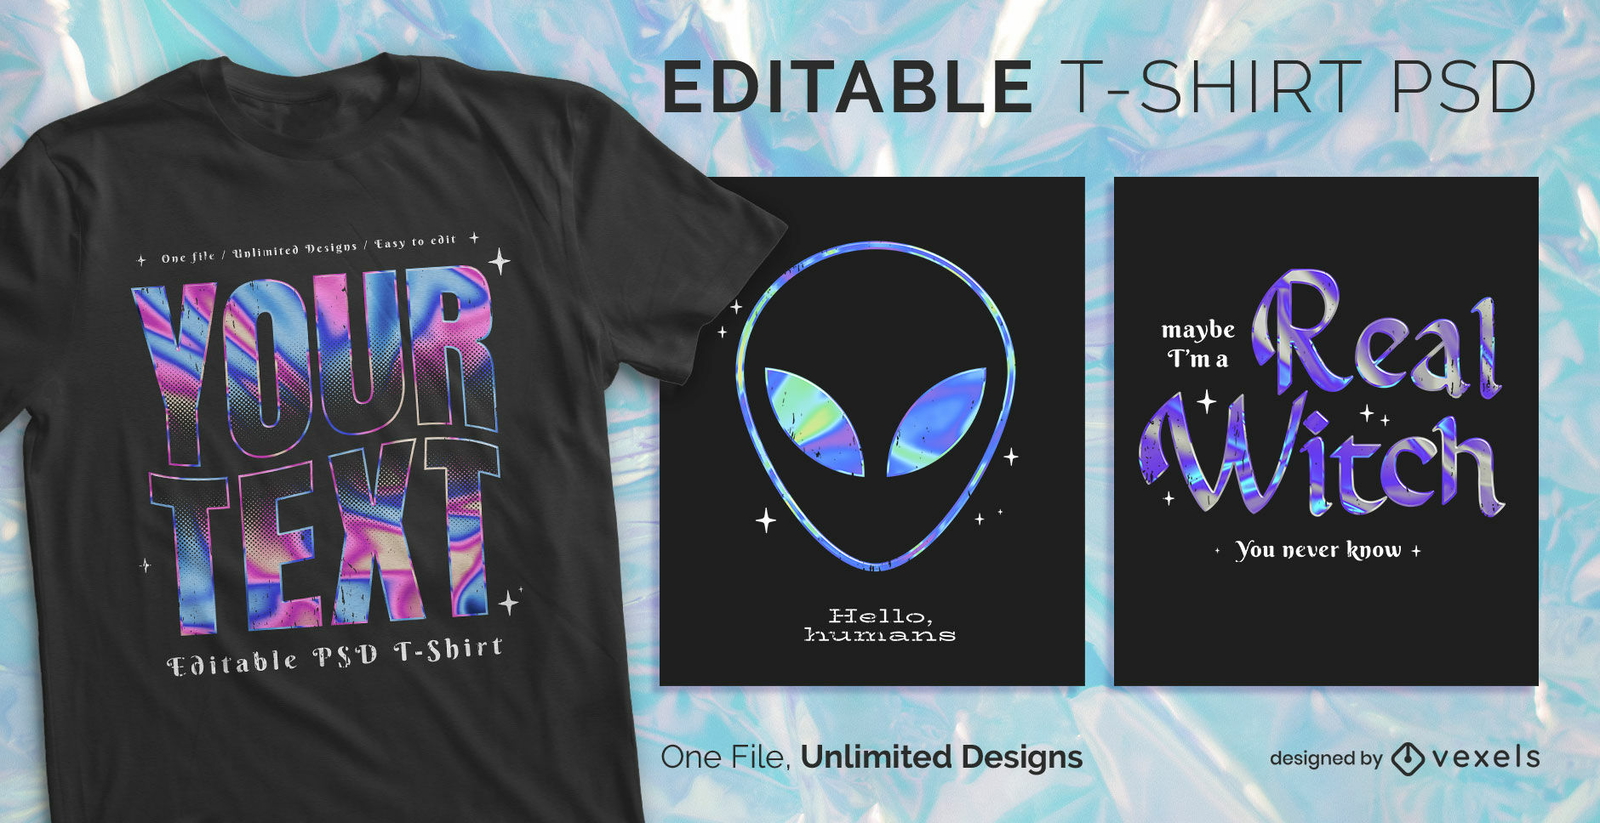
Scalable PSD T-Shirt
for Merch
Holographic text scalable psd t-shirt design
Choose a folder
All favorites
Create new
Save
Holographic text scalable psd t-shirt design
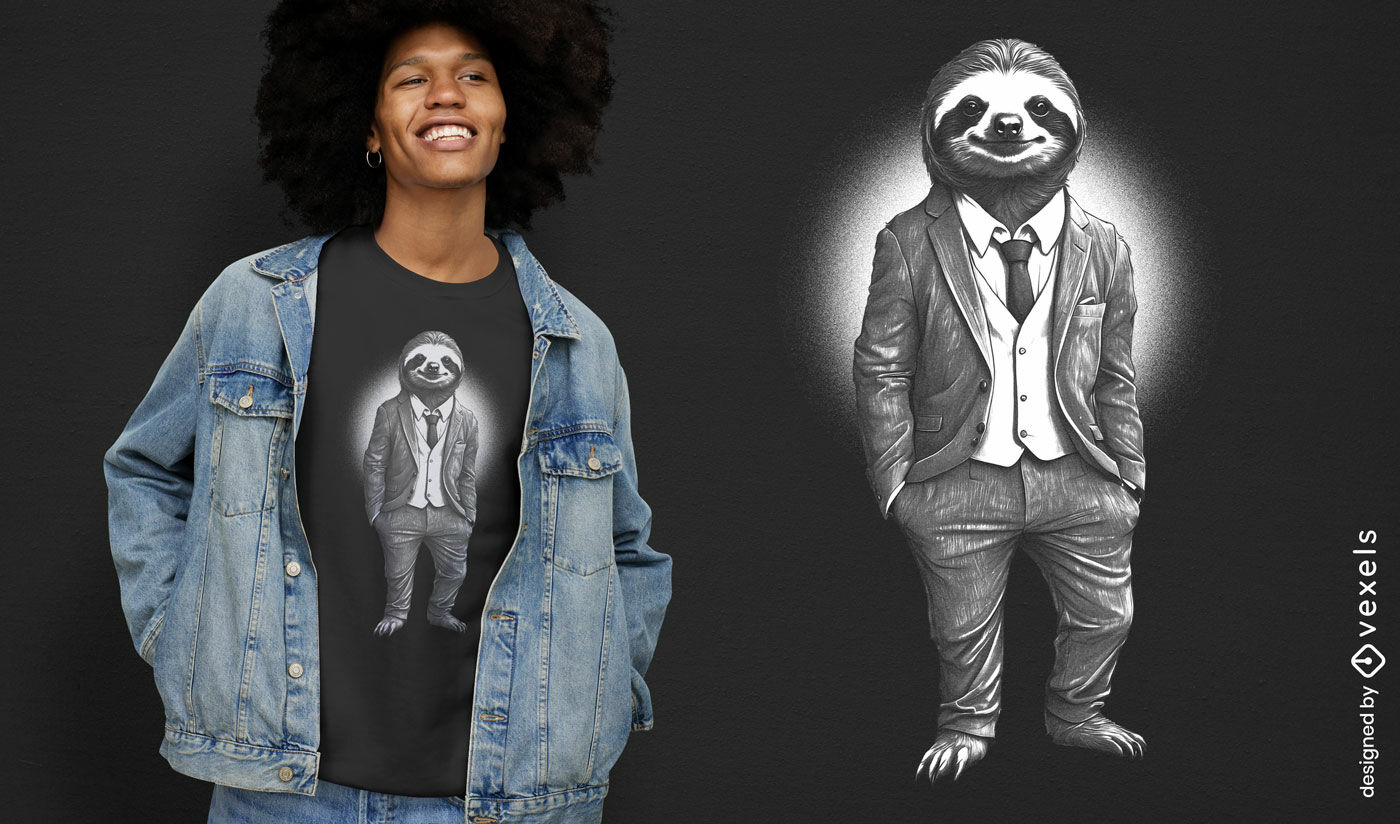
Print ready
for Merch
Sophisticated sloth suit t-shirt design
Choose a folder
All favorites
Create new
Save
Sophisticated sloth suit t-shirt design
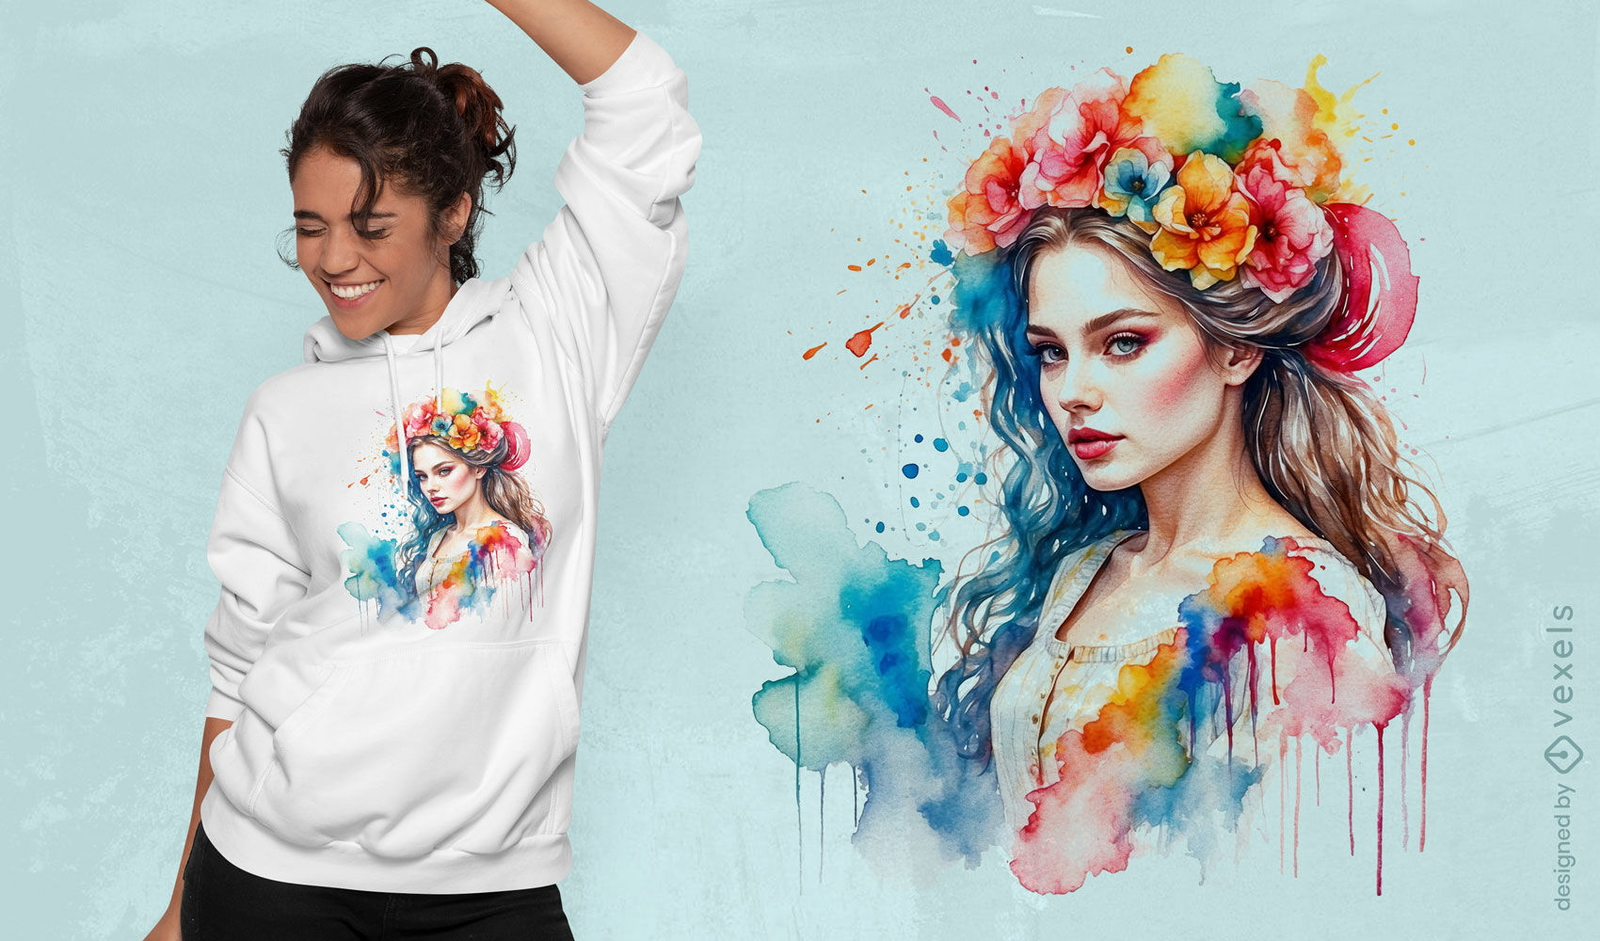
Print ready
for Merch
Watercolor woman's portrait t-shirt design
Choose a folder
All favorites
Create new
Save
Watercolor woman's portrait t-shirt design
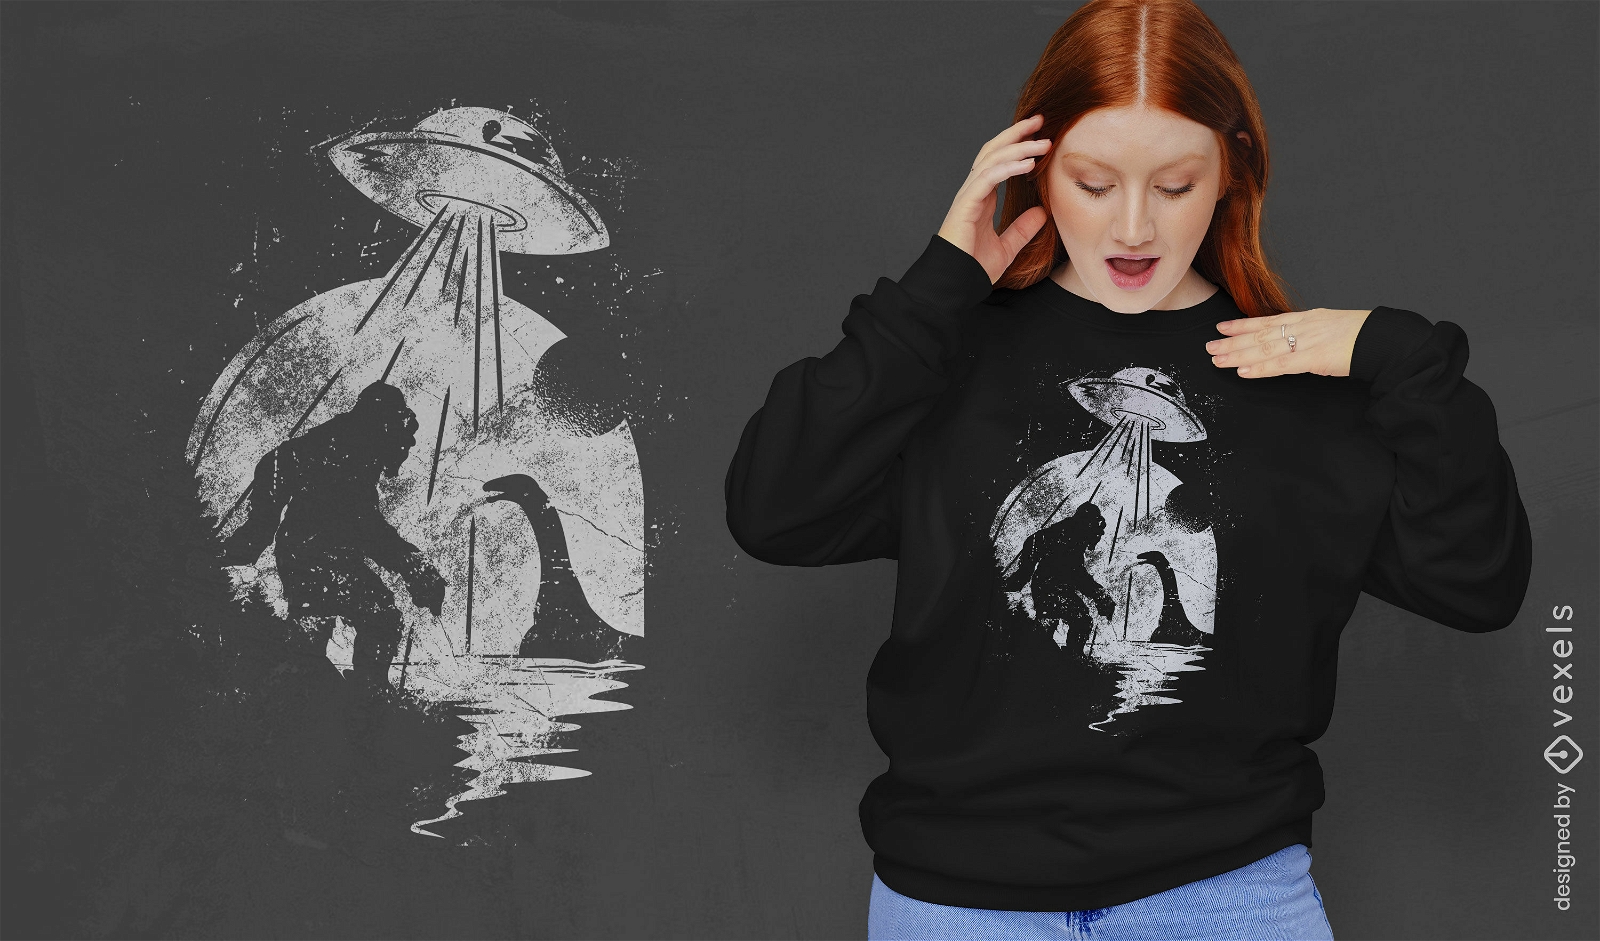
Print ready
for Merch
Folklore creatures and UFO t-shirt design
Choose a folder
All favorites
Create new
Save
Folklore creatures and UFO t-shirt design
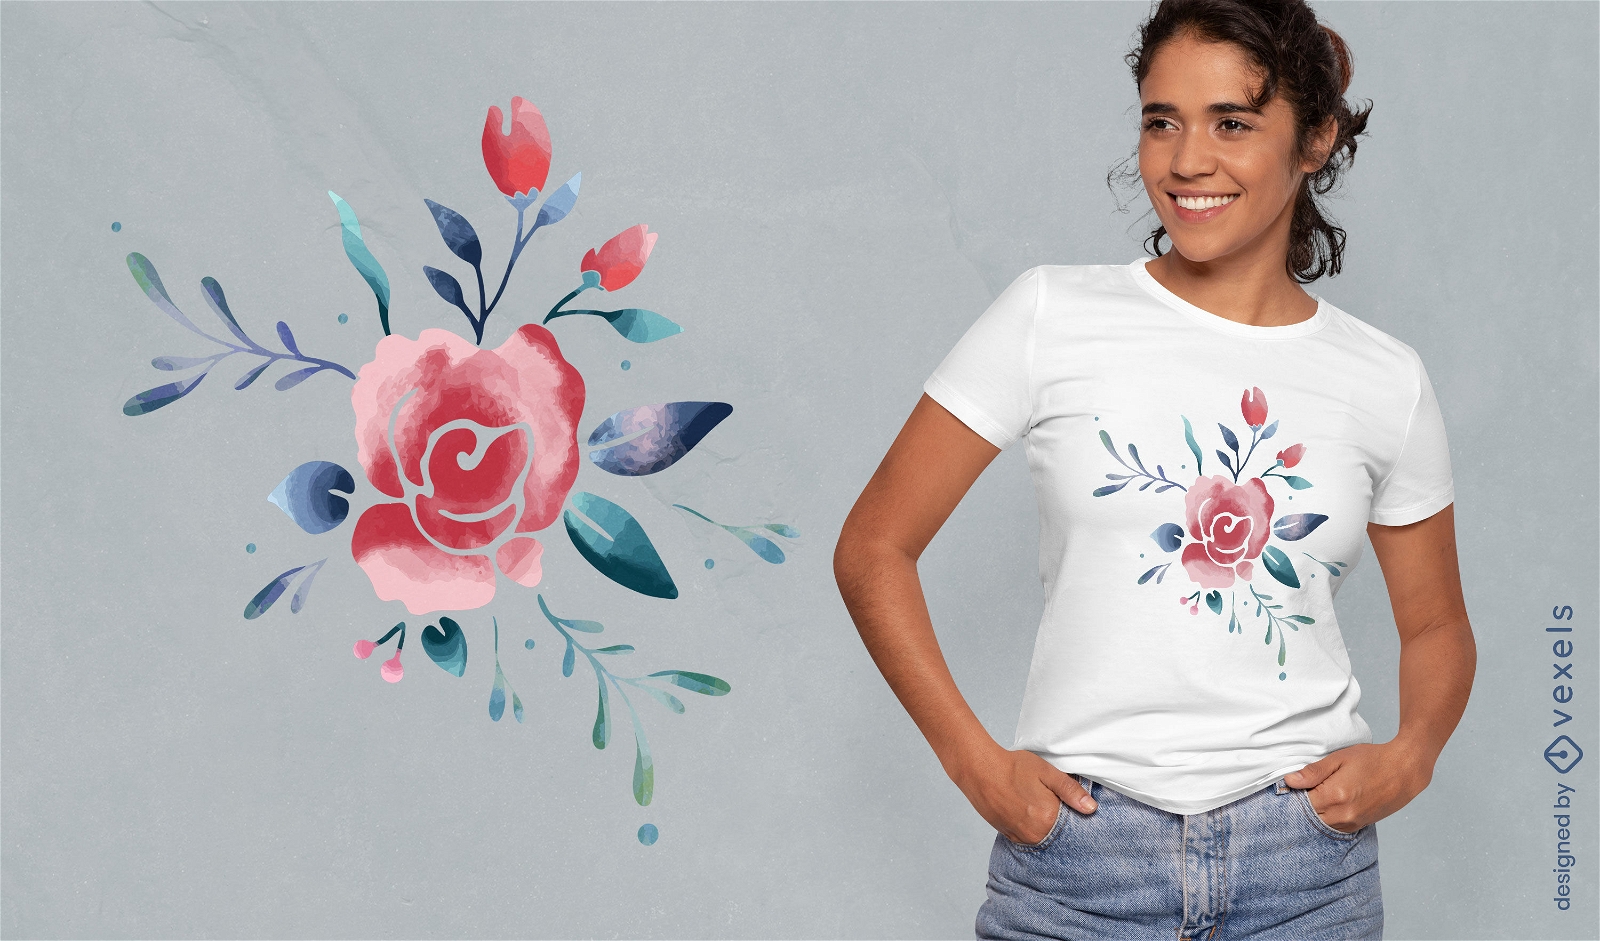
Print ready
for Merch
Watercolor delicate rose t-shirt design
Choose a folder
All favorites
Create new
Save
Watercolor delicate rose t-shirt design
Print ready
for Merch
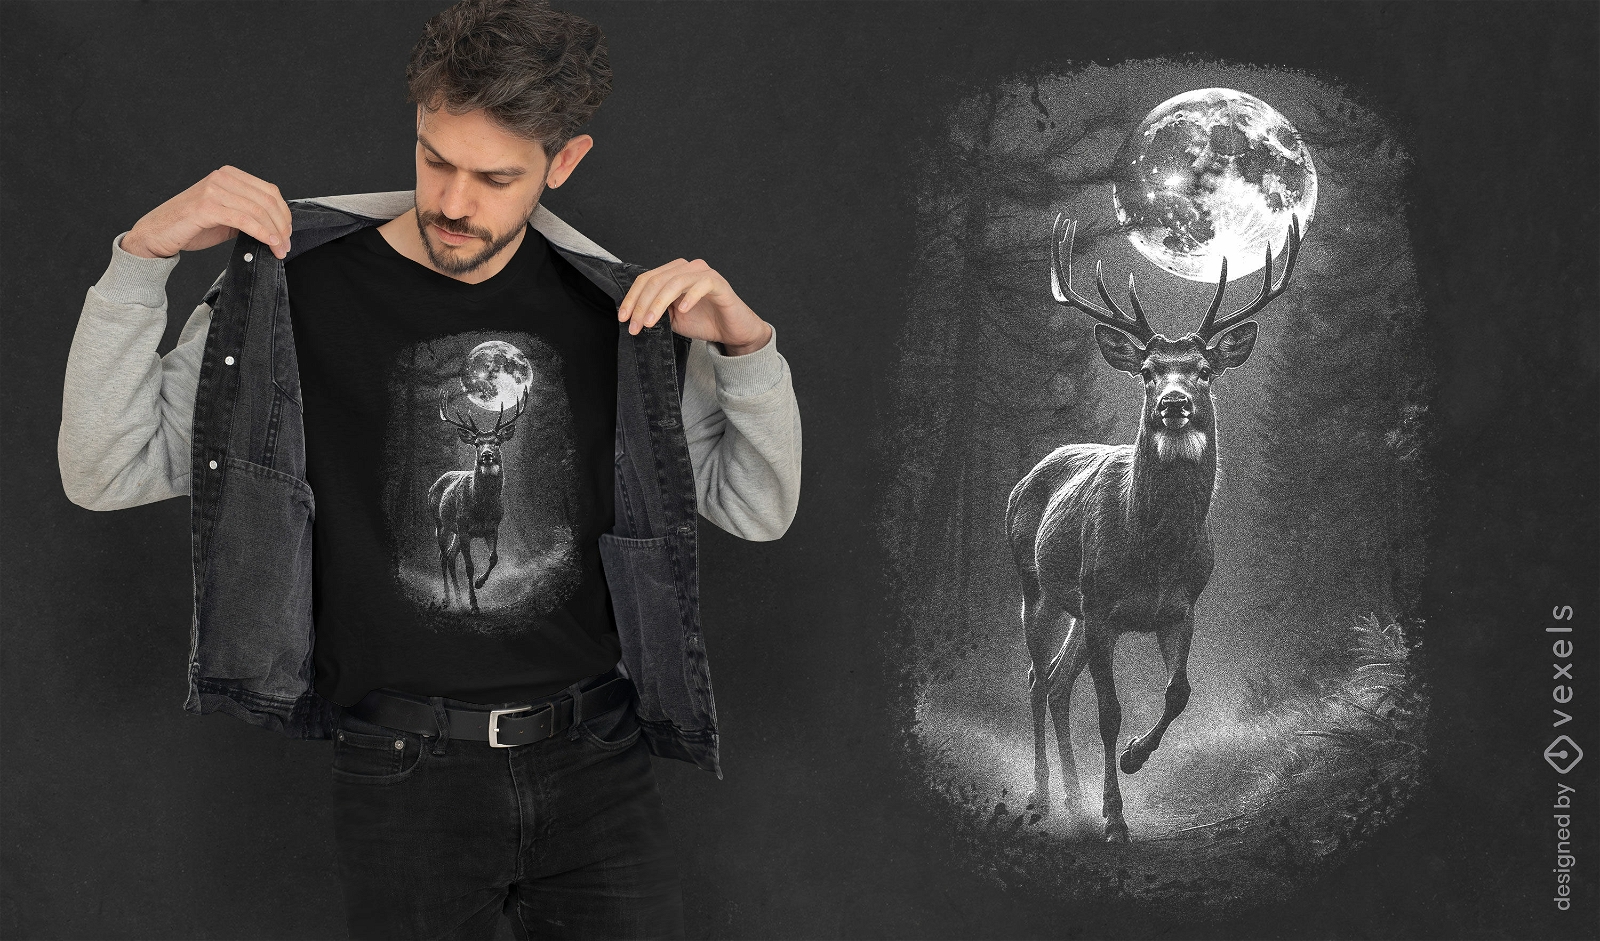
Deer in moonlight t-shirt design
Choose a folder
All favorites
Create new
Save
Deer in moonlight t-shirt design
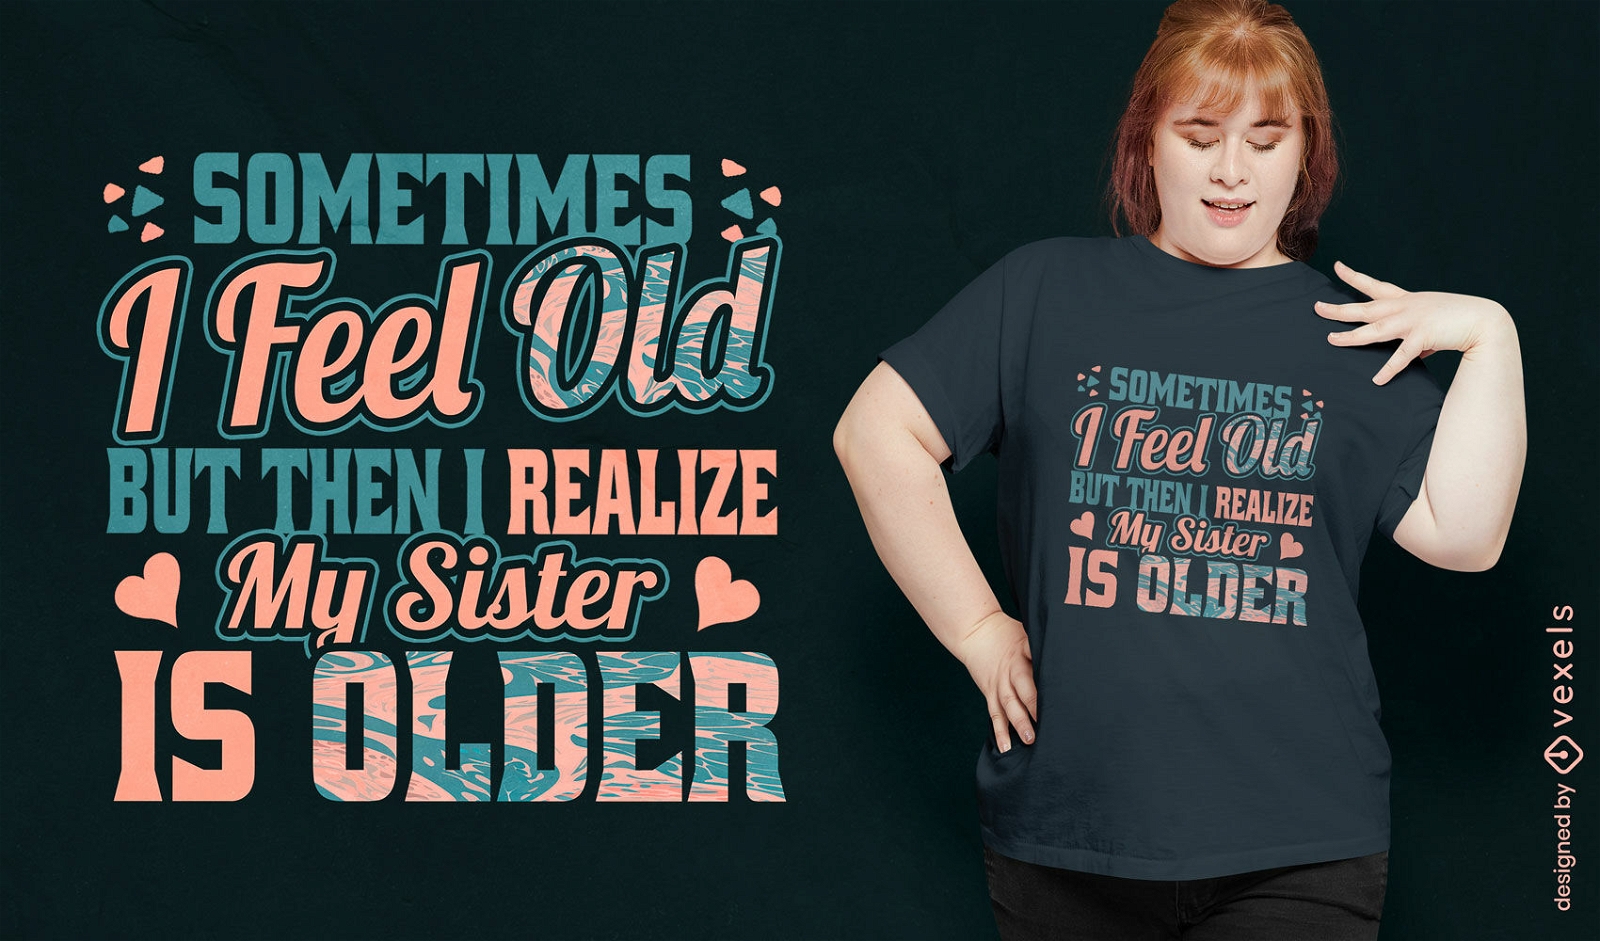
Editable text
Print ready
for Merch
Humorous sibling quote t-shirt design
Choose a folder
All favorites
Create new
Save
Humorous sibling quote t-shirt design
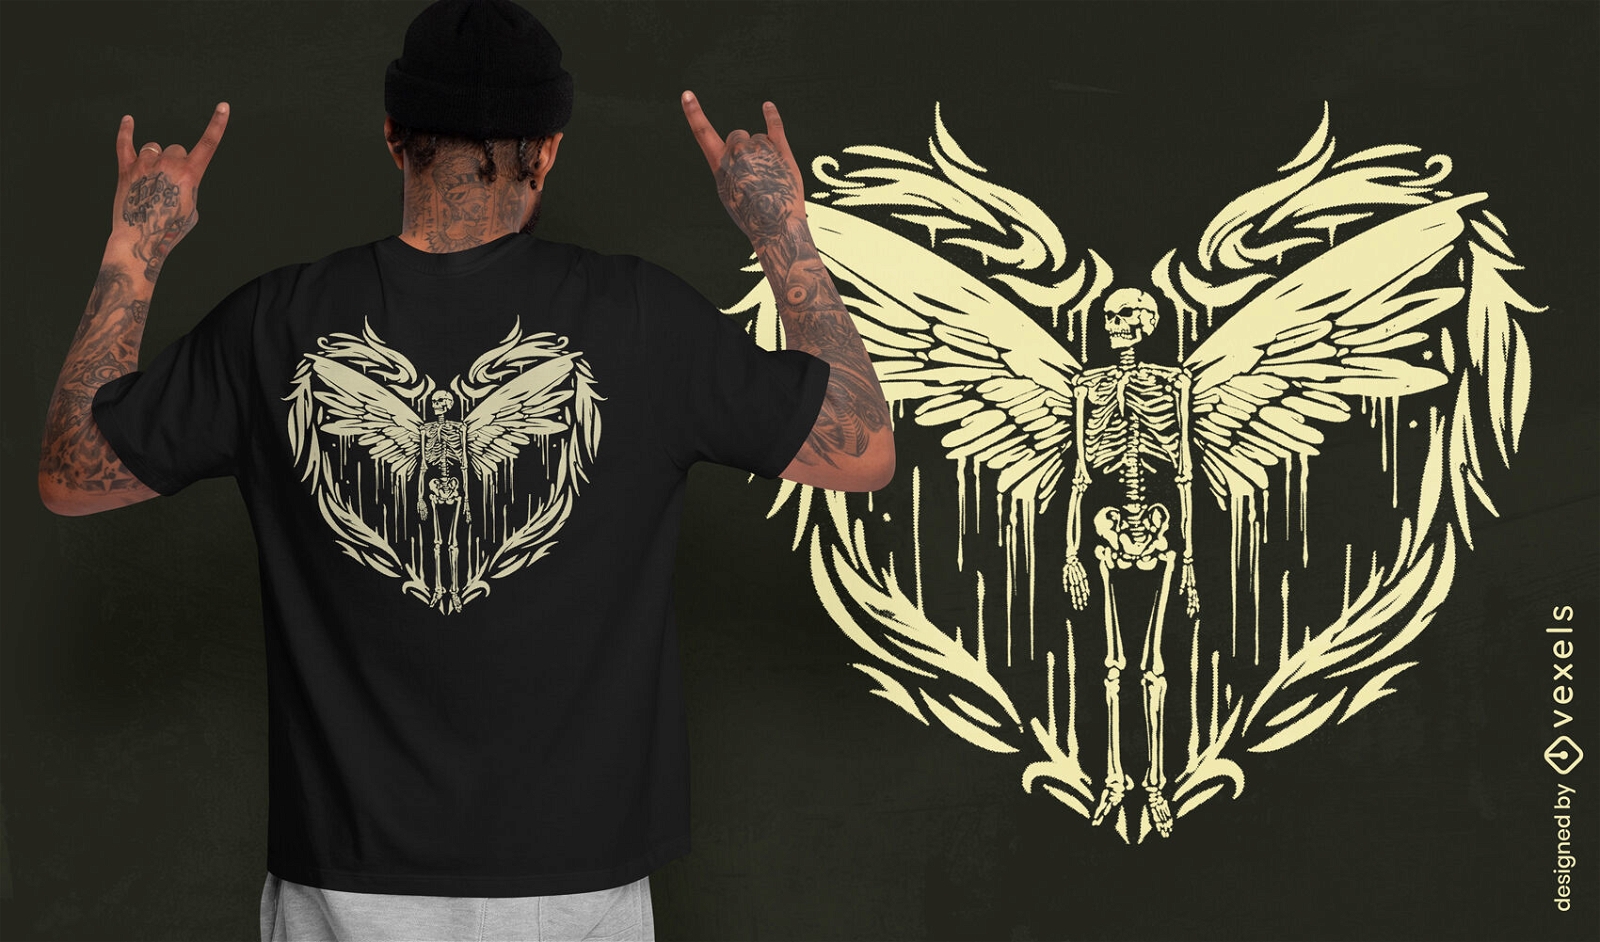
Print ready
for Merch
Skeleton wings t-shirt design
Choose a folder
All favorites
Create new
Save
Skeleton wings t-shirt design
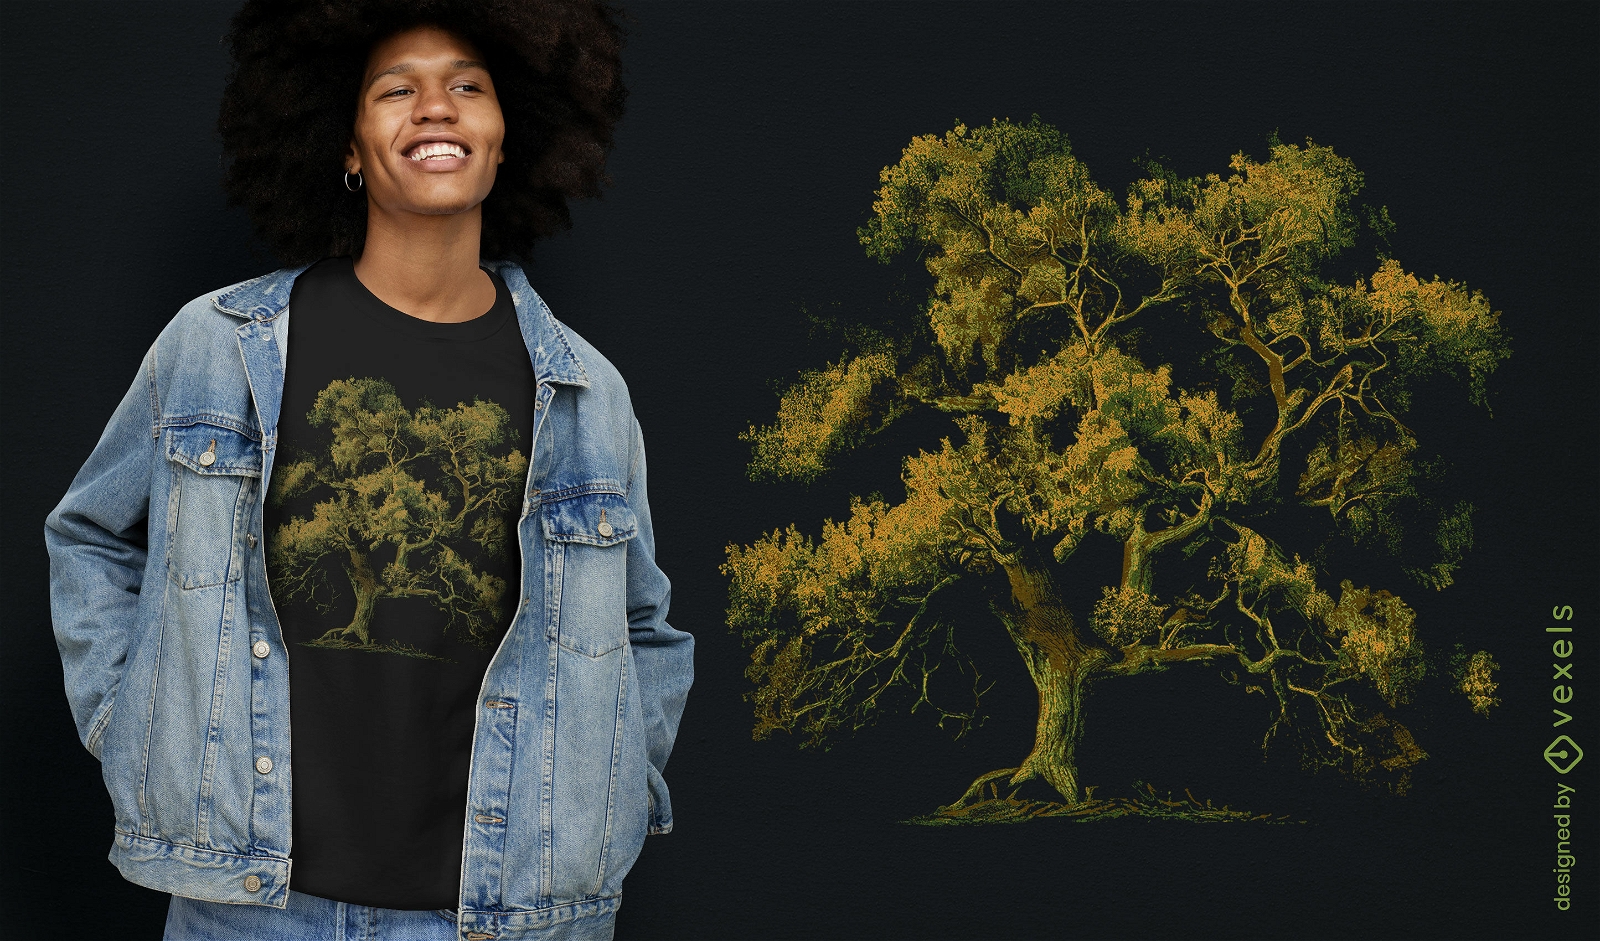
Print ready
for Merch
Majestic oak tree t-shirt design
Choose a folder
All favorites
Create new
Save
Majestic oak tree t-shirt design
Print ready
for Merch
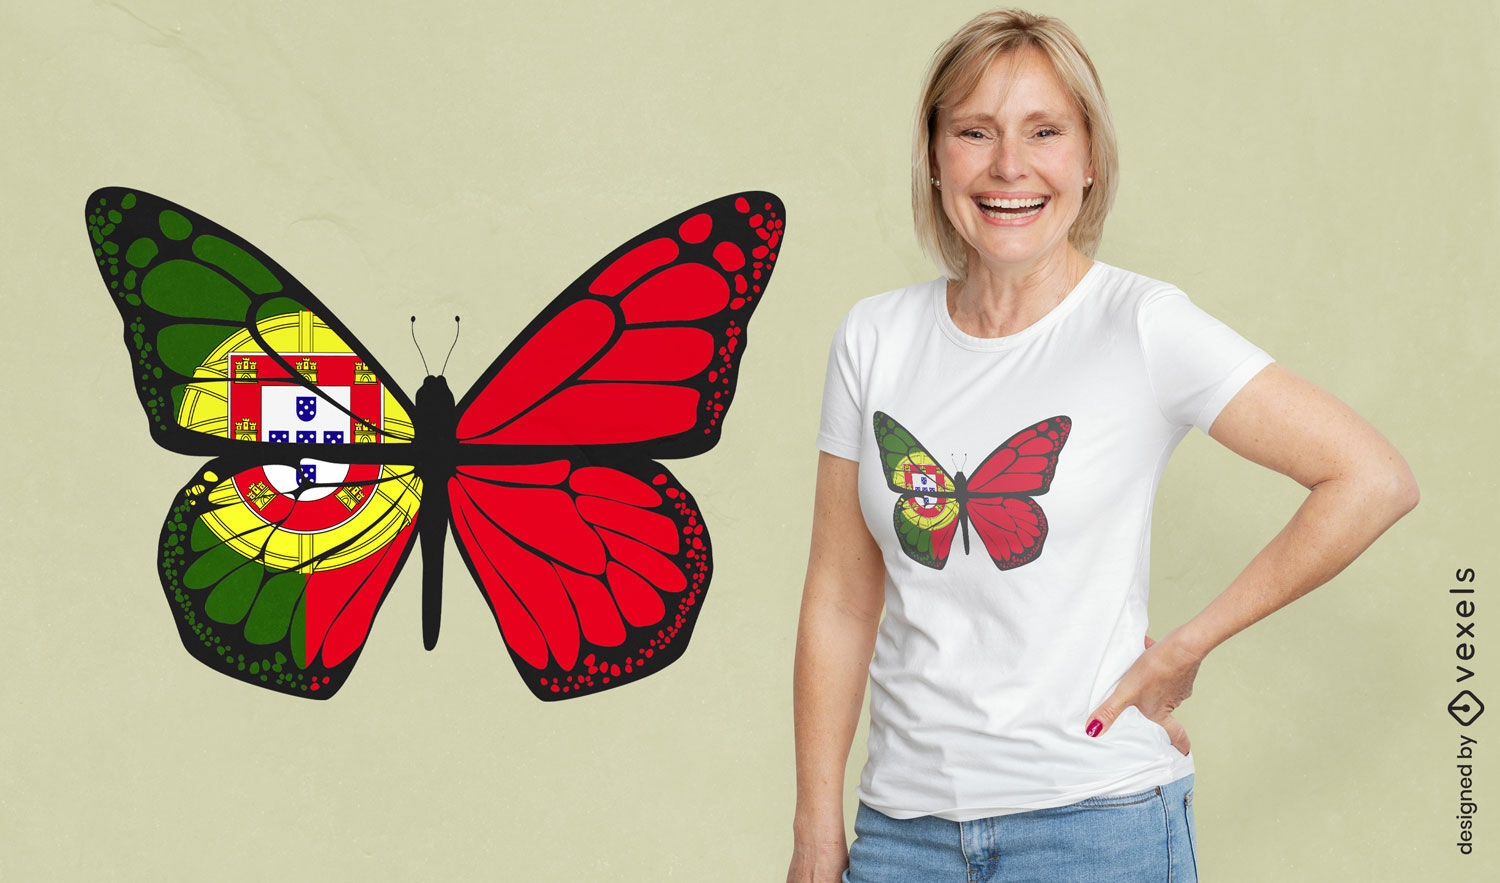
Portugal butterfly t-shirt design
Choose a folder
All favorites
Create new
Save
Portugal butterfly t-shirt design
Print ready
for Merch
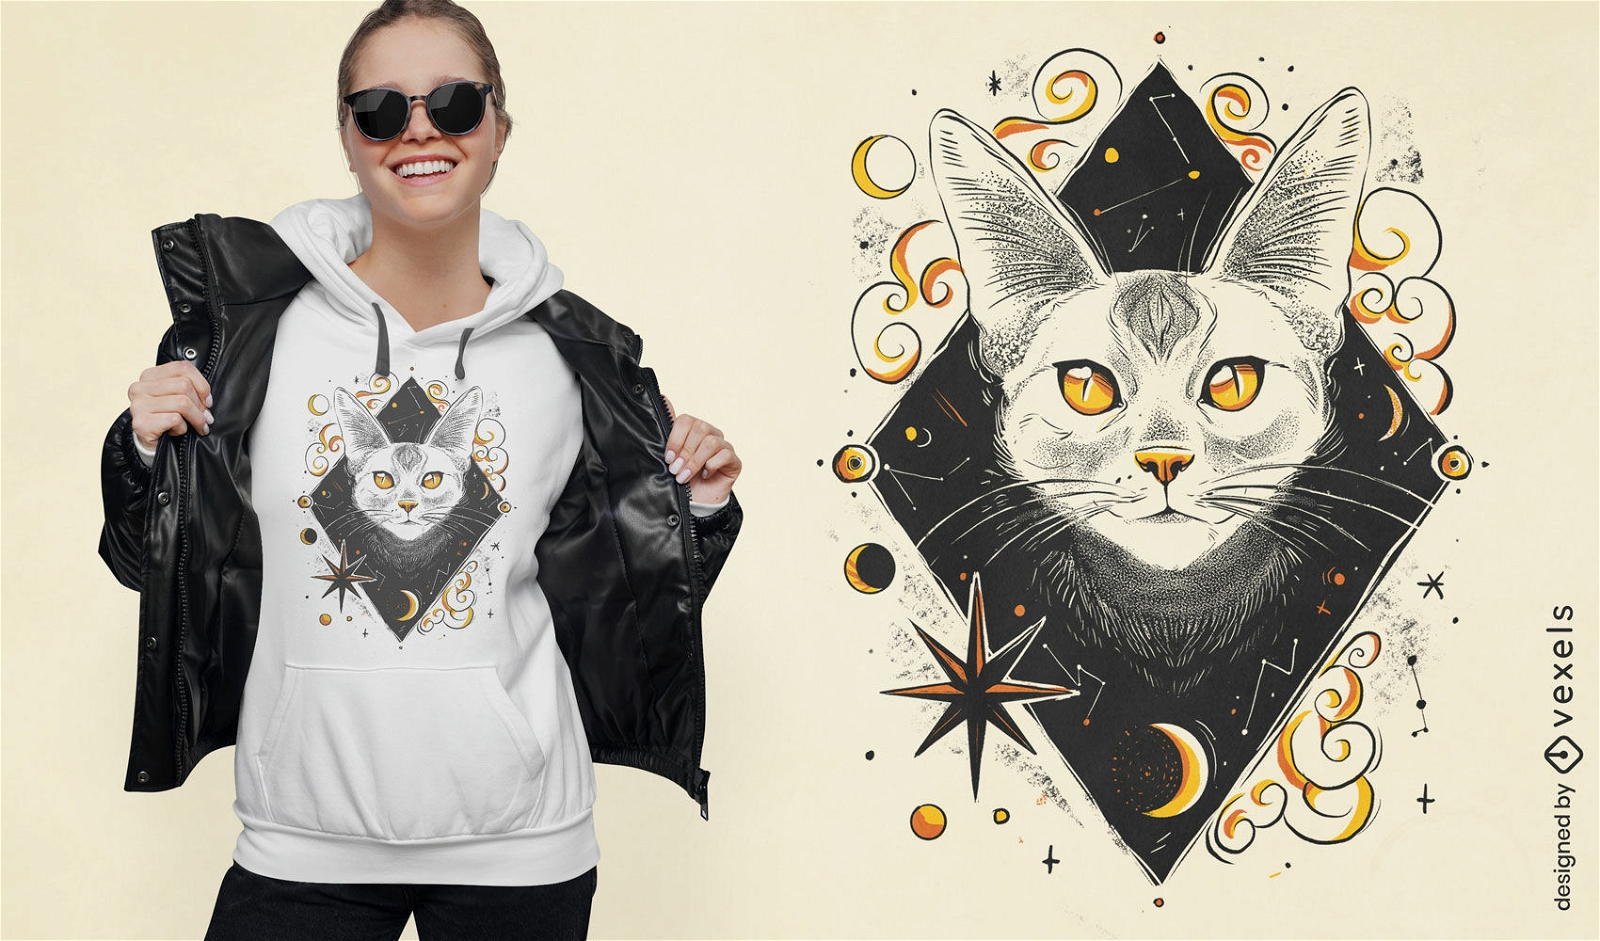
Cosmic night white cat t-shirt design
Choose a folder
All favorites
Create new
Save
Cosmic night white cat t-shirt design
Editable text
Print ready
for Merch
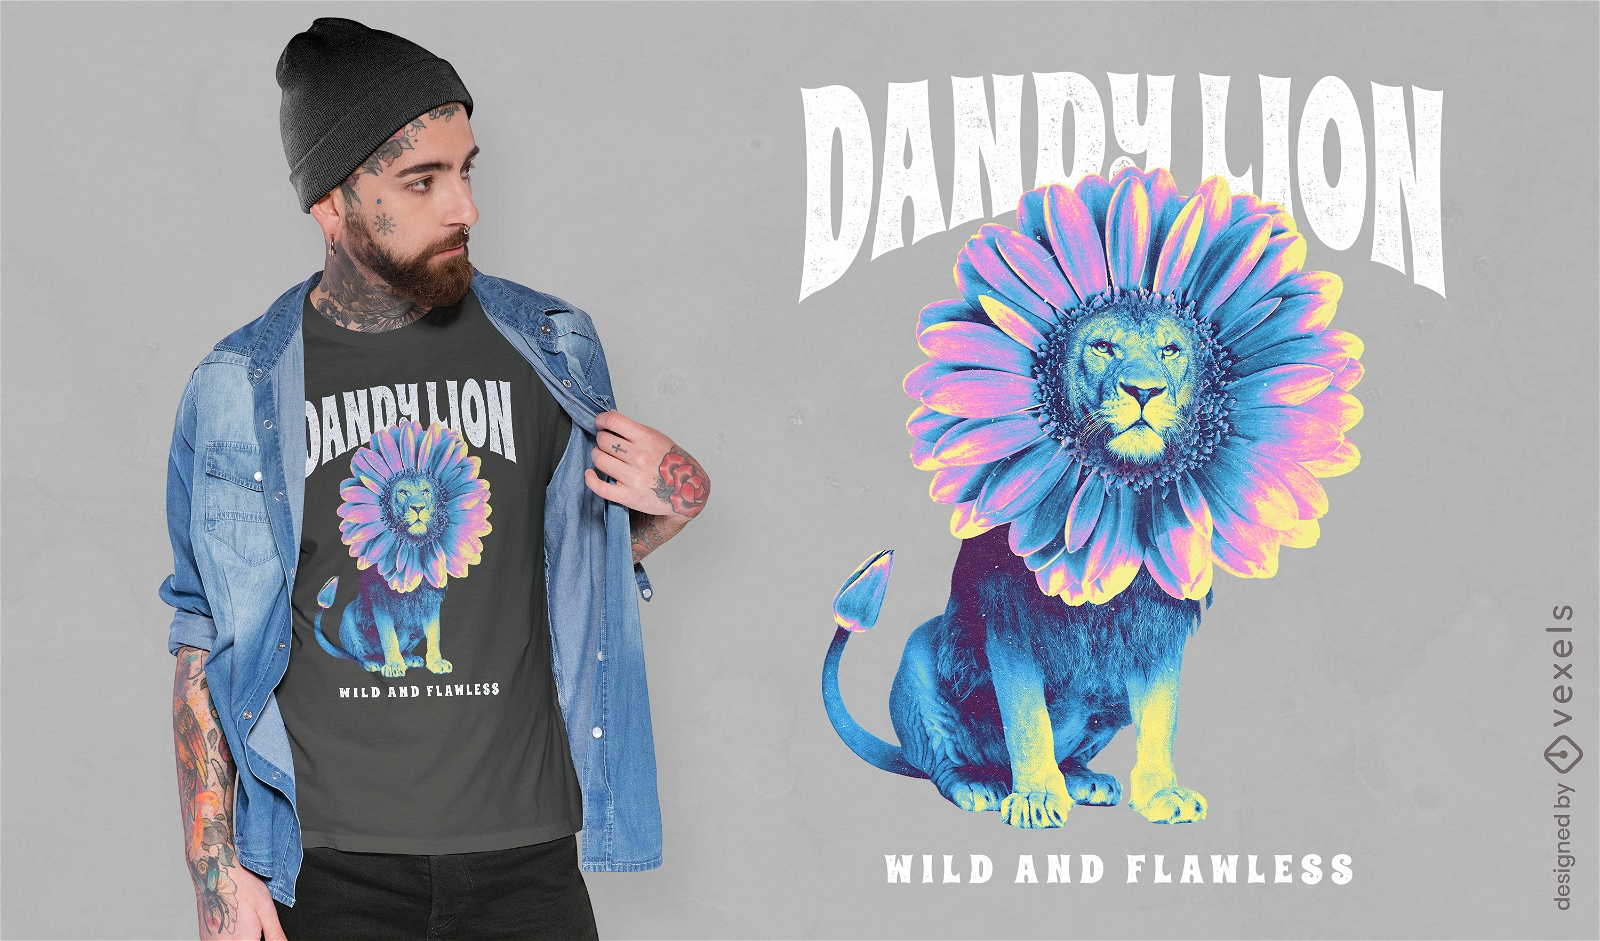
Lion animal with sunflower head t-shirt psd
Choose a folder
All favorites
Create new
Save
Lion animal with sunflower head t-shirt psd
Print ready
for Merch
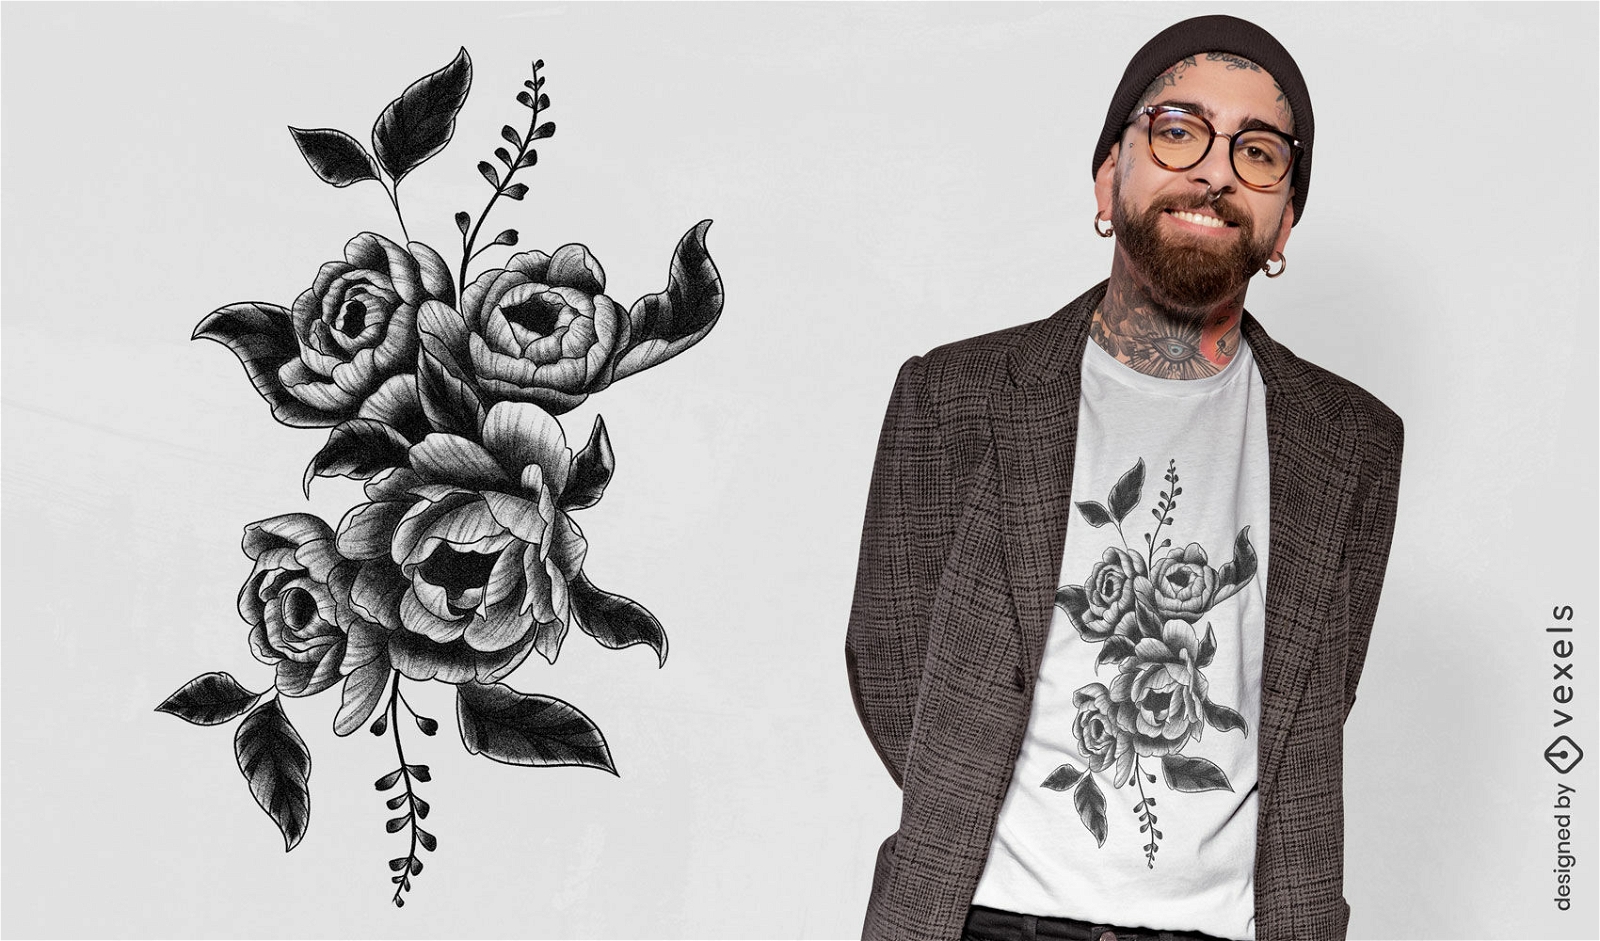
Peony flower and leaves tattoo t-shirt design
Choose a folder
All favorites
Create new
Save
Peony flower and leaves tattoo t-shirt design
Print ready
for Merch
Puppy with a pearl t-shirt design
Choose a folder
All favorites
Create new
Save
Puppy with a pearl t-shirt design
Print ready
for Merch
Mushroom book t-shirt design
Choose a folder
All favorites
Create new
Save
Mushroom book t-shirt design
Print ready
for Merch
Eyeballs and flowers psd t-shirt design
Choose a folder
All favorites
Create new
Save
Eyeballs and flowers psd t-shirt design
Print ready
for Merch
Dead inside statue psd t-shirt design
Choose a folder
All favorites
Create new
Save
Dead inside statue psd t-shirt design
Print ready
for Merch
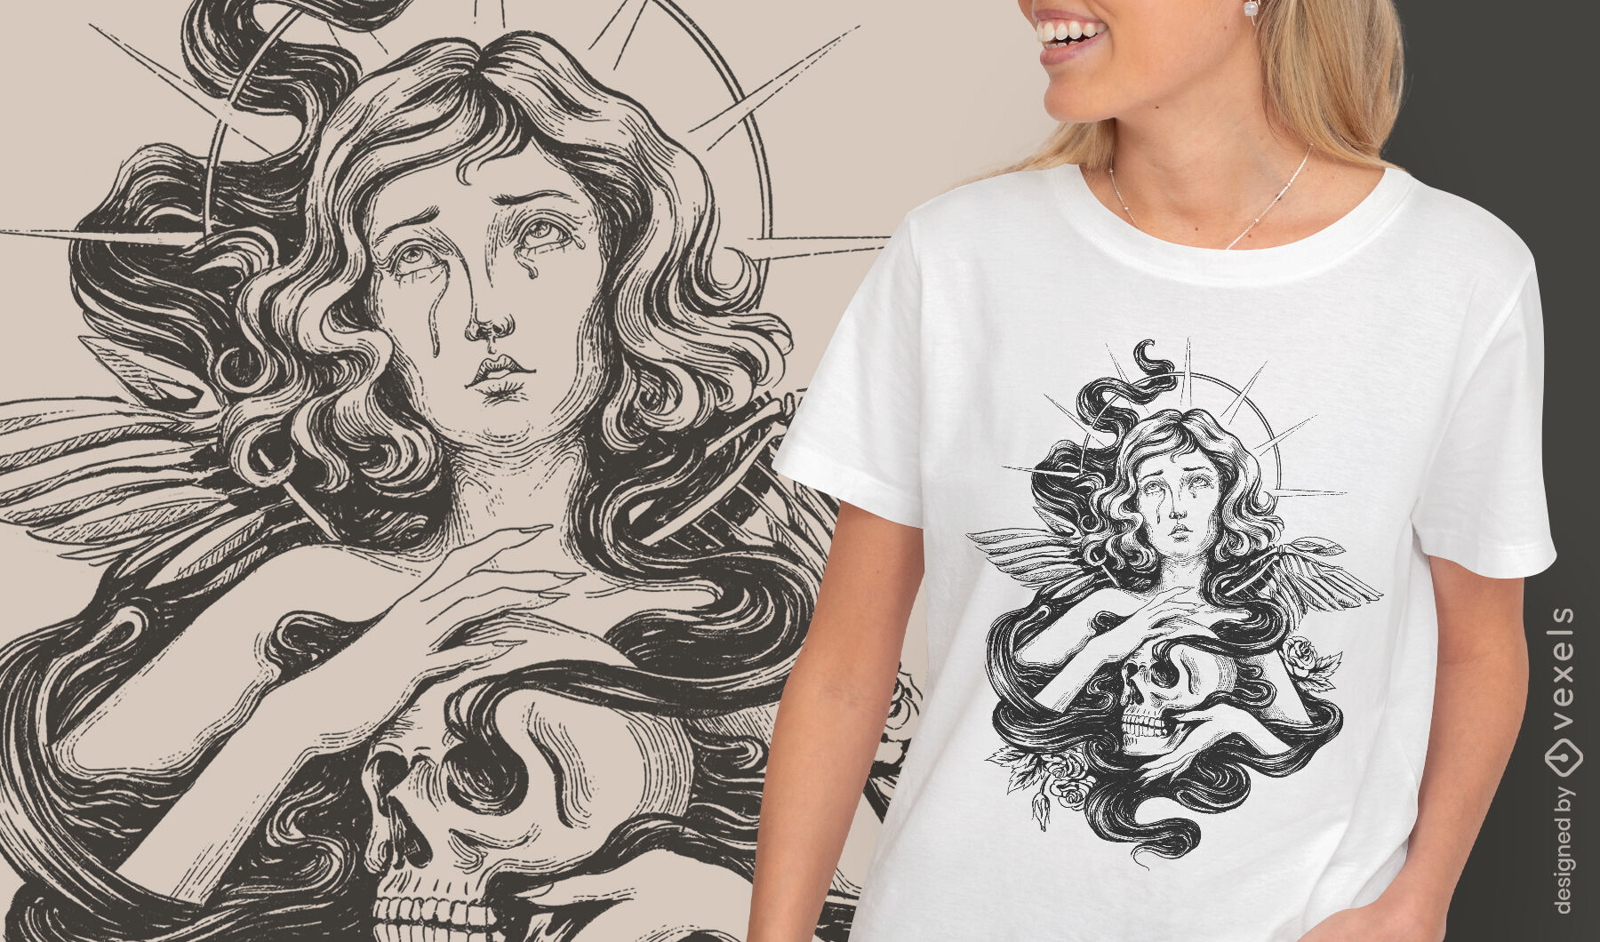
Female angel with skull hand drawn t-shirt psd
Choose a folder
All favorites
Create new
Save
Female angel with skull hand drawn t-shirt psd
PSD T-Shirts
for Merch
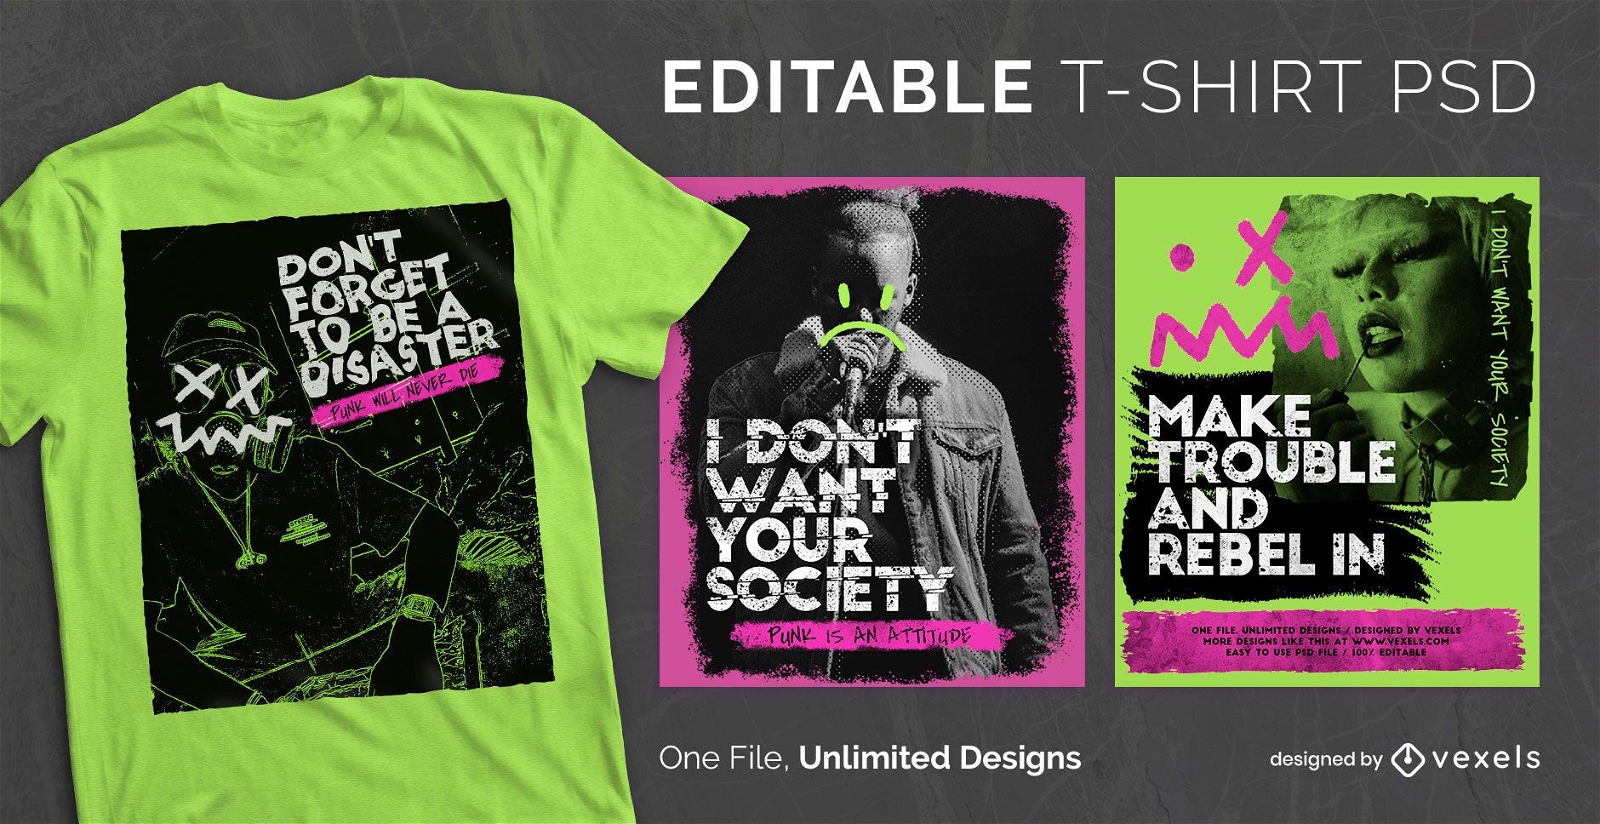
Punk rock style scalable t-shirt psd
Choose a folder
All favorites
Create new
Save
Punk rock style scalable t-shirt psd
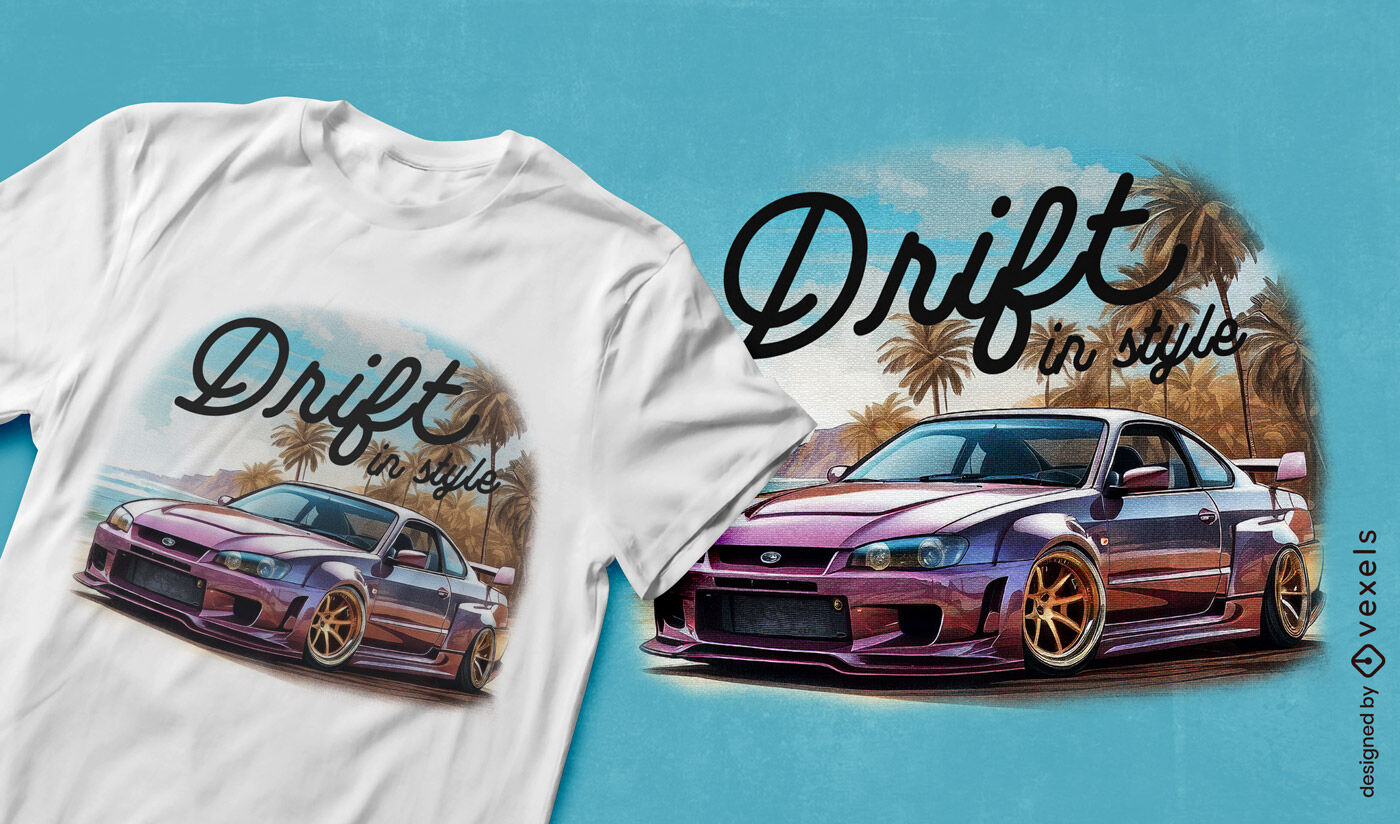
Editable text
Print ready
for Merch
Drift car slogan t-shirt design
Choose a folder
All favorites
Create new
Save
Drift car slogan t-shirt design
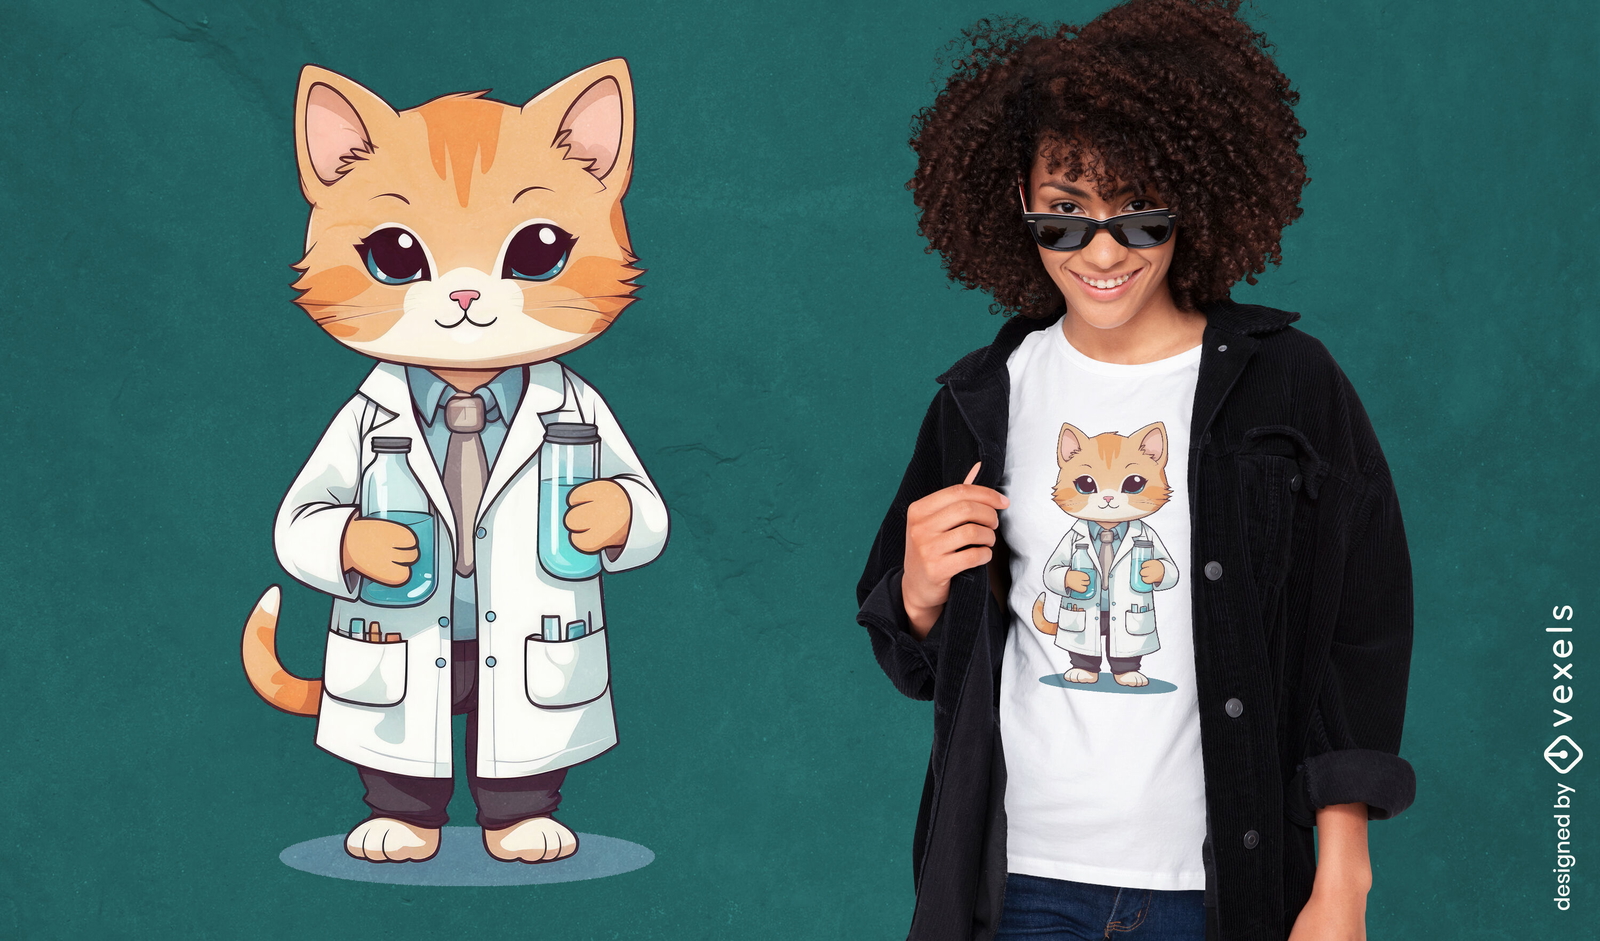
Editable text
Print ready
for Merch
Scientist cat cartoon t-shirt design
Choose a folder
All favorites
Create new
Save
Scientist cat cartoon t-shirt design
Print ready
for Merch
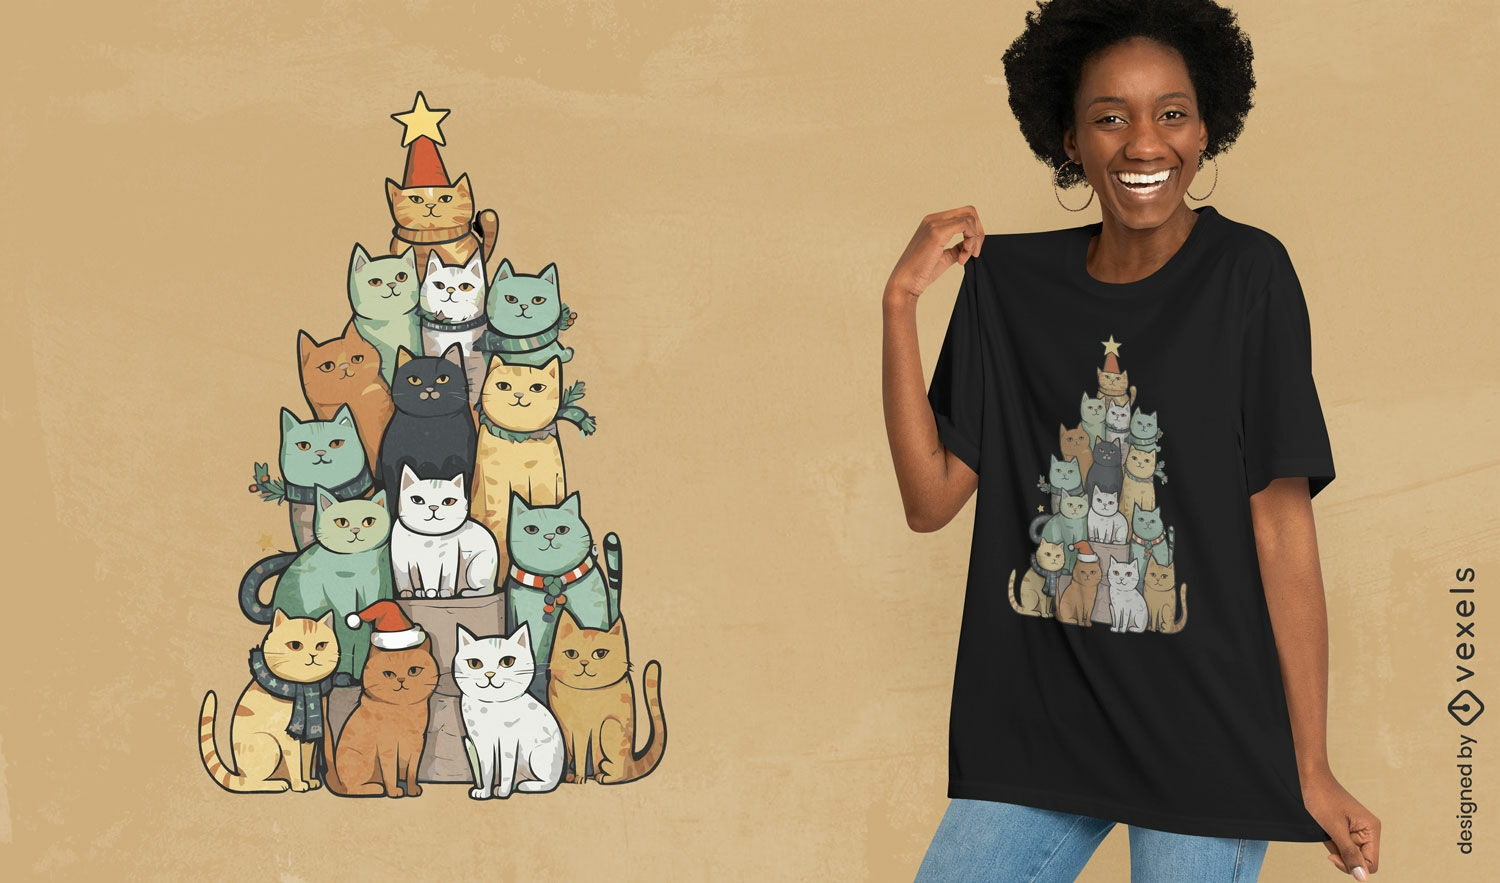
Cute cat Christmas tree t-shirt design
Choose a folder
All favorites
Create new
Save
Cute cat Christmas tree t-shirt design
Print ready
for Merch
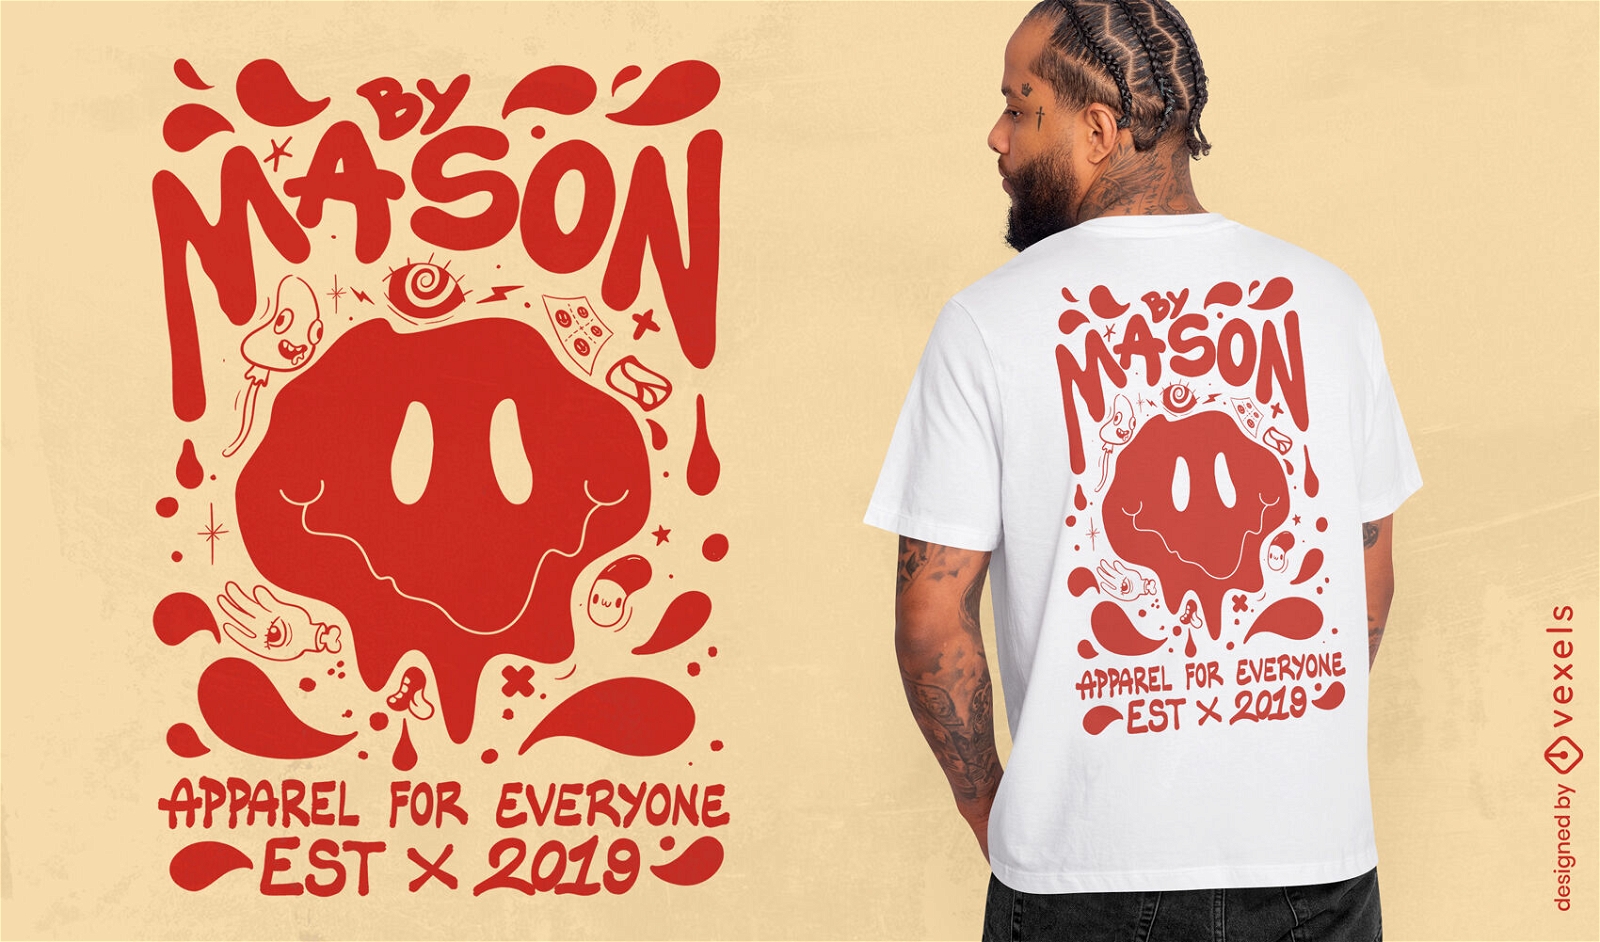
Trippy smiley face t-shirt design
Choose a folder
All favorites
Create new
Save
Trippy smiley face t-shirt design
Print ready
for Merch
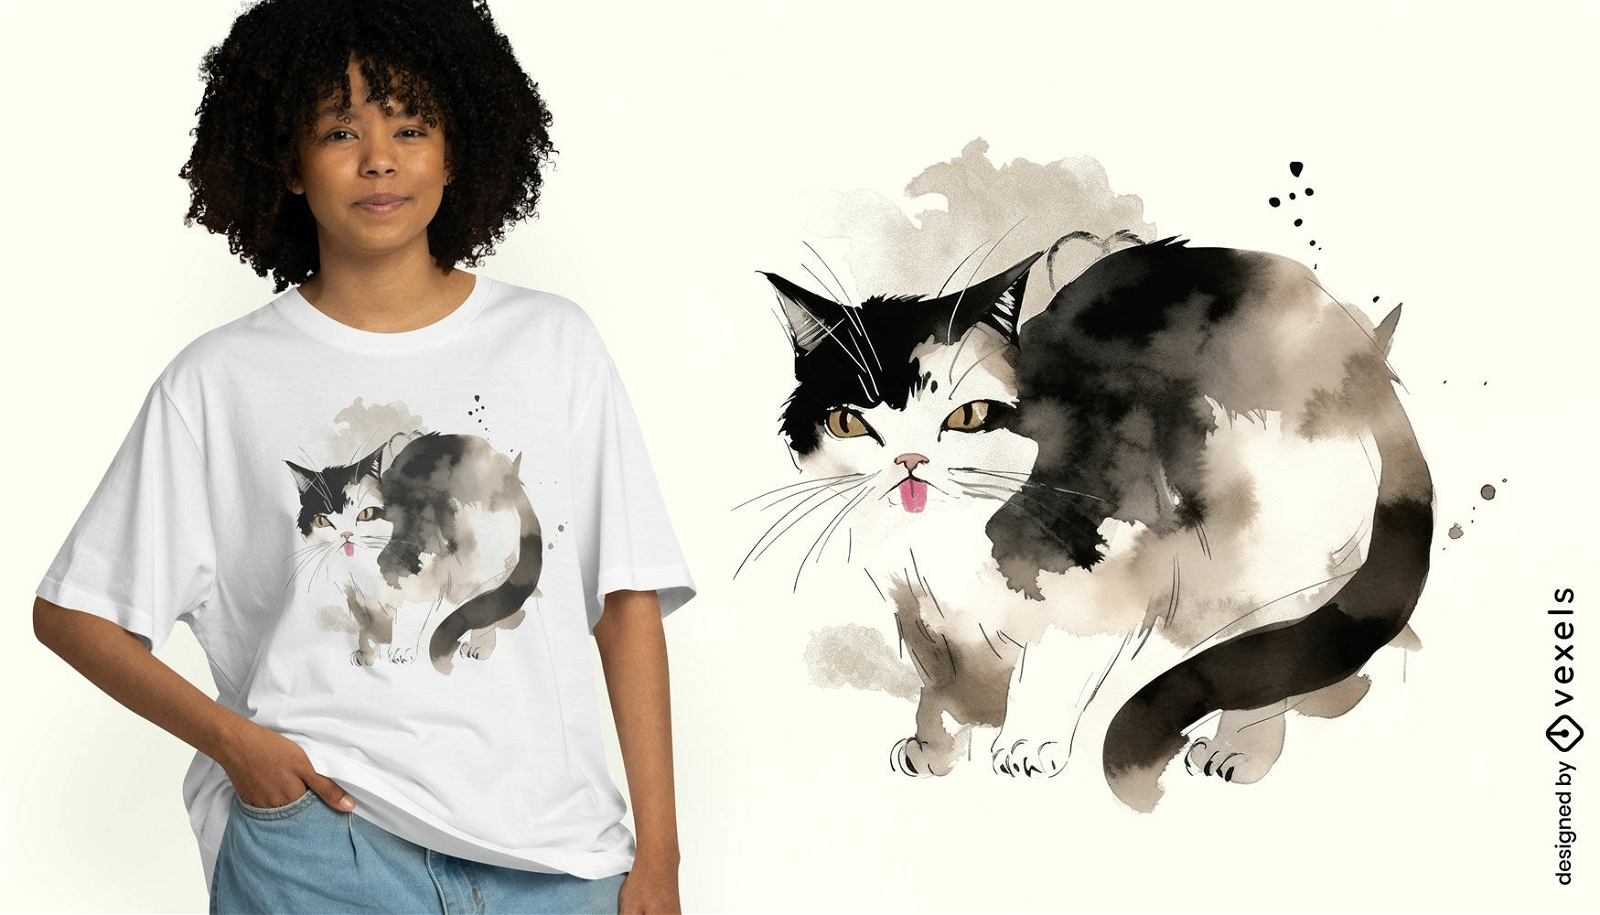
Playful cat illustration t-shirt design
Choose a folder
All favorites
Create new
Save
Playful cat illustration t-shirt design
Print ready
for Merch
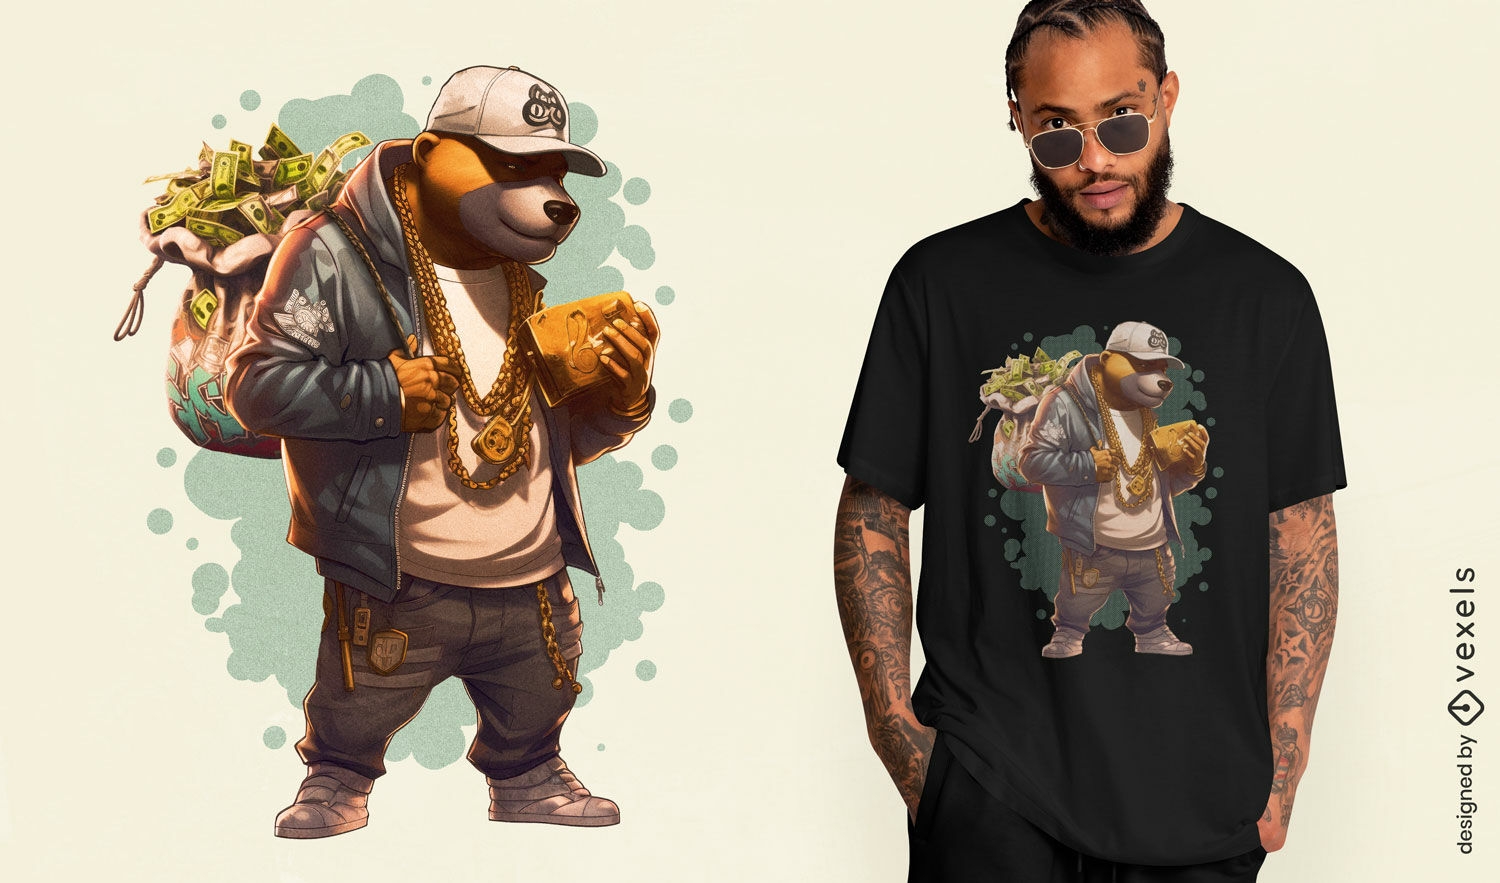
Gangster bear t-shirt design
Choose a folder
All favorites
Create new
Save
Gangster bear t-shirt design
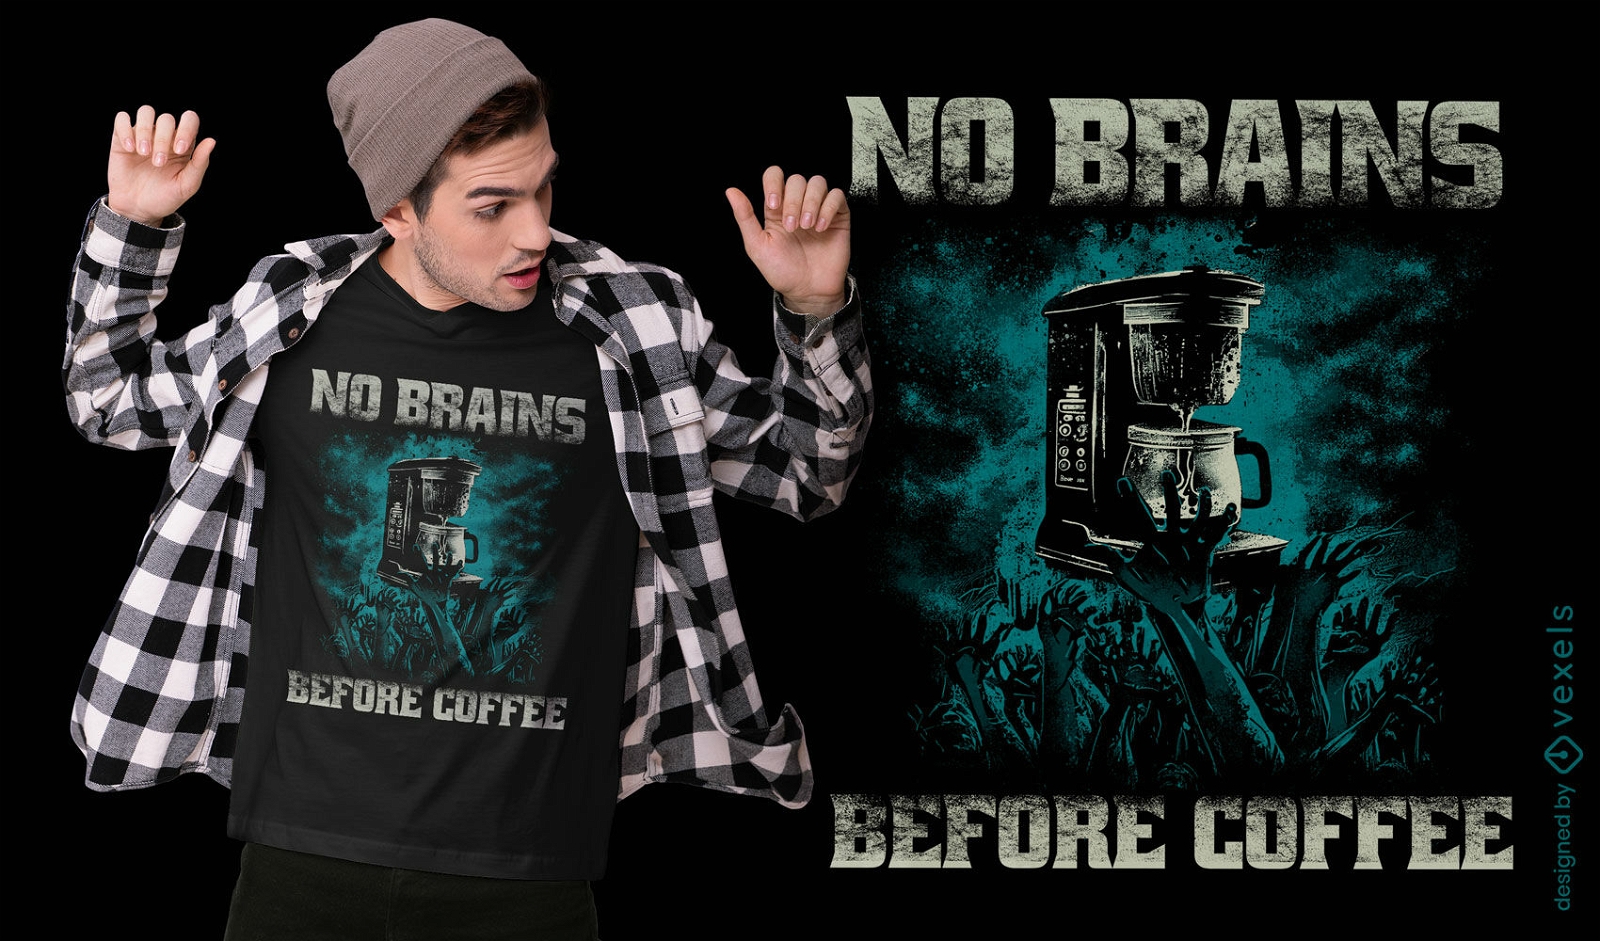
Print ready
for Merch
Zombie coffee t-shirt design
Choose a folder
All favorites
Create new
Save
Zombie coffee t-shirt design
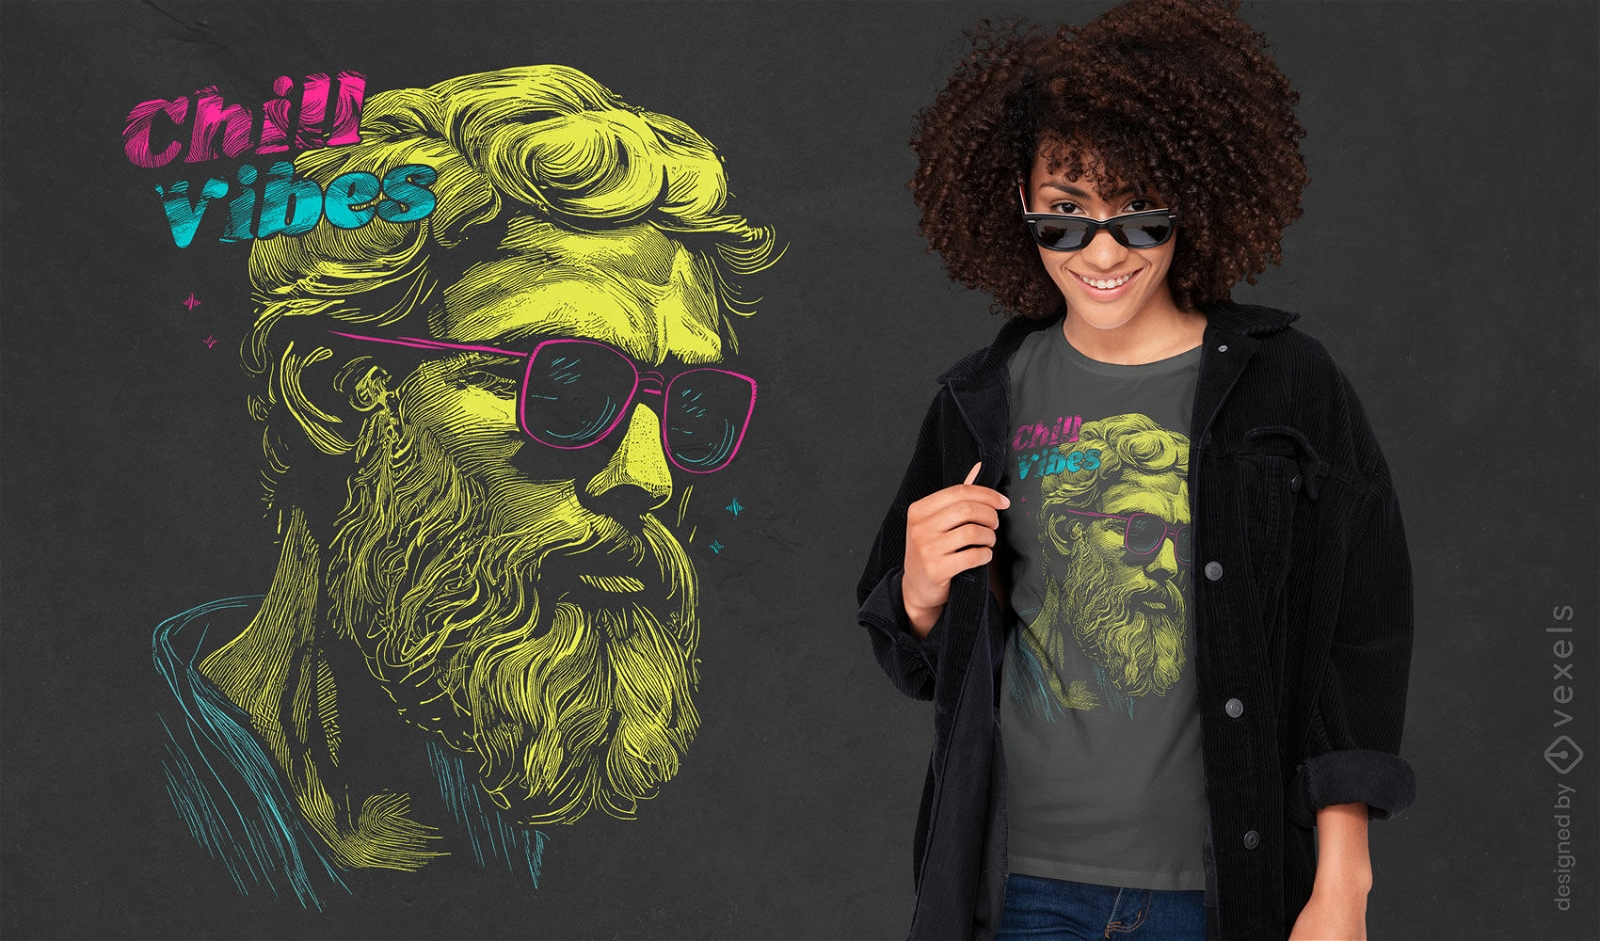
Editable text
Print ready
for Merch
Hipster Epictetus quote t-shirt design
Choose a folder
All favorites
Create new
Save
Hipster Epictetus quote t-shirt design
Editable text
Print ready
for Merch
Intrepid skeleton biker t-shirt design
Choose a folder
All favorites
Create new
Save
Intrepid skeleton biker t-shirt design
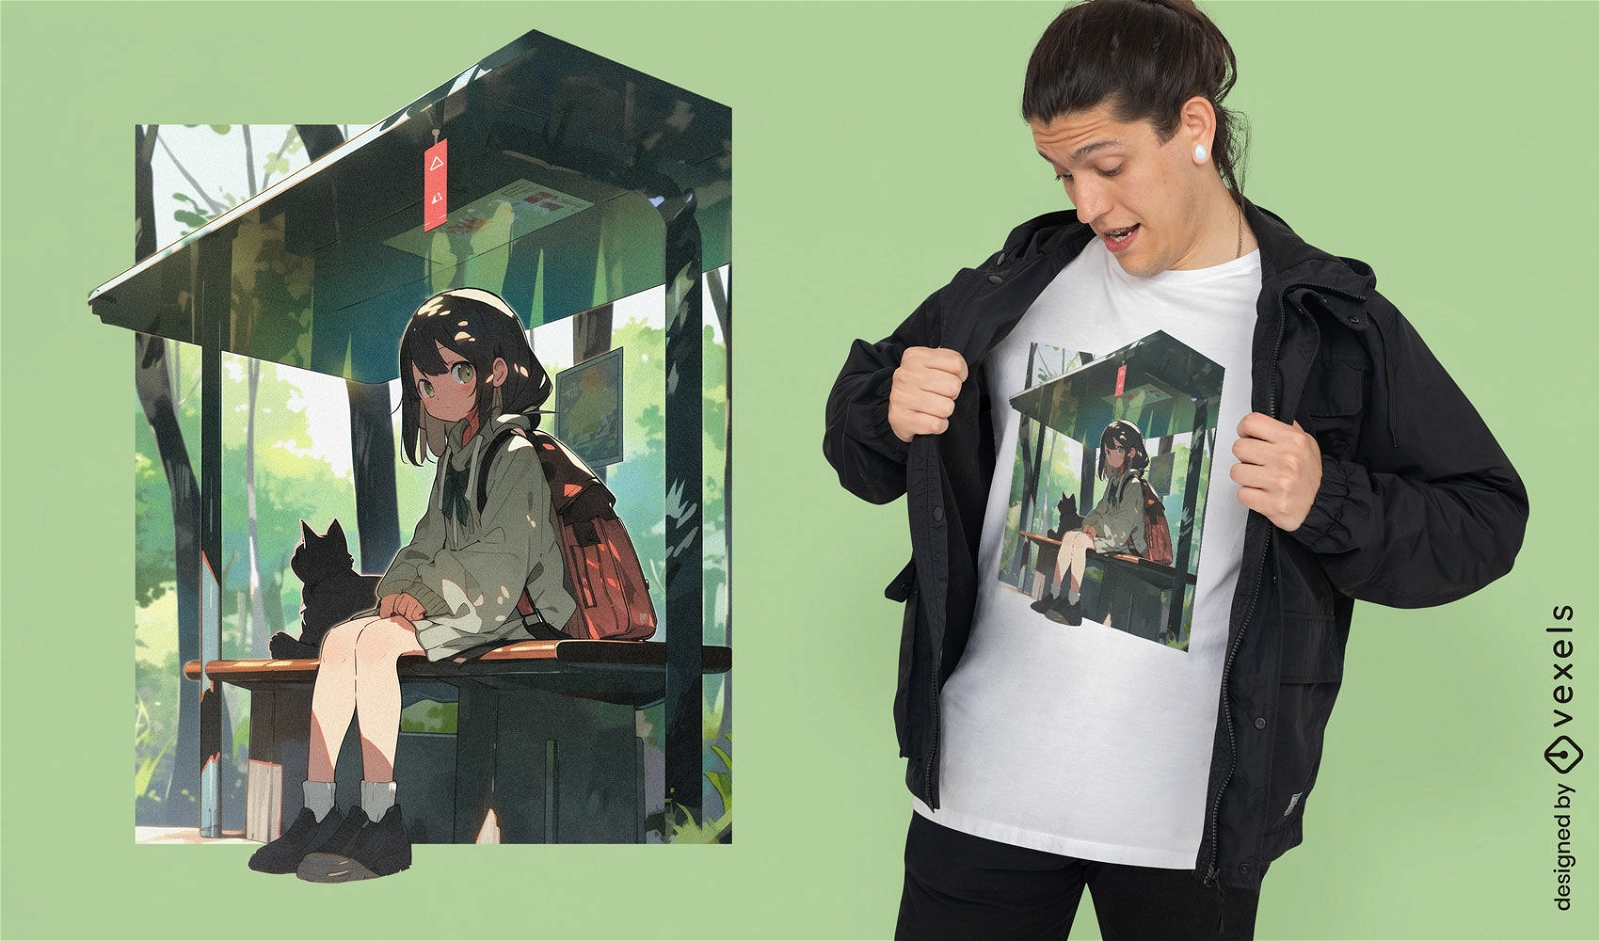
Print ready
for Merch
Anime girl bus stop t-shirt design
Choose a folder
All favorites
Create new
Save
Anime girl bus stop t-shirt design
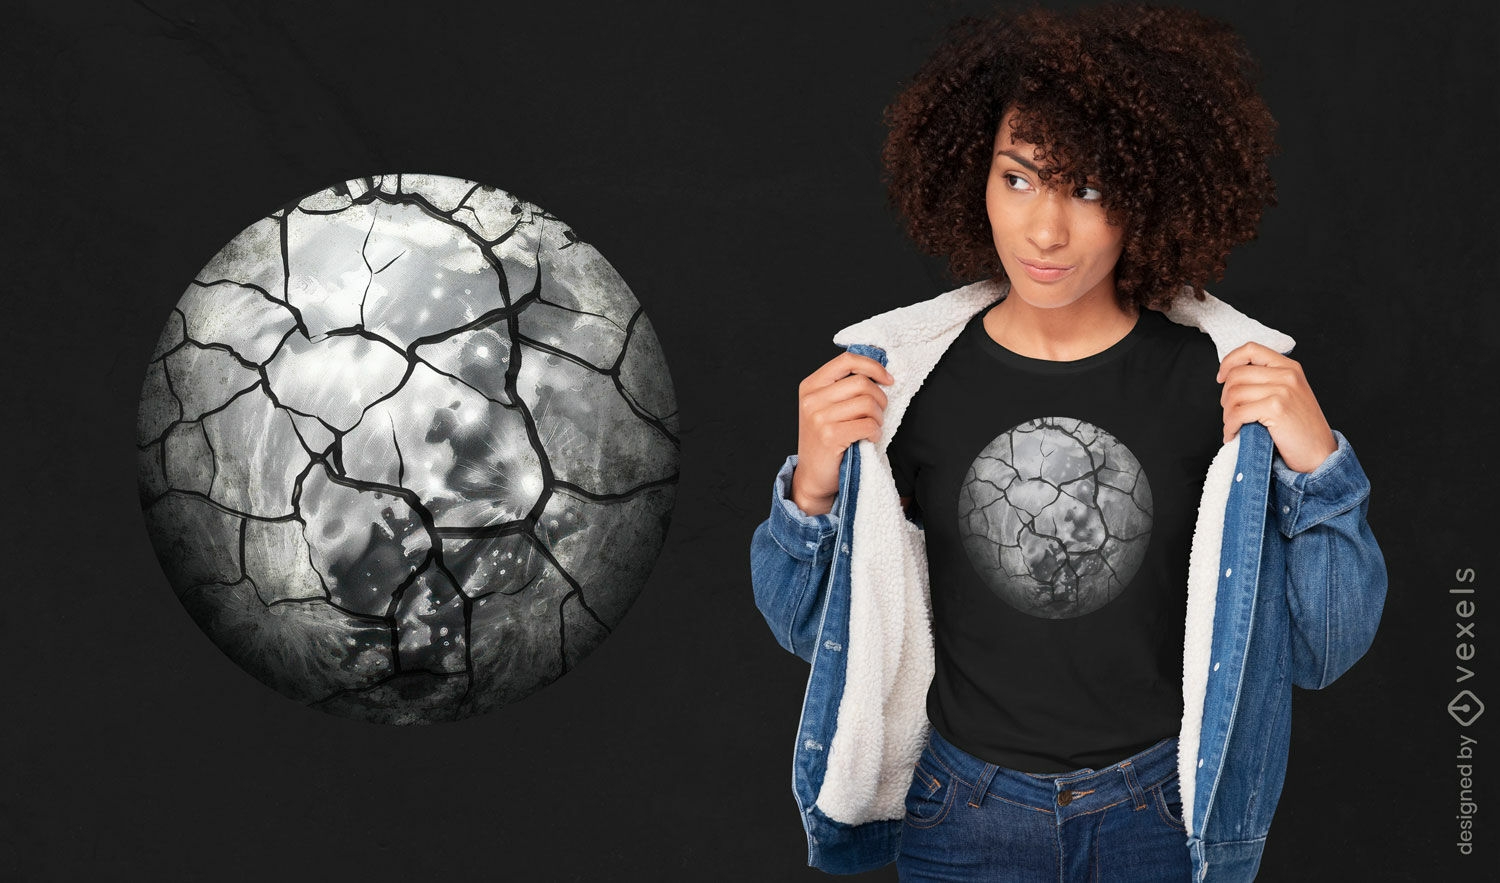
Print ready
for Merch
Cracked moon t-shirt design
Choose a folder
All favorites
Create new
Save
Cracked moon t-shirt design
Editable text
Print ready
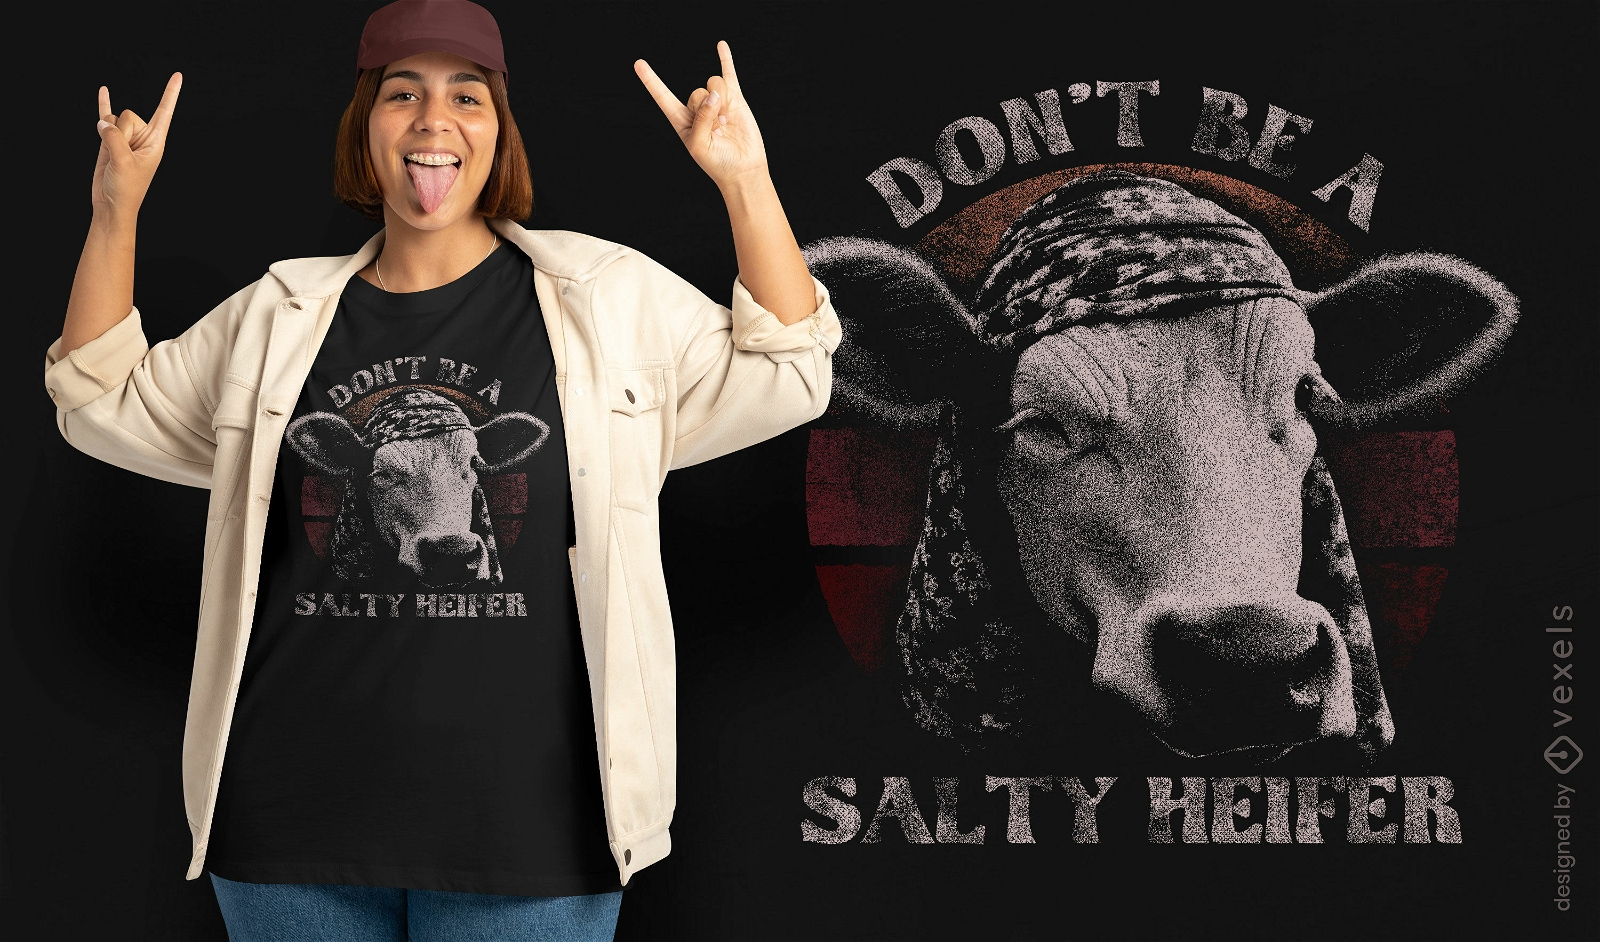
for Merch
Vintage cow t-shirt deasign
Choose a folder
All favorites
Create new
Save
Vintage cow t-shirt deasign
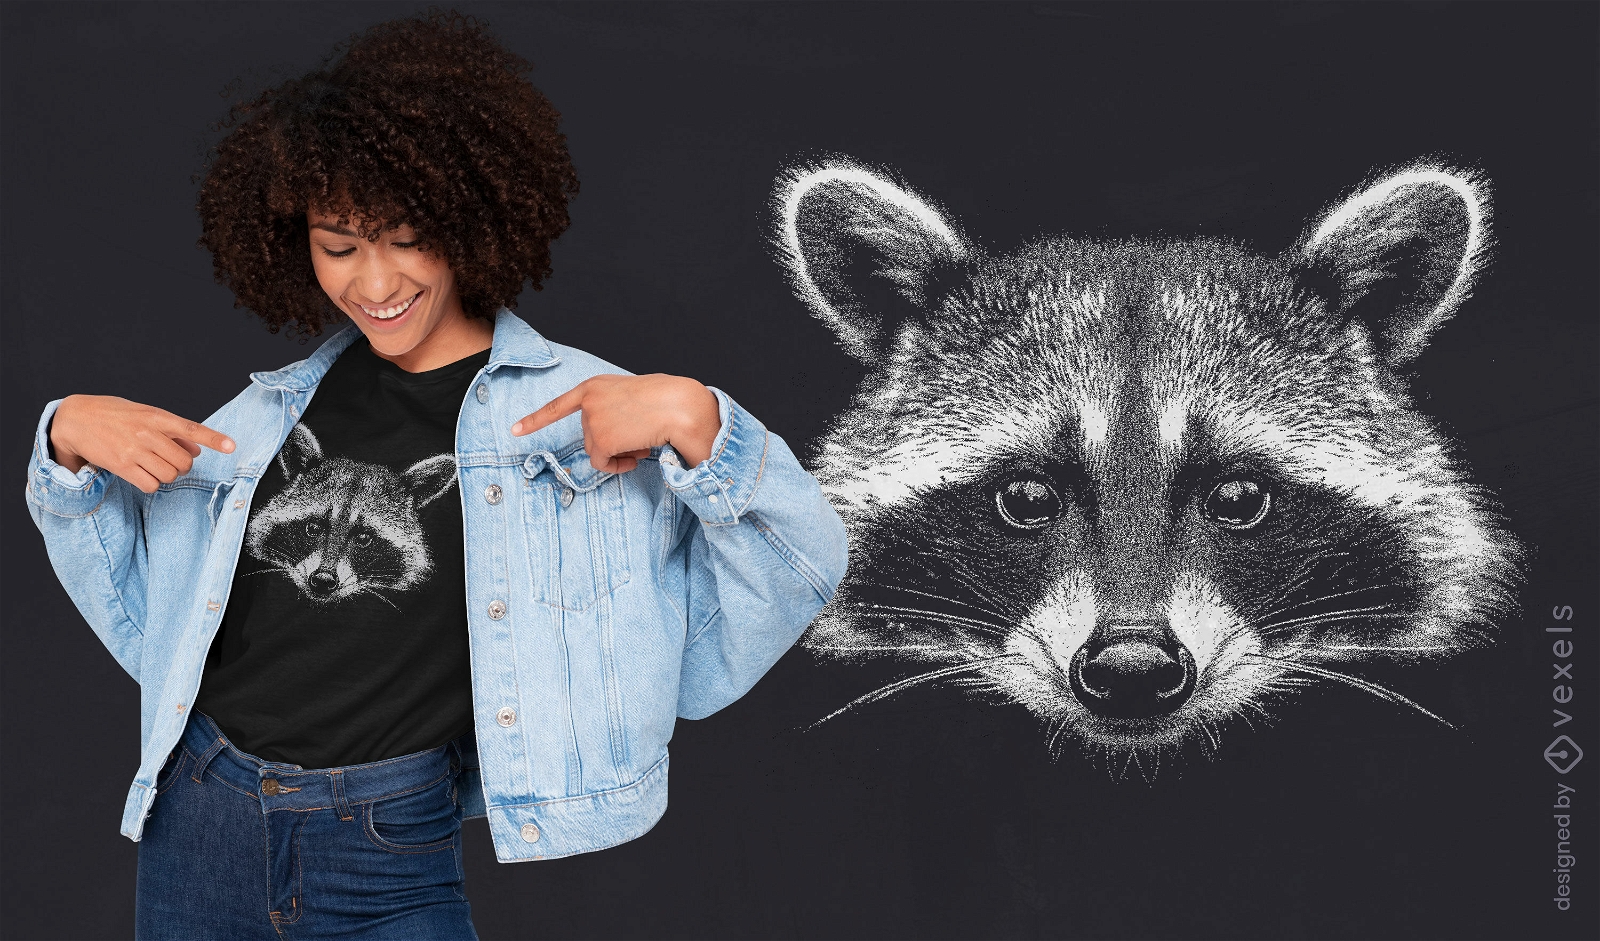
Print ready
for Merch
Detailed raccoon portrait t-shirt design
Choose a folder
All favorites
Create new
Save
Detailed raccoon portrait t-shirt design
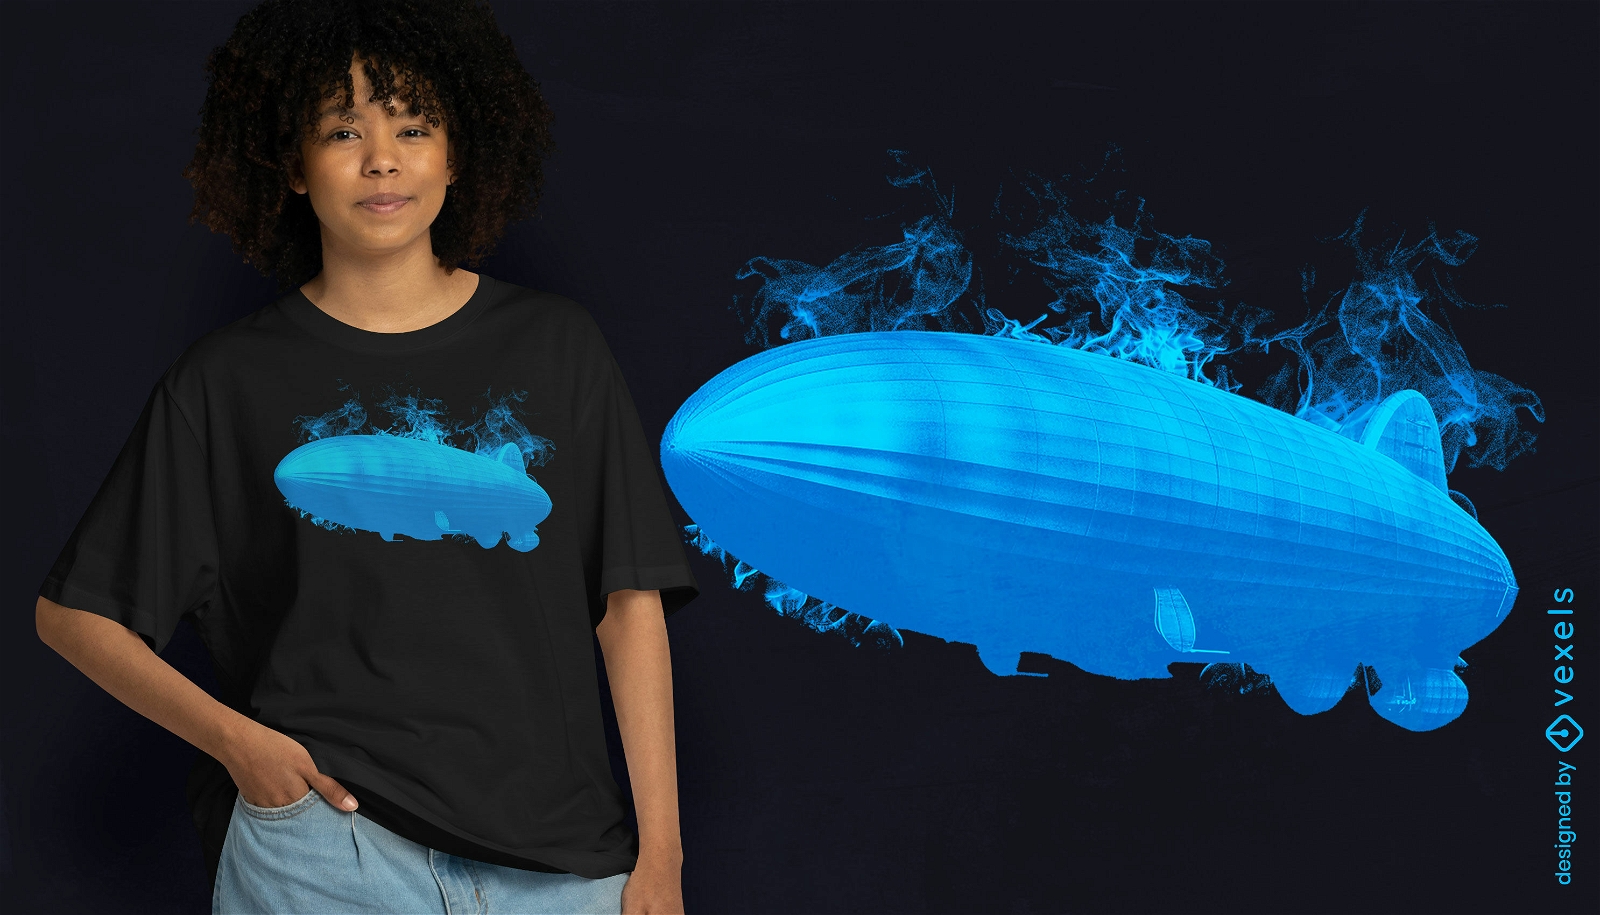
Print ready
for Merch
Zeppelin on fire t-shirt design
Choose a folder
All favorites
Create new
Save
Zeppelin on fire t-shirt design
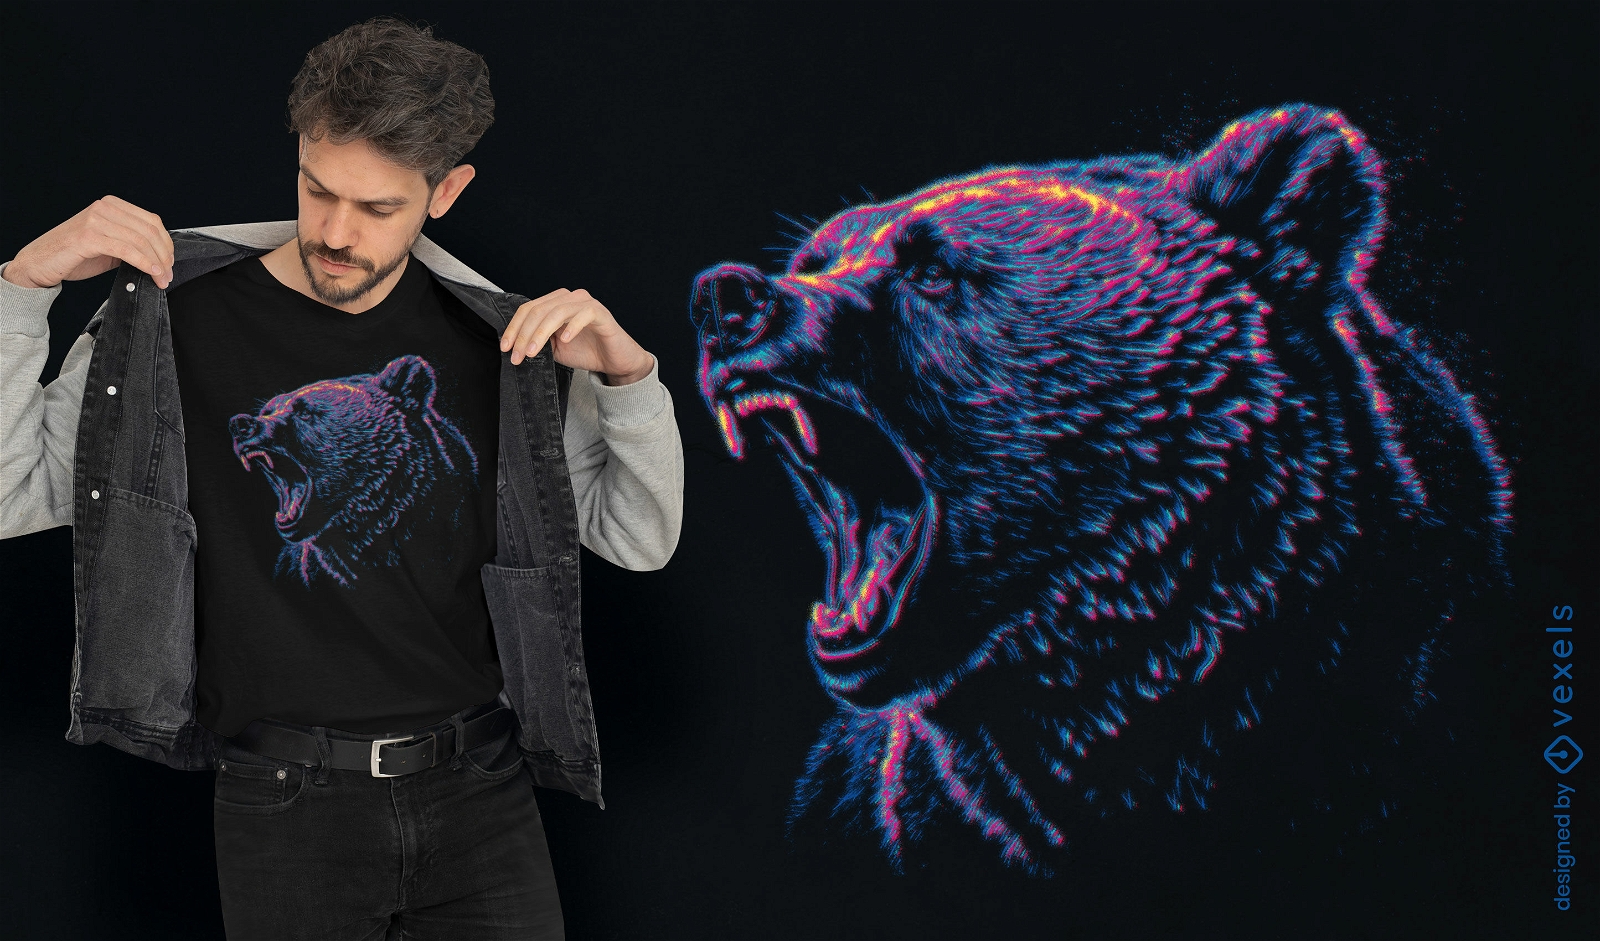
Print ready
for Merch
Roaring grizzly bear t-shirt design
Choose a folder
All favorites
Create new
Save
Roaring grizzly bear t-shirt design
Print ready
for Merch
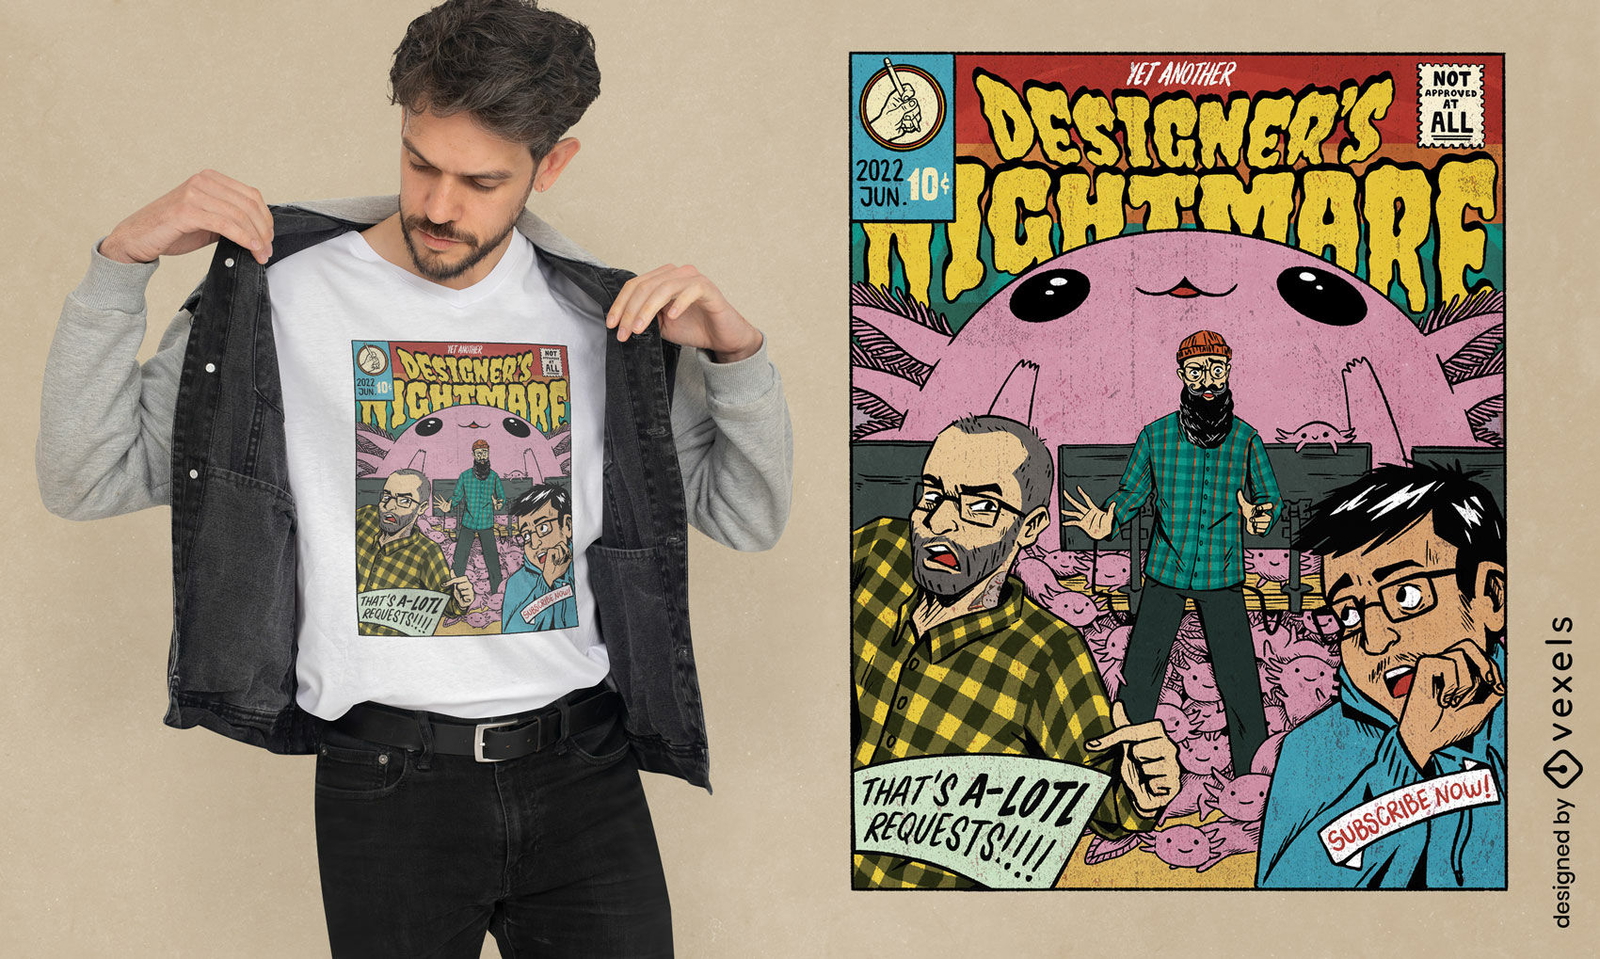
Designer's nightmare comic t-shirt design
Choose a folder
All favorites
Create new
Save
Designer's nightmare comic t-shirt design
Print ready
for Merch
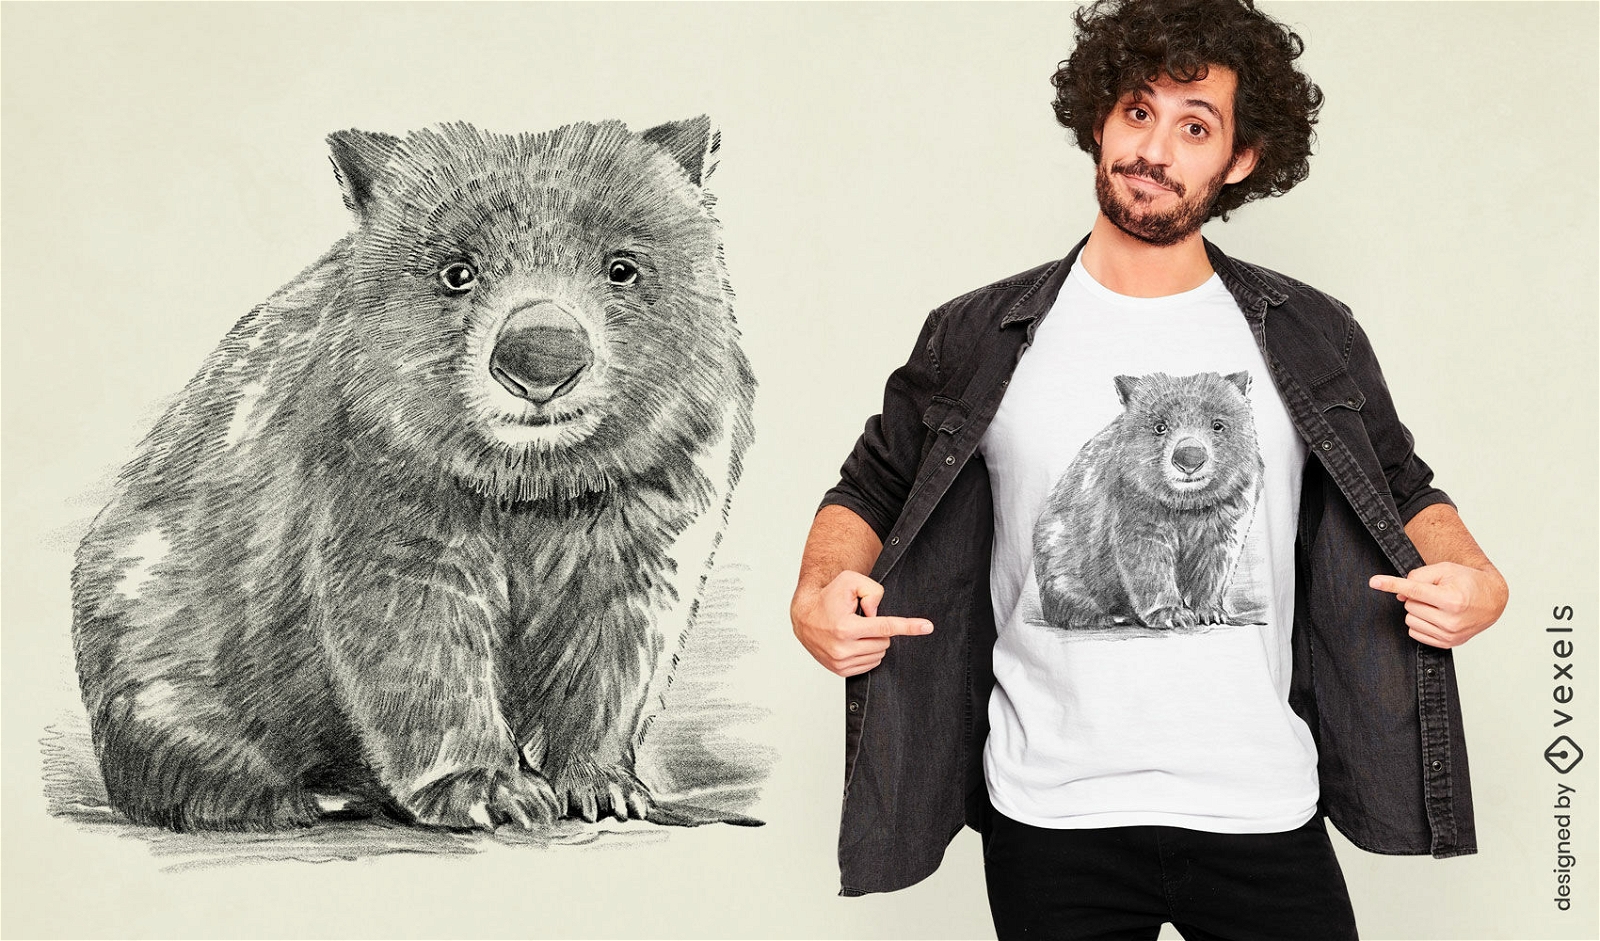
Wombat pencil drawing t-shirt design
Choose a folder
All favorites
Create new
Save
Wombat pencil drawing t-shirt design
Editable text
Print ready
for Merch
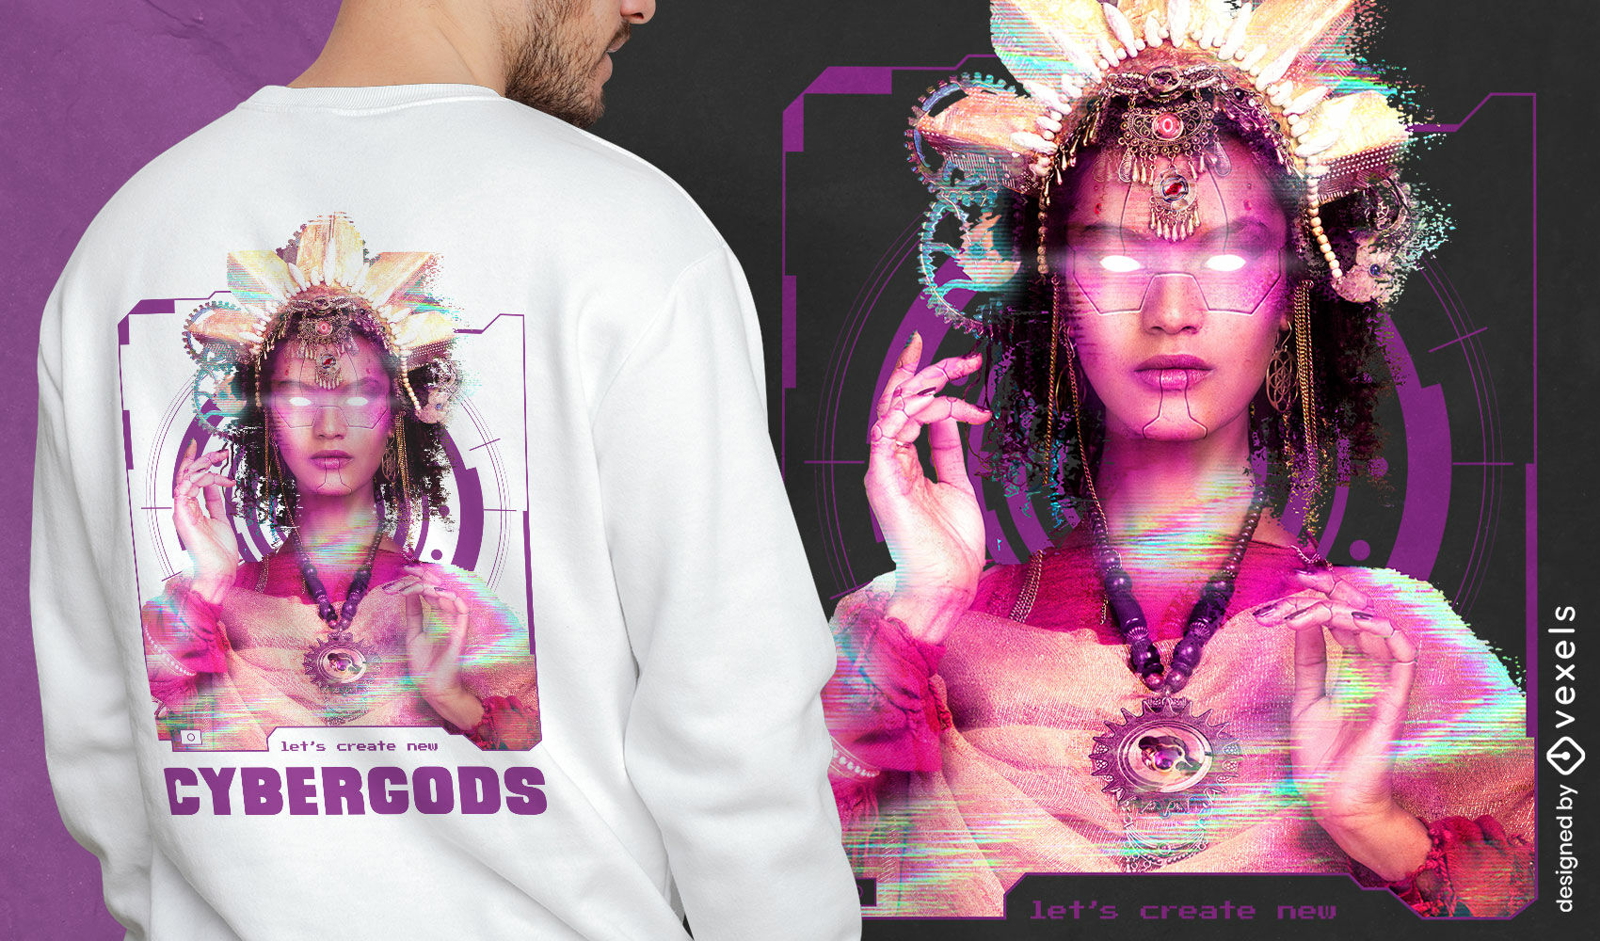
Cyborg goddess t-shirt design
Choose a folder
All favorites
Create new
Save
Cyborg goddess t-shirt design
Print ready
for Merch
Overthinker statue PSD t-shirt
Choose a folder
All favorites
Create new
Save
Overthinker statue PSD t-shirt
Print ready
for Merch
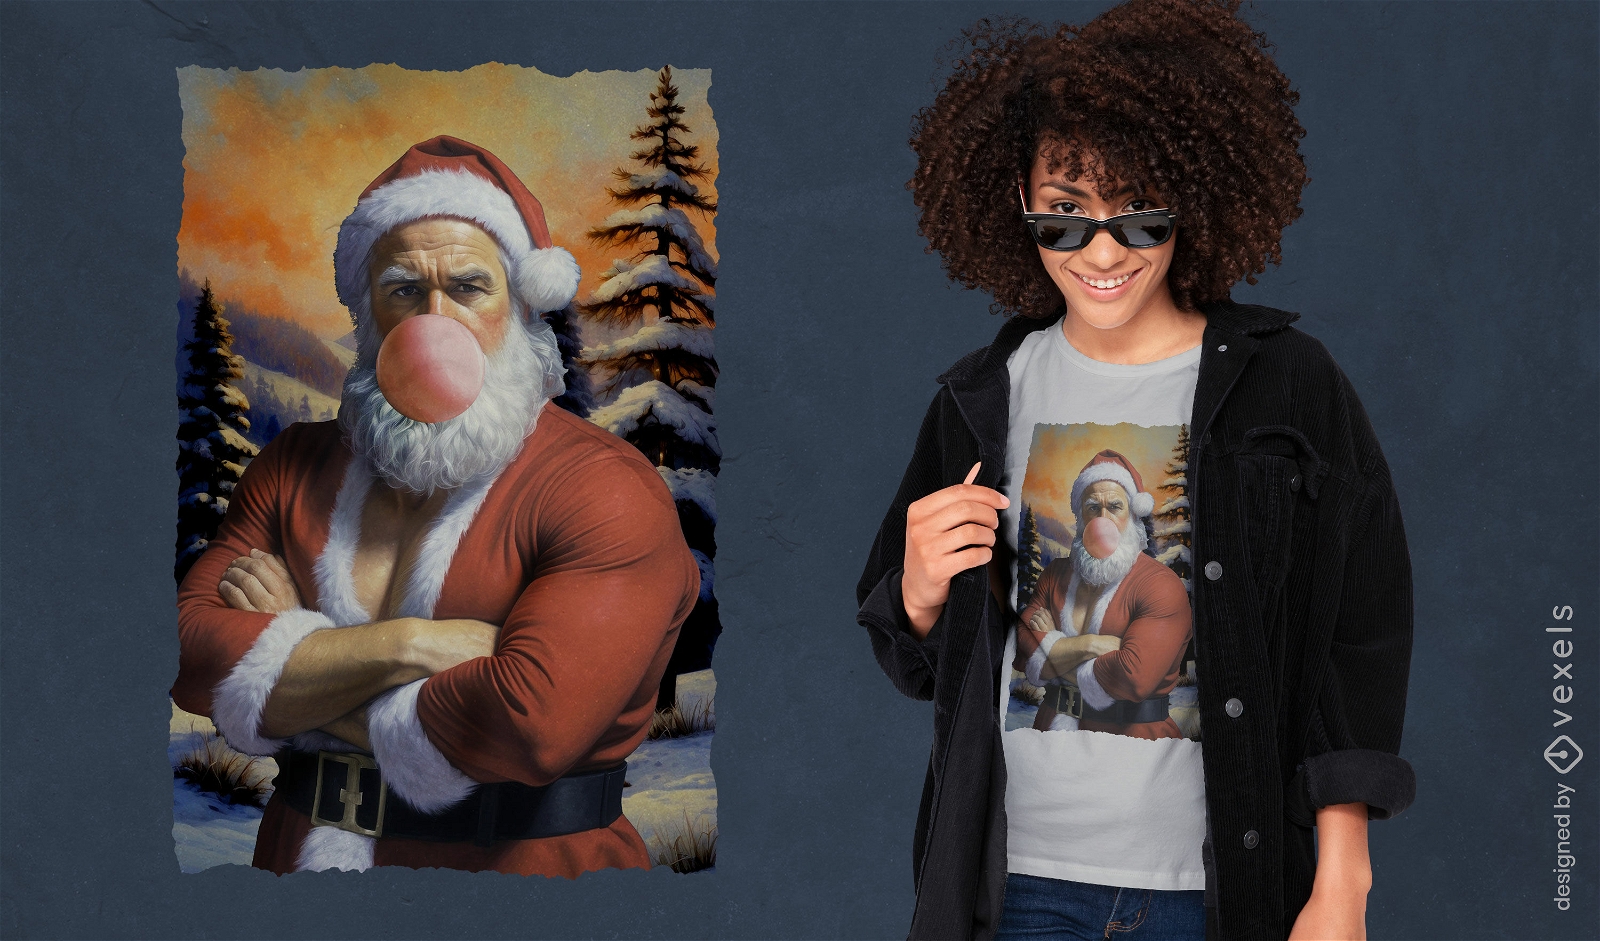
Santa Lisa t-shirt design
Choose a folder
All favorites
Create new
Save
Santa Lisa t-shirt design
Print ready
for Merch
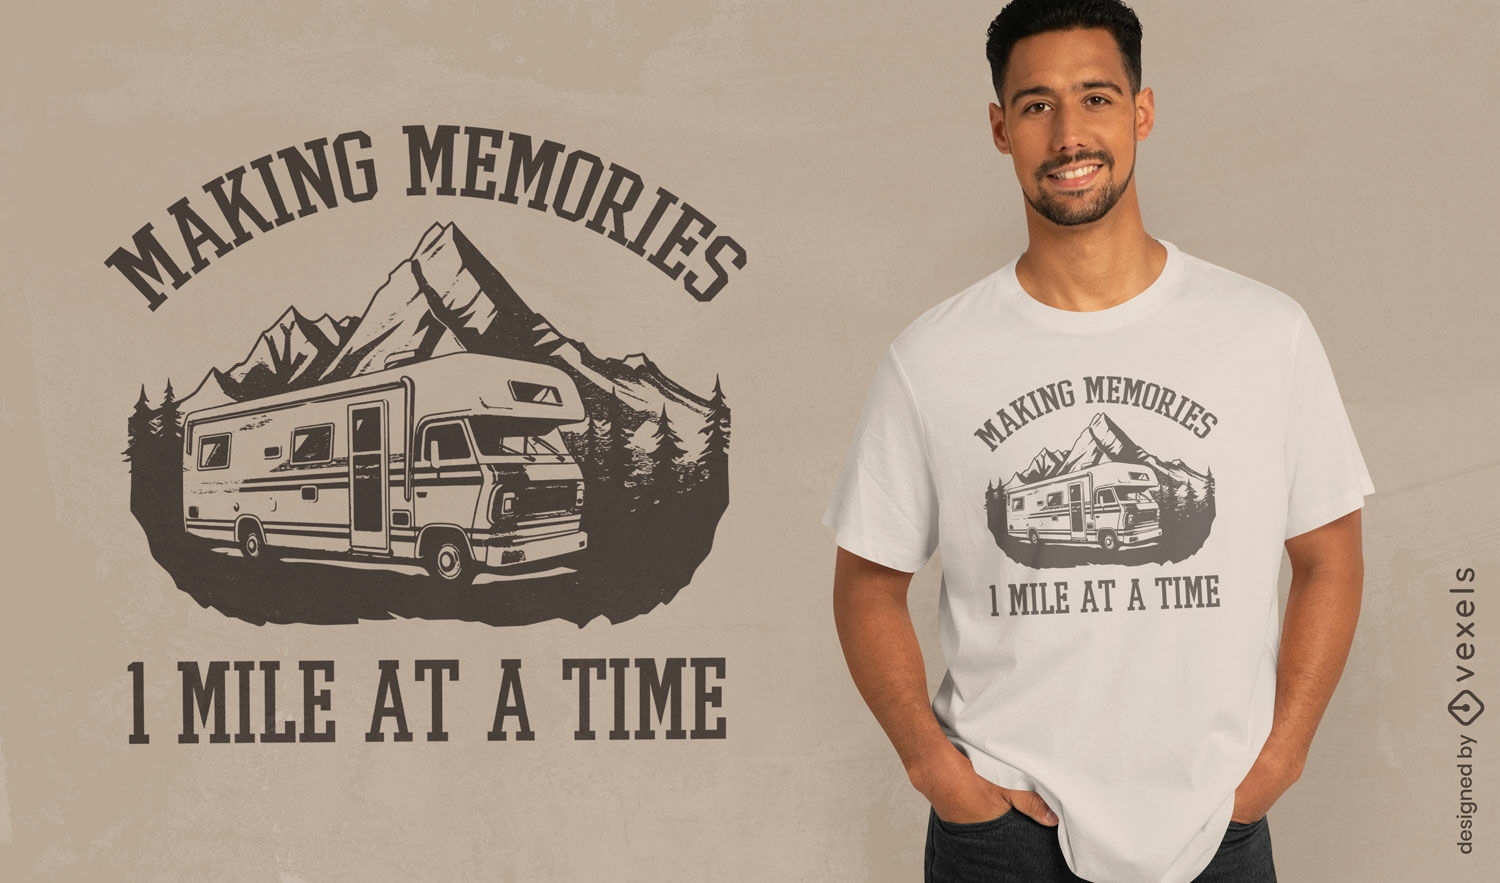
Nostalgic camper van t-shirt design
Choose a folder
All favorites
Create new
Save
Nostalgic camper van t-shirt design
Print ready
for Merch
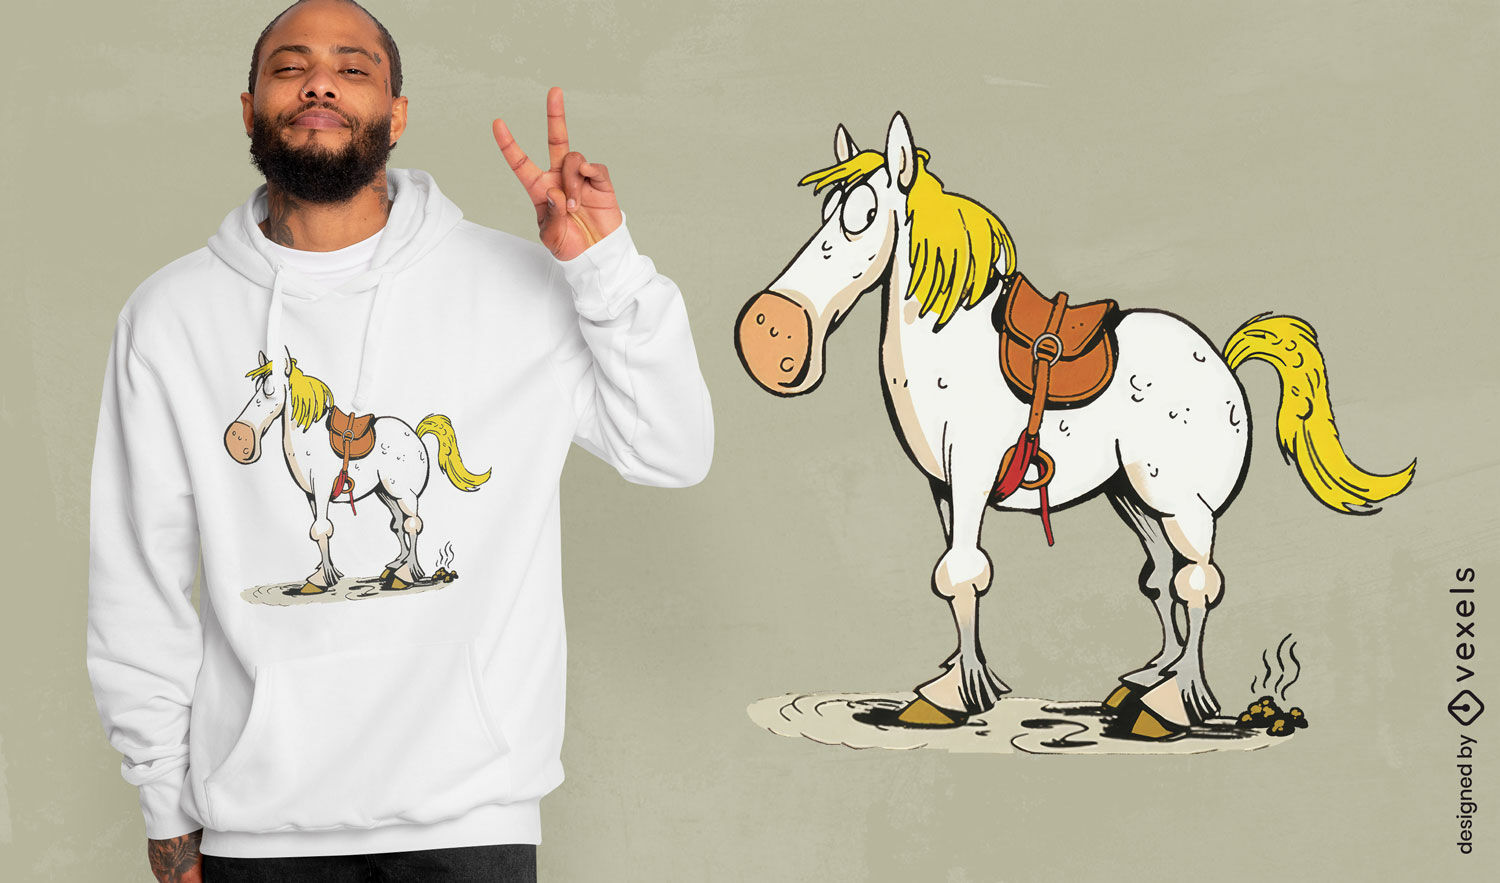
Funny cartoon horse t-shirt design
Choose a folder
All favorites
Create new
Save
Funny cartoon horse t-shirt design
Boost Your Business
With The Leading Graphic Platform For Merch.
SEE PLANS
Next
of 85
prev page
next page