Design Library
New Merch Designs
T-Shirts
Vectors
Trending Merch Designs
PNGs & SVGs
Mockups
T-Shirt PSD Templates
Explore Designs
KDP Designs
Posters
Mugs
Phone Cases
Tote Bags
Pillows
Design Tools
Merch Designer
New!
Mockup Generator
AI Design Generator
Image Vectorizer
Quote Generator
T-Shirt Maker (Old)
Resources
Merch Digest
Blog
Help Center
Learn About Merch
Feedback
Corporate Solutions
Enterprise
API Access
Pricing
Loading...
Sign Up
Login
PNGs For Merch
grafico
Design Library
New Merch Designs
T-Shirts
Vectors
Trending Merch Designs
PNGs & SVGs
Mockups
T-Shirt PSD Templates
Explore Designs
KDP Designs
Posters
Mugs
Phone Cases
Tote Bags
Pillows
Design Tools
Merch Designer
New!
Mockup Generator
AI Design Generator
Image Vectorizer
Quote Generator
T-Shirt Maker (Old)
Resources
Merch Digest
Blog
Help Center
Learn About Merch
Feedback
Corporate Solutions
Enterprise
API Access
PLANS
PNGs For Merch
grafico
1264 grafico PNG and SVG design graphic
Download grafico PNG & SVG Designs with transparent background for T-Shirts, book covers, phone cases and other merch.
Sort by
Most relevant
Sponsored results by
Get 15% off with code: VEXELS15
Show more
Premium
Colorful easter greeting design with eggs PNG Design
Choose a folder
All favorites
Create new
Save
Colorful easter greeting design with eggs PNG Design
Premium
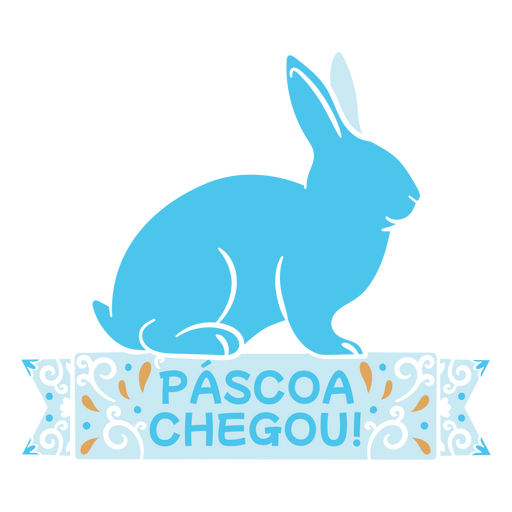
Playful easter bunny design with festive greeting PNG Design
Choose a folder
All favorites
Create new
Save
Playful easter bunny design with festive greeting PNG Design
Premium
Elegant pink ribbon decorative design PNG Design
Choose a folder
All favorites
Create new
Save
Elegant pink ribbon decorative design PNG Design
Premium
Playful easter sparkles design PNG Design
Choose a folder
All favorites
Create new
Save
Playful easter sparkles design PNG Design
Premium
Never regular graphic designer simple quote badge PNG Design
Choose a folder
All favorites
Create new
Save
Never regular graphic designer simple quote badge PNG Design
Premium
Colorful floral mandala design PNG Design
Choose a folder
All favorites
Create new
Save
Colorful floral mandala design PNG Design
Premium
Elegant butterfly floral design PNG Design
Choose a folder
All favorites
Create new
Save
Elegant butterfly floral design PNG Design
Premium
Elegant floral easter egg illustration PNG Design
Choose a folder
All favorites
Create new
Save
Elegant floral easter egg illustration PNG Design
Premium
Creative film strip design PNG Design
Choose a folder
All favorites
Create new
Save
Creative film strip design PNG Design
Premium
Elegant crane silhouette with circular design PNG Design
Choose a folder
All favorites
Create new
Save
Elegant crane silhouette with circular design PNG Design
Premium
Martial arts silhouette design with banner PNG Design
Choose a folder
All favorites
Create new
Save
Martial arts silhouette design with banner PNG Design
Premium
Stylish minimalist knot design PNG Design
Choose a folder
All favorites
Create new
Save
Stylish minimalist knot design PNG Design
Premium
Detailed hop illustration design PNG Design
Choose a folder
All favorites
Create new
Save
Detailed hop illustration design PNG Design
Premium
Elegant laurel wreath design PNG Design
Choose a folder
All favorites
Create new
Save
Elegant laurel wreath design PNG Design
Premium
Vintage beer mug illustration PNG Design
Choose a folder
All favorites
Create new
Save
Vintage beer mug illustration PNG Design
Premium
Dynamic dancer silhouette design PNG Design
Choose a folder
All favorites
Create new
Save
Dynamic dancer silhouette design PNG Design
Premium
Intricate floral scissor design PNG Design
Choose a folder
All favorites
Create new
Save
Intricate floral scissor design PNG Design
Premium
Elegant gothic architectural silhouette PNG Design
Choose a folder
All favorites
Create new
Save
Elegant gothic architectural silhouette PNG Design
Premium
Tropical flamingo design for a playful vibe PNG Design
Choose a folder
All favorites
Create new
Save
Tropical flamingo design for a playful vibe PNG Design
Premium
Playful flamingo beach style design PNG Design
Choose a folder
All favorites
Create new
Save
Playful flamingo beach style design PNG Design
Premium
Fun flamingo-themed design with motivational quote PNG Design
Choose a folder
All favorites
Create new
Save
Fun flamingo-themed design with motivational quote PNG Design
Premium
Playful easter rabbit black design PNG Design
Choose a folder
All favorites
Create new
Save
Playful easter rabbit black design PNG Design
Premium
Black rabbit design witht easter message PNG Design
Choose a folder
All favorites
Create new
Save
Black rabbit design witht easter message PNG Design
Premium
Colorful rabbit design with peace and light message PNG Design
Choose a folder
All favorites
Create new
Save
Colorful rabbit design with peace and light message PNG Design
Premium
Charming easter chocolate design with bunny motif PNG Design
Choose a folder
All favorites
Create new
Save
Charming easter chocolate design with bunny motif PNG Design
Premium
Whimsical rabbit design with decorative elements PNG Design
Choose a folder
All favorites
Create new
Save
Whimsical rabbit design with decorative elements PNG Design
Premium
Charming easter chocolate bunny design PNG Design
Choose a folder
All favorites
Create new
Save
Charming easter chocolate bunny design PNG Design
Premium
Whimsical easter egg design with inspirational text PNG Design
Choose a folder
All favorites
Create new
Save
Whimsical easter egg design with inspirational text PNG Design
Premium
Charming easter greeting design with bunny ears PNG Design
Choose a folder
All favorites
Create new
Save
Charming easter greeting design with bunny ears PNG Design
Premium
Whimsical rabbit design with peace and light theme PNG Design
Choose a folder
All favorites
Create new
Save
Whimsical rabbit design with peace and light theme PNG Design
Premium
Charming heart and ribbon easter design PNG Design
Choose a folder
All favorites
Create new
Save
Charming heart and ribbon easter design PNG Design
Premium
Charming floral design with sweet message PNG Design
Choose a folder
All favorites
Create new
Save
Charming floral design with sweet message PNG Design
Premium
Stylish hand holding a screwdriver design PNG Design
Choose a folder
All favorites
Create new
Save
Stylish hand holding a screwdriver design PNG Design
Premium
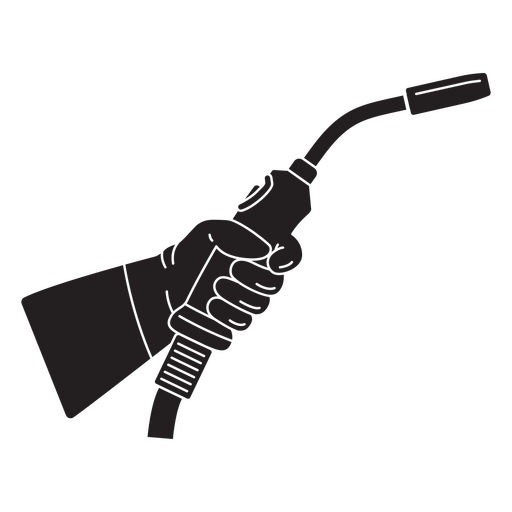
Dynamic welding hand illustration PNG Design
Choose a folder
All favorites
Create new
Save
Dynamic welding hand illustration PNG Design
Premium
Stylish black hair comb illustration PNG Design
Choose a folder
All favorites
Create new
Save
Stylish black hair comb illustration PNG Design
Premium
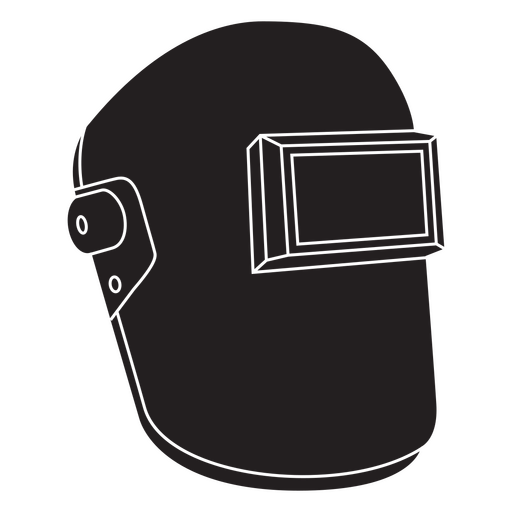
Stylish welding mask illustration PNG Design
Choose a folder
All favorites
Create new
Save
Stylish welding mask illustration PNG Design
Premium
Minimalist paint roller design PNG Design
Choose a folder
All favorites
Create new
Save
Minimalist paint roller design PNG Design
Premium
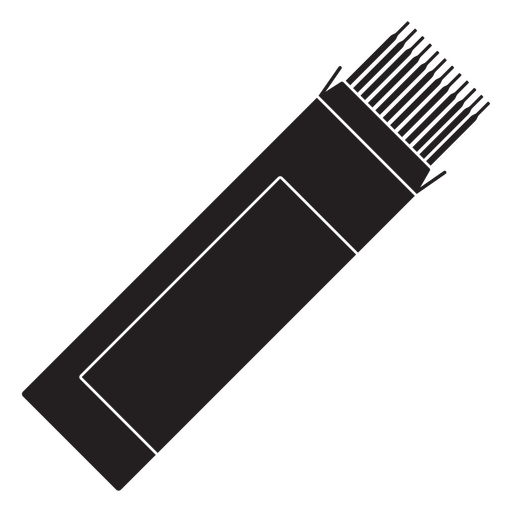
Stylish black and white wood rasp illustration PNG Design
Choose a folder
All favorites
Create new
Save
Stylish black and white wood rasp illustration PNG Design
Premium
Stylish black hair comb design PNG Design
Choose a folder
All favorites
Create new
Save
Stylish black hair comb design PNG Design
Premium
Minimalist mouse silhouette design PNG Design
Choose a folder
All favorites
Create new
Save
Minimalist mouse silhouette design PNG Design
Premium
Playful monkey character design for lunar new year celebration PNG Design
Choose a folder
All favorites
Create new
Save
Playful monkey character design for lunar new year celebration PNG Design
Premium
Playful monkey design for good fortune PNG Design
Choose a folder
All favorites
Create new
Save
Playful monkey design for good fortune PNG Design
Premium
Charming monkey lantern illustration PNG Design
Choose a folder
All favorites
Create new
Save
Charming monkey lantern illustration PNG Design
Premium
Playful monkey character design with festive details PNG Design
Choose a folder
All favorites
Create new
Save
Playful monkey character design with festive details PNG Design
Premium
Playful monkey design with fans and floral accents PNG Design
Choose a folder
All favorites
Create new
Save
Playful monkey design with fans and floral accents PNG Design
Premium
Playful monkey new year design PNG Design
Choose a folder
All favorites
Create new
Save
Playful monkey new year design PNG Design
Premium
Playful monkey design with health-themed chinese characters PNG Design
Choose a folder
All favorites
Create new
Save
Playful monkey design with health-themed chinese characters PNG Design
Premium
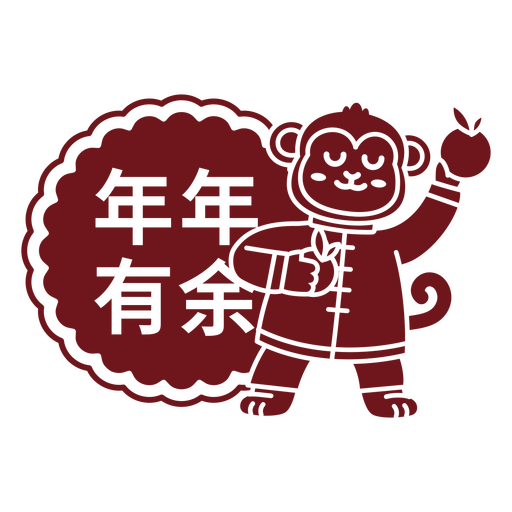
Playful monkey illustration with chinese text design PNG Design
Choose a folder
All favorites
Create new
Save
Playful monkey illustration with chinese text design PNG Design
Premium
Playful smiling emoji design PNG Design
Choose a folder
All favorites
Create new
Save
Playful smiling emoji design PNG Design
Premium
Playful cartoon monster face design PNG Design
Choose a folder
All favorites
Create new
Save
Playful cartoon monster face design PNG Design
Boost Your Business
With The Leading Graphic Platform For Merch.
SEE PLANS
Next
of 26
prev page
next page