Design Library
New Merch Designs
T-Shirts
Vectors
Trending Merch Designs
PNGs & SVGs
Mockups
T-Shirt PSD Templates
Explore Designs
KDP Designs
Posters
Mugs
Phone Cases
Tote Bags
Pillows
Design Tools
Merch Designer
New!
Mockup Generator
AI Design Generator
Image Vectorizer
Quote Generator
T-Shirt Maker (Old)
Resources
Merch Digest
Blog
Help Center
Learn About Merch
Feedback
Corporate Solutions
Enterprise
API Access
Pricing
Loading...
Sign Up
Login
PNGs For Merch
grafico
Design Library
New Merch Designs
T-Shirts
Vectors
Trending Merch Designs
PNGs & SVGs
Mockups
T-Shirt PSD Templates
Explore Designs
KDP Designs
Posters
Mugs
Phone Cases
Tote Bags
Pillows
Design Tools
Merch Designer
New!
Mockup Generator
AI Design Generator
Image Vectorizer
Quote Generator
T-Shirt Maker (Old)
Resources
Merch Digest
Blog
Help Center
Learn About Merch
Feedback
Corporate Solutions
Enterprise
API Access
PLANS
PNGs For Merch
grafico
1306 grafico PNG and SVG design graphic
Download grafico PNG & SVG Designs with transparent background for T-Shirts, book covers, phone cases and other merch.
Sort by
Most relevant
Sponsored results by
Get 15% off with code: VEXELS15
Show more
Premium
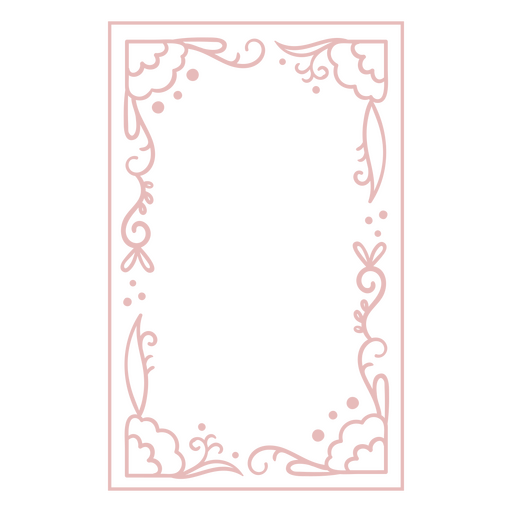
Pink rectangle frame floral decorations PNG Design
Choose a folder
All favorites
Create new
Save
Pink rectangle frame floral decorations PNG Design
Premium
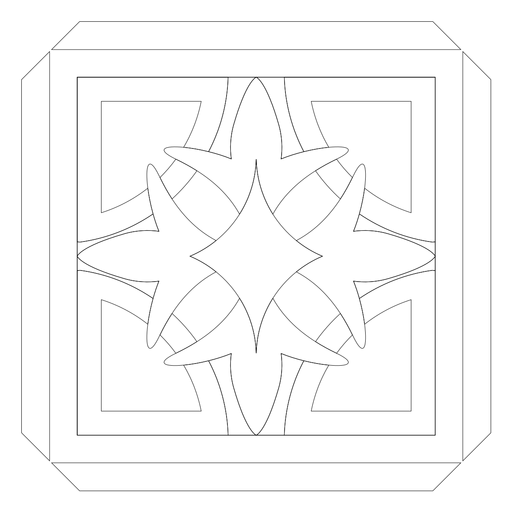
Mosaic flower square rhomb petal circle silhouette PNG Design
Choose a folder
All favorites
Create new
Save
Mosaic flower square rhomb petal circle silhouette PNG Design
Premium
Mosaic petal flower square line PNG Design
Choose a folder
All favorites
Create new
Save
Mosaic petal flower square line PNG Design
Premium
Mosaic square circle flower petal line PNG Design
Choose a folder
All favorites
Create new
Save
Mosaic square circle flower petal line PNG Design
Bars growing arrow icon PNG Design
Choose a folder
All favorites
Create new
Save
Bars growing arrow icon PNG Design
Premium
Groom's brew crew logo PNG Design
Choose a folder
All favorites
Create new
Save
Groom's brew crew logo PNG Design
Premium
Pixel camera icon PNG Design
Choose a folder
All favorites
Create new
Save
Pixel camera icon PNG Design
Premium
Green plant icon PNG Design
Choose a folder
All favorites
Create new
Save
Green plant icon PNG Design
Premium
Living the scrub life PNG Design
Choose a folder
All favorites
Create new
Save
Living the scrub life PNG Design
Premium
Resigned graphic face PNG Design
Choose a folder
All favorites
Create new
Save
Resigned graphic face PNG Design
Premium
The art director logo PNG Design
Choose a folder
All favorites
Create new
Save
The art director logo PNG Design
Premium
The word hello in purple with stars around it PNG Design
Choose a folder
All favorites
Create new
Save
The word hello in purple with stars around it PNG Design
Premium
Mosaic flower circle petal silhouette PNG Design
Choose a folder
All favorites
Create new
Save
Mosaic flower circle petal silhouette PNG Design
Premium
Mosaic circle arrow rhomb flat PNG Design
Choose a folder
All favorites
Create new
Save
Mosaic circle arrow rhomb flat PNG Design
Premium
Mosaic circle arrow rhomb triangle detailed silhouette PNG Design
Choose a folder
All favorites
Create new
Save
Mosaic circle arrow rhomb triangle detailed silhouette PNG Design
Premium
I was born to ride PNG Design
Choose a folder
All favorites
Create new
Save
I was born to ride PNG Design
Premium
I'm the legend logo PNG Design
Choose a folder
All favorites
Create new
Save
I'm the legend logo PNG Design
Premium
Blue laptop icon PNG Design
Choose a folder
All favorites
Create new
Save
Blue laptop icon PNG Design
Premium
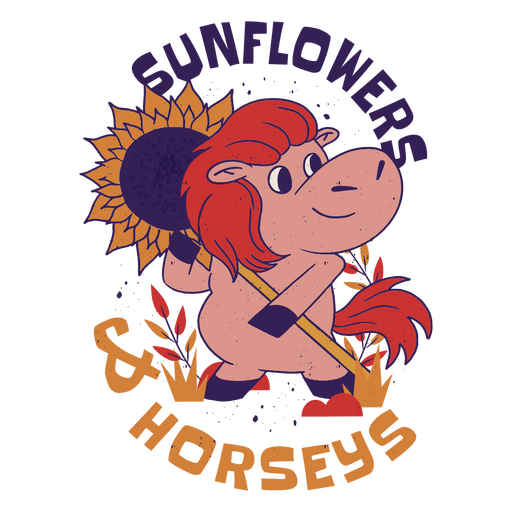
Sunflowers and horseys cartoon PNG Design
Choose a folder
All favorites
Create new
Save
Sunflowers and horseys cartoon PNG Design
Premium
Not your toy purple halloween doll PNG Design
Choose a folder
All favorites
Create new
Save
Not your toy purple halloween doll PNG Design
Premium
Mosaic arrow square rhomb silhouette PNG Design
Choose a folder
All favorites
Create new
Save
Mosaic arrow square rhomb silhouette PNG Design
Premium
Mosaic circle rhomb square line PNG Design
Choose a folder
All favorites
Create new
Save
Mosaic circle rhomb square line PNG Design
Premium
Mosaic circle rhomb square detailed silhouette PNG Design
Choose a folder
All favorites
Create new
Save
Mosaic circle rhomb square detailed silhouette PNG Design
Premium
Mosaic flower square petal flat PNG Design
Choose a folder
All favorites
Create new
Save
Mosaic flower square petal flat PNG Design
Premium
Mosaic petal flower circle rhomb stroke PNG Design
Choose a folder
All favorites
Create new
Save
Mosaic petal flower circle rhomb stroke PNG Design
Premium
Mosaic petal flower flat PNG Design
Choose a folder
All favorites
Create new
Save
Mosaic petal flower flat PNG Design
Premium
Mosaic rhomb circle square flower flat PNG Design
Choose a folder
All favorites
Create new
Save
Mosaic rhomb circle square flower flat PNG Design
Premium
Mosaic square rhomb flat PNG Design
Choose a folder
All favorites
Create new
Save
Mosaic square rhomb flat PNG Design
Premium
Half blue multicolor piechart PNG Design
Choose a folder
All favorites
Create new
Save
Half blue multicolor piechart PNG Design
Premium
Super title PNG Design
Choose a folder
All favorites
Create new
Save
Super title PNG Design
Premium
Skull with lightning bolt PNG Design
Choose a folder
All favorites
Create new
Save
Skull with lightning bolt PNG Design
Premium
Born to smoke logo PNG Design
Choose a folder
All favorites
Create new
Save
Born to smoke logo PNG Design
Premium
Totally preggers logo PNG Design
Choose a folder
All favorites
Create new
Save
Totally preggers logo PNG Design
Premium
Green and red anchor icon PNG Design
Choose a folder
All favorites
Create new
Save
Green and red anchor icon PNG Design
Premium
Power to the girls floral lettering PNG Design
Choose a folder
All favorites
Create new
Save
Power to the girls floral lettering PNG Design
Premium
Black and white drawing of a frog playing a violin PNG Design
Choose a folder
All favorites
Create new
Save
Black and white drawing of a frog playing a violin PNG Design
Semicircle triangle flat PNG Design
Choose a folder
All favorites
Create new
Save
Semicircle triangle flat PNG Design
Premium
Mosaic square black PNG Design
Choose a folder
All favorites
Create new
Save
Mosaic square black PNG Design
Premium
Mosaic flower petal square line PNG Design
Choose a folder
All favorites
Create new
Save
Mosaic flower petal square line PNG Design
Premium
Mosaic circle arrow flat PNG Design
Choose a folder
All favorites
Create new
Save
Mosaic circle arrow flat PNG Design
Premium
Mosaic circle arrow stroke PNG Design
Choose a folder
All favorites
Create new
Save
Mosaic circle arrow stroke PNG Design
Premium
Mosaic square arrow triangle flat PNG Design
Choose a folder
All favorites
Create new
Save
Mosaic square arrow triangle flat PNG Design
Premium
Mosaic petal square flower silhouette PNG Design
Choose a folder
All favorites
Create new
Save
Mosaic petal square flower silhouette PNG Design
Premium
Mosaic rhomb circle flower line PNG Design
Choose a folder
All favorites
Create new
Save
Mosaic rhomb circle flower line PNG Design
Premium
Mosaic square rhomb flower petal line PNG Design
Choose a folder
All favorites
Create new
Save
Mosaic square rhomb flower petal line PNG Design
Premium
Neon shell icon orange and red PNG Design
Choose a folder
All favorites
Create new
Save
Neon shell icon orange and red PNG Design
Premium
Gotta level up gaming boy PNG Design
Choose a folder
All favorites
Create new
Save
Gotta level up gaming boy PNG Design
Premium
Peace and order men's t-shirt PNG Design
Choose a folder
All favorites
Create new
Save
Peace and order men's t-shirt PNG Design
Natural tree element cut out PNG Design
Choose a folder
All favorites
Create new
Save
Natural tree element cut out PNG Design
Premium
DUPLICADO Ruler icon PNG Design
Choose a folder
All favorites
Create new
Save
DUPLICADO Ruler icon PNG Design
Boost Your Business
With The Leading Graphic Platform For Merch.
SEE PLANS
Next
of 27
prev page
next page