Design Library
New Merch Designs
T-Shirts
Vectors
Trending Merch Designs
PNGs & SVGs
Mockups
T-Shirt PSD Templates
Explore Designs
KDP Designs
Posters
Mugs
Phone Cases
Tote Bags
Pillows
Design Tools
Merch Designer
New!
Mockup Generator
AI Design Generator
Image Vectorizer
Quote Generator
T-Shirt Maker (Old)
Resources
Merch Digest
Blog
Help Center
Learn About Merch
Feedback
Corporate Solutions
Enterprise
API Access
Pricing
Loading...
Sign Up
Login
PNGs For Merch
grafico
Design Library
New Merch Designs
T-Shirts
Vectors
Trending Merch Designs
PNGs & SVGs
Mockups
T-Shirt PSD Templates
Explore Designs
KDP Designs
Posters
Mugs
Phone Cases
Tote Bags
Pillows
Design Tools
Merch Designer
New!
Mockup Generator
AI Design Generator
Image Vectorizer
Quote Generator
T-Shirt Maker (Old)
Resources
Merch Digest
Blog
Help Center
Learn About Merch
Feedback
Corporate Solutions
Enterprise
API Access
PLANS
PNGs For Merch
grafico
1306 grafico PNG and SVG design graphic
Download grafico PNG & SVG Designs with transparent background for T-Shirts, book covers, phone cases and other merch.
Sort by
Most relevant
Sponsored results by
Get 15% off with code: VEXELS15
Show more
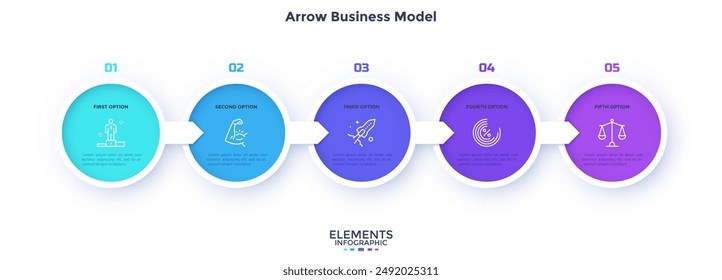
Arrow direction covered van PNG Design
Choose a folder
All favorites
Create new
Save
Arrow direction covered van PNG Design
Premium
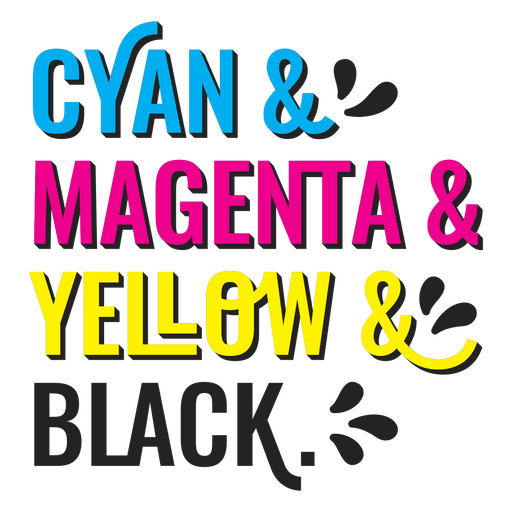
Cmyb fonts lettering PNG Design
Choose a folder
All favorites
Create new
Save
Cmyb fonts lettering PNG Design
Artist nib fountain pen stroke PNG Design
Choose a folder
All favorites
Create new
Save
Artist nib fountain pen stroke PNG Design
Premium
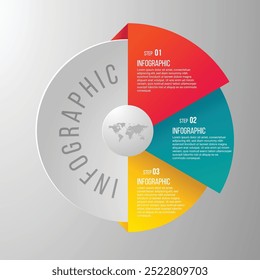
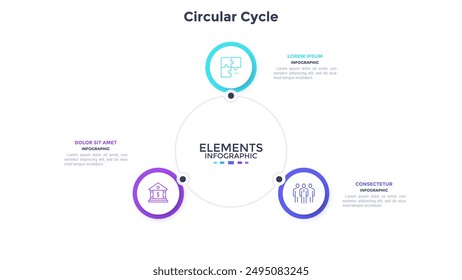
Half grey 3 parts piechart PNG Design
Choose a folder
All favorites
Create new
Save
Half grey 3 parts piechart PNG Design
Premium
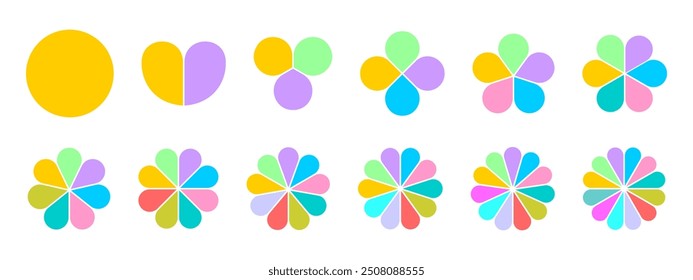
Mosaic circle sunflower figure stroke PNG Design
Choose a folder
All favorites
Create new
Save
Mosaic circle sunflower figure stroke PNG Design
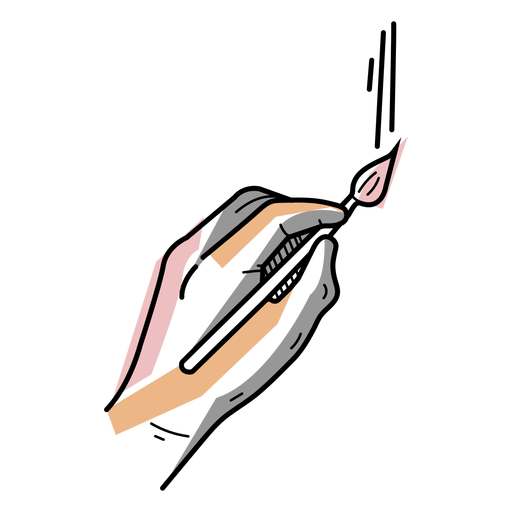
Artist hand paint brush stroke PNG Design
Choose a folder
All favorites
Create new
Save
Artist hand paint brush stroke PNG Design
Delivery transport diagram silhouette PNG Design
Choose a folder
All favorites
Create new
Save
Delivery transport diagram silhouette PNG Design
Premium
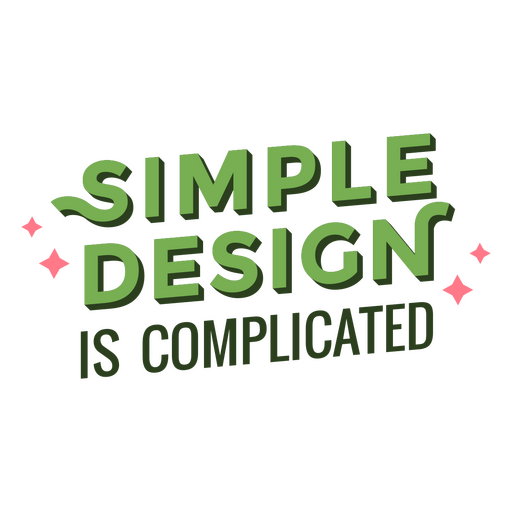
Simple design is complicated lettering quote PNG Design
Choose a folder
All favorites
Create new
Save
Simple design is complicated lettering quote PNG Design
Swirl victorian border ornament PNG Design
Choose a folder
All favorites
Create new
Save
Swirl victorian border ornament PNG Design
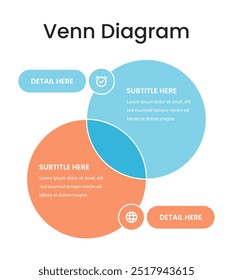
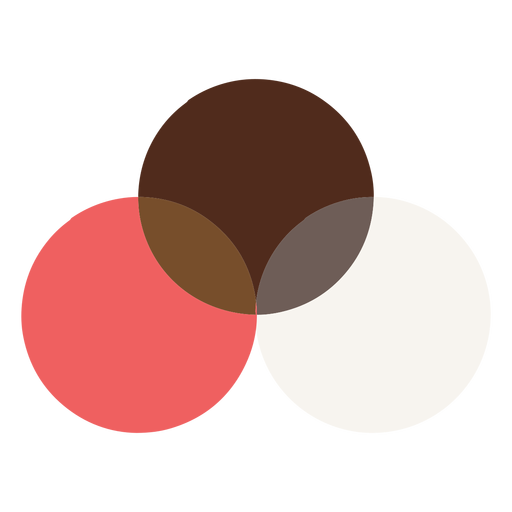
Venn diagram hand drawn element PNG Design
Choose a folder
All favorites
Create new
Save
Venn diagram hand drawn element PNG Design
Premium
Mosaic petal flower square badge sticker PNG Design
Choose a folder
All favorites
Create new
Save
Mosaic petal flower square badge sticker PNG Design
Premium
Remember to save lettering quote PNG Design
Choose a folder
All favorites
Create new
Save
Remember to save lettering quote PNG Design
Gaussian bell flat PNG Design
Choose a folder
All favorites
Create new
Save
Gaussian bell flat PNG Design
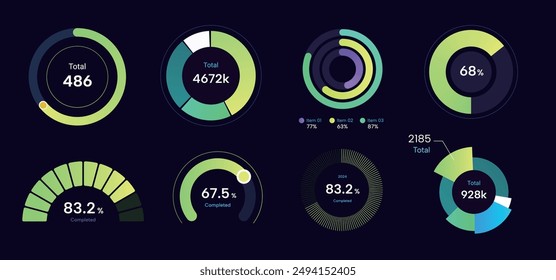
Blue grey growing linechart PNG Design
Choose a folder
All favorites
Create new
Save
Blue grey growing linechart PNG Design
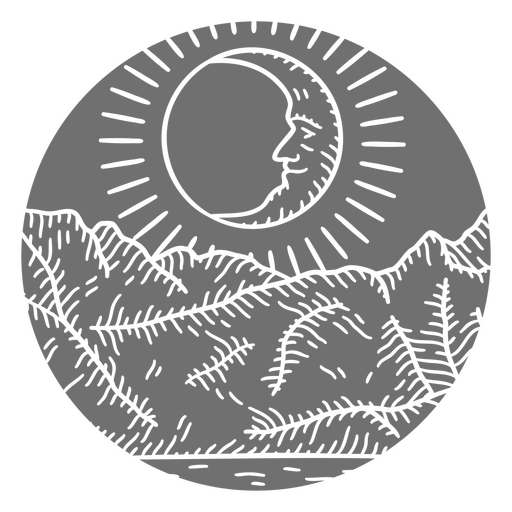
Mountain and night landscape cut out PNG Design
Choose a folder
All favorites
Create new
Save
Mountain and night landscape cut out PNG Design
Premium
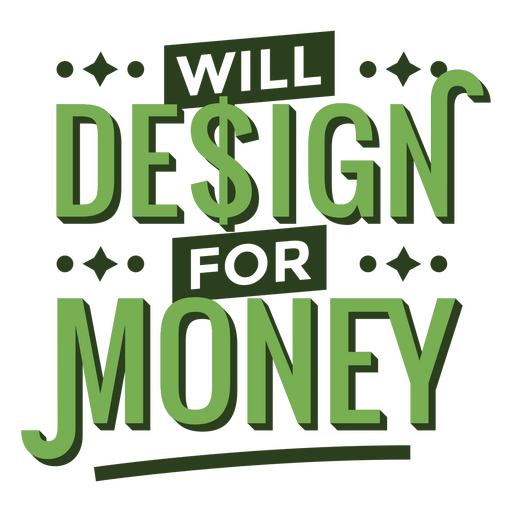
Design for money lettering quote PNG Design
Choose a folder
All favorites
Create new
Save
Design for money lettering quote PNG Design
Pyramid hand drawn icon PNG Design
Choose a folder
All favorites
Create new
Save
Pyramid hand drawn icon PNG Design
Premium
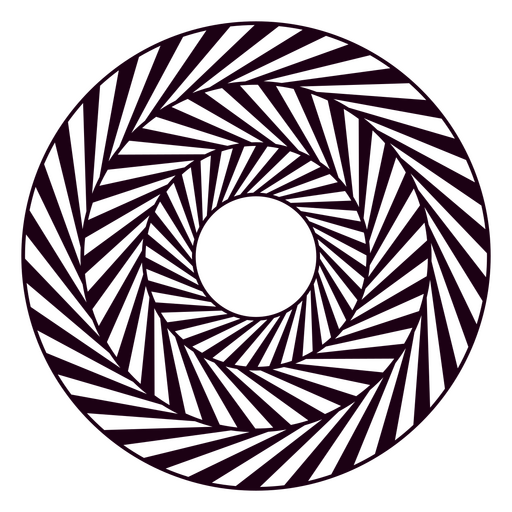
Black and purple spiral design PNG Design
Choose a folder
All favorites
Create new
Save
Black and purple spiral design PNG Design
Businessman in front pie icon PNG Design
Choose a folder
All favorites
Create new
Save
Businessman in front pie icon PNG Design
Premium
Half grey colorful piechart PNG Design
Choose a folder
All favorites
Create new
Save
Half grey colorful piechart PNG Design
Premium
Glossy piechart with boxes PNG Design
Choose a folder
All favorites
Create new
Save
Glossy piechart with boxes PNG Design
Flowery tile design PNG Design
Choose a folder
All favorites
Create new
Save
Flowery tile design PNG Design
Premium
Remember to save stroke quote PNG Design
Choose a folder
All favorites
Create new
Save
Remember to save stroke quote PNG Design
Premium
Faith over fear tee PNG Design
Choose a folder
All favorites
Create new
Save
Faith over fear tee PNG Design
Premium
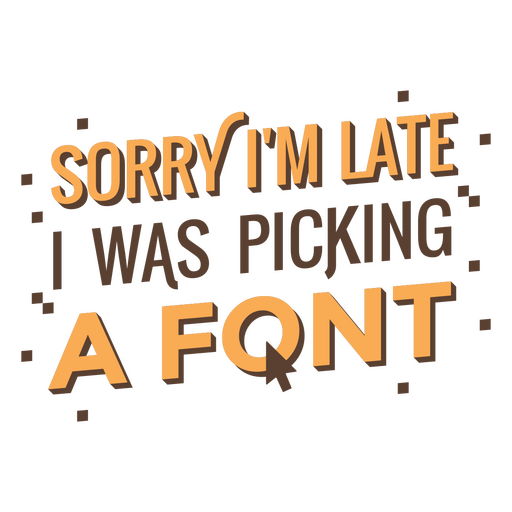
Picking a font quote lettering PNG Design
Choose a folder
All favorites
Create new
Save
Picking a font quote lettering PNG Design
Premium
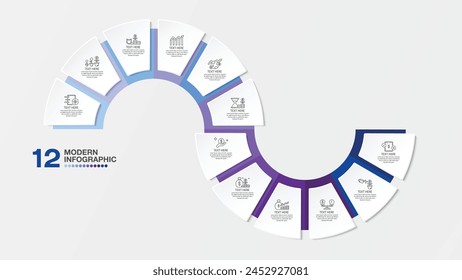
Quarter half infographic PNG Design
Choose a folder
All favorites
Create new
Save
Quarter half infographic PNG Design
Premium
Born to sparkle forced to work PNG Design
Choose a folder
All favorites
Create new
Save
Born to sparkle forced to work PNG Design
Premium
Pixelated letter r PNG Design
Choose a folder
All favorites
Create new
Save
Pixelated letter r PNG Design
Premium
Red square with an x in it PNG Design
Choose a folder
All favorites
Create new
Save
Red square with an x in it PNG Design
Premium
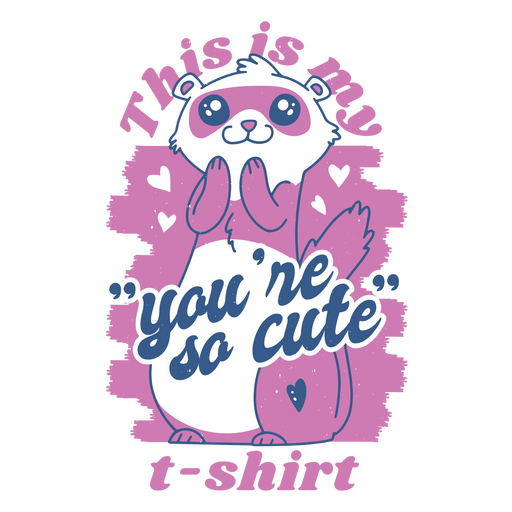
This is my you're cute t - shirt PNG Design
Choose a folder
All favorites
Create new
Save
This is my you're cute t - shirt PNG Design
Premium
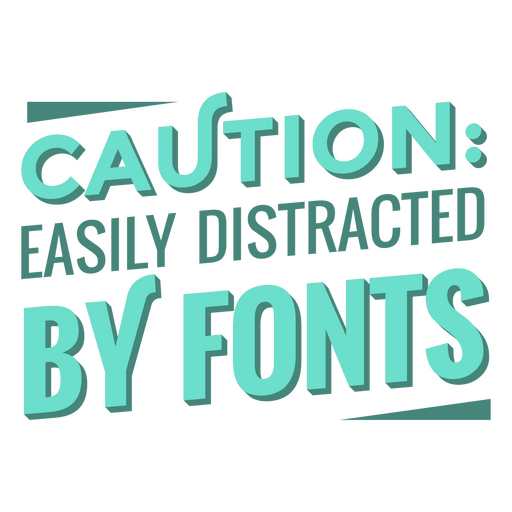
Distracted by fonts quote lettering PNG Design
Choose a folder
All favorites
Create new
Save
Distracted by fonts quote lettering PNG Design
Premium
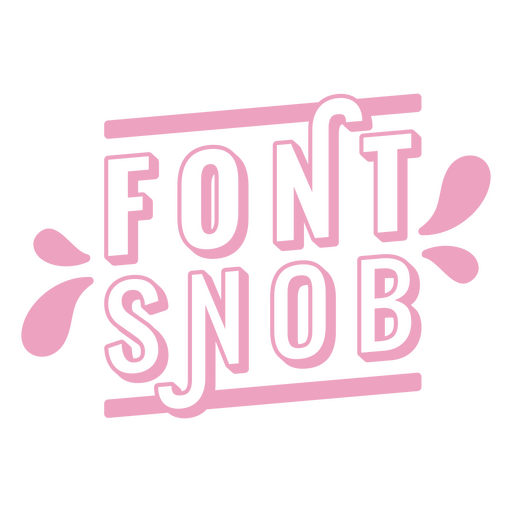
Font snob stroke quote PNG Design
Choose a folder
All favorites
Create new
Save
Font snob stroke quote PNG Design
Premium
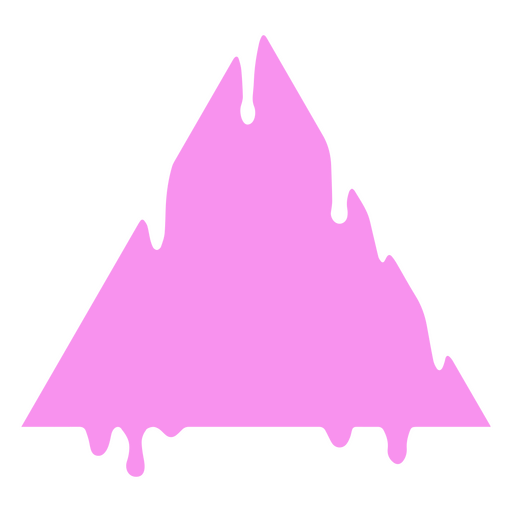
Pink triangle with dripping liquid on it PNG Design
Choose a folder
All favorites
Create new
Save
Pink triangle with dripping liquid on it PNG Design
Premium
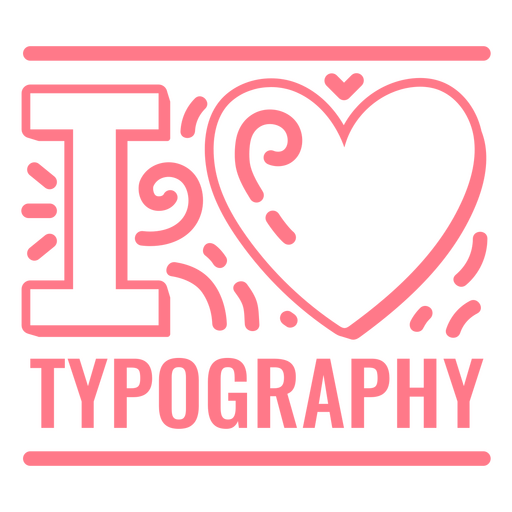
I love typography quote stroke PNG Design
Choose a folder
All favorites
Create new
Save
I love typography quote stroke PNG Design
Premium
Mosaic petal flower detailed silhouette PNG Design
Choose a folder
All favorites
Create new
Save
Mosaic petal flower detailed silhouette PNG Design
Premium
LGBTQ loud and proud pride sheep PNG Design
Choose a folder
All favorites
Create new
Save
LGBTQ loud and proud pride sheep PNG Design
Premium
Black and white drawing of a pencil icon PNG Design
Choose a folder
All favorites
Create new
Save
Black and white drawing of a pencil icon PNG Design
Premium
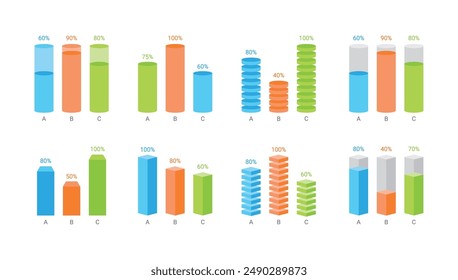
Colorful bars infograph 8 PNG Design
Choose a folder
All favorites
Create new
Save
Colorful bars infograph 8 PNG Design
Premium
Two sided colorful bar plot PNG Design
Choose a folder
All favorites
Create new
Save
Two sided colorful bar plot PNG Design
Premium
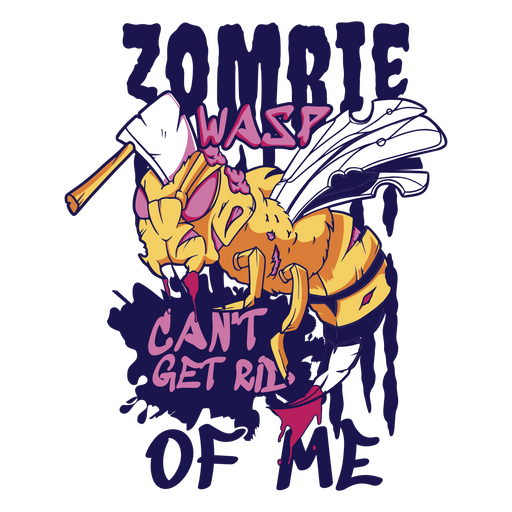
Zombie wasp can't get rid of me PNG Design
Choose a folder
All favorites
Create new
Save
Zombie wasp can't get rid of me PNG Design
Premium
Orange icon doodle PNG Design
Choose a folder
All favorites
Create new
Save
Orange icon doodle PNG Design
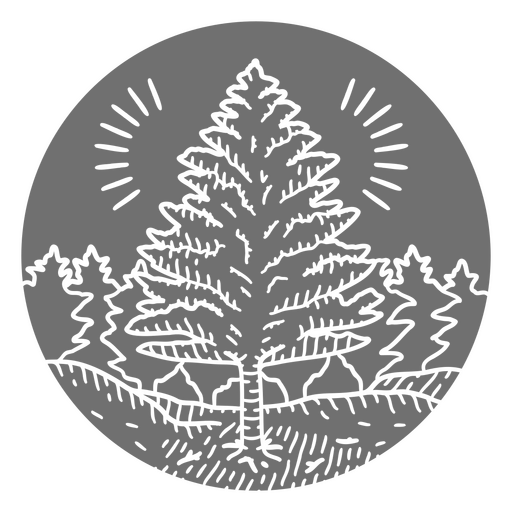
Pine tree natural element cut out PNG Design
Choose a folder
All favorites
Create new
Save
Pine tree natural element cut out PNG Design
Tile circle rhomb PNG Design
Choose a folder
All favorites
Create new
Save
Tile circle rhomb PNG Design
Premium
Mosaic rhomb hexahedron stroke PNG Design
Choose a folder
All favorites
Create new
Save
Mosaic rhomb hexahedron stroke PNG Design
Premium
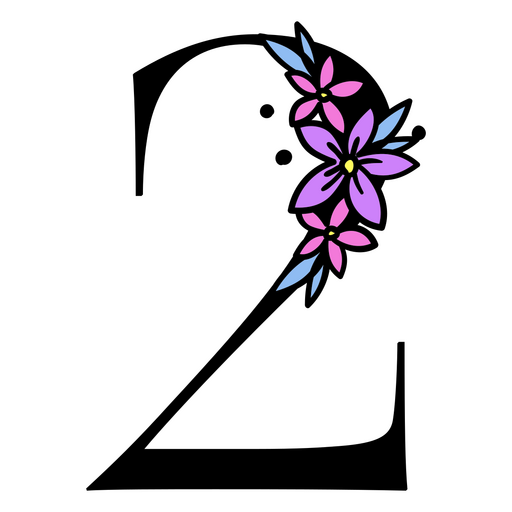
Purple flowers on the number 2 PNG Design
Choose a folder
All favorites
Create new
Save
Purple flowers on the number 2 PNG Design
Premium
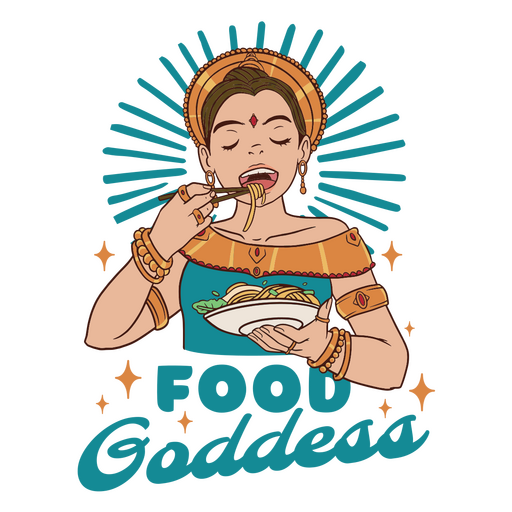
Food goddess international PNG Design
Choose a folder
All favorites
Create new
Save
Food goddess international PNG Design
Premium
Rainbow logo doodle PNG Design
Choose a folder
All favorites
Create new
Save
Rainbow logo doodle PNG Design
Premium
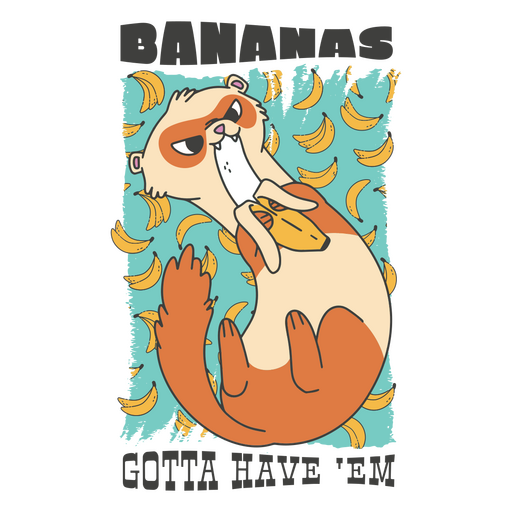
Bananas gotta have em otter cartoon PNG Design
Choose a folder
All favorites
Create new
Save
Bananas gotta have em otter cartoon PNG Design
Premium
Arrow loop icon PNG Design
Choose a folder
All favorites
Create new
Save
Arrow loop icon PNG Design
Premium
Mushroom icon gray doodle PNG Design
Choose a folder
All favorites
Create new
Save
Mushroom icon gray doodle PNG Design
Boost Your Business
With The Leading Graphic Platform For Merch.
SEE PLANS
Next
of 27
prev page
next page