Design Library
Explore Designs
New Merch Designs
Trending Merch Designs
Vectors
PNGs & SVGs
Mockups
T-Shirts
T-Shirt PSD Templates
KDP Designs
Phone Cases
Pillows
Tote Bags
Posters
Mugs
Design Tools
Designer
New!
T-shirt Maker
Mockup Generator
Quote Generator
Logo Maker
Resources
Merch Digest
Blog
Help Center
Creators Program
Learn About Merch
Changelog
API Access
Pricing
Loading...
Sign Up
Login
All
grafico
Design Library
Explore Designs
New Merch Designs
Trending Merch Designs
Vectors
PNGs & SVGs
Mockups
T-Shirts
T-Shirt PSD Templates
KDP Designs
Phone Cases
Pillows
Tote Bags
Posters
Mugs
Design Tools
Designer
New!
T-shirt Maker
Mockup Generator
Quote Generator
Logo Maker
Resources
Merch Digest
Blog
Help Center
Creators Program
Learn About Merch
Changelog
API Access
PLANS
All
grafico
40815 grafico designs graphics for t-shirt and print on demand merch
Download grafico t-shirt designs and other merch graphics like book covers, phone cases, tote bags and more.
Sort by
Most relevant
Sponsored results by
Get 15% off with code: VEXELS15
Show more
Print ready
for Merch
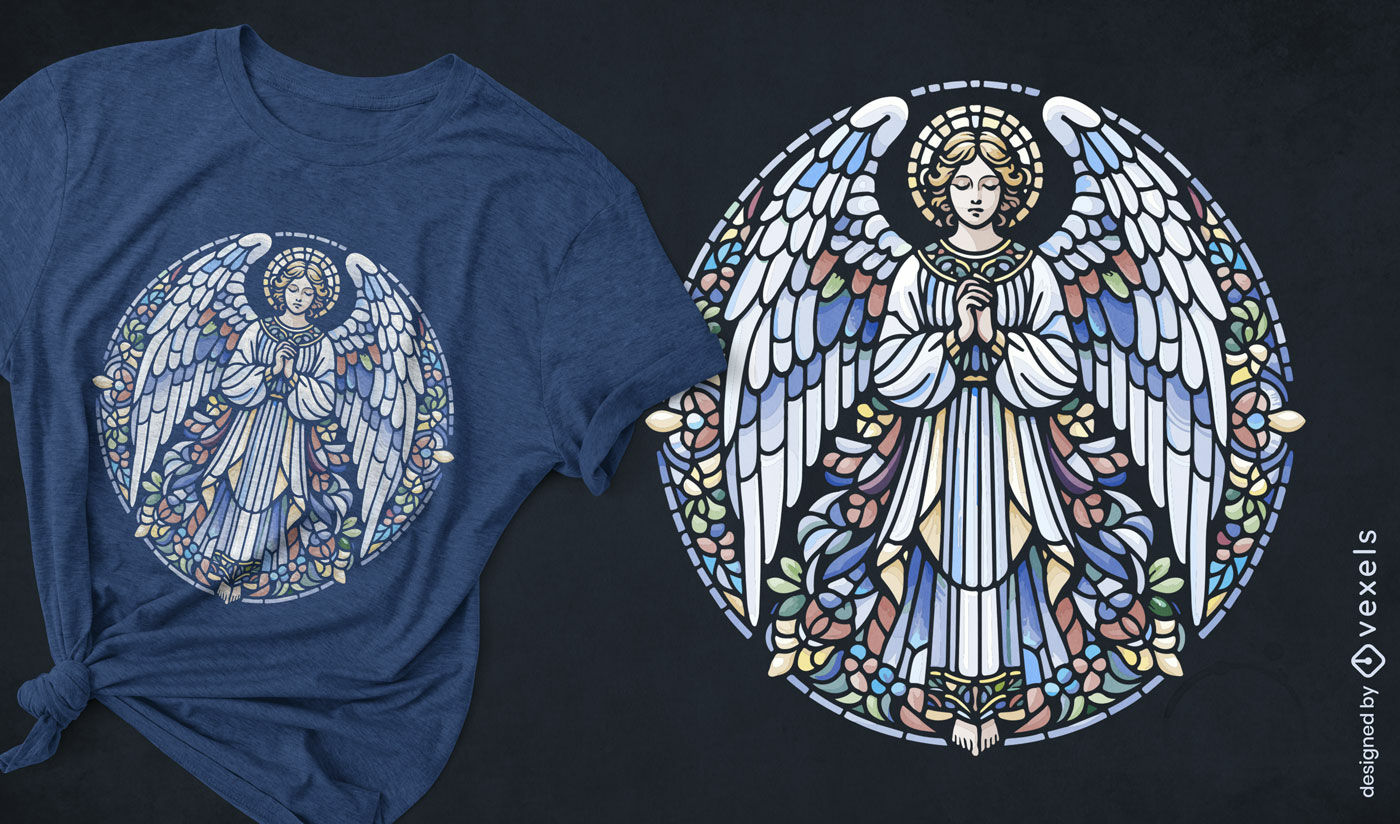
Stained glass angel t-shirt design
Choose a folder
All favorites
Create new
Save
Stained glass angel t-shirt design
Editable text
Print ready
for Merch
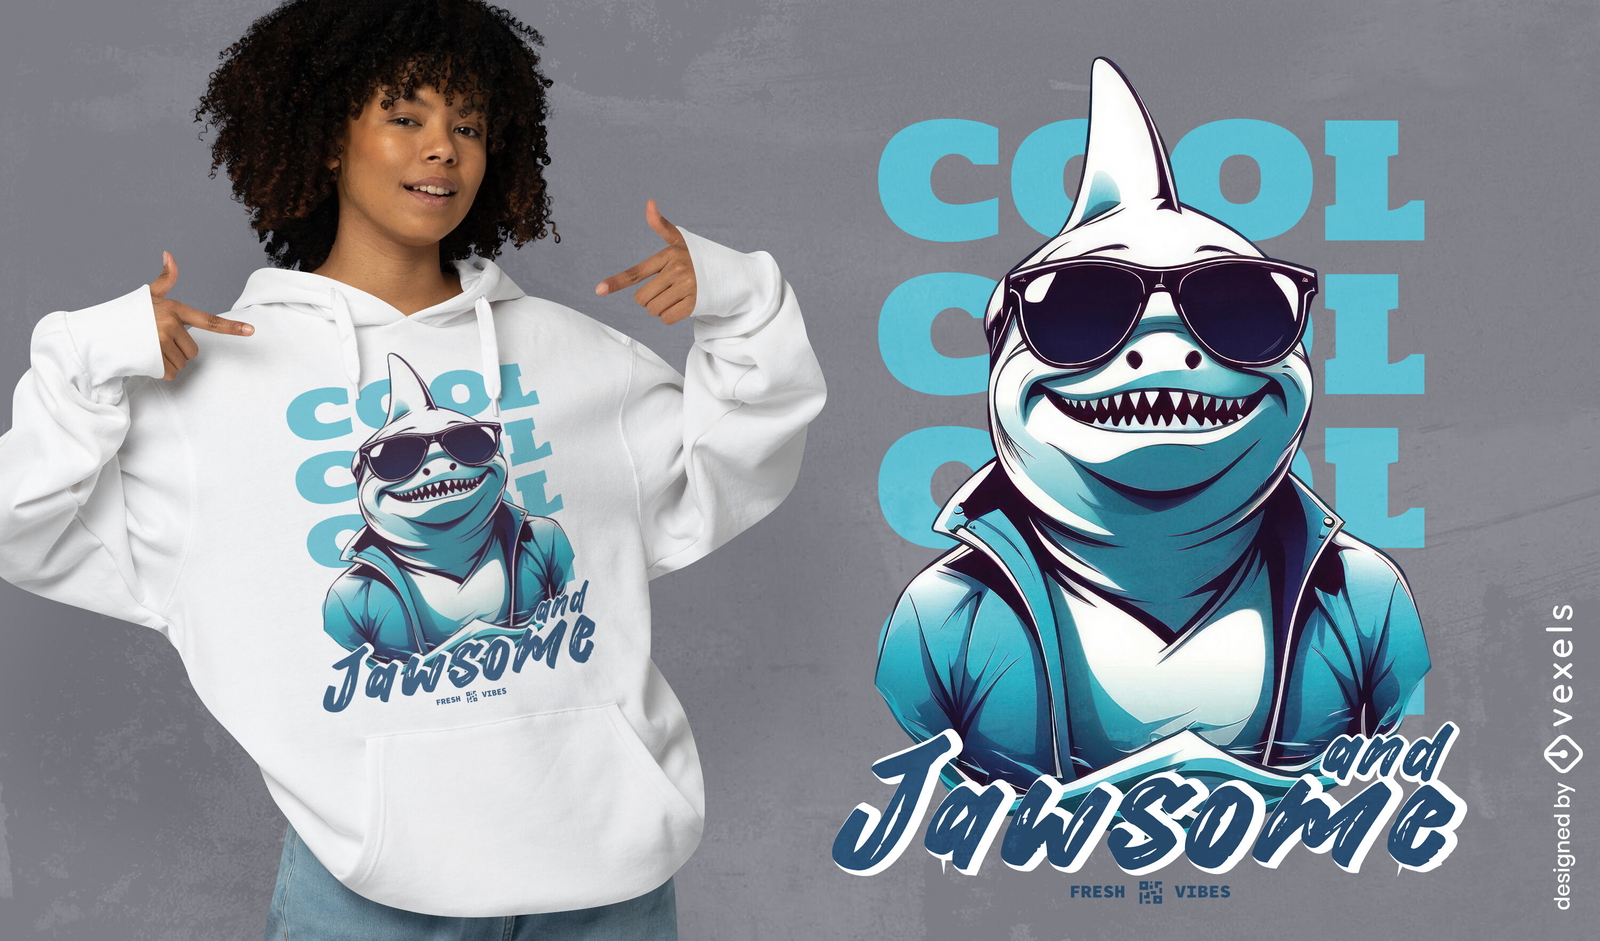
Cool shark t-shirt design
Choose a folder
All favorites
Create new
Save
Cool shark t-shirt design
Print ready
for Merch
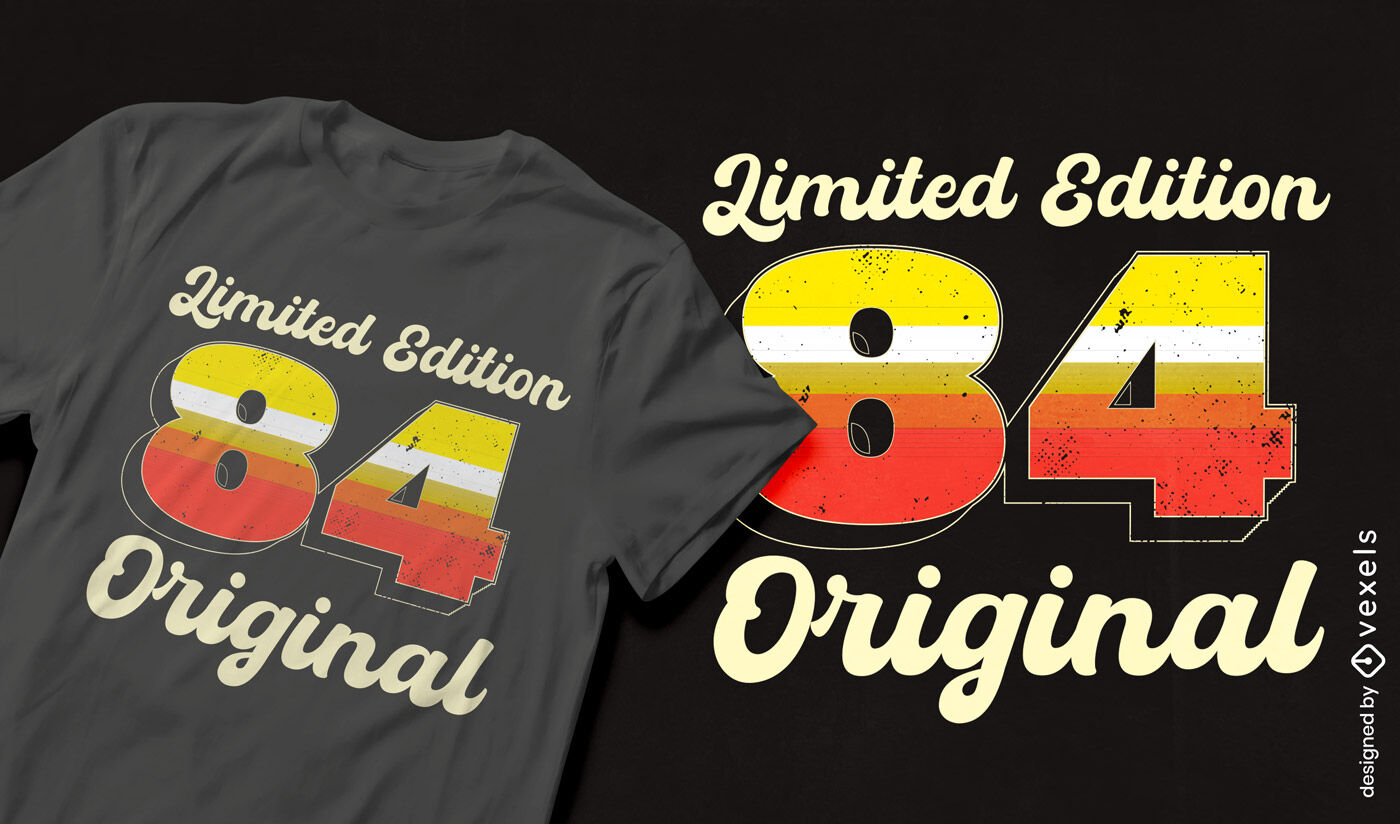
Vintage limited edition 84 t-shirt design
Choose a folder
All favorites
Create new
Save
Vintage limited edition 84 t-shirt design
Print ready
for Merch
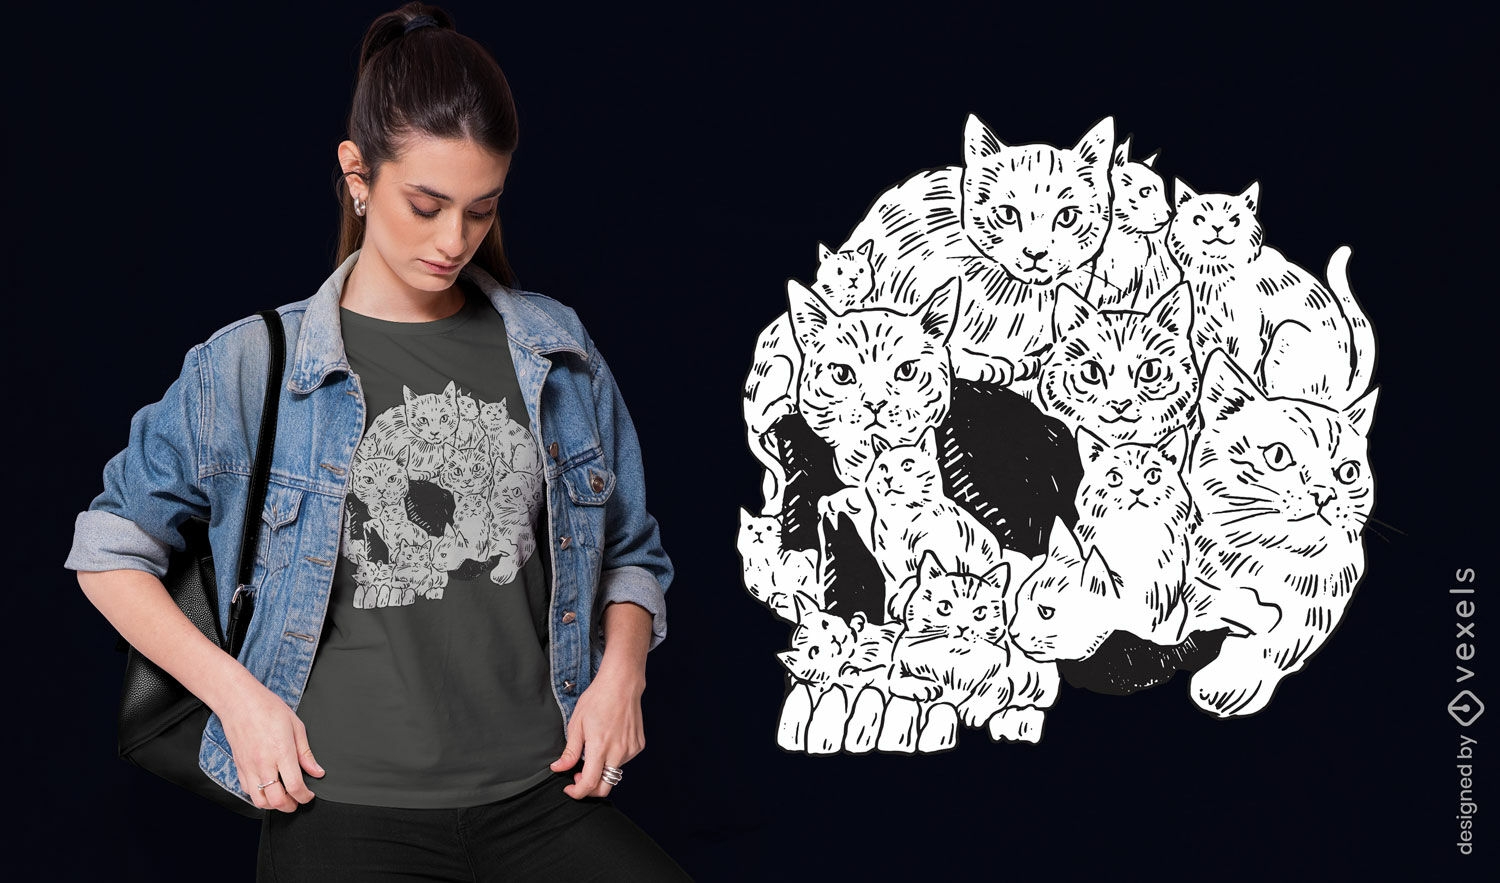
Cat skull cluster t-shirt design
Choose a folder
All favorites
Create new
Save
Cat skull cluster t-shirt design
Print ready
for Merch
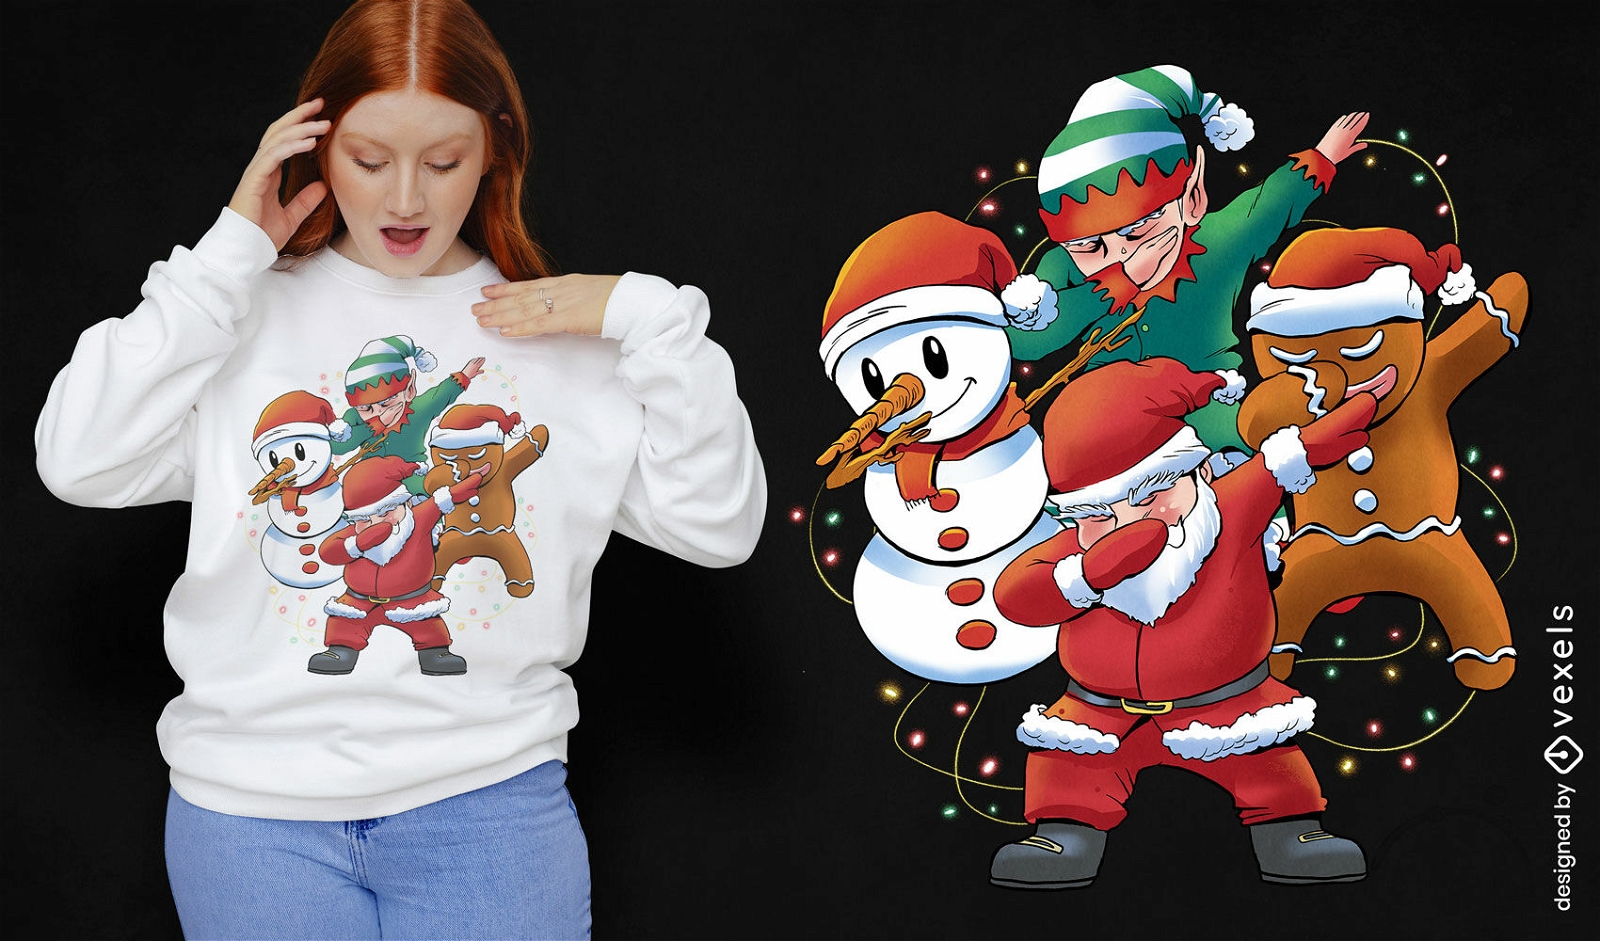
Dabbing Christmas characters and lights t-shirt design
Choose a folder
All favorites
Create new
Save
Dabbing Christmas characters and lights t-shirt design
Editable text
Print ready
for Merch
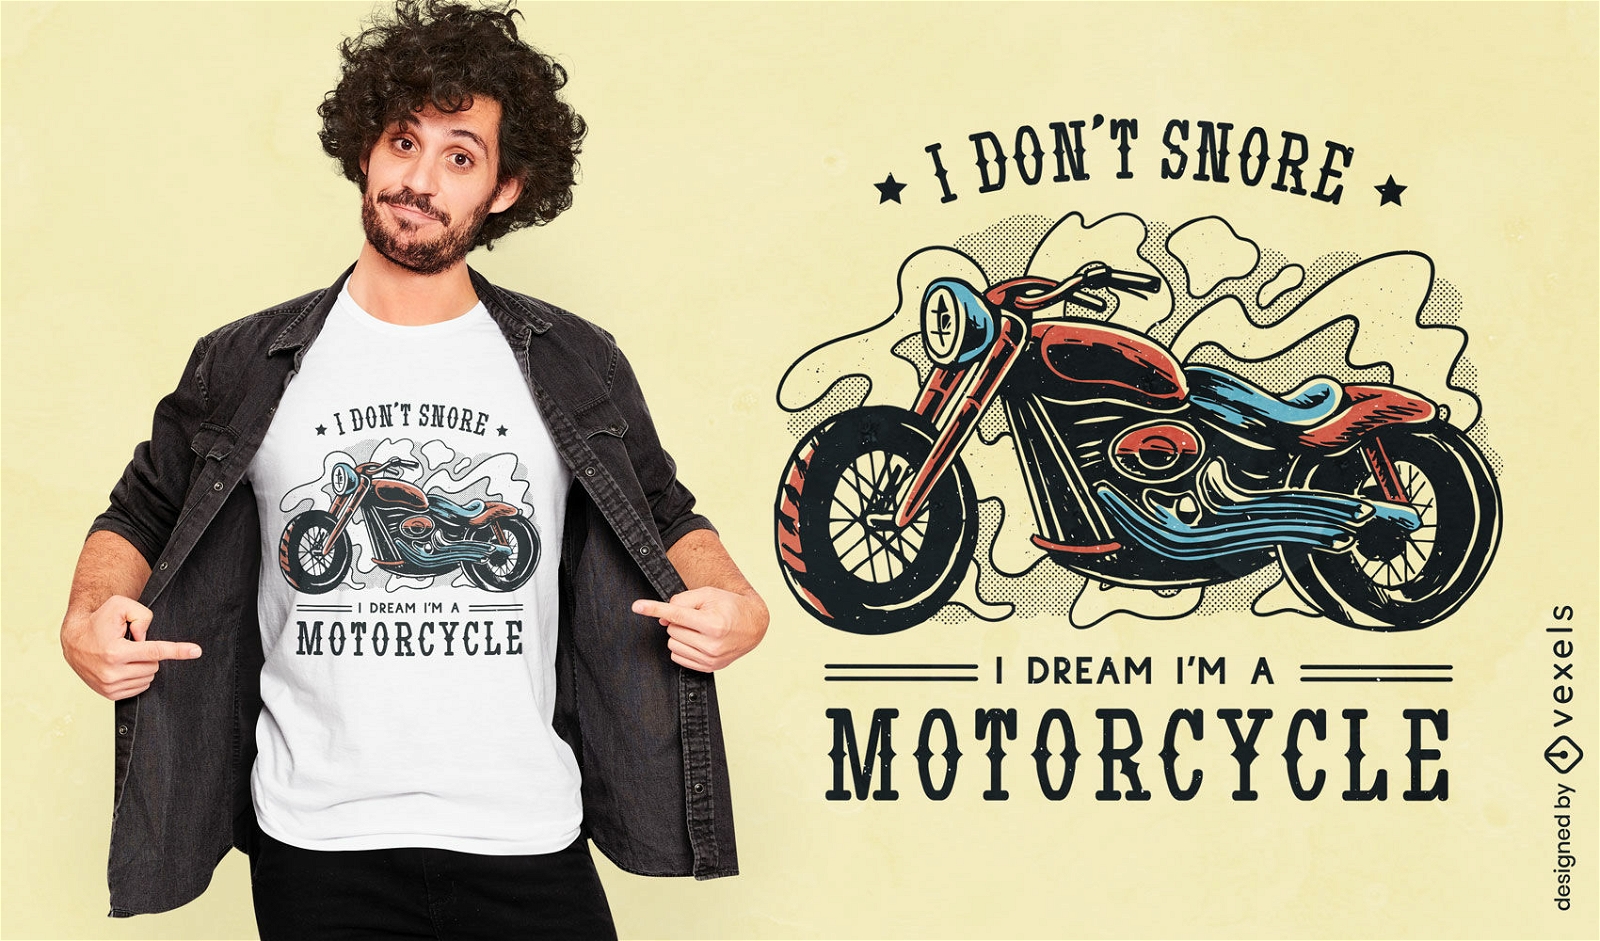
Funny motorcycle quote t-shirt design
Choose a folder
All favorites
Create new
Save
Funny motorcycle quote t-shirt design
Print ready
for Merch
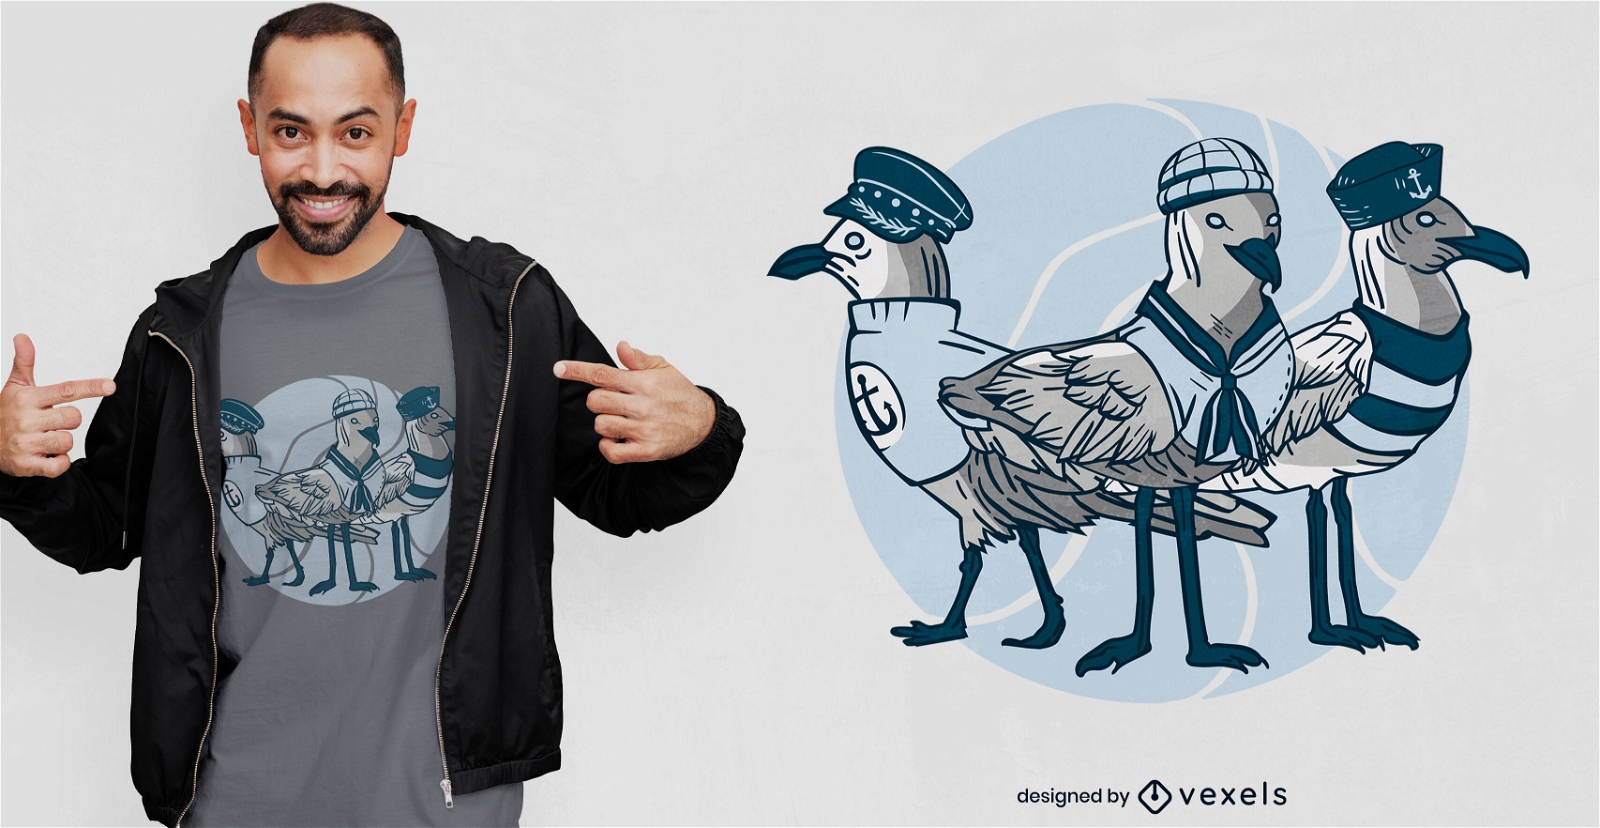
Sailor seagull birds t-shirt design
Choose a folder
All favorites
Create new
Save
Sailor seagull birds t-shirt design
Print ready
for Merch
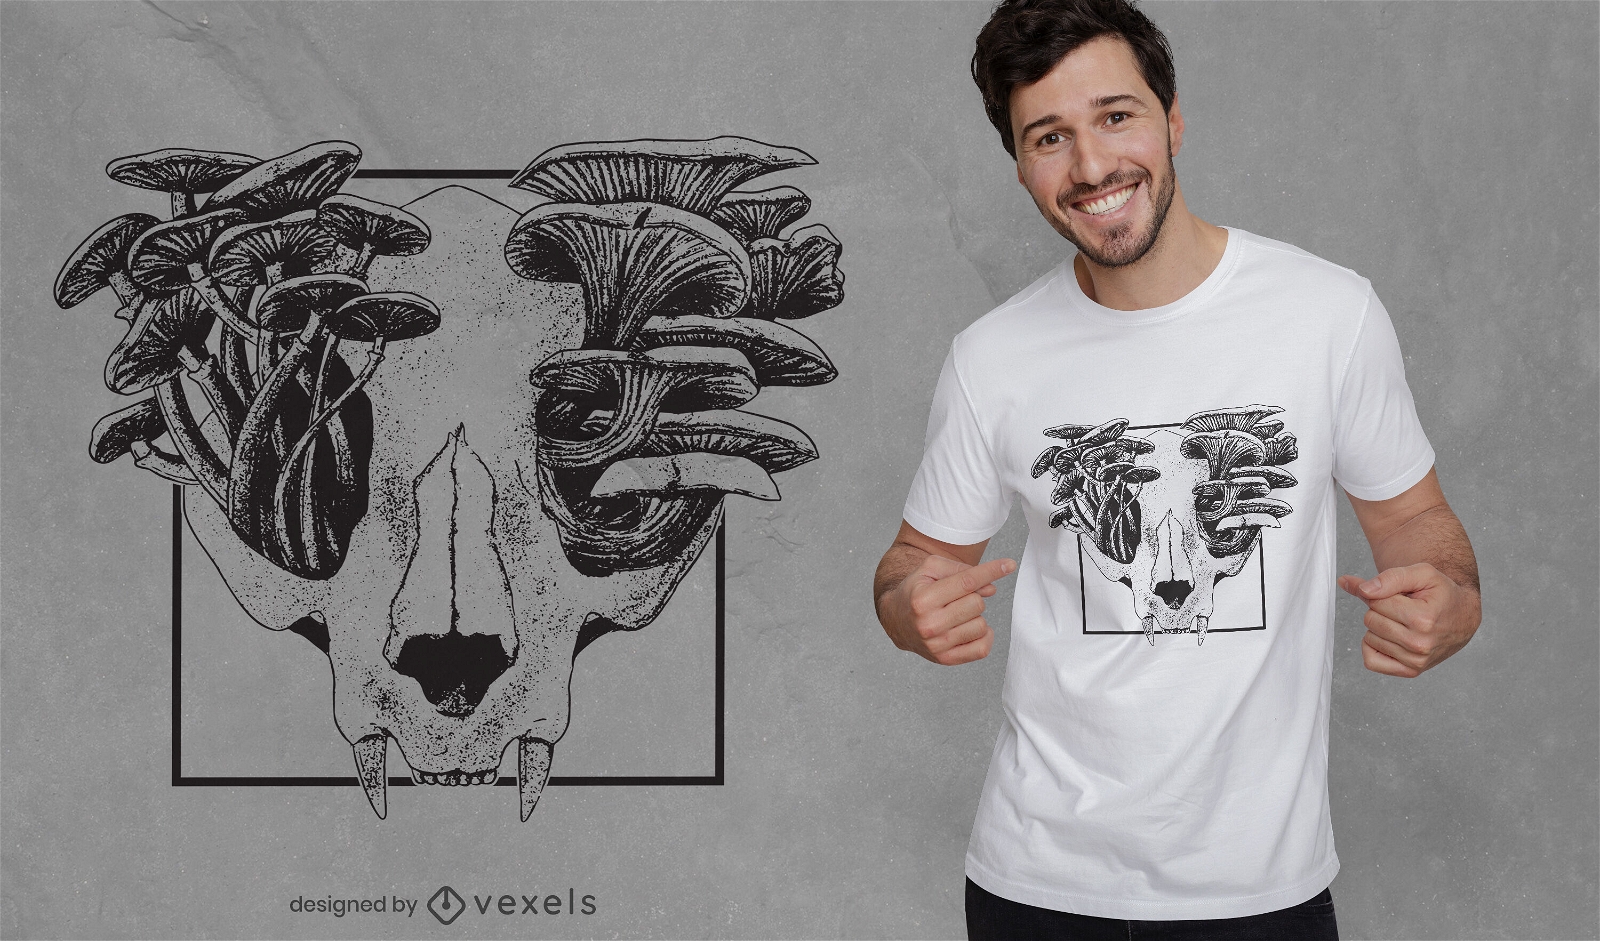
Skull with mushrooms t-shirt deisgn
Choose a folder
All favorites
Create new
Save
Skull with mushrooms t-shirt deisgn
Print ready
for Merch
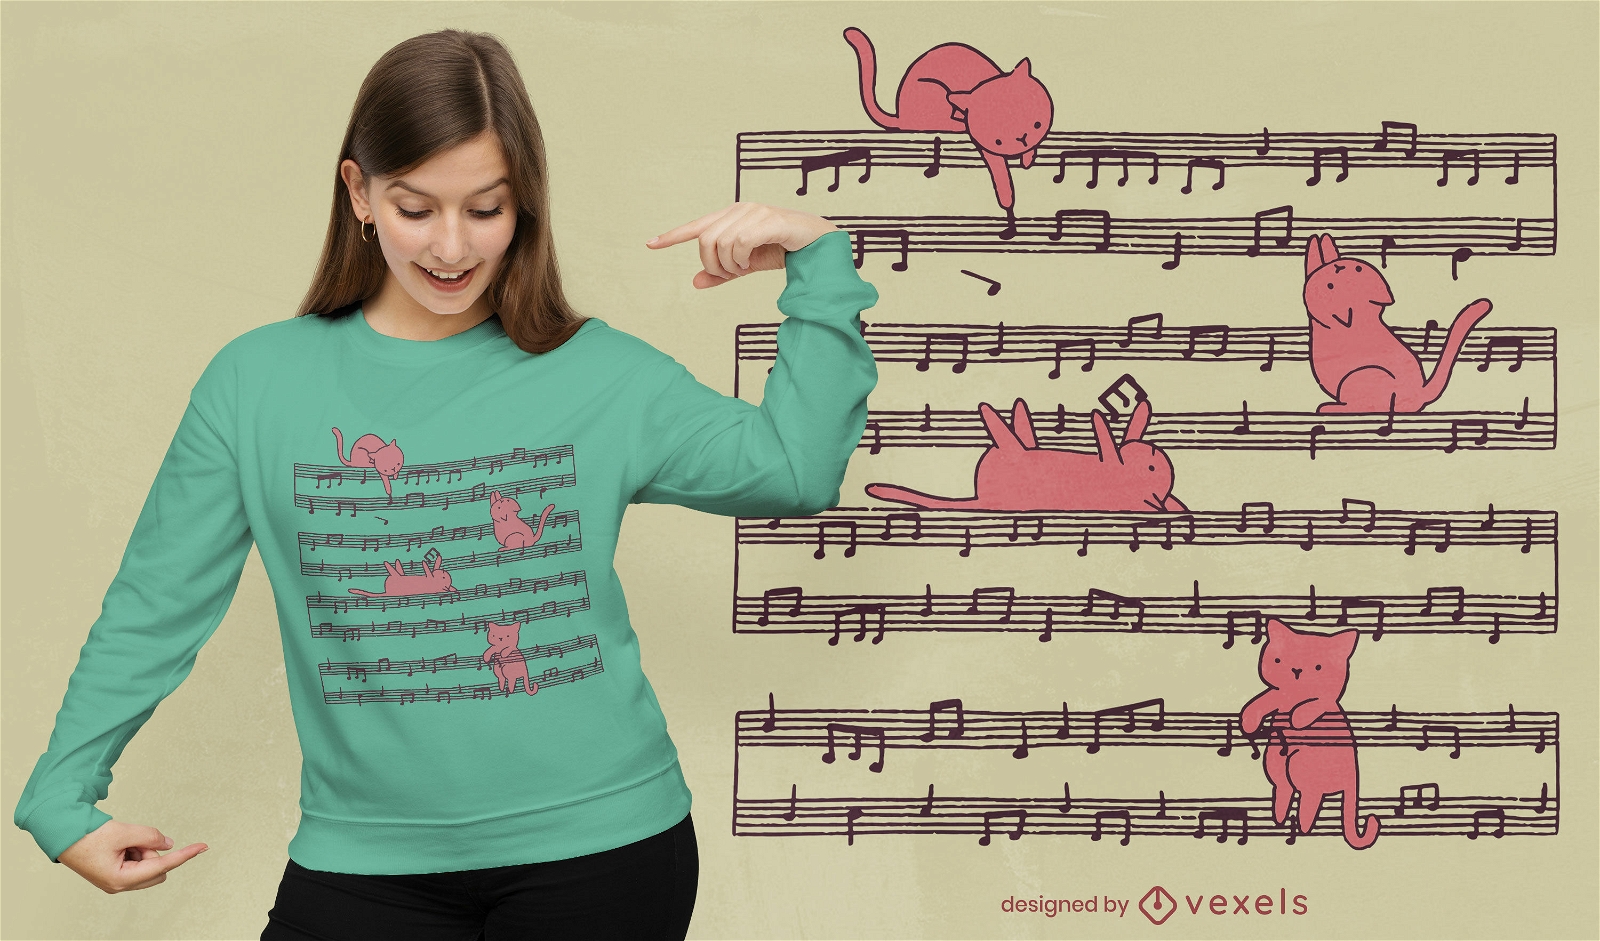
Cute music sheet cats t-shirt design
Choose a folder
All favorites
Create new
Save
Cute music sheet cats t-shirt design
Print ready
for Merch
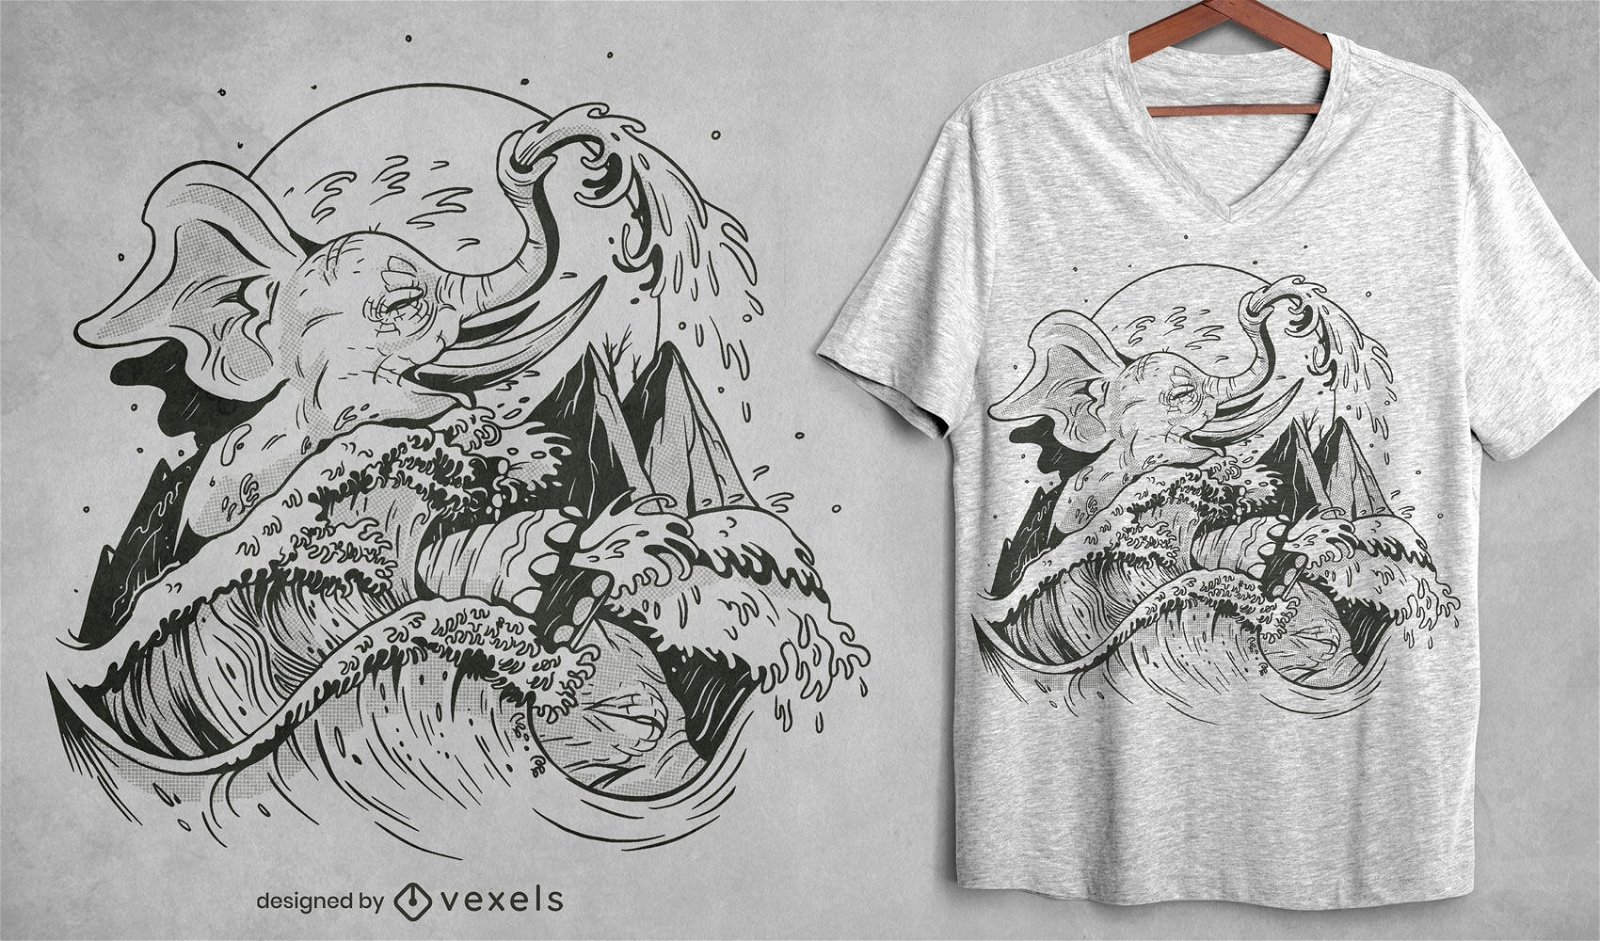
Elephant and wave hand drawn t-shirt design
Choose a folder
All favorites
Create new
Save
Elephant and wave hand drawn t-shirt design
Editable text
Print ready
for Merch
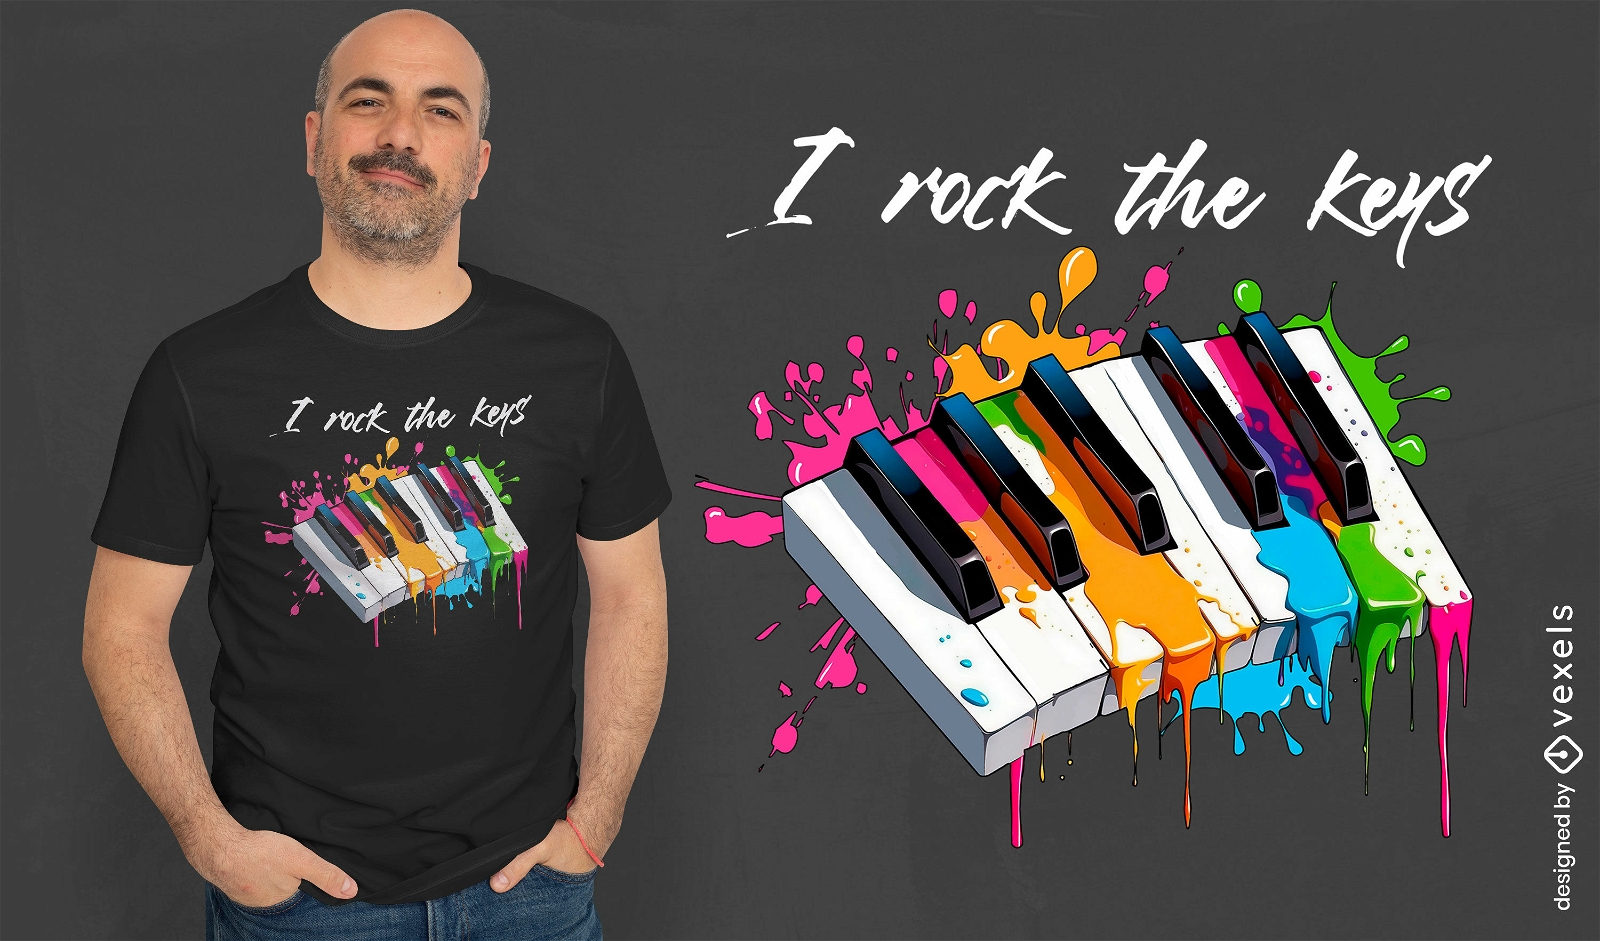
Colorful piano keys t-shirt design
Choose a folder
All favorites
Create new
Save
Colorful piano keys t-shirt design
Print ready
for Merch
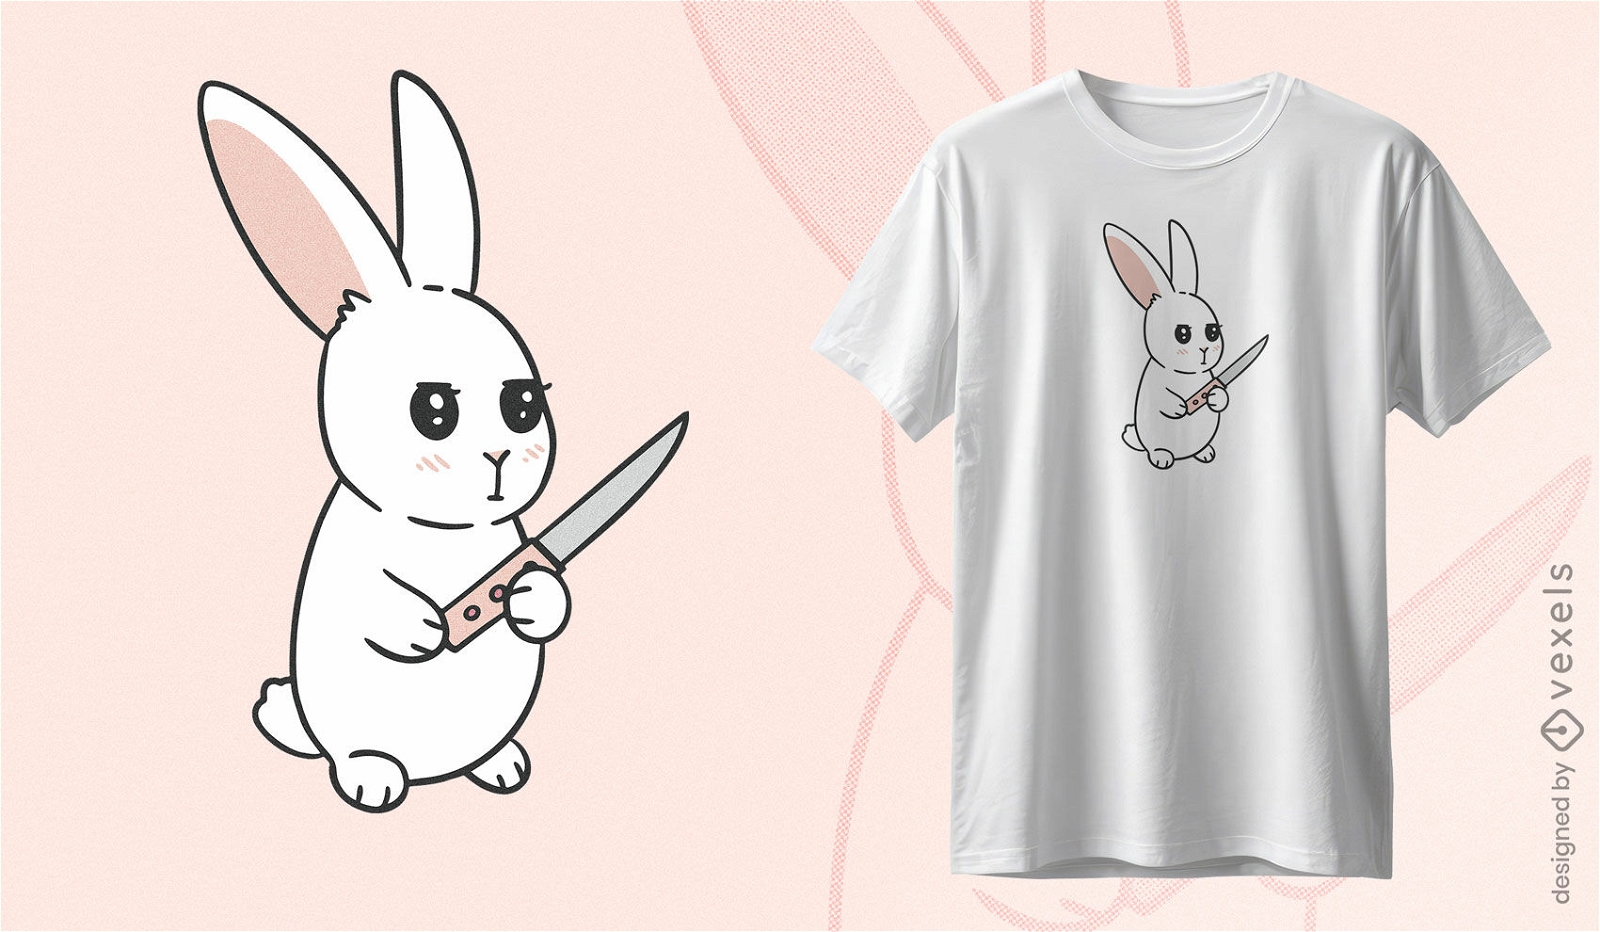
Menacing bunny t-shirt design
Choose a folder
All favorites
Create new
Save
Menacing bunny t-shirt design
Editable text
Print ready
for Merch
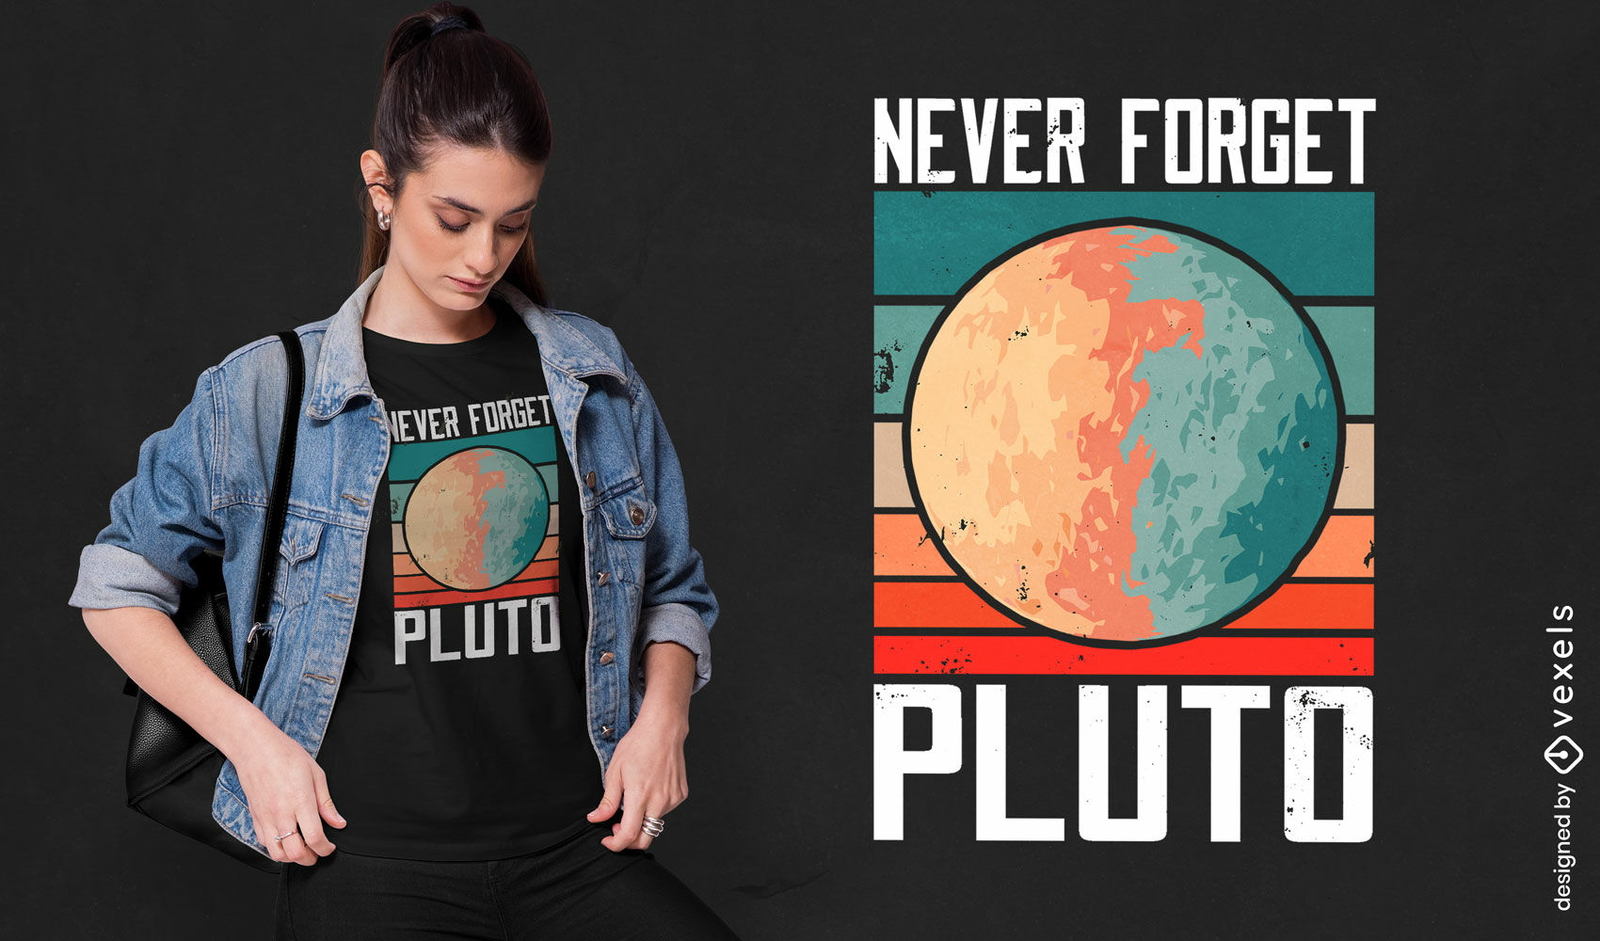
Retro sunset pluto planet t-shirt design
Choose a folder
All favorites
Create new
Save
Retro sunset pluto planet t-shirt design
Print ready
for Merch
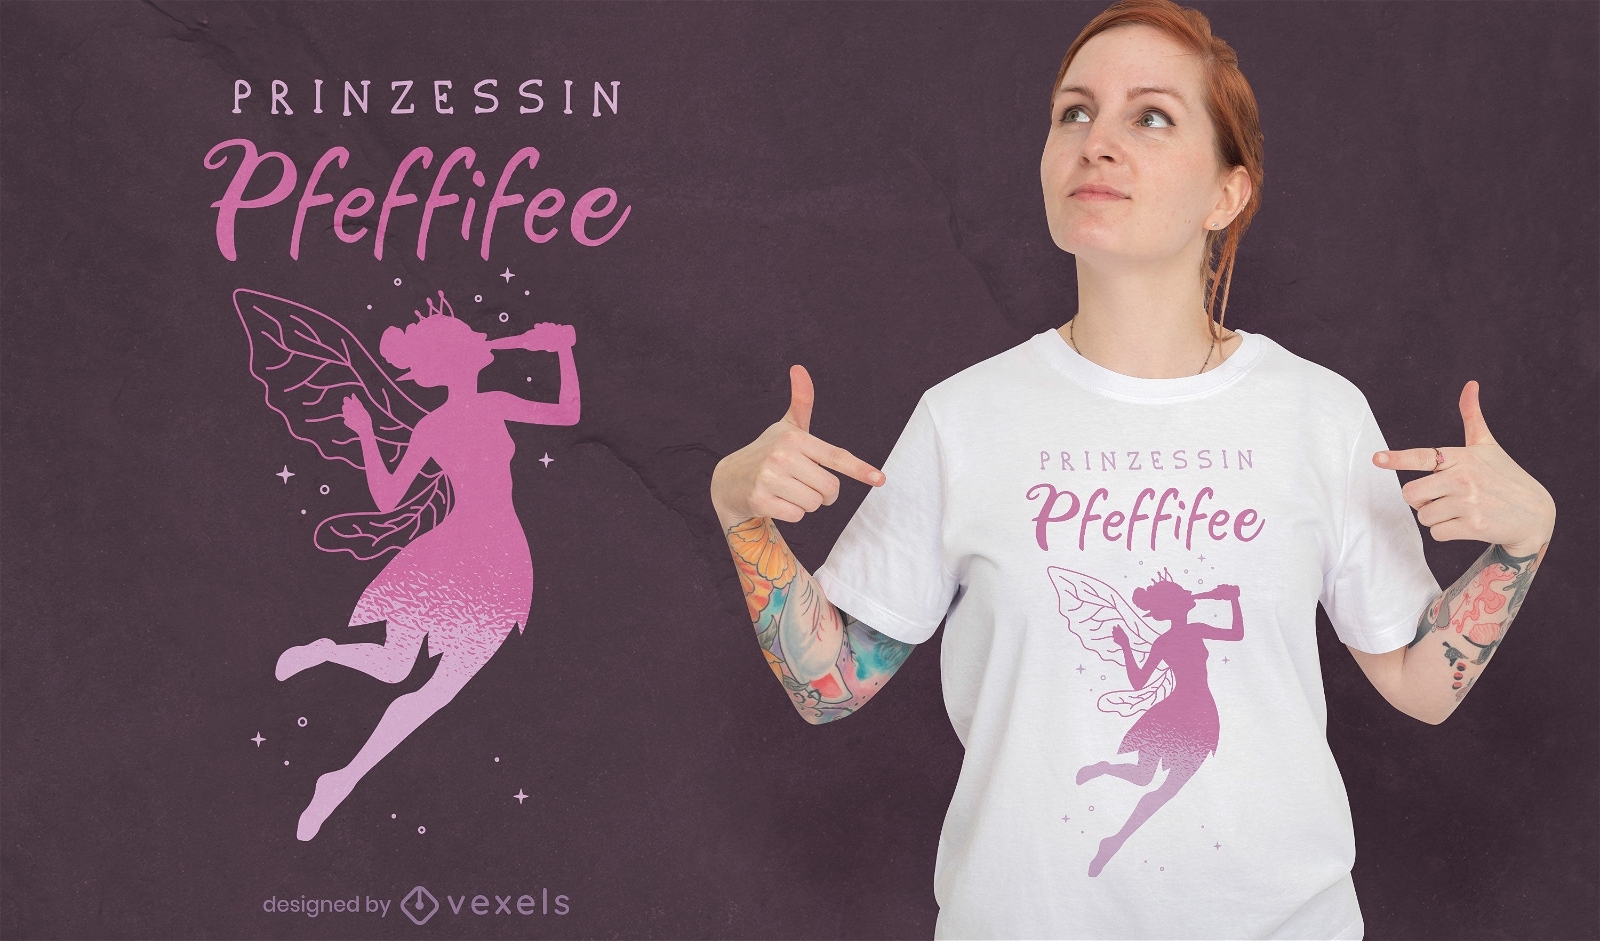
Magical fairy girl drinking t-shirt design
Choose a folder
All favorites
Create new
Save
Magical fairy girl drinking t-shirt design
Print ready
for Merch
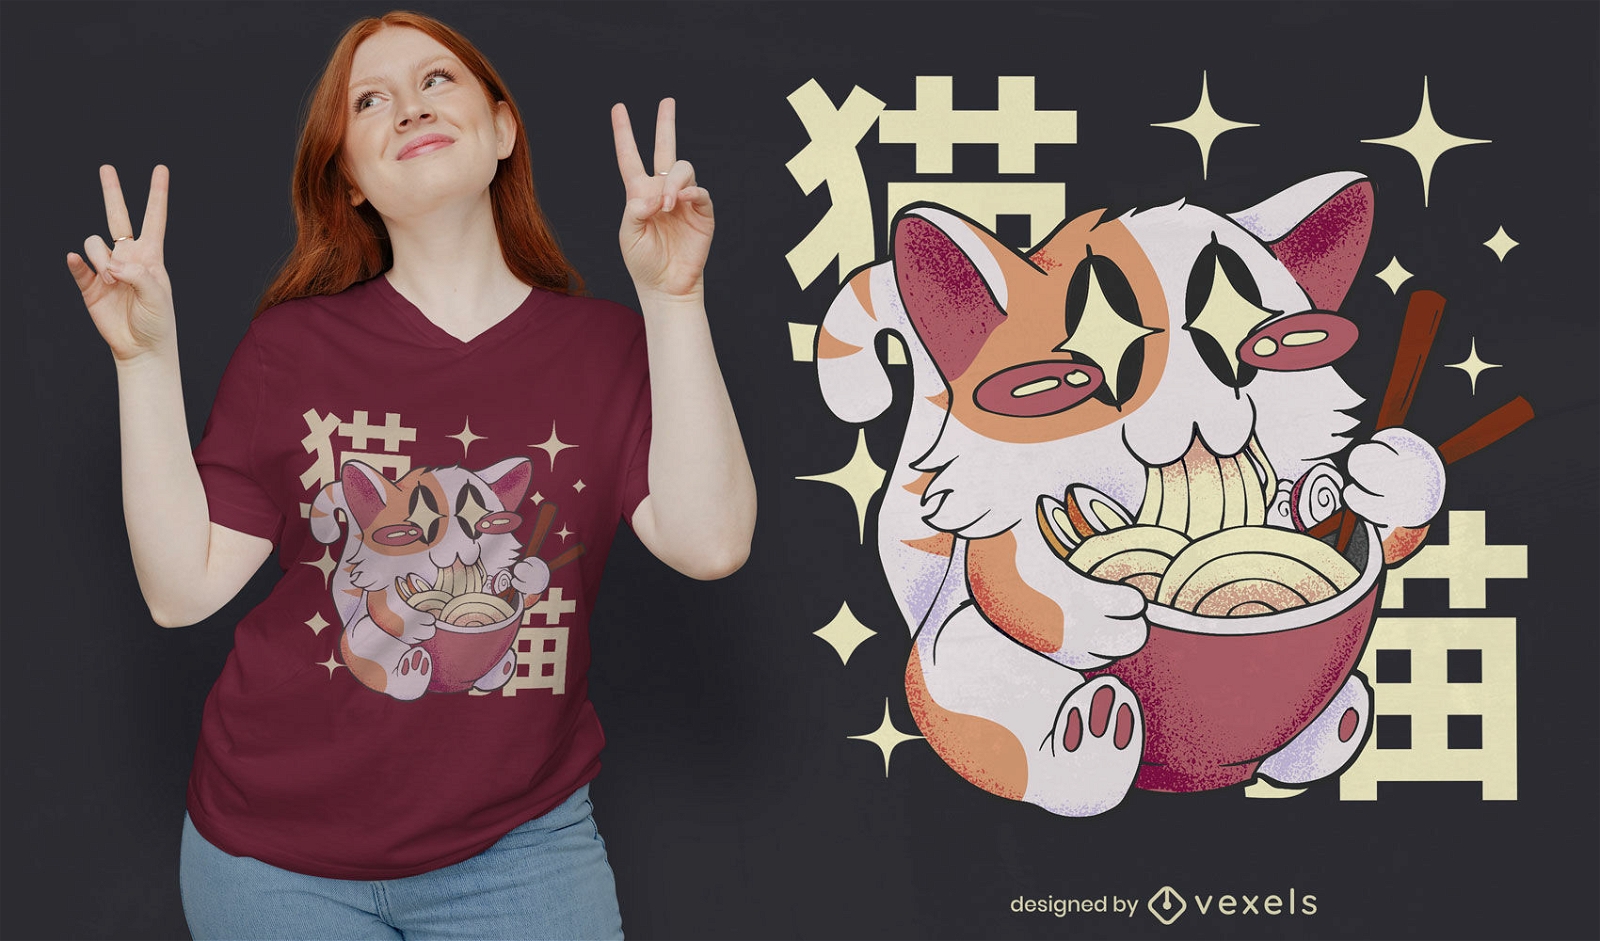
Cat eating ramen food t-shirt design
Choose a folder
All favorites
Create new
Save
Cat eating ramen food t-shirt design
Print ready
for Merch
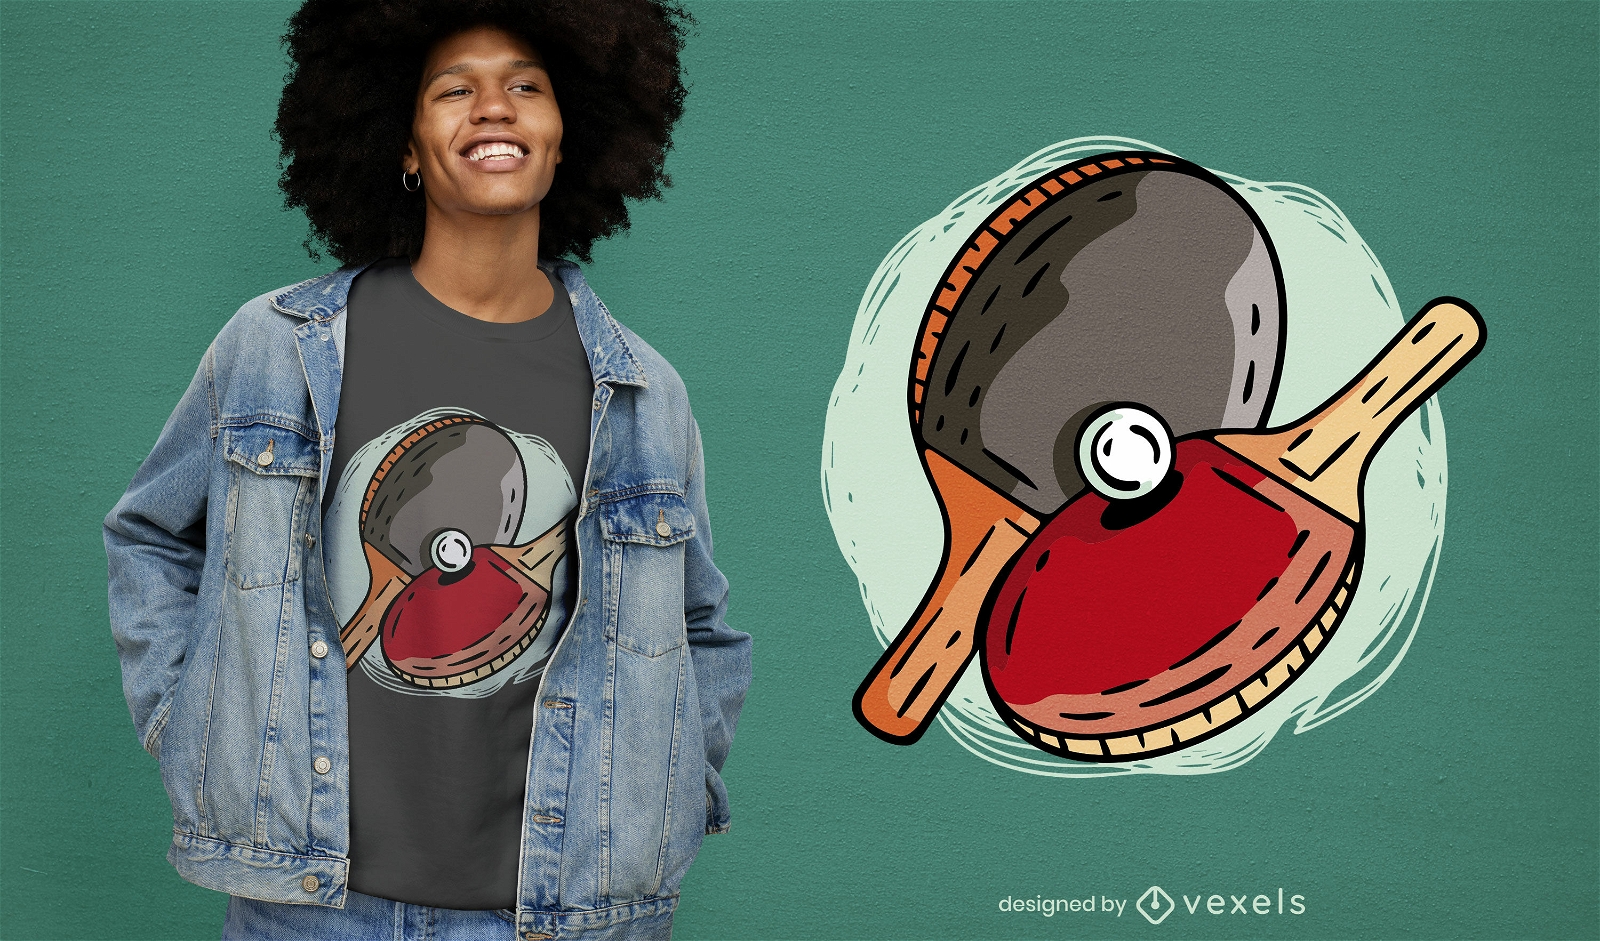
Ping pong paddles sport t-shirt design
Choose a folder
All favorites
Create new
Save
Ping pong paddles sport t-shirt design
Print ready
for Merch
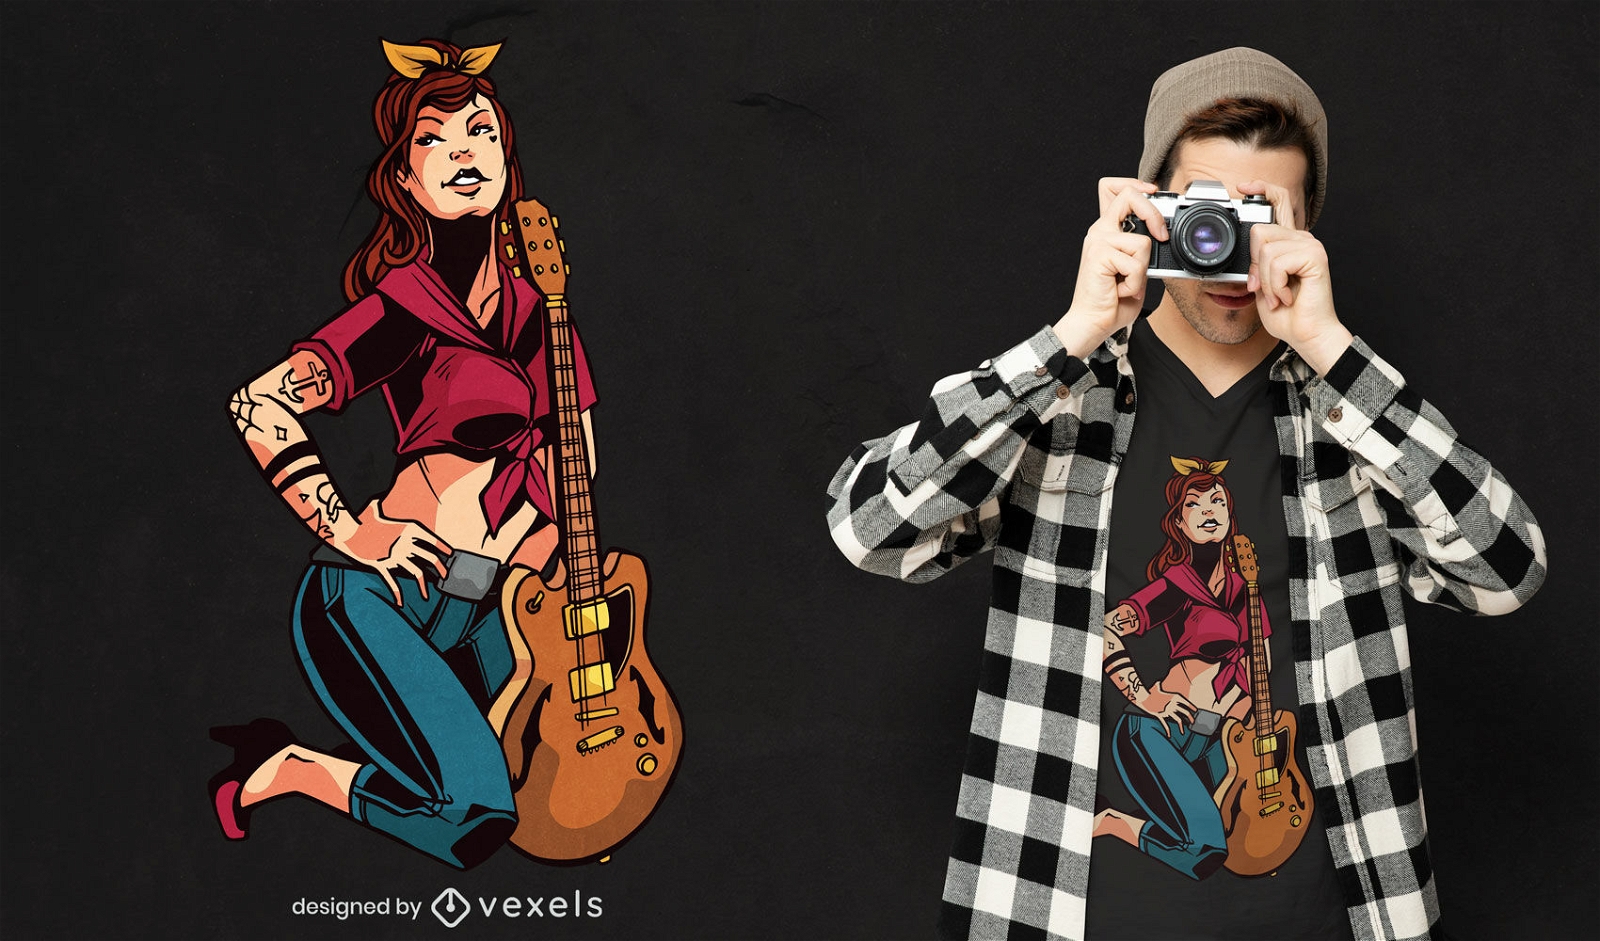
Rockabilly pin up girl with guitar t-shirt design
Choose a folder
All favorites
Create new
Save
Rockabilly pin up girl with guitar t-shirt design
Print ready
for Merch
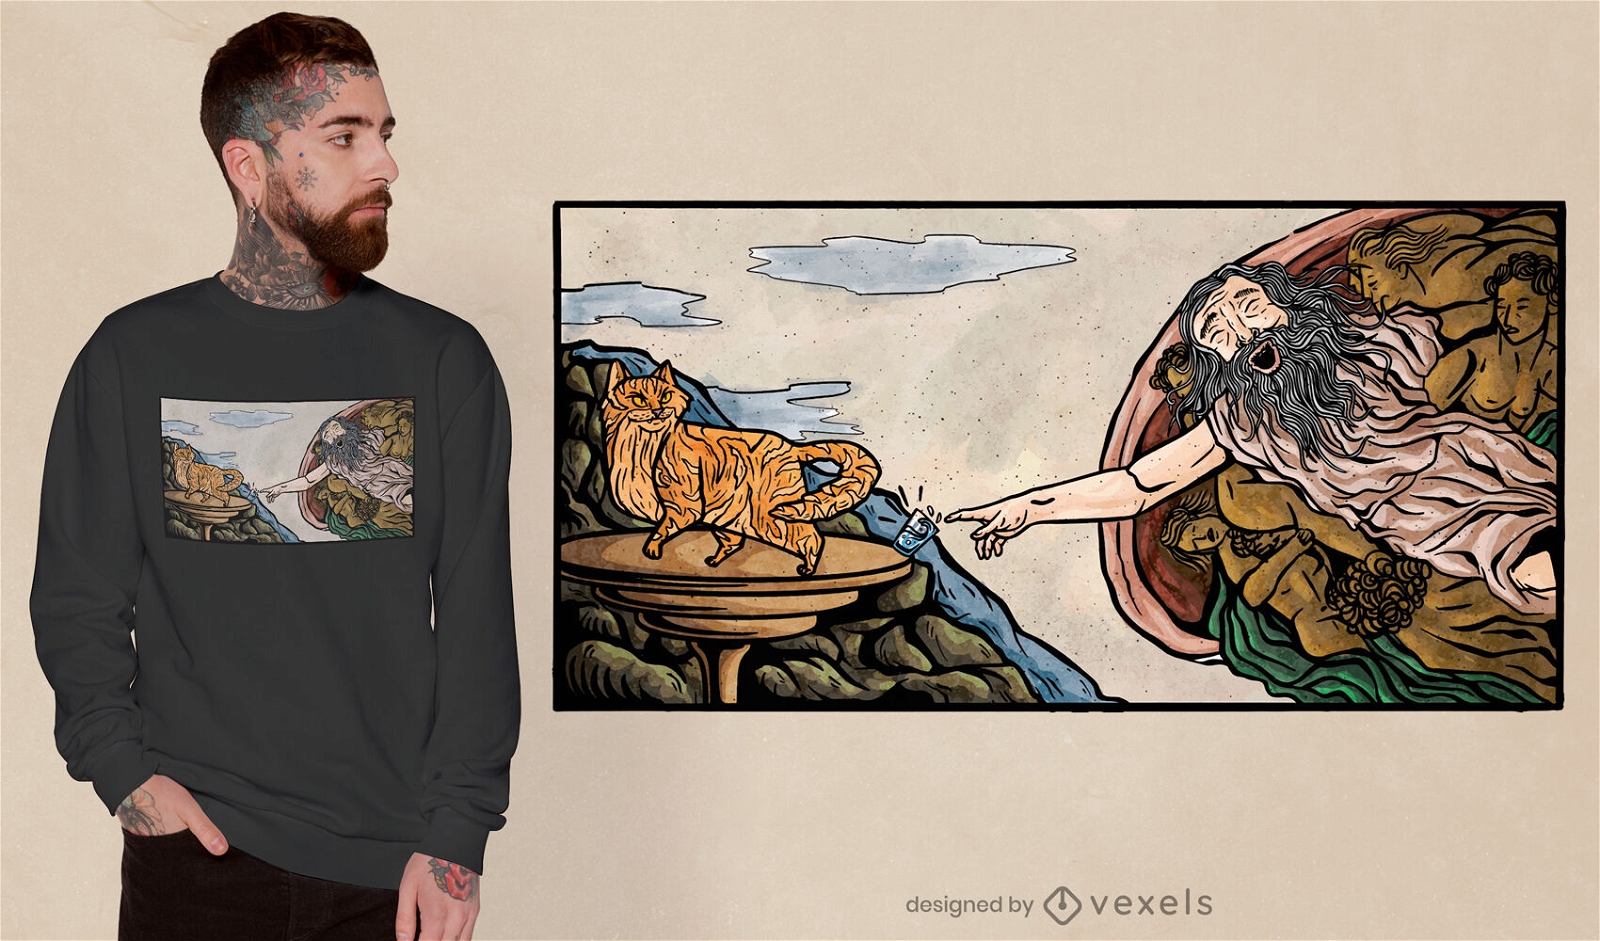
Cat creation painting t-shirt design
Choose a folder
All favorites
Create new
Save
Cat creation painting t-shirt design
Print ready
for Merch
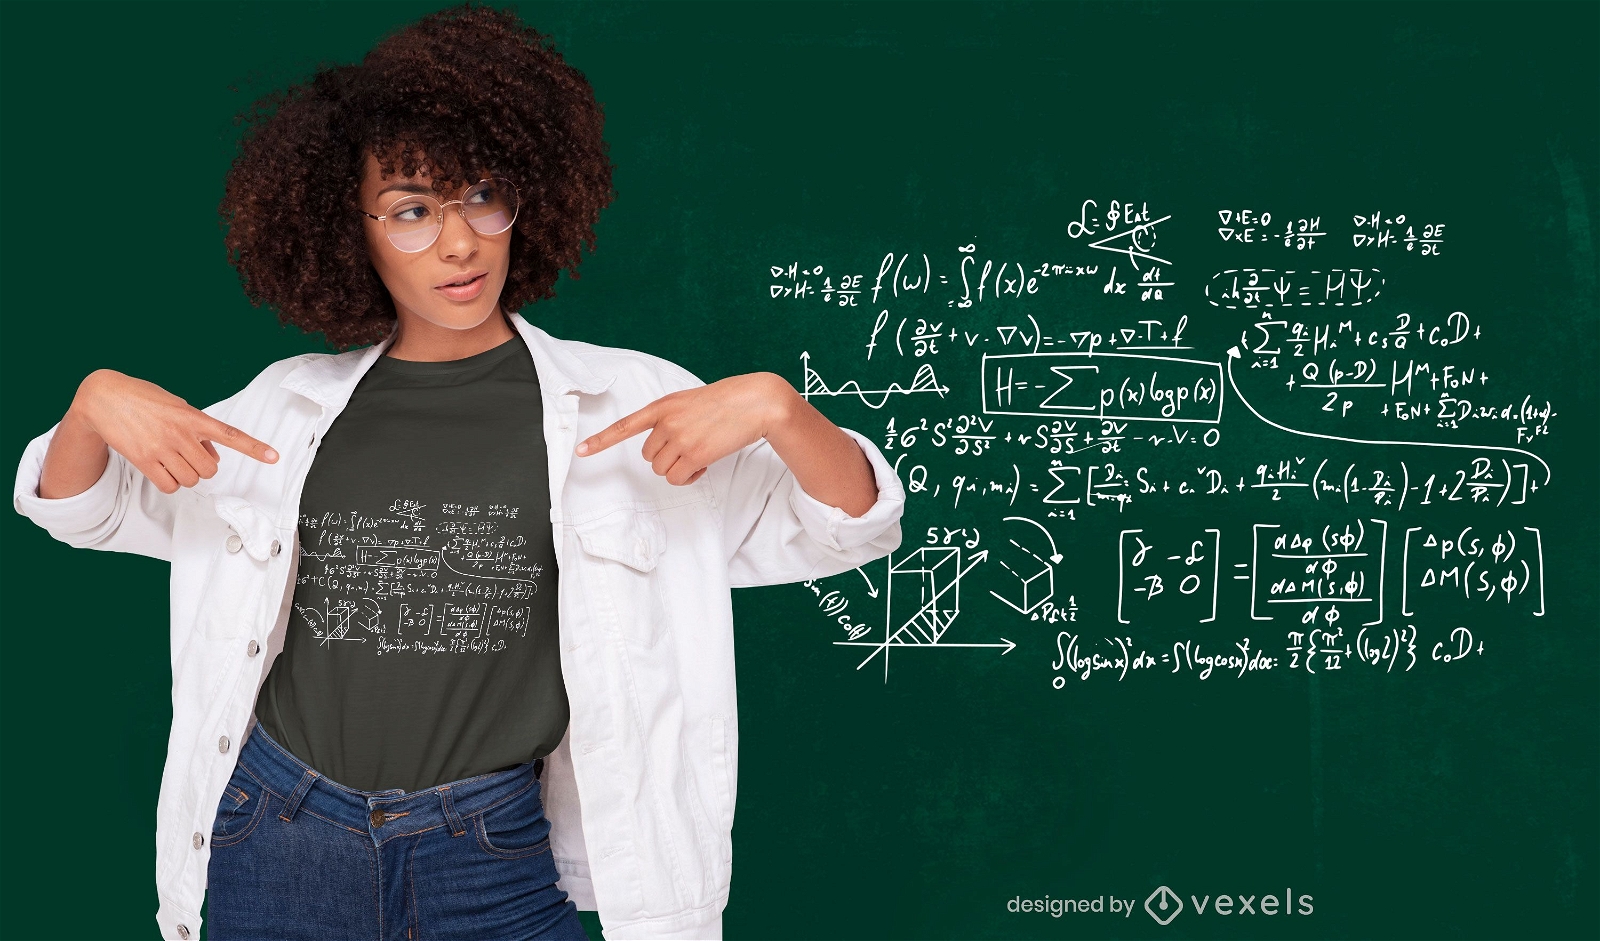
Mathematical formulas t-shirt design
Choose a folder
All favorites
Create new
Save
Mathematical formulas t-shirt design
Print ready
for Merch
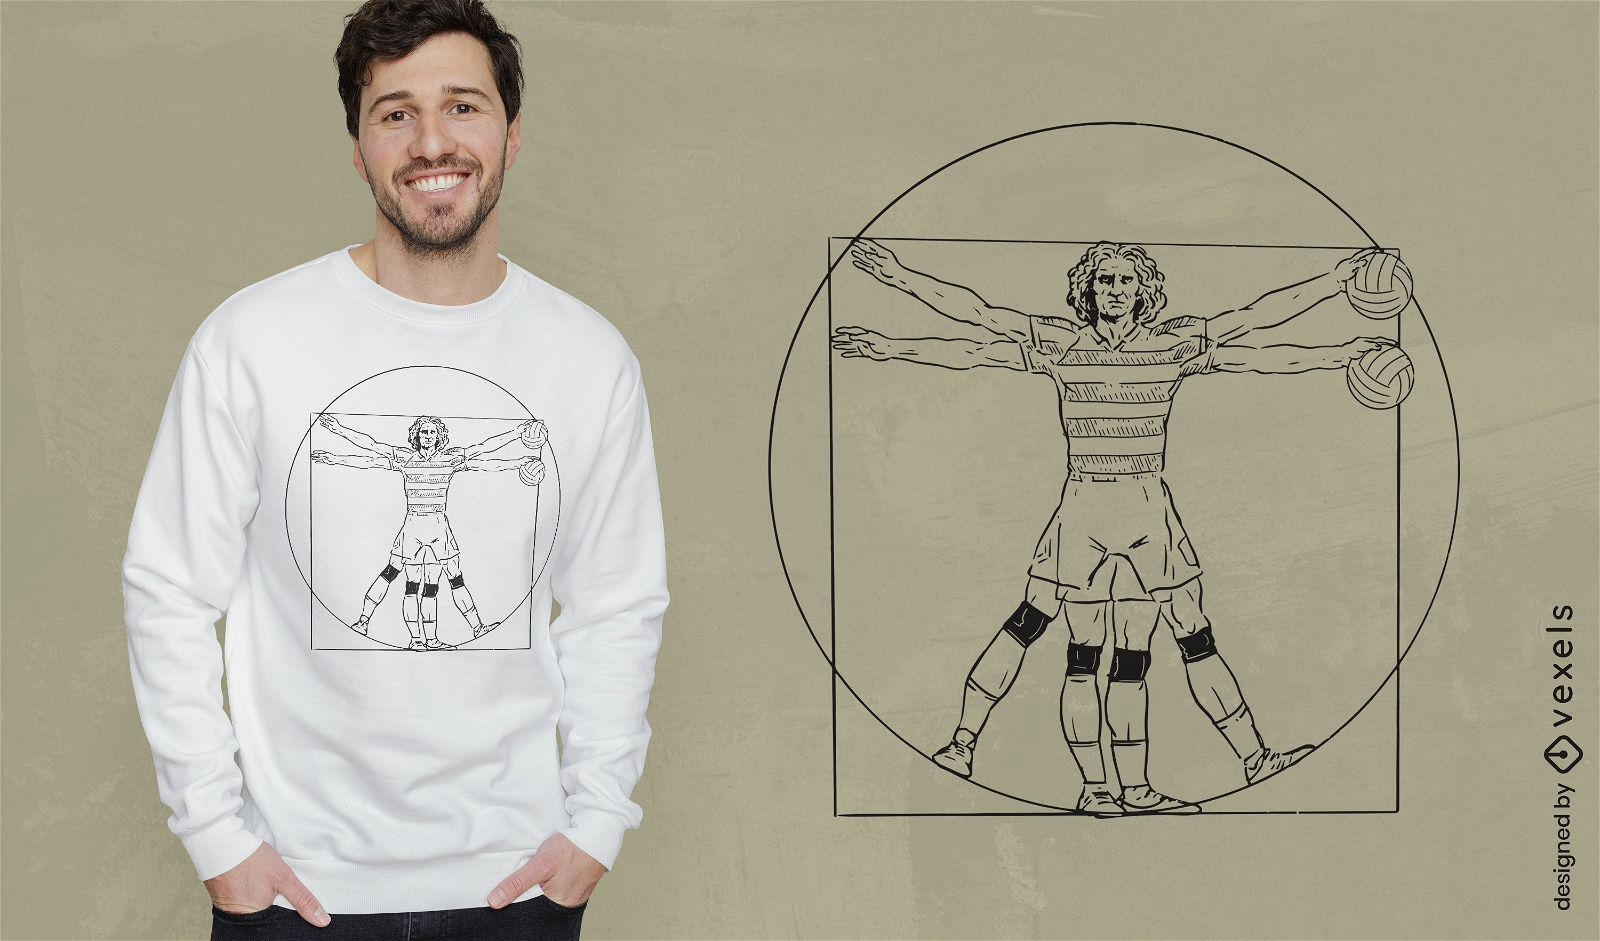
Vitruvian man volleyball t-shirt design
Choose a folder
All favorites
Create new
Save
Vitruvian man volleyball t-shirt design
Editable text
Print ready
for Merch
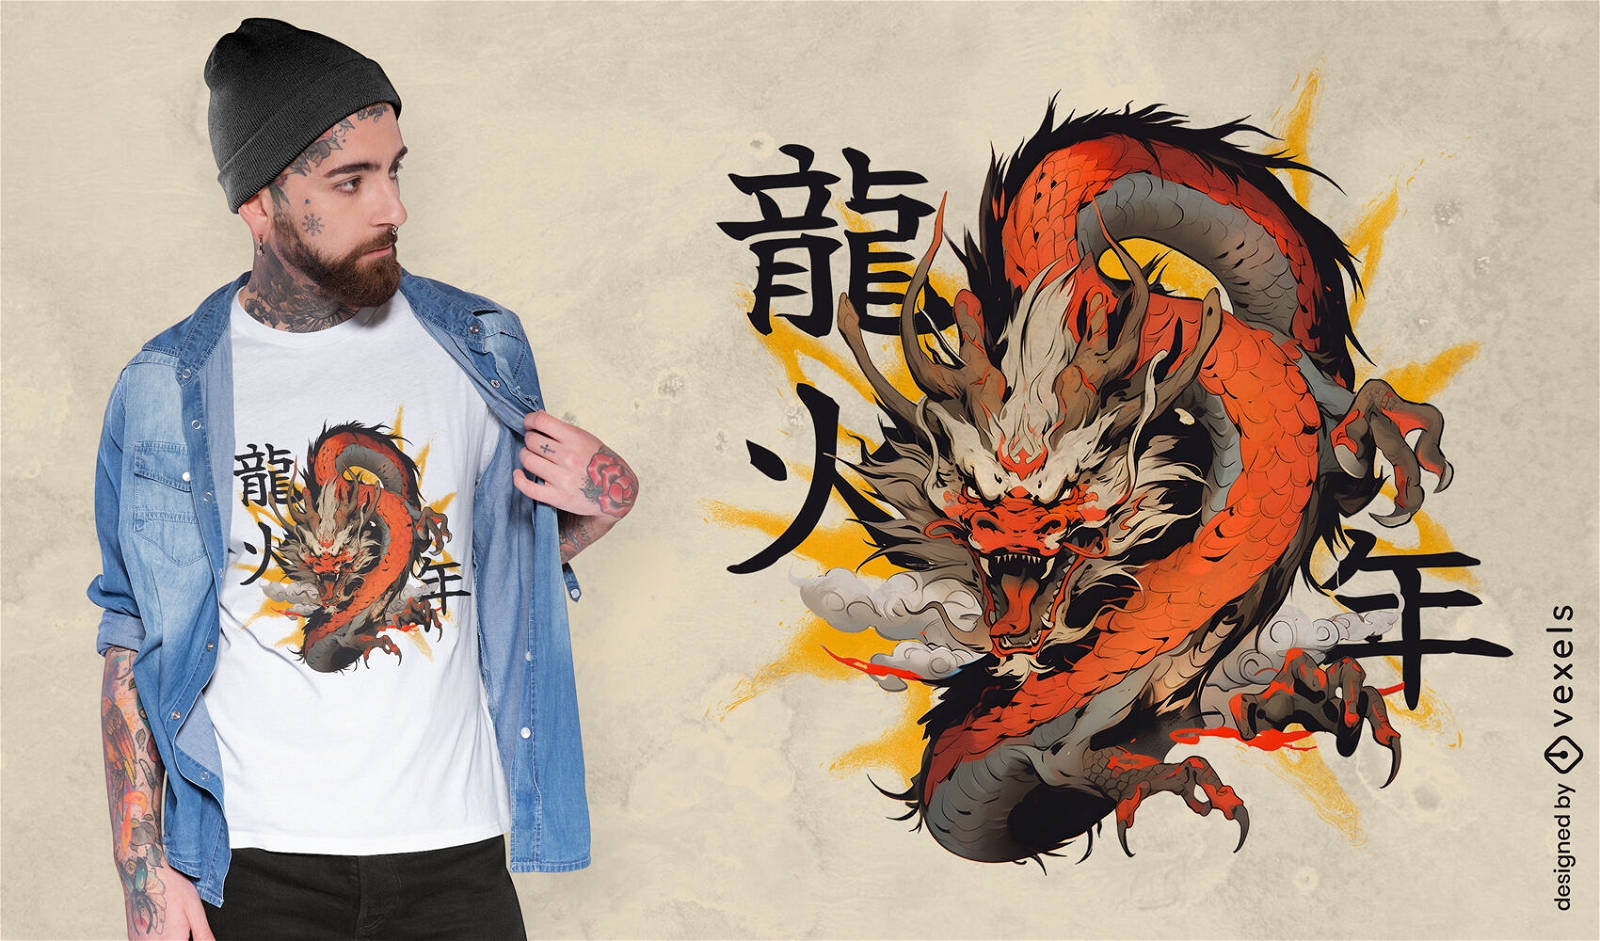
Powerful Chinese dragon t-shirt design
Choose a folder
All favorites
Create new
Save
Powerful Chinese dragon t-shirt design
Print ready
for Merch
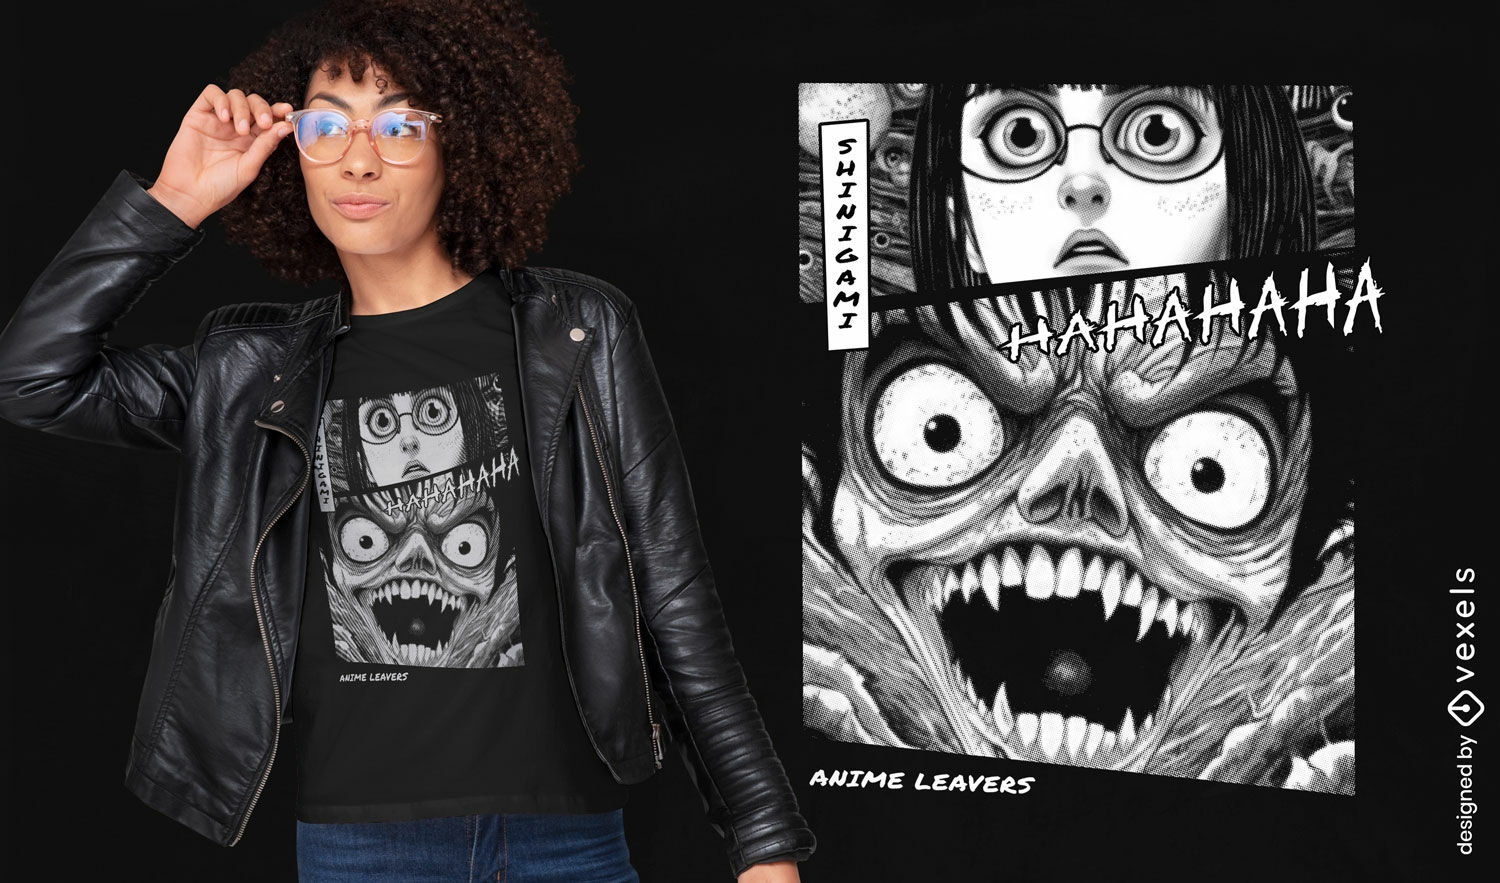
Anime demon face t-shirt design
Choose a folder
All favorites
Create new
Save
Anime demon face t-shirt design
Print ready
for Merch
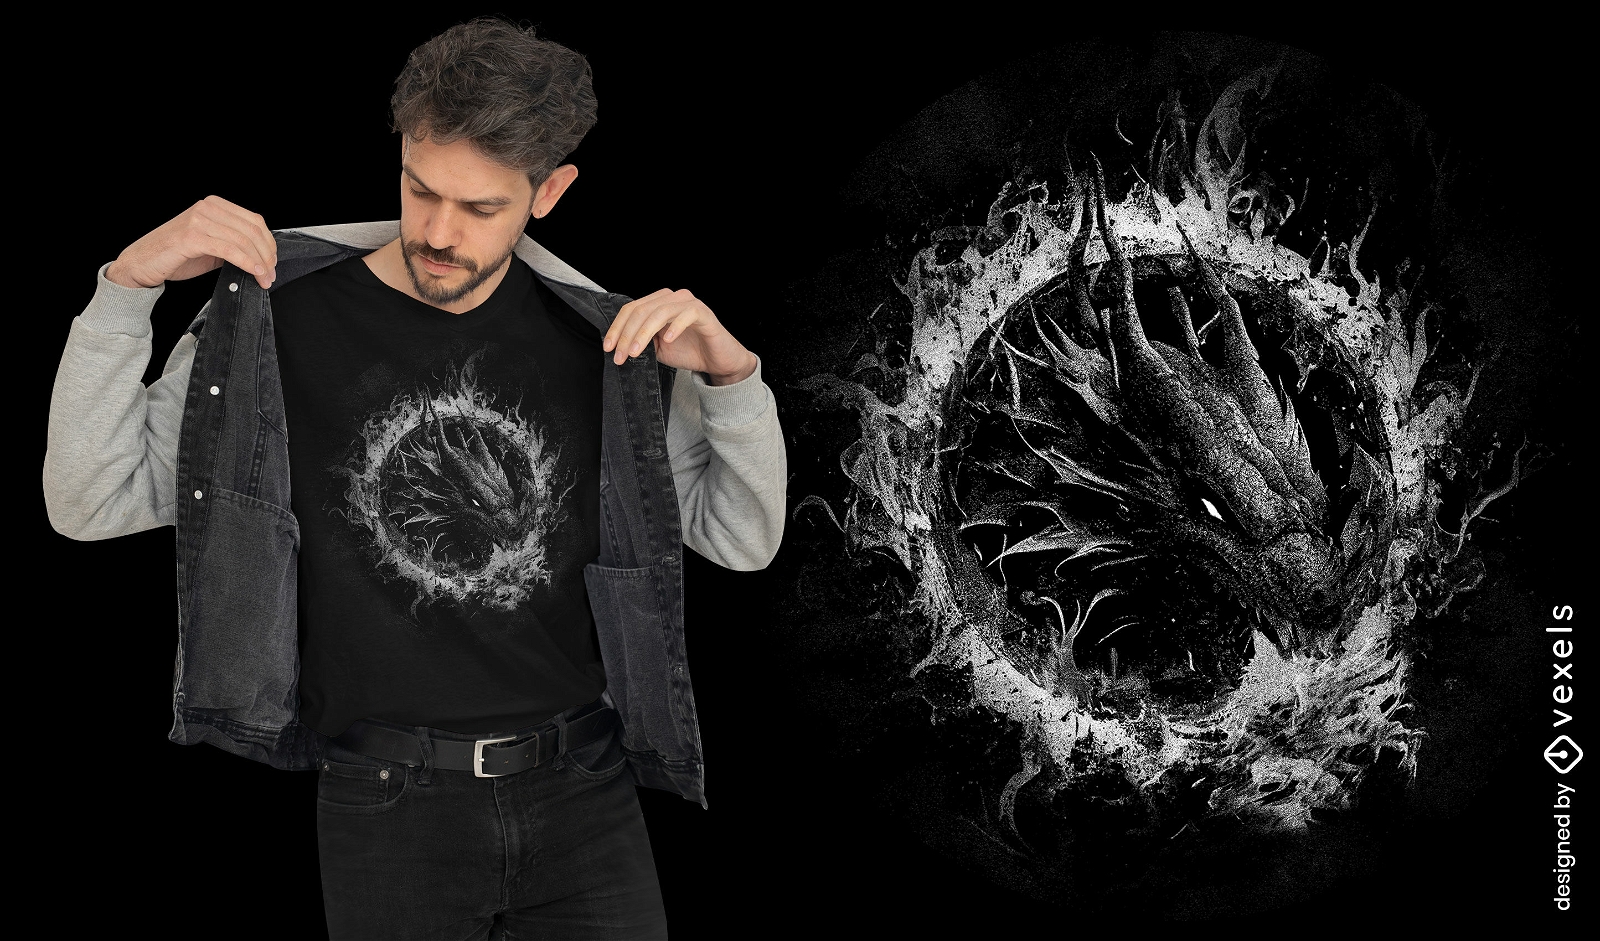
Emerging dragon t-shirt design
Choose a folder
All favorites
Create new
Save
Emerging dragon t-shirt design
Print ready
for Merch
Magical dragon creature t-shirt design
Choose a folder
All favorites
Create new
Save
Magical dragon creature t-shirt design
Print ready
for Merch
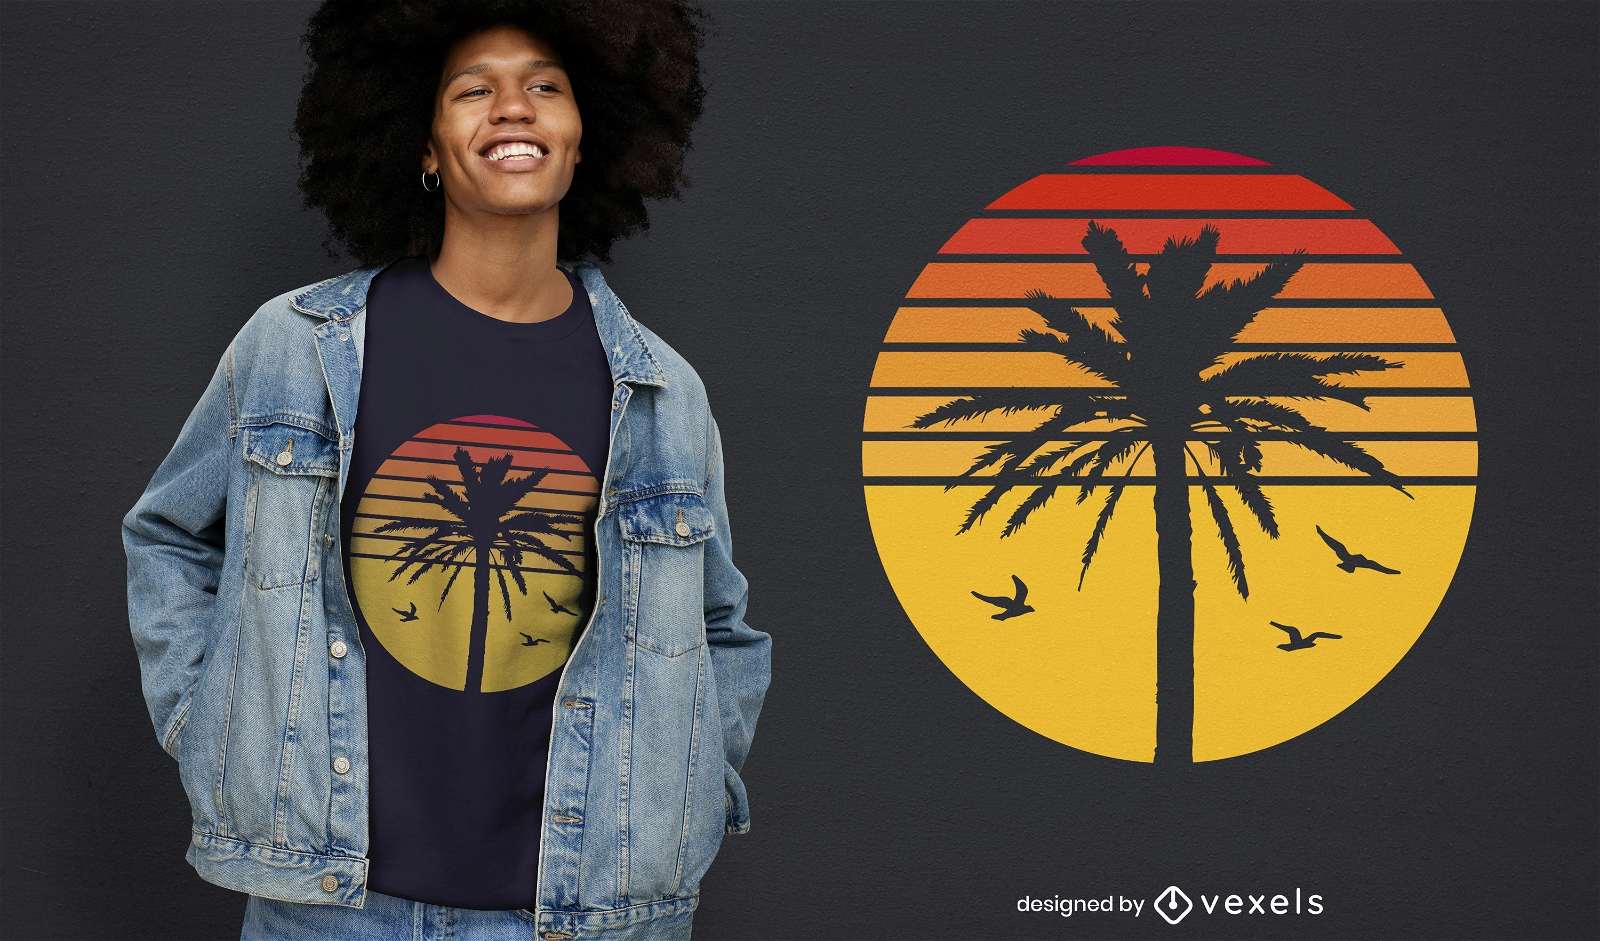
Palm tree sunset t-shirt design
Choose a folder
All favorites
Create new
Save
Palm tree sunset t-shirt design
Print ready
for Merch
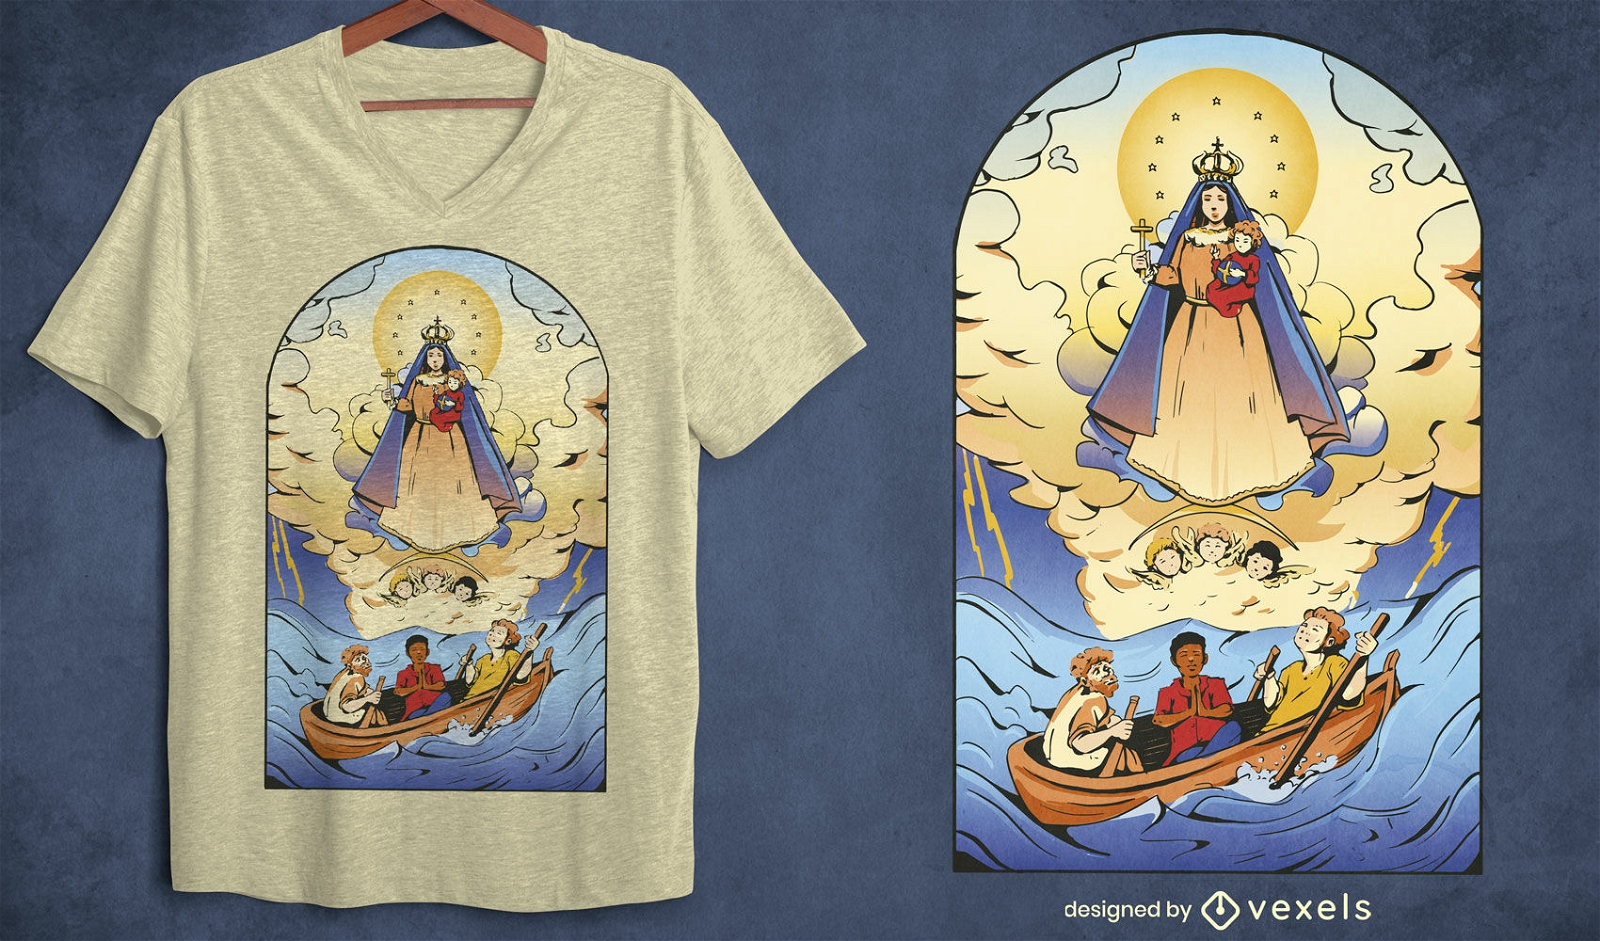
Christianity religious portrait t-shirt design
Choose a folder
All favorites
Create new
Save
Christianity religious portrait t-shirt design
Print ready
for Merch
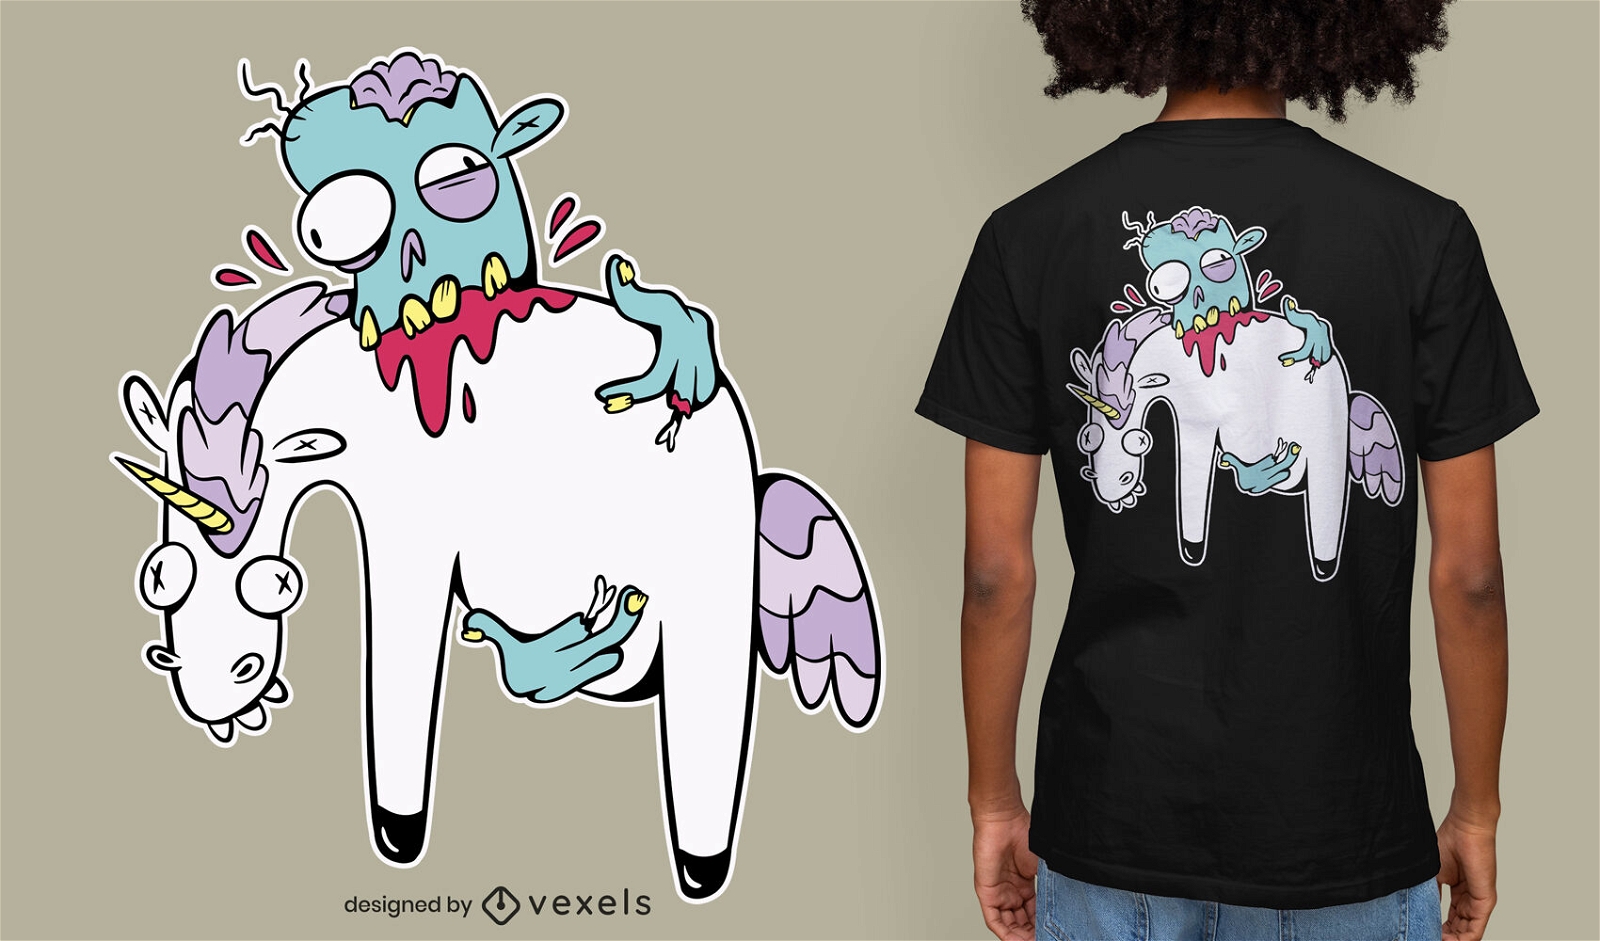
Zombie eating unicorn cartoon t-shirt design
Choose a folder
All favorites
Create new
Save
Zombie eating unicorn cartoon t-shirt design
Print ready
for Merch
Lightning bolt from above PSD t-shirt design
Choose a folder
All favorites
Create new
Save
Lightning bolt from above PSD t-shirt design
Print ready
for Merch
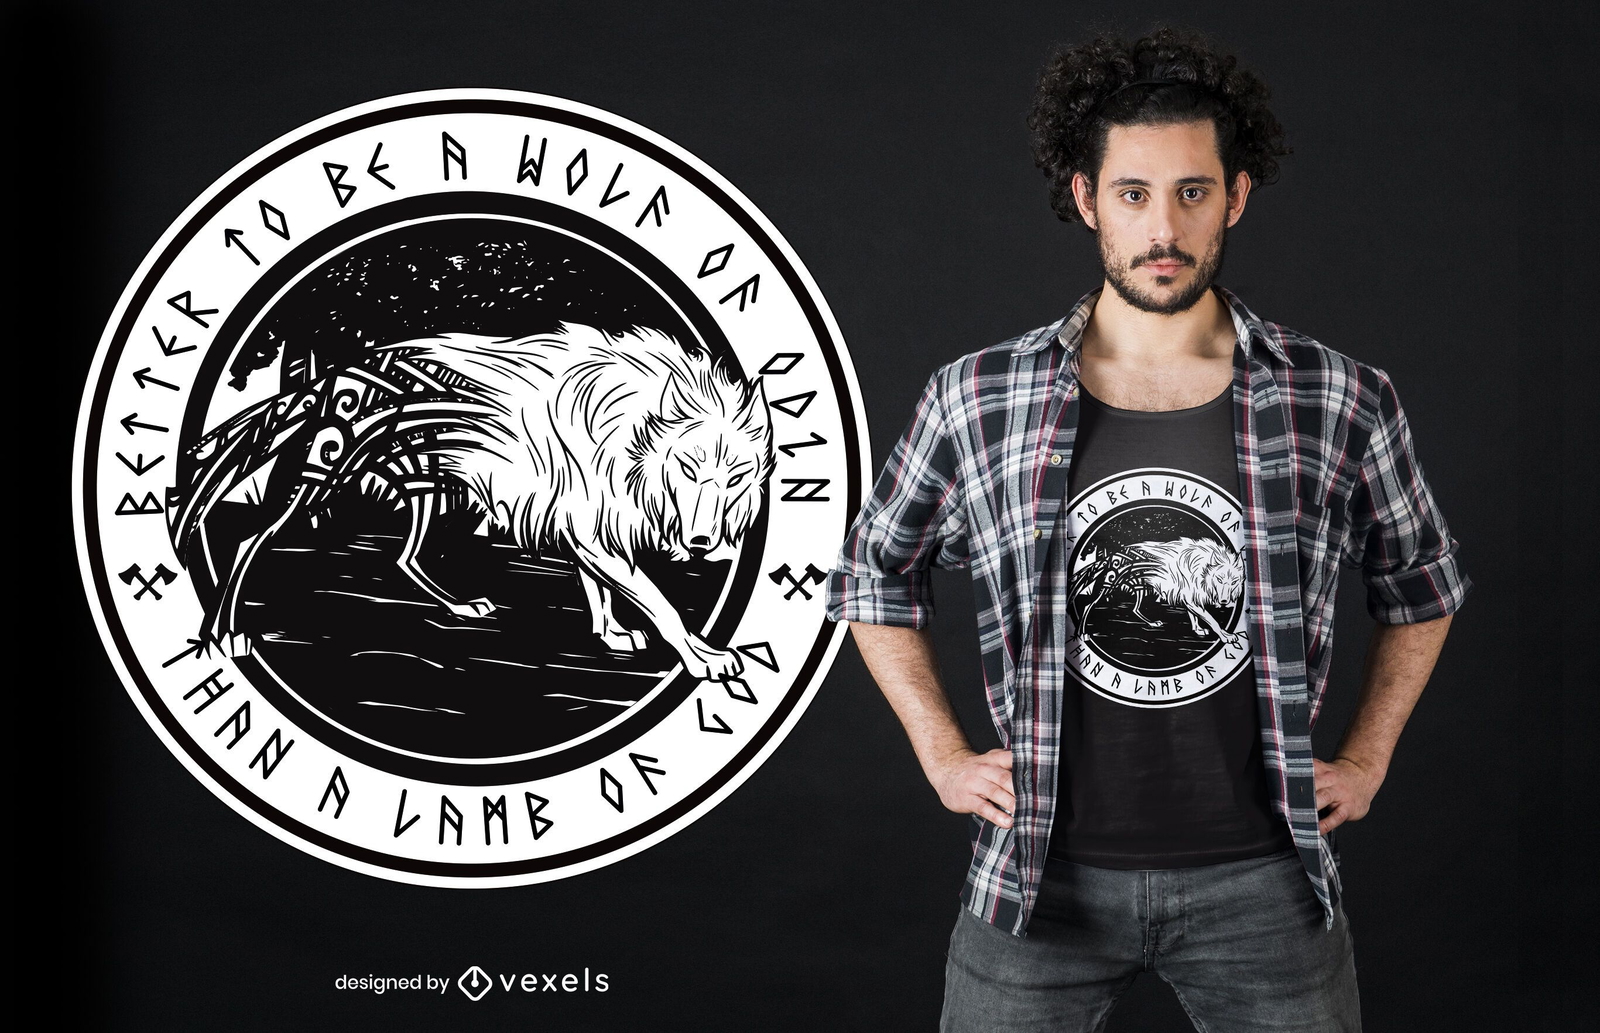
Wolf of Odin T-shirt Design
Choose a folder
All favorites
Create new
Save
Wolf of Odin T-shirt Design
Print ready
for Merch
Cute santa unicorn t-shirt design
Choose a folder
All favorites
Create new
Save
Cute santa unicorn t-shirt design
Editable text
Print ready
for Merch
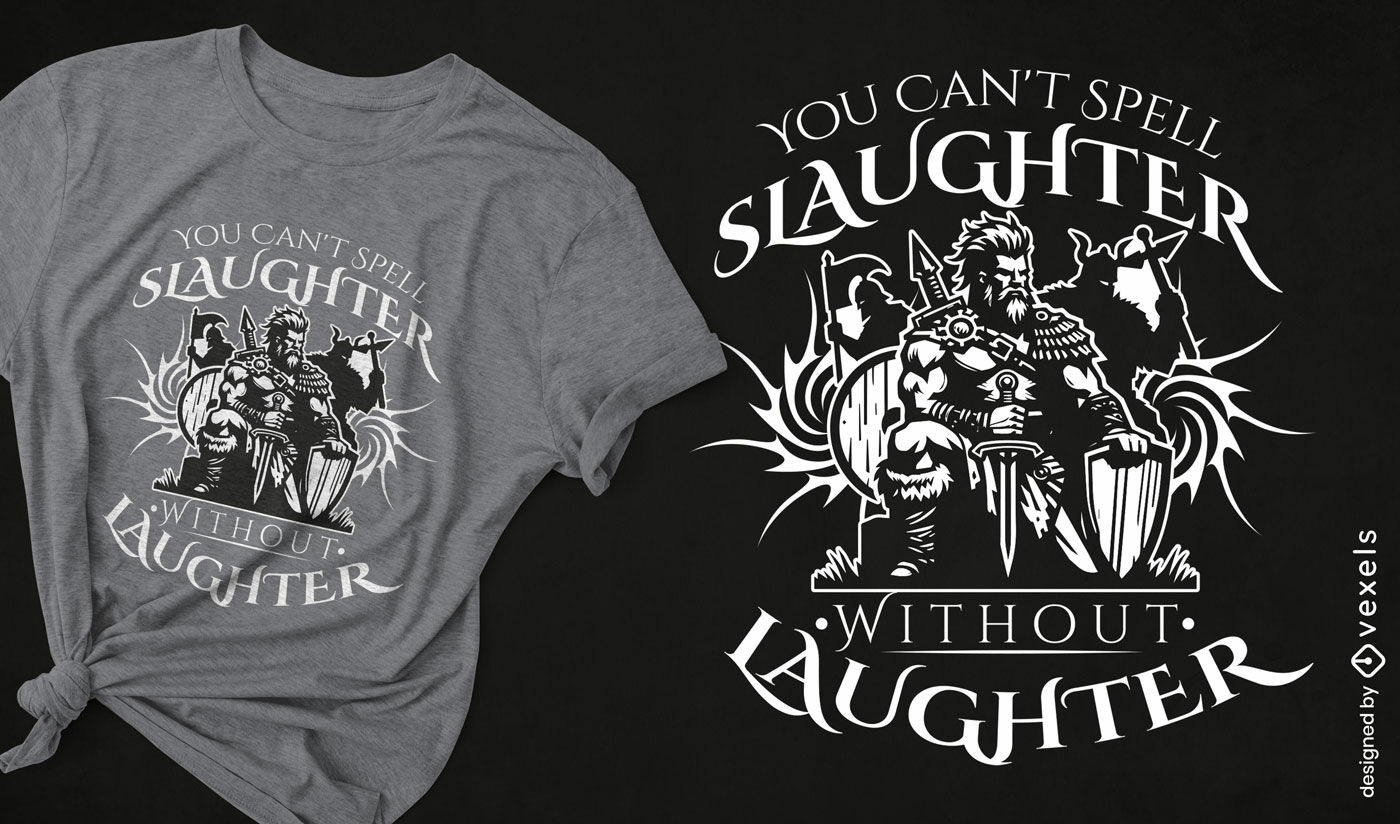
Barbarian warrior quote t-shirt design
Choose a folder
All favorites
Create new
Save
Barbarian warrior quote t-shirt design
Editable text
Print ready
for Merch
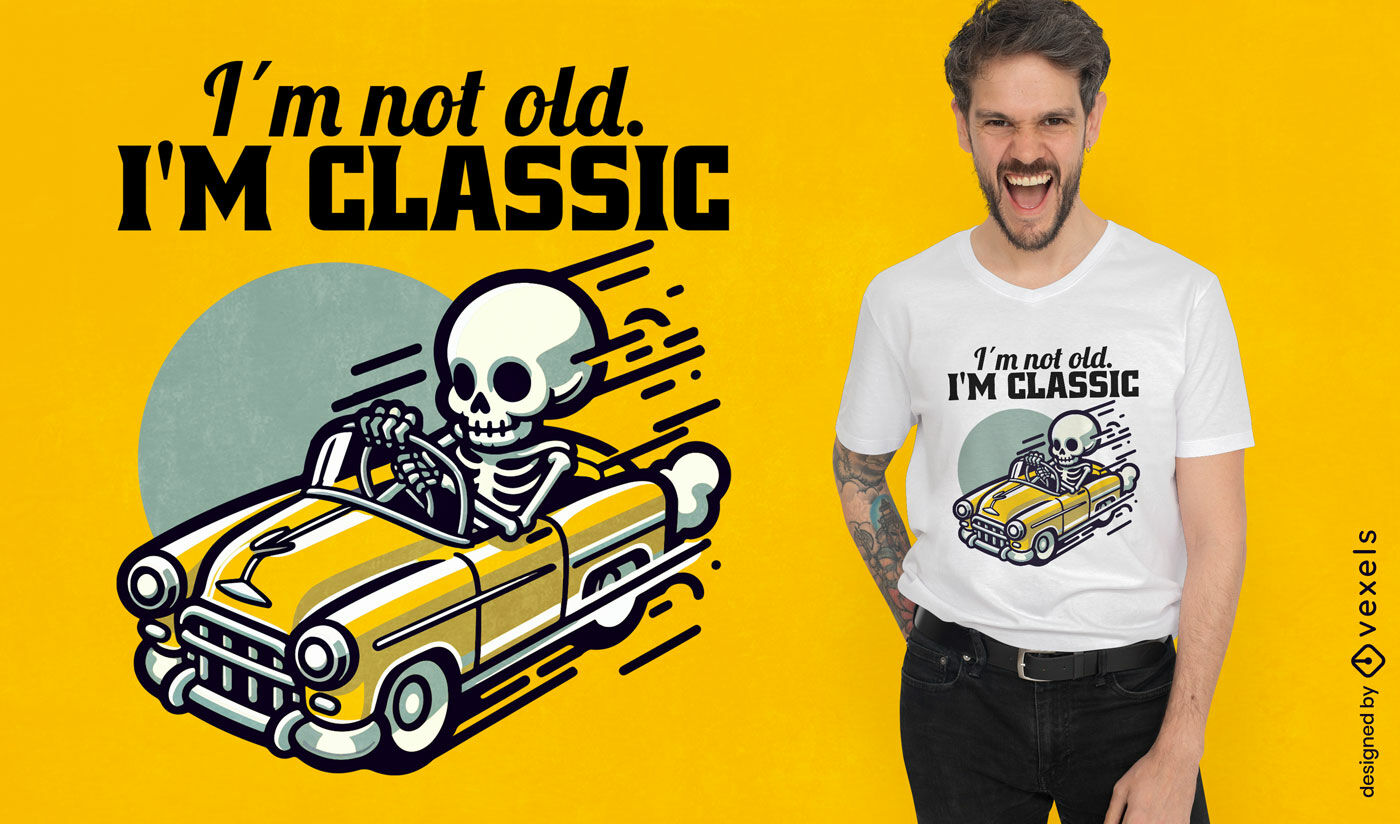
Classic skeleton car t-shirt design
Choose a folder
All favorites
Create new
Save
Classic skeleton car t-shirt design
Editable text
Print ready
for Merch
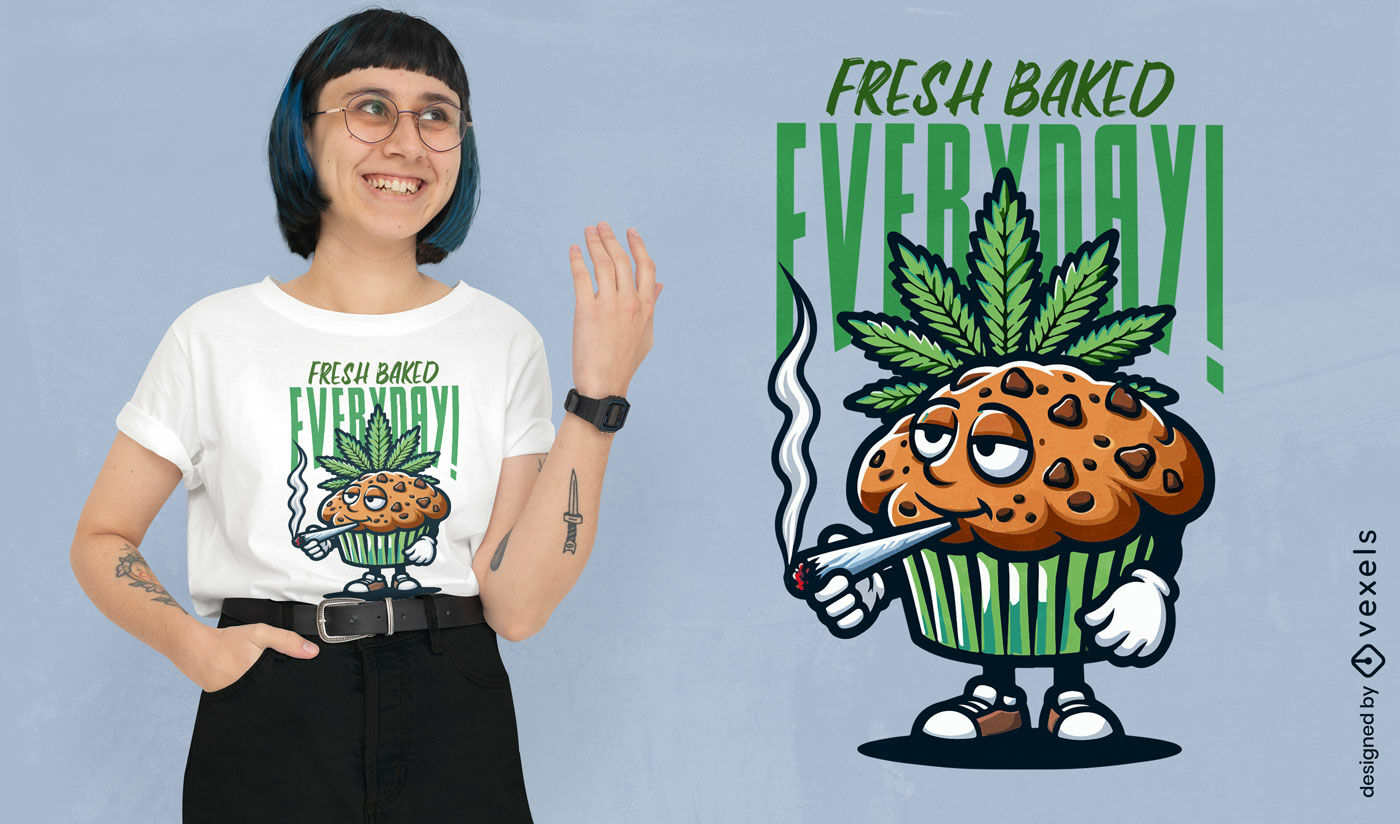
Cannabis muffin character t-shirt design
Choose a folder
All favorites
Create new
Save
Cannabis muffin character t-shirt design
Print ready
for Merch
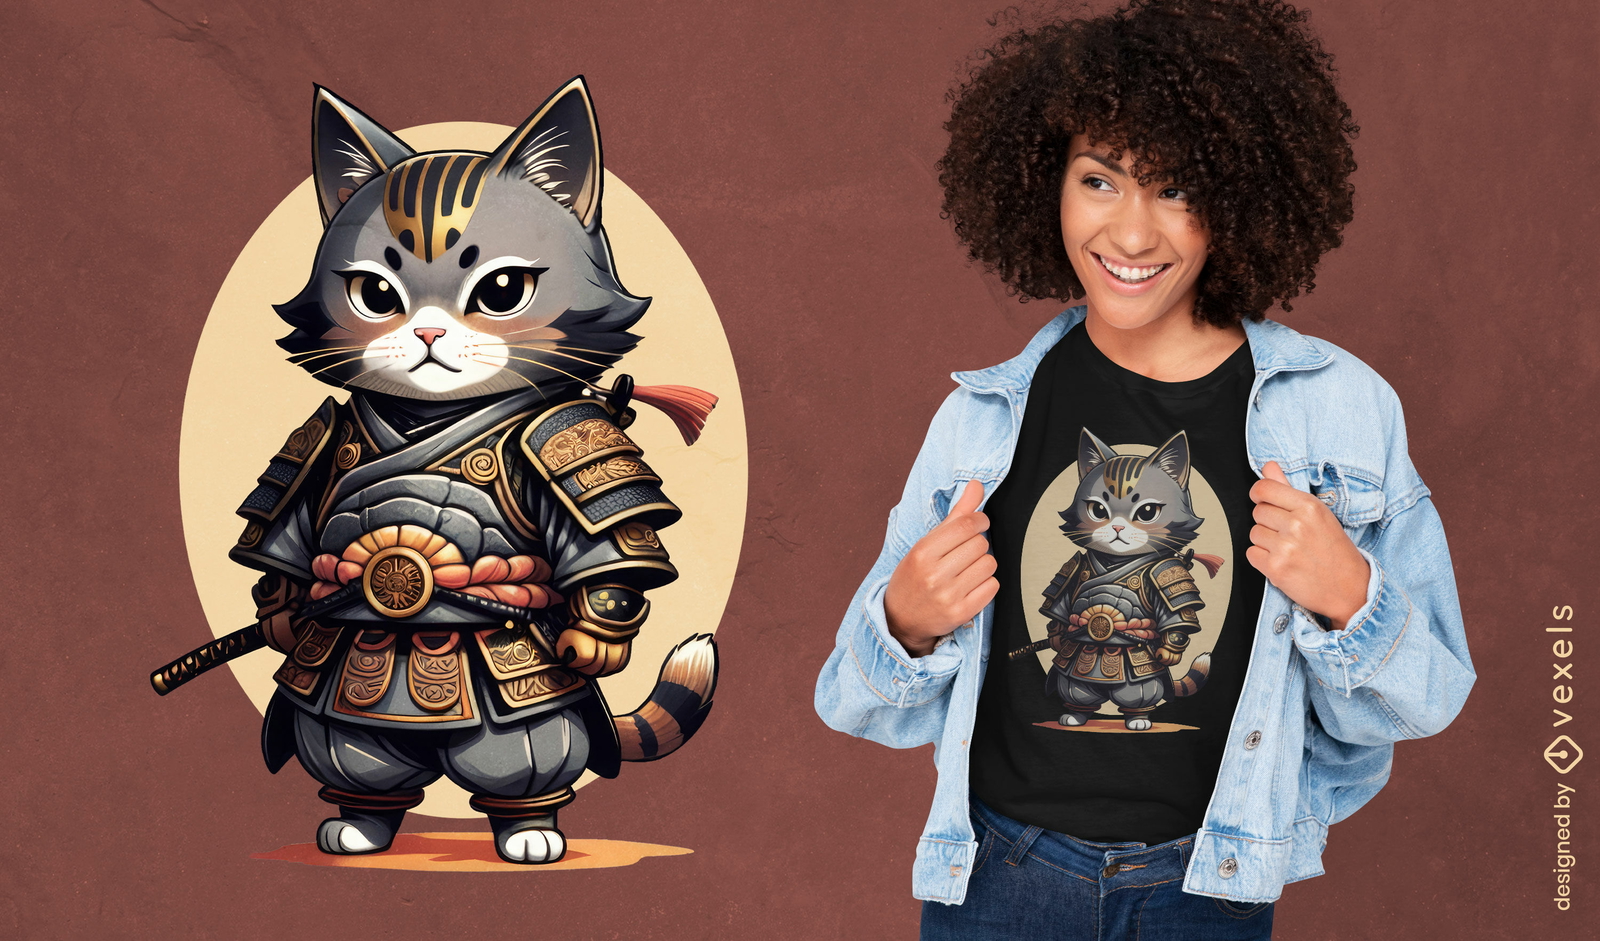
Adorable samurai cat t-shirt design
Choose a folder
All favorites
Create new
Save
Adorable samurai cat t-shirt design
Editable text
Print ready
for Merch
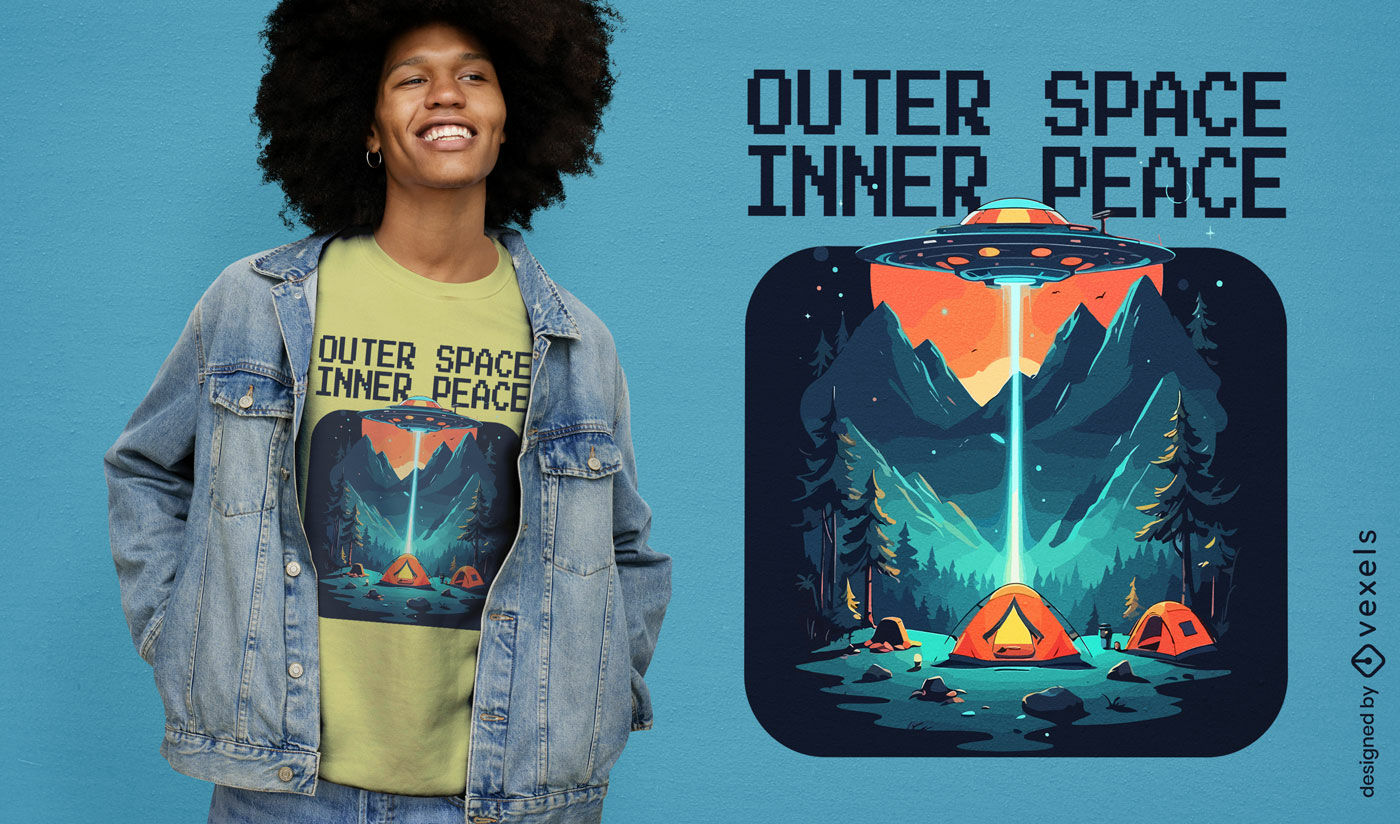
Outer space camping t-shirt design
Choose a folder
All favorites
Create new
Save
Outer space camping t-shirt design
Print ready
for Merch
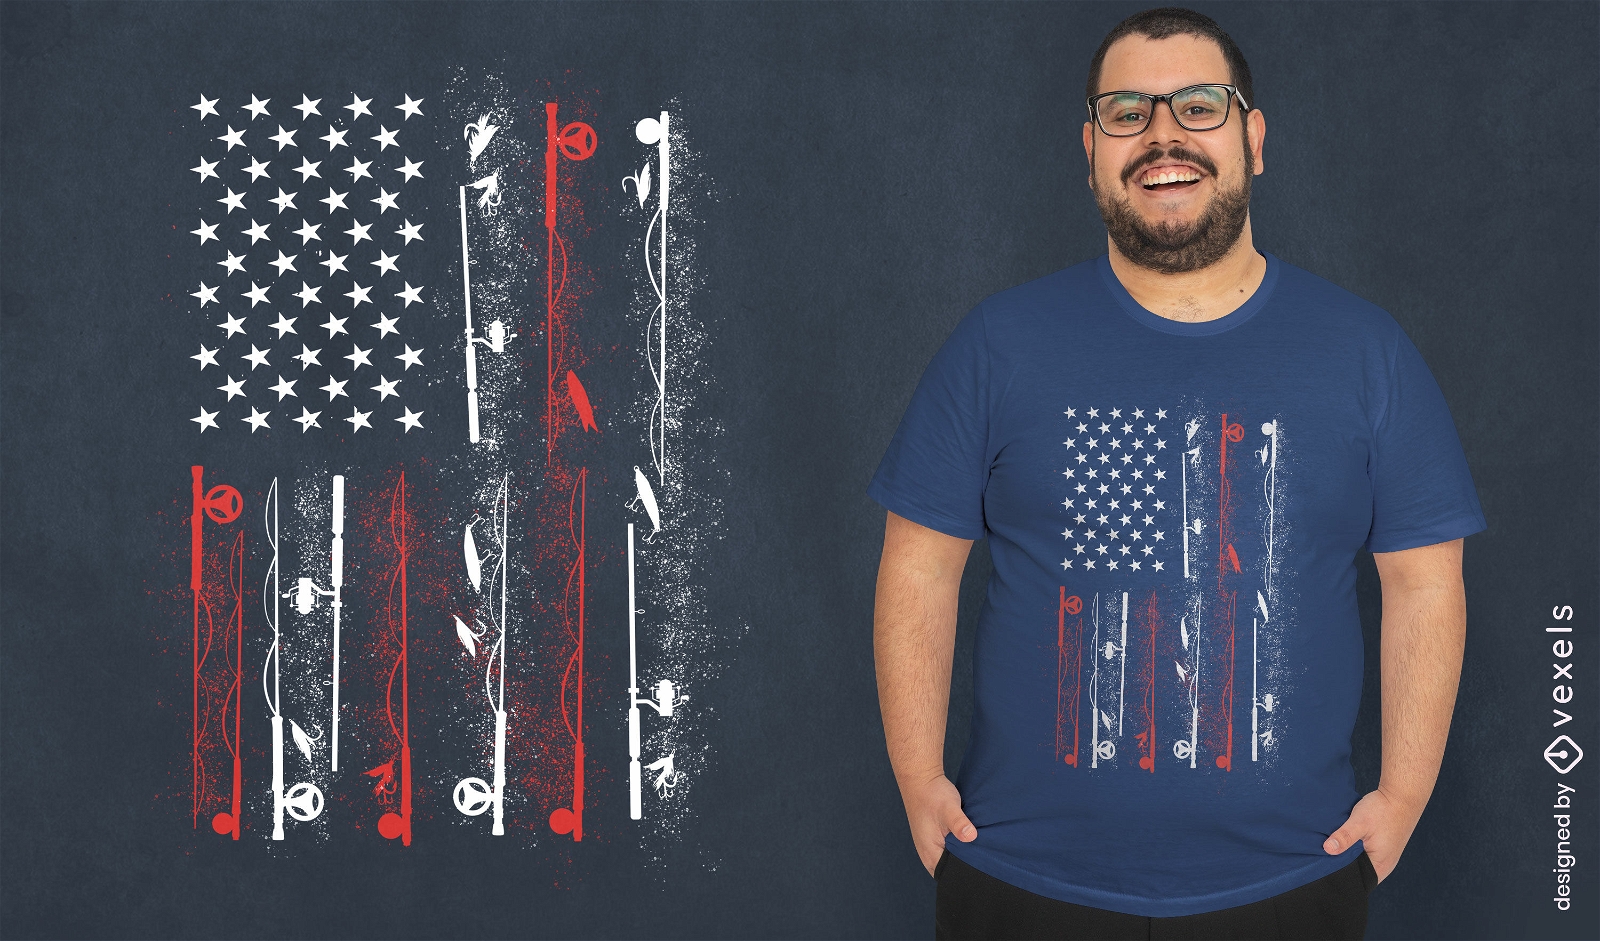
American flag fish t-shirt design
Choose a folder
All favorites
Create new
Save
American flag fish t-shirt design
Print ready
for Merch
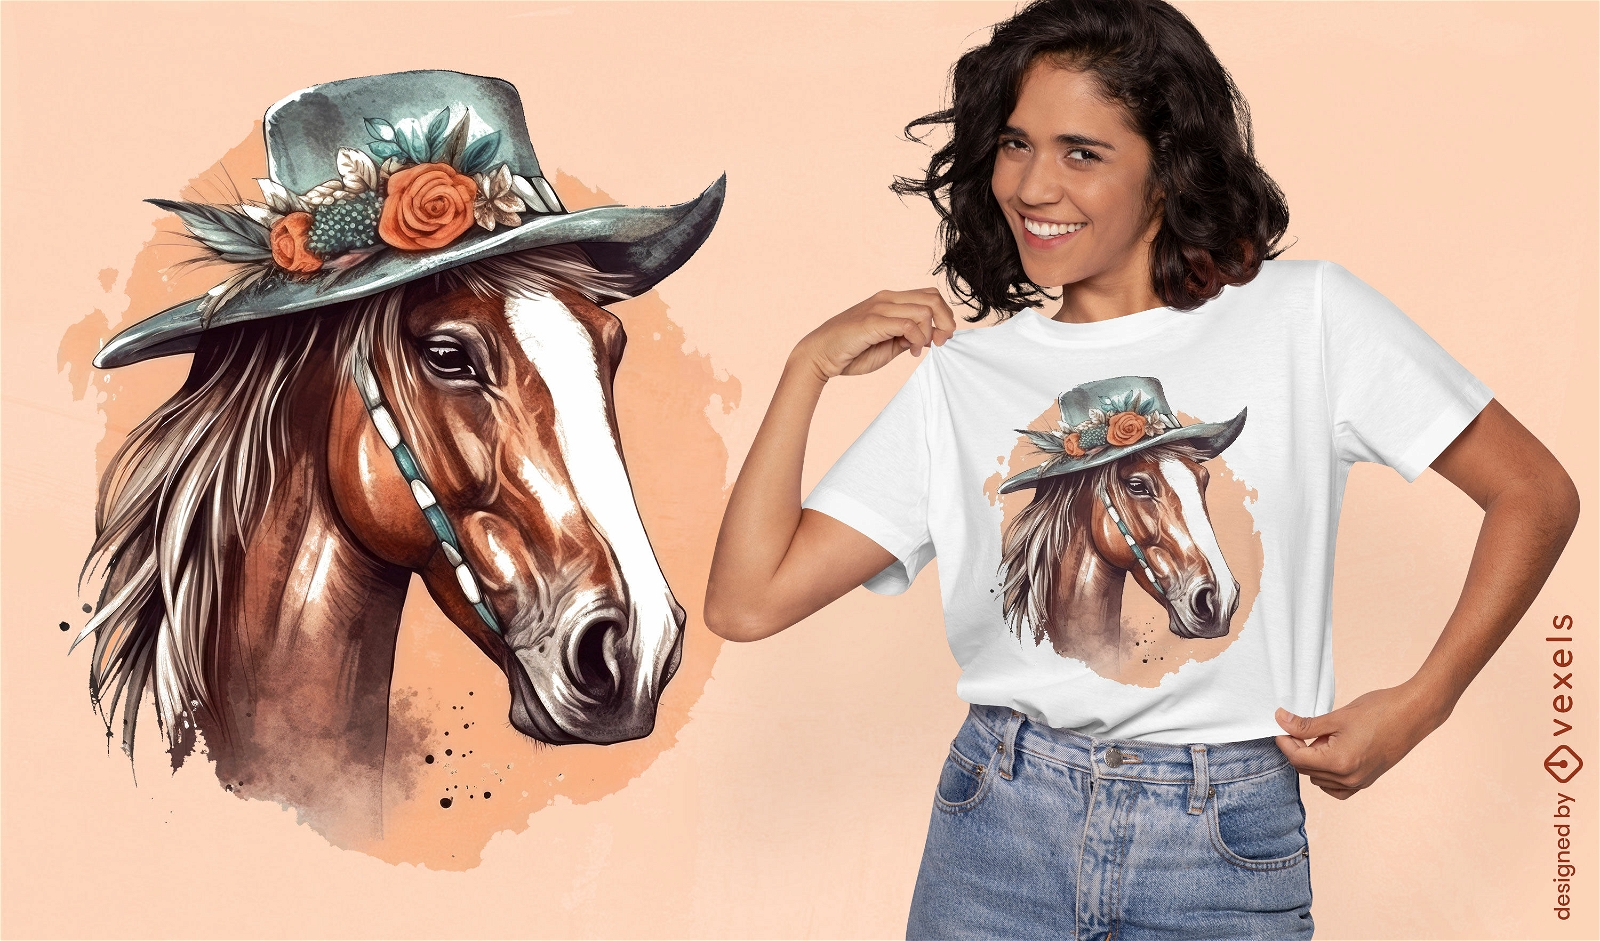
Bohemian horse t-shirt design
Choose a folder
All favorites
Create new
Save
Bohemian horse t-shirt design
Editable text
Print ready
for Merch
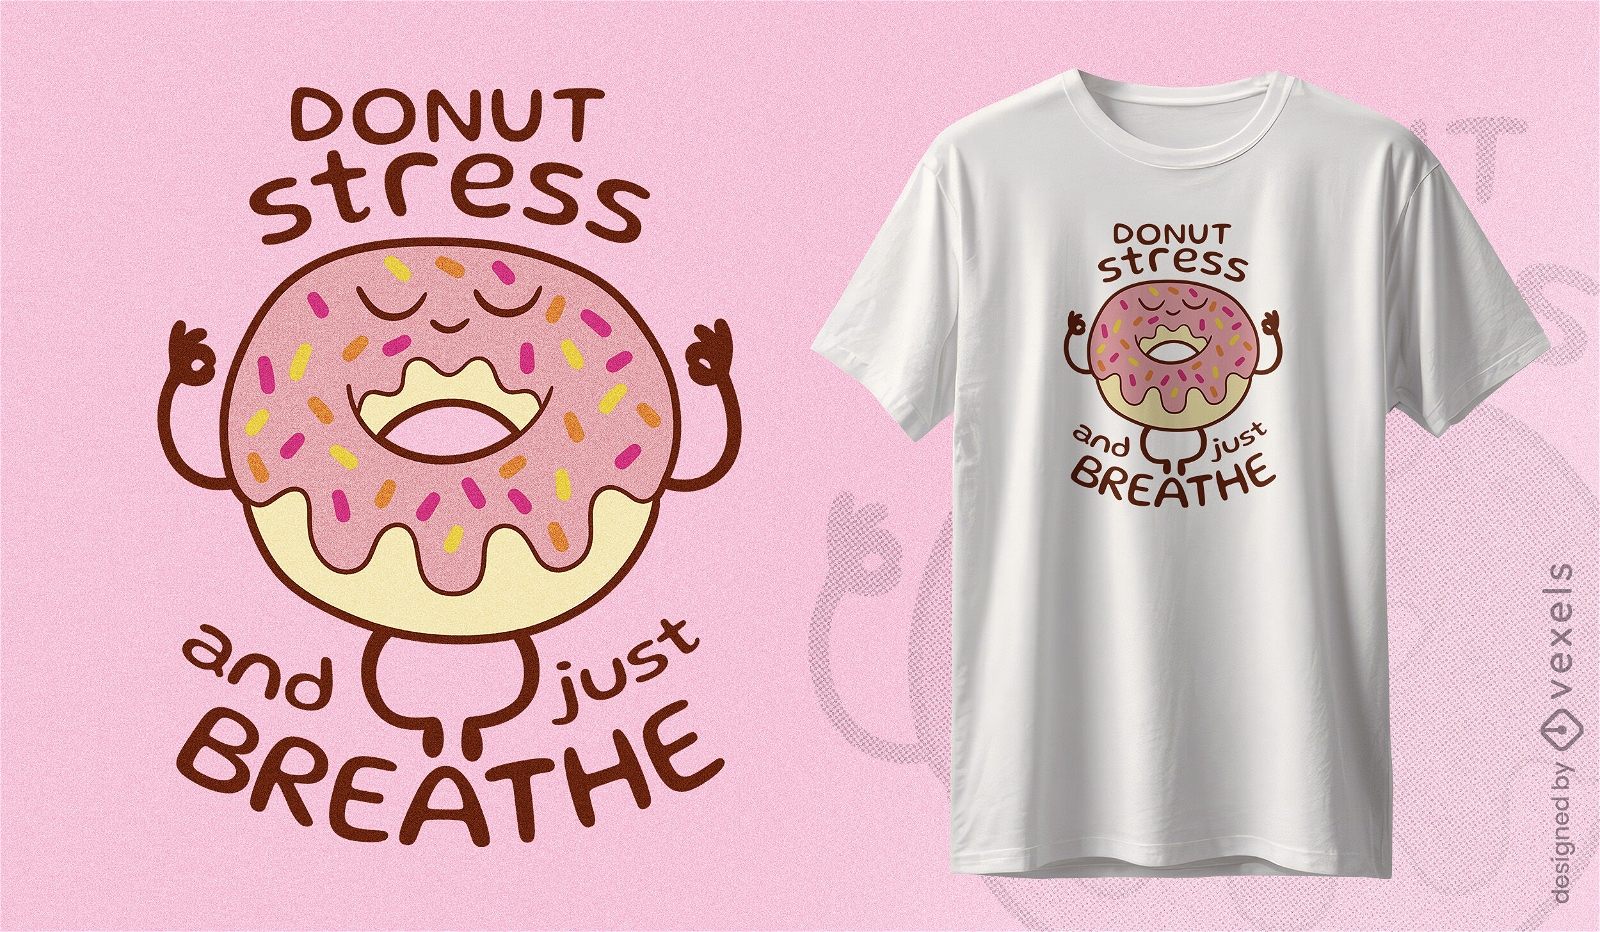
Yoga donut stress-relief t-shirt design
Choose a folder
All favorites
Create new
Save
Yoga donut stress-relief t-shirt design
Print ready
for Merch
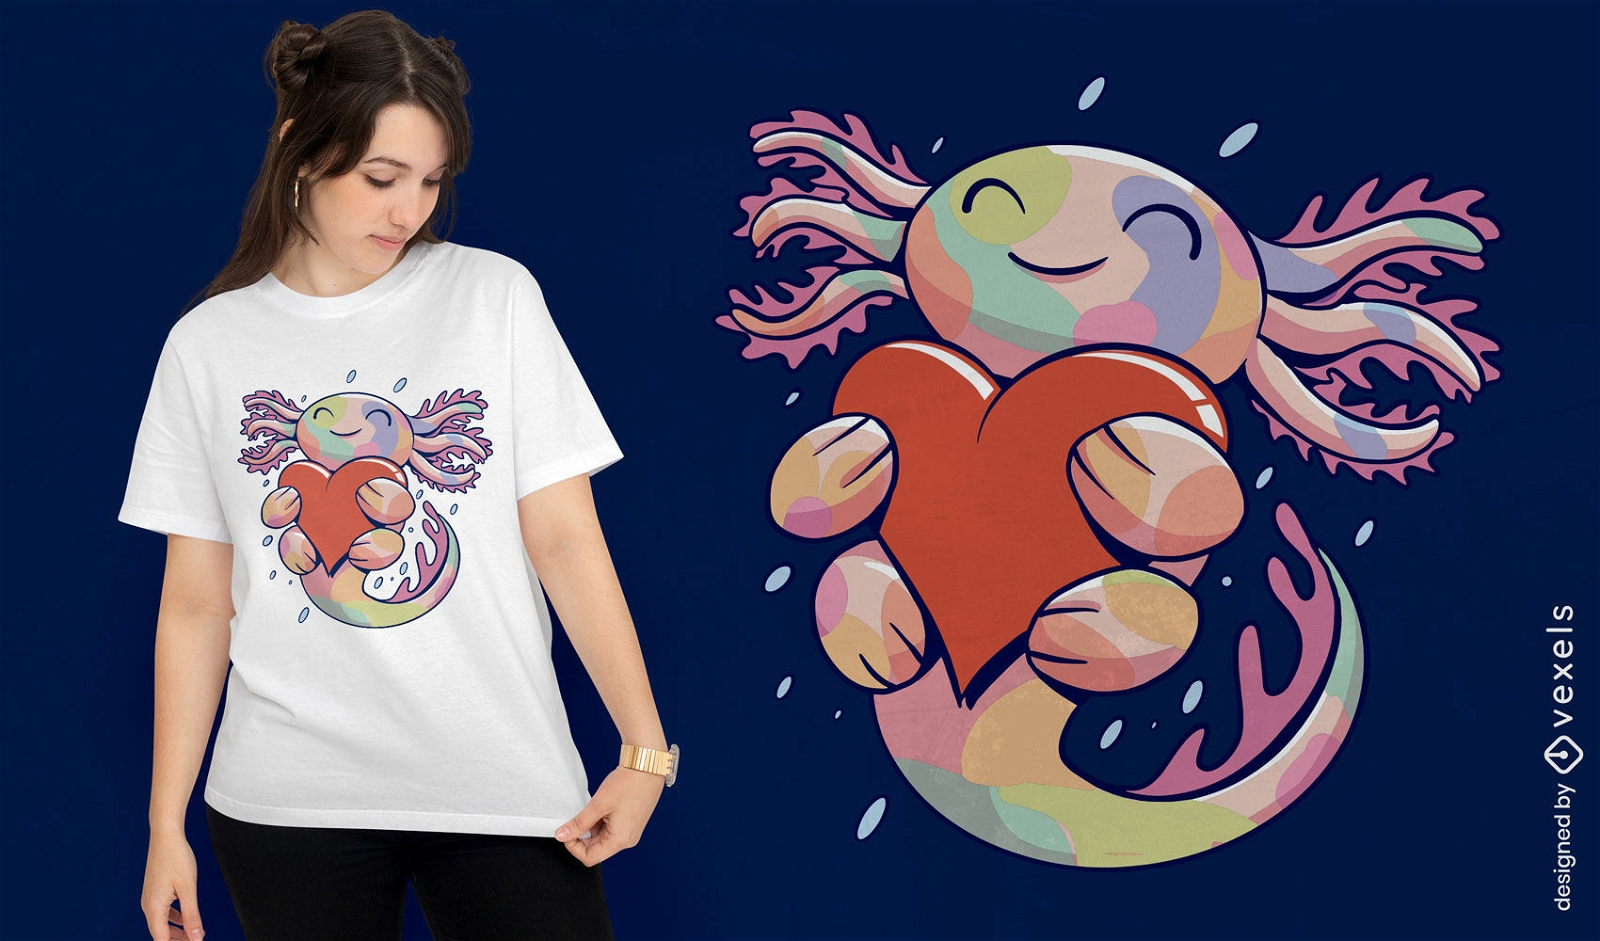
Dreamy axolotl t-shirt design
Choose a folder
All favorites
Create new
Save
Dreamy axolotl t-shirt design
Editable text
Print ready
for Merch
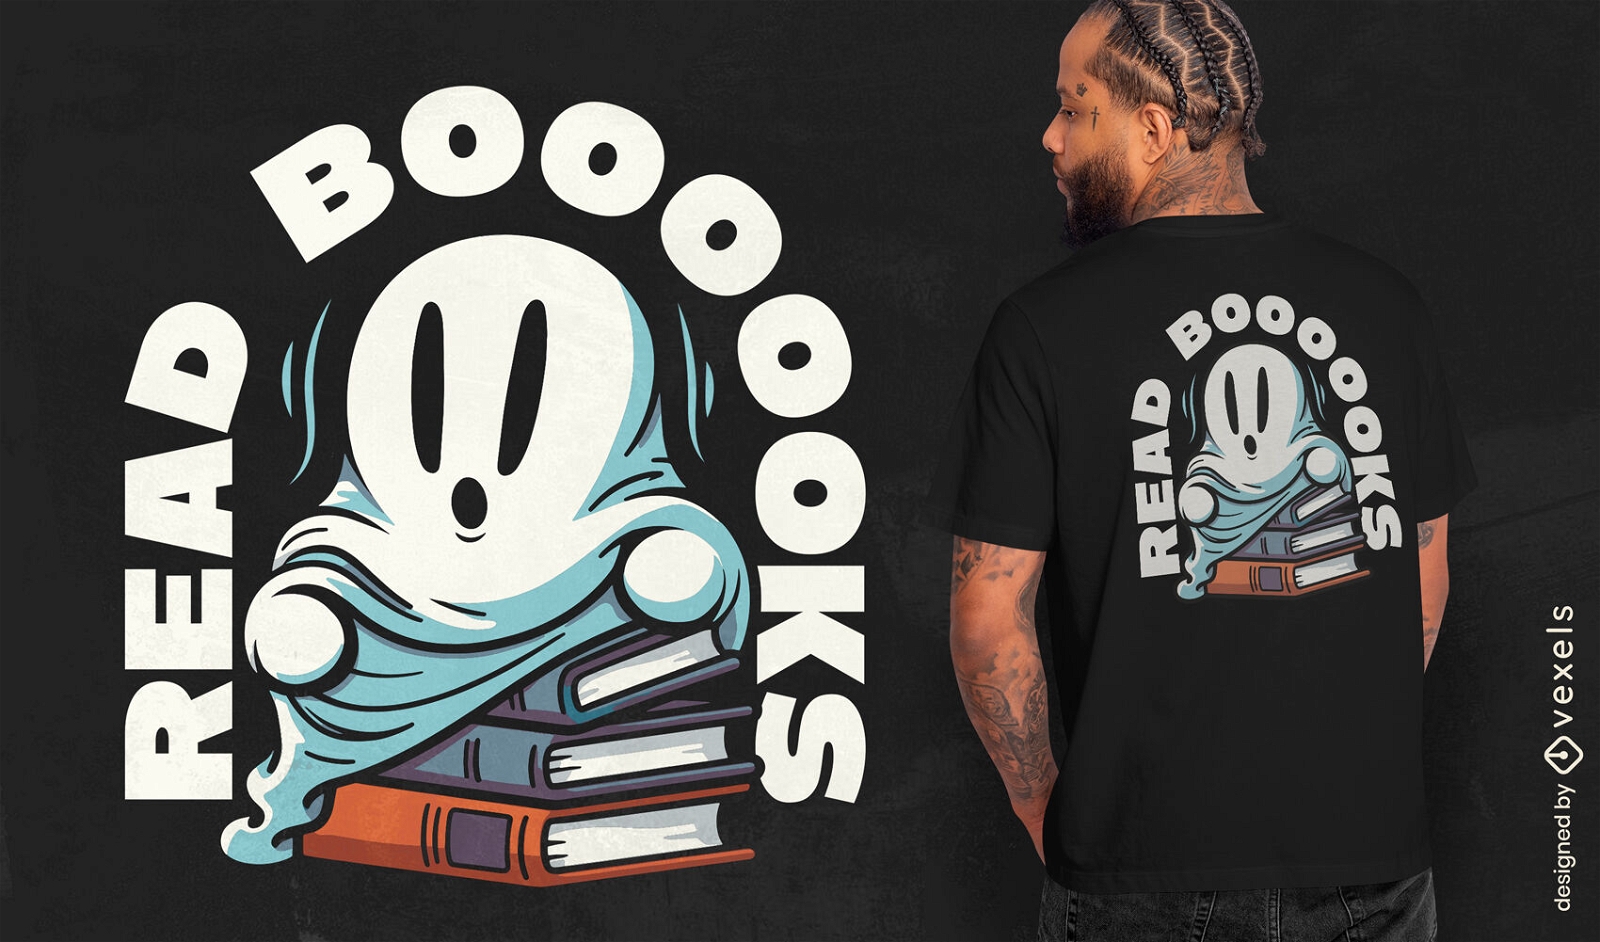
Ghost reading books t-shirt design
Choose a folder
All favorites
Create new
Save
Ghost reading books t-shirt design
Editable text
Print ready
for Merch
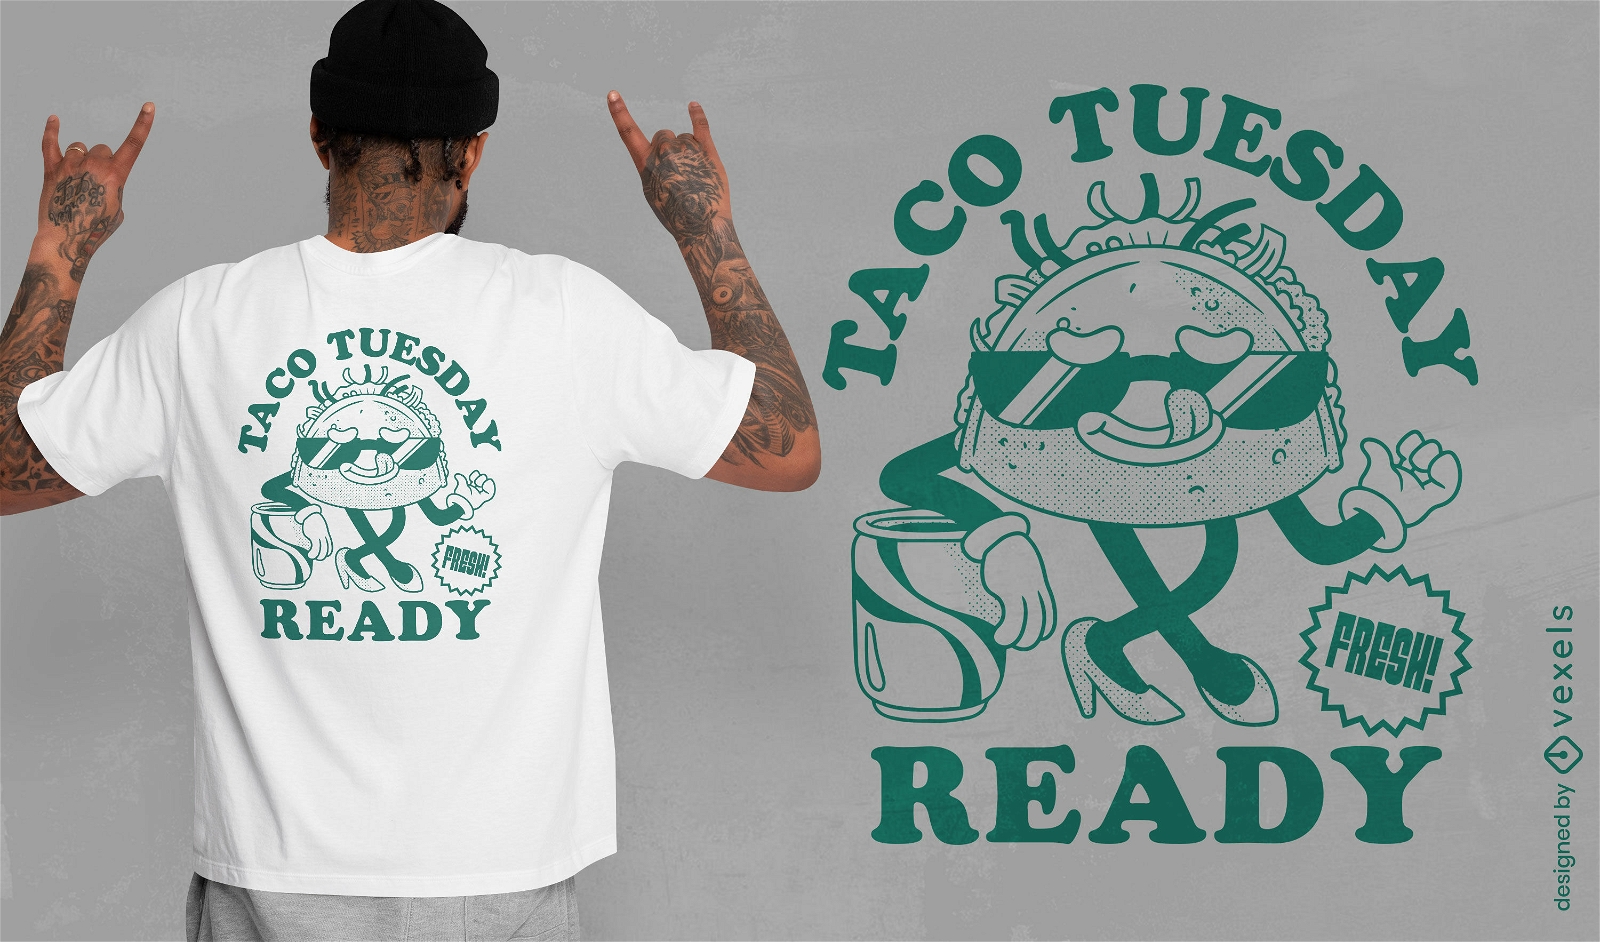
Taco tuesday ready food t-shirt design
Choose a folder
All favorites
Create new
Save
Taco tuesday ready food t-shirt design
Print ready
for Merch
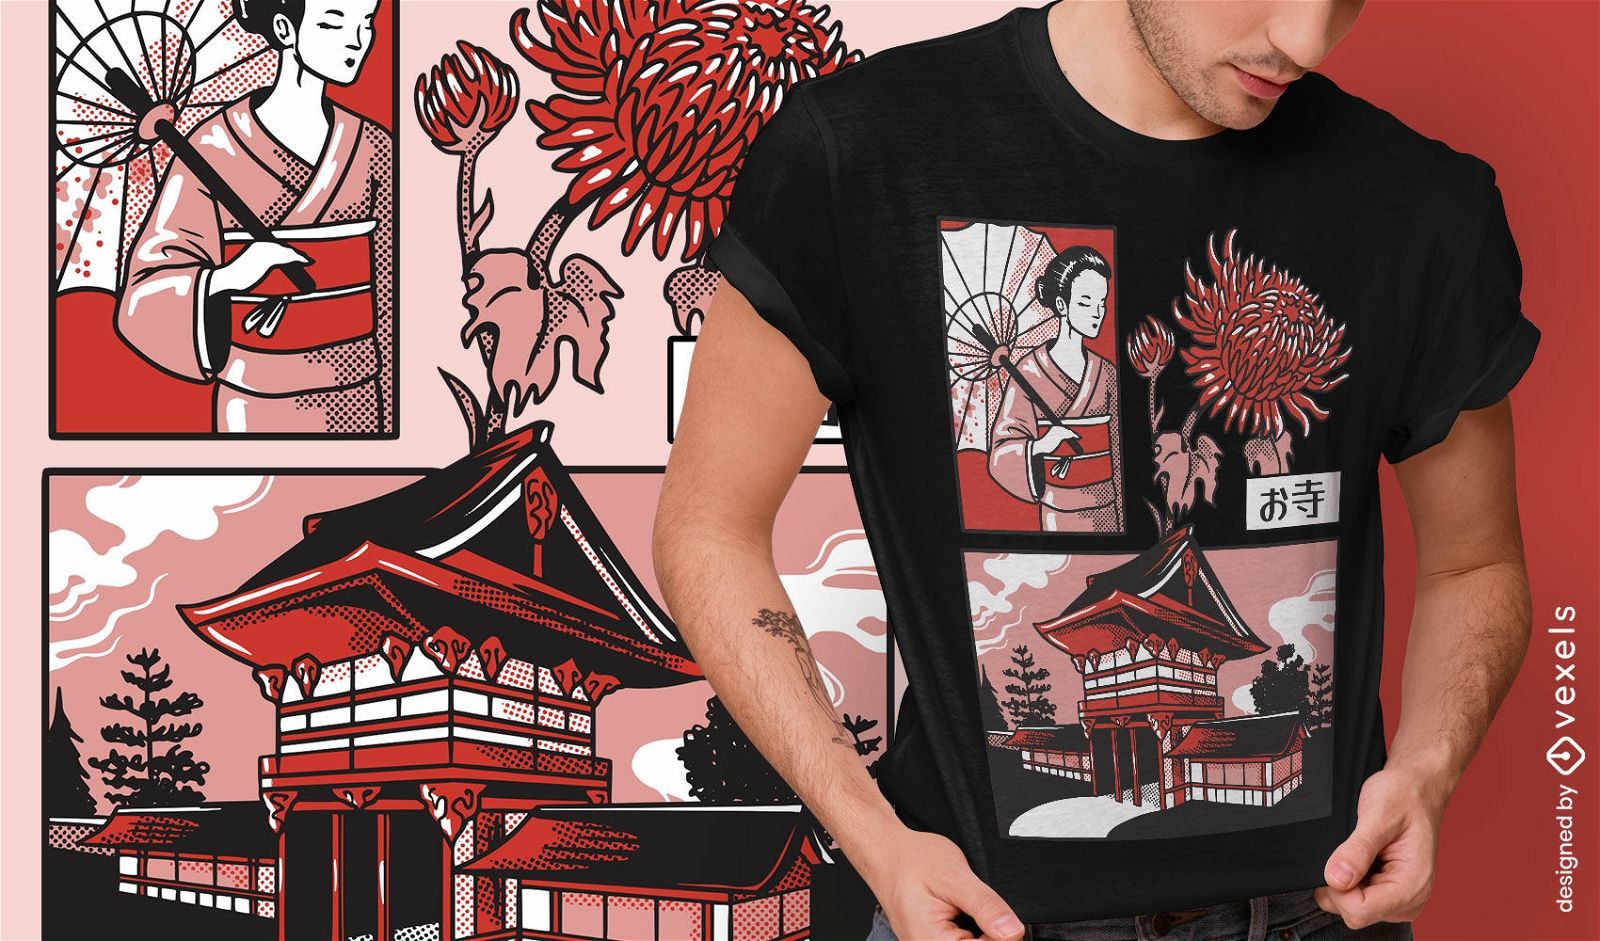
Japanese temple geisha t-shirt design
Choose a folder
All favorites
Create new
Save
Japanese temple geisha t-shirt design
Print ready
for Merch
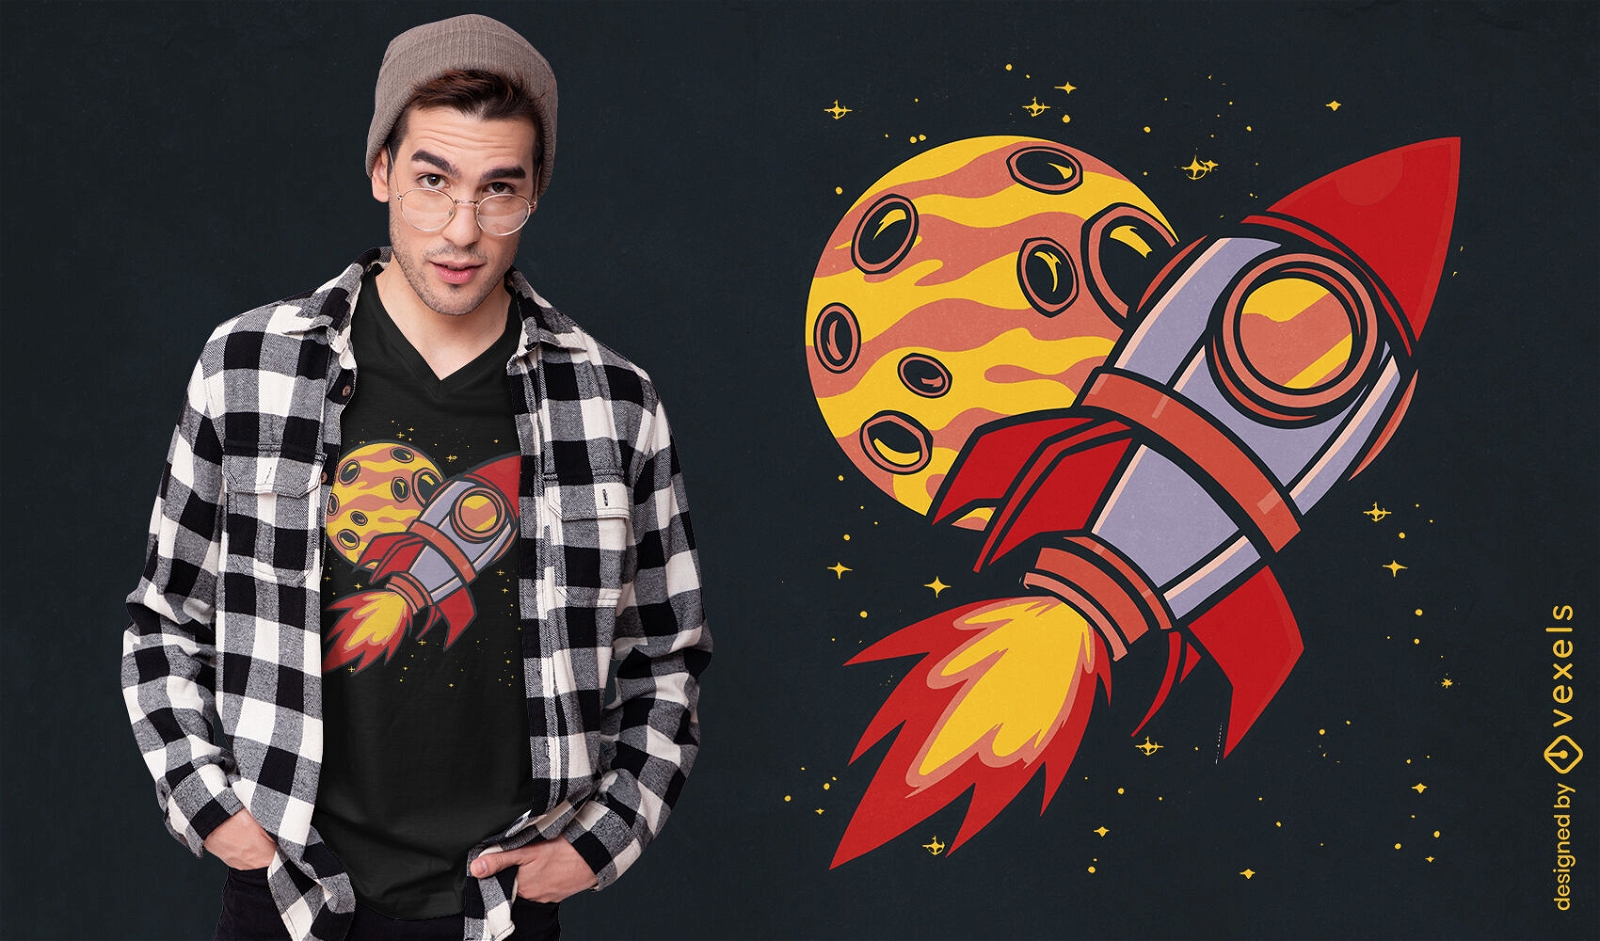
Rocket and planet space t-shirt design
Choose a folder
All favorites
Create new
Save
Rocket and planet space t-shirt design
Print ready
for Merch
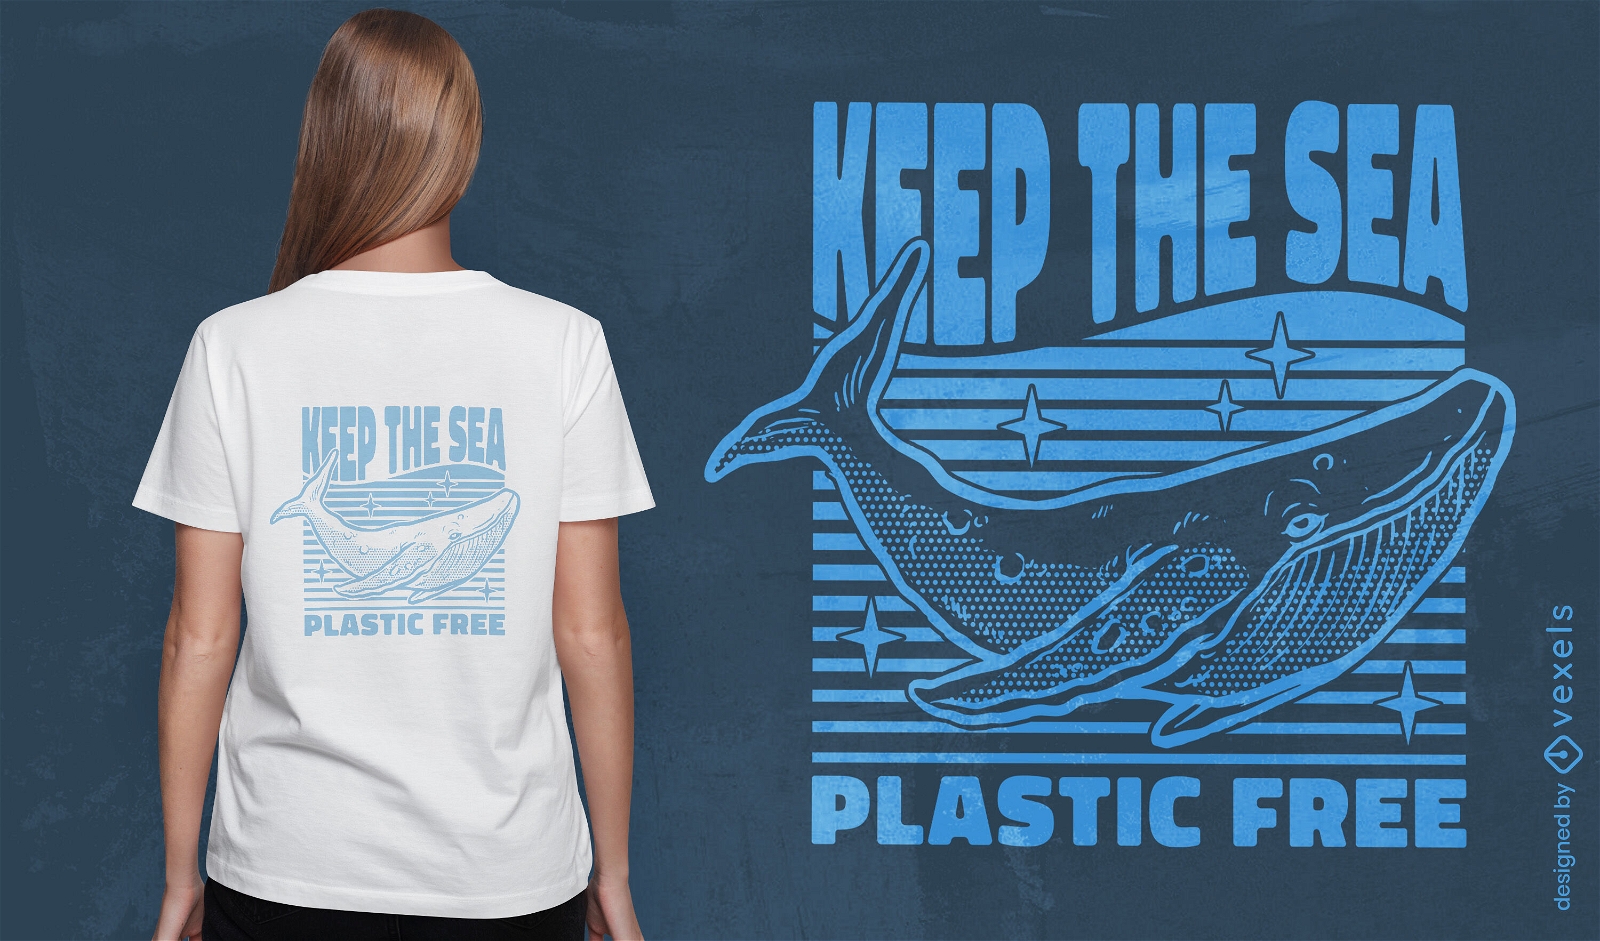
Keep the sea plastic free whale t-shirt design
Choose a folder
All favorites
Create new
Save
Keep the sea plastic free whale t-shirt design
Print ready
for Merch
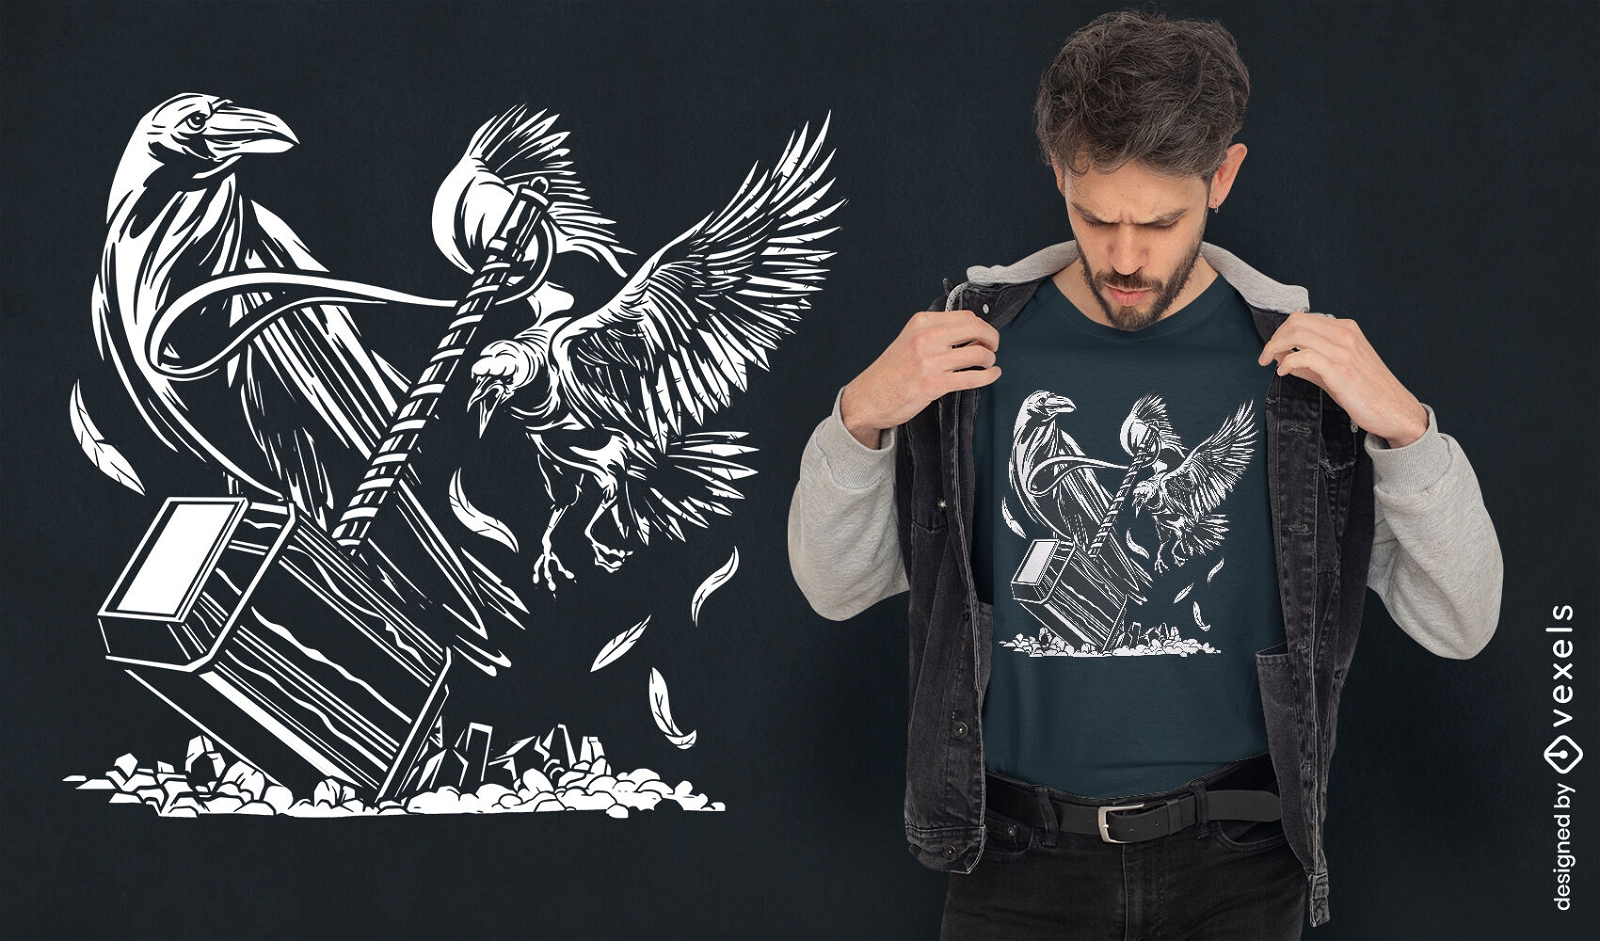
Hammer and crow birds t-shirt design
Choose a folder
All favorites
Create new
Save
Hammer and crow birds t-shirt design
Editable text
Print ready
for Merch
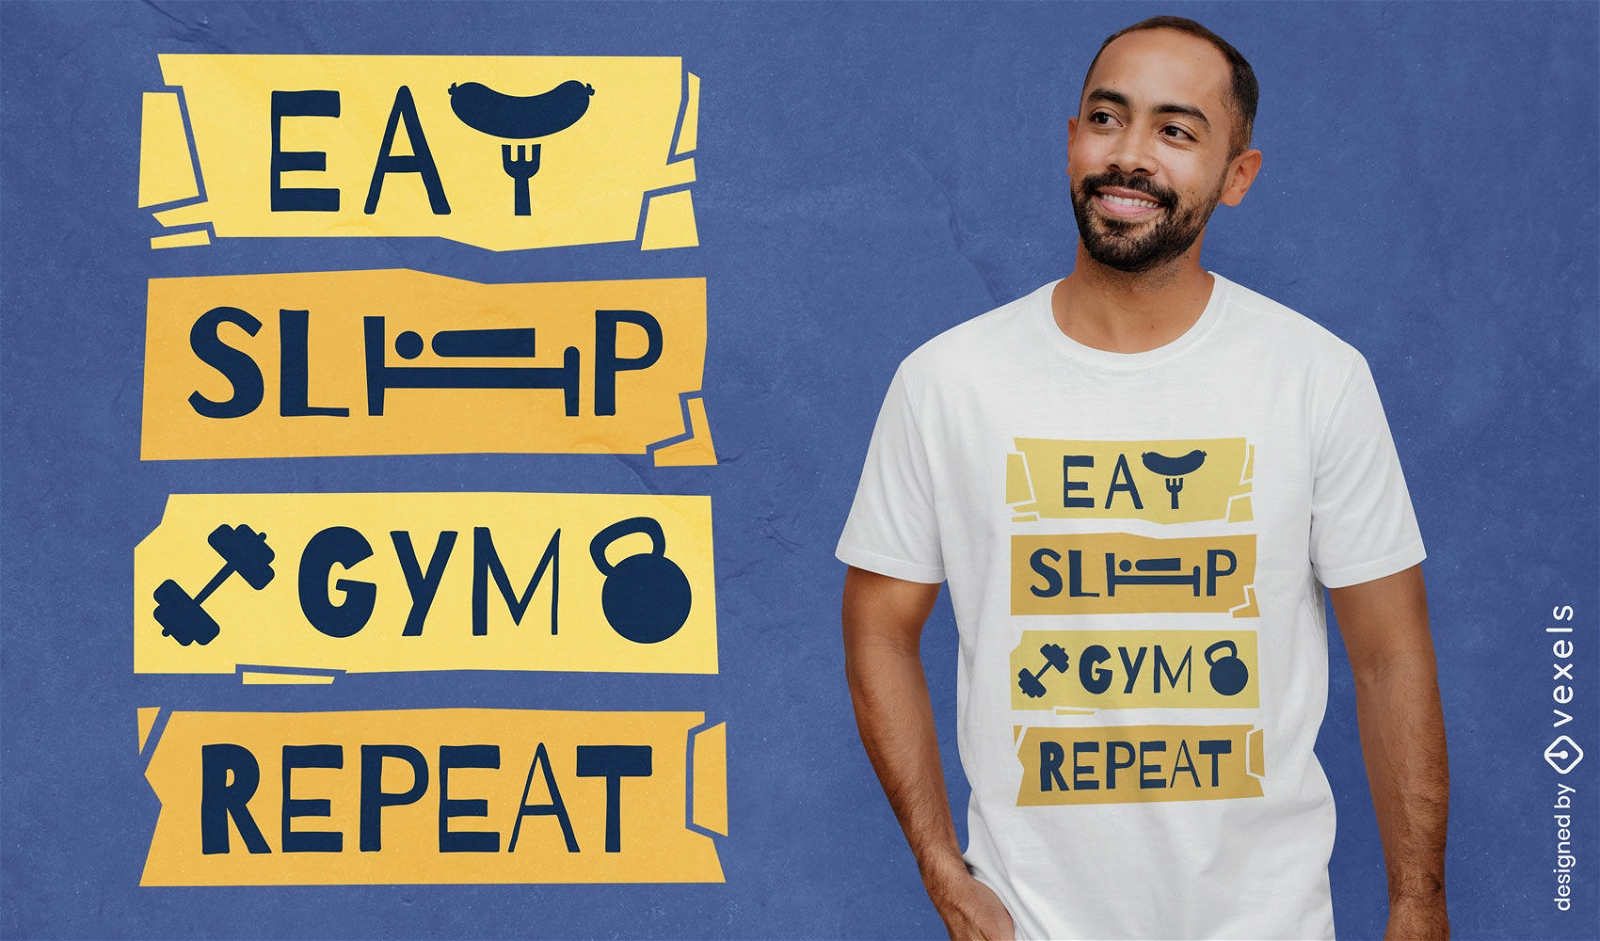
Gym routine t-shirt design
Choose a folder
All favorites
Create new
Save
Gym routine t-shirt design
Print ready
for Merch
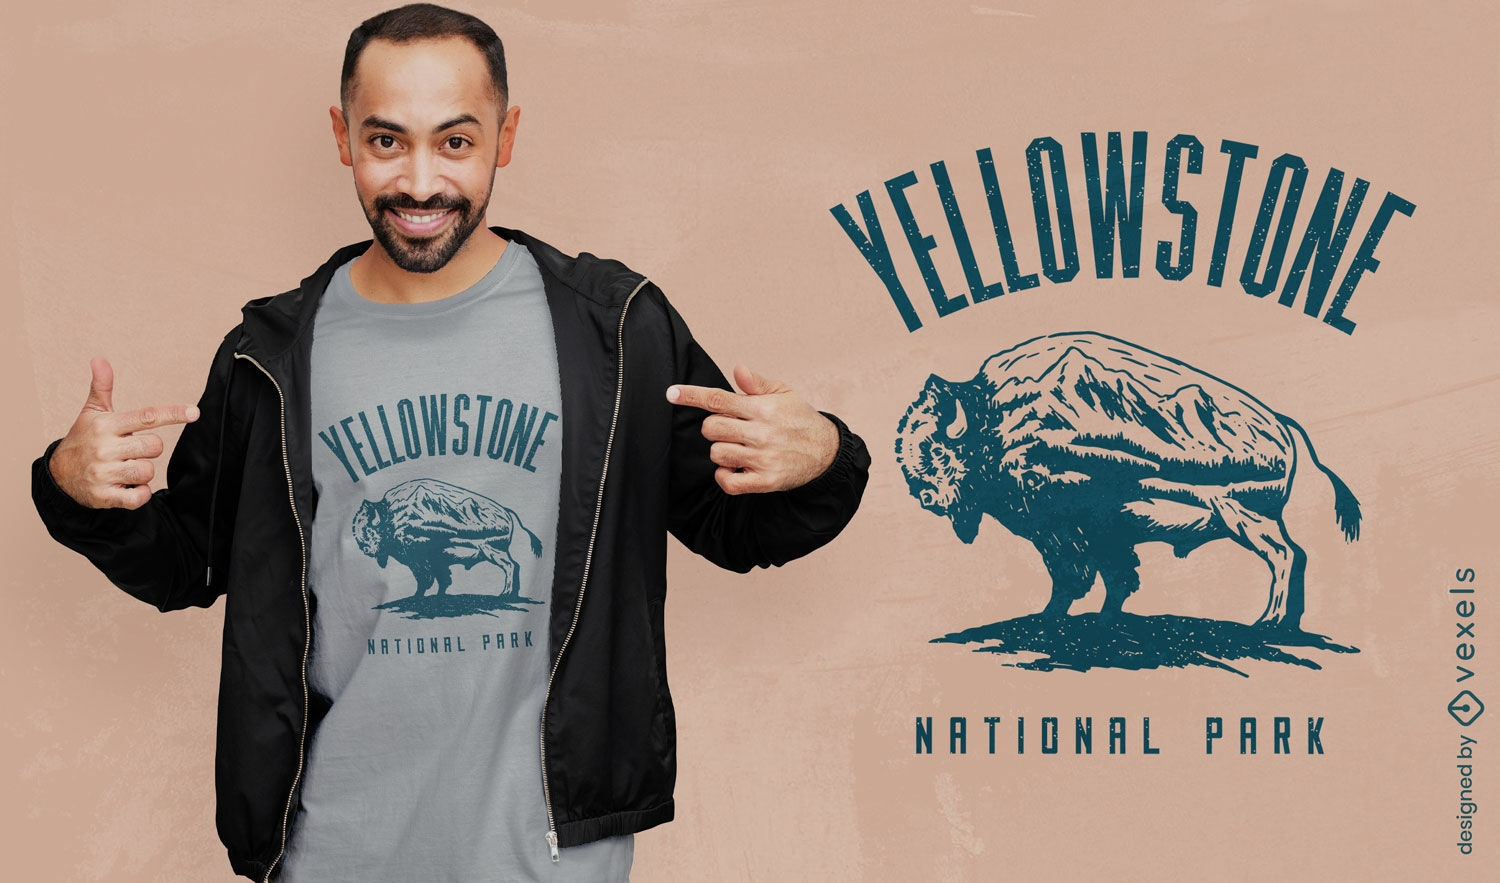
Yellowstone national park mountains t-shirt design
Choose a folder
All favorites
Create new
Save
Yellowstone national park mountains t-shirt design
Print ready
for Merch
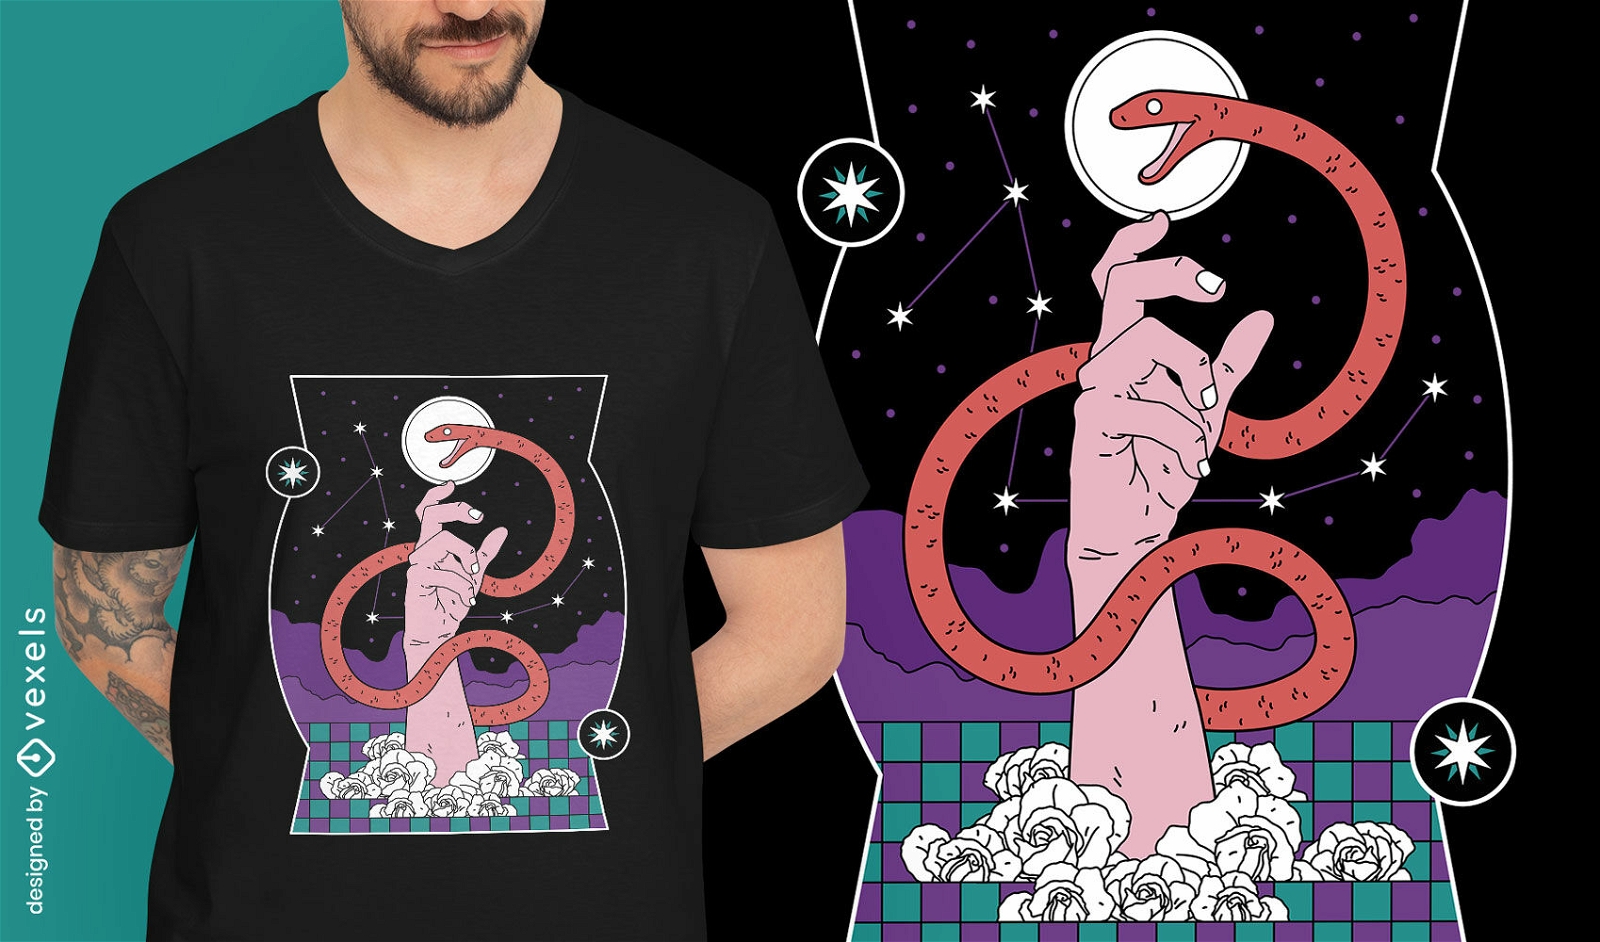
Snake and hand t-shirt design
Choose a folder
All favorites
Create new
Save
Snake and hand t-shirt design
Print ready
for Merch
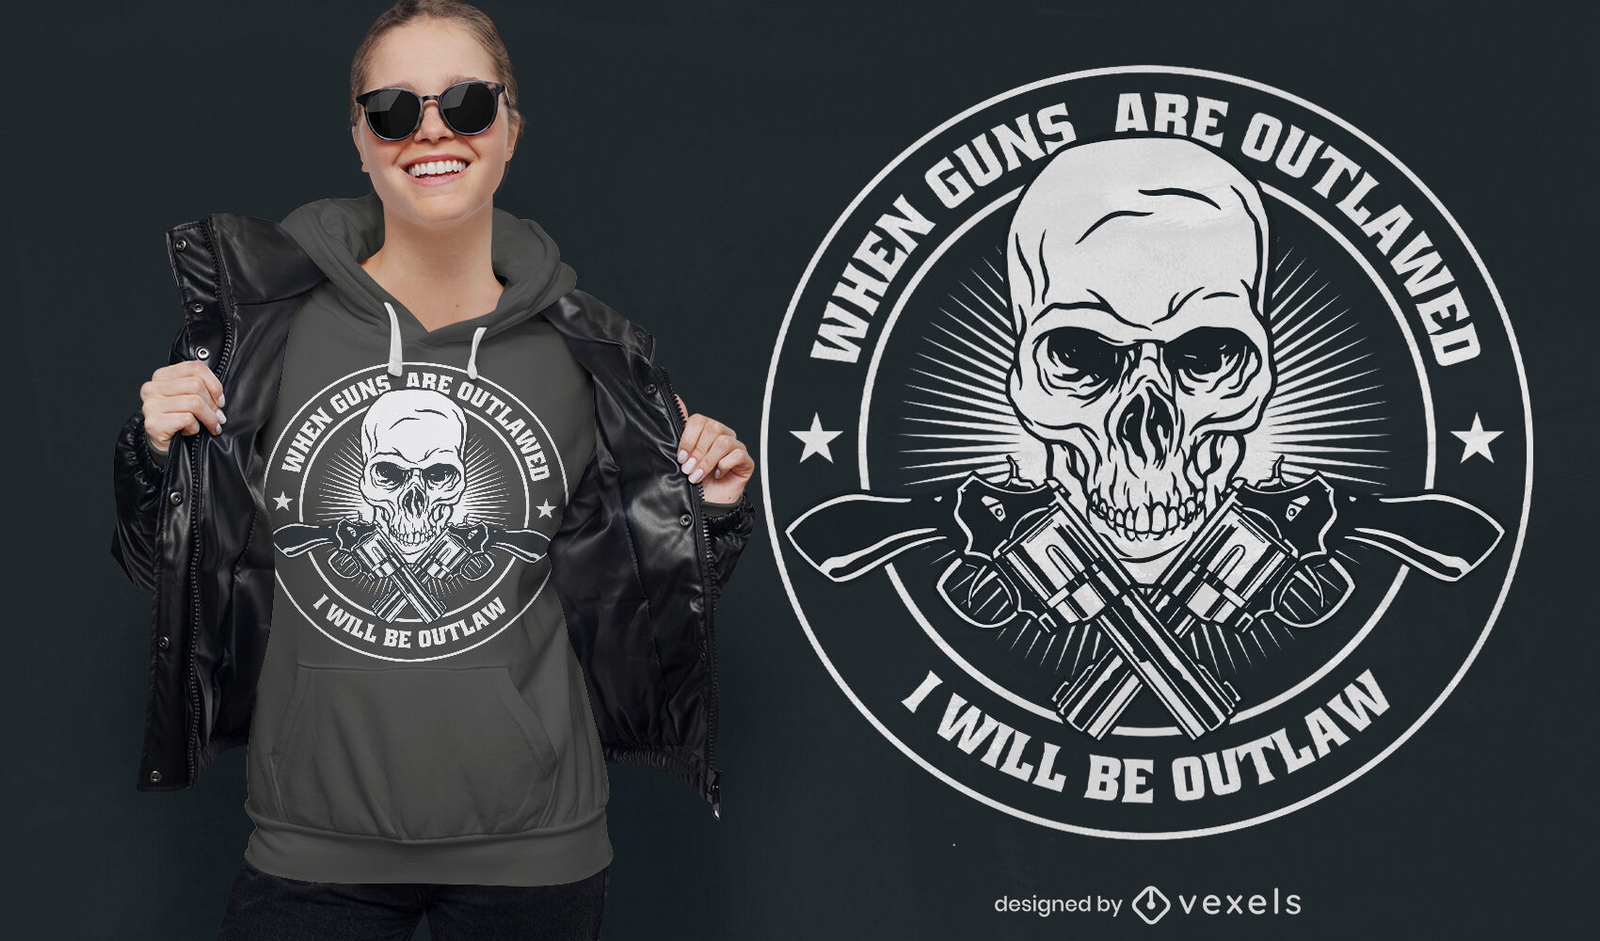
Outlawed Guns T-shirt Design
Choose a folder
All favorites
Create new
Save
Outlawed Guns T-shirt Design
Print ready
for Merch
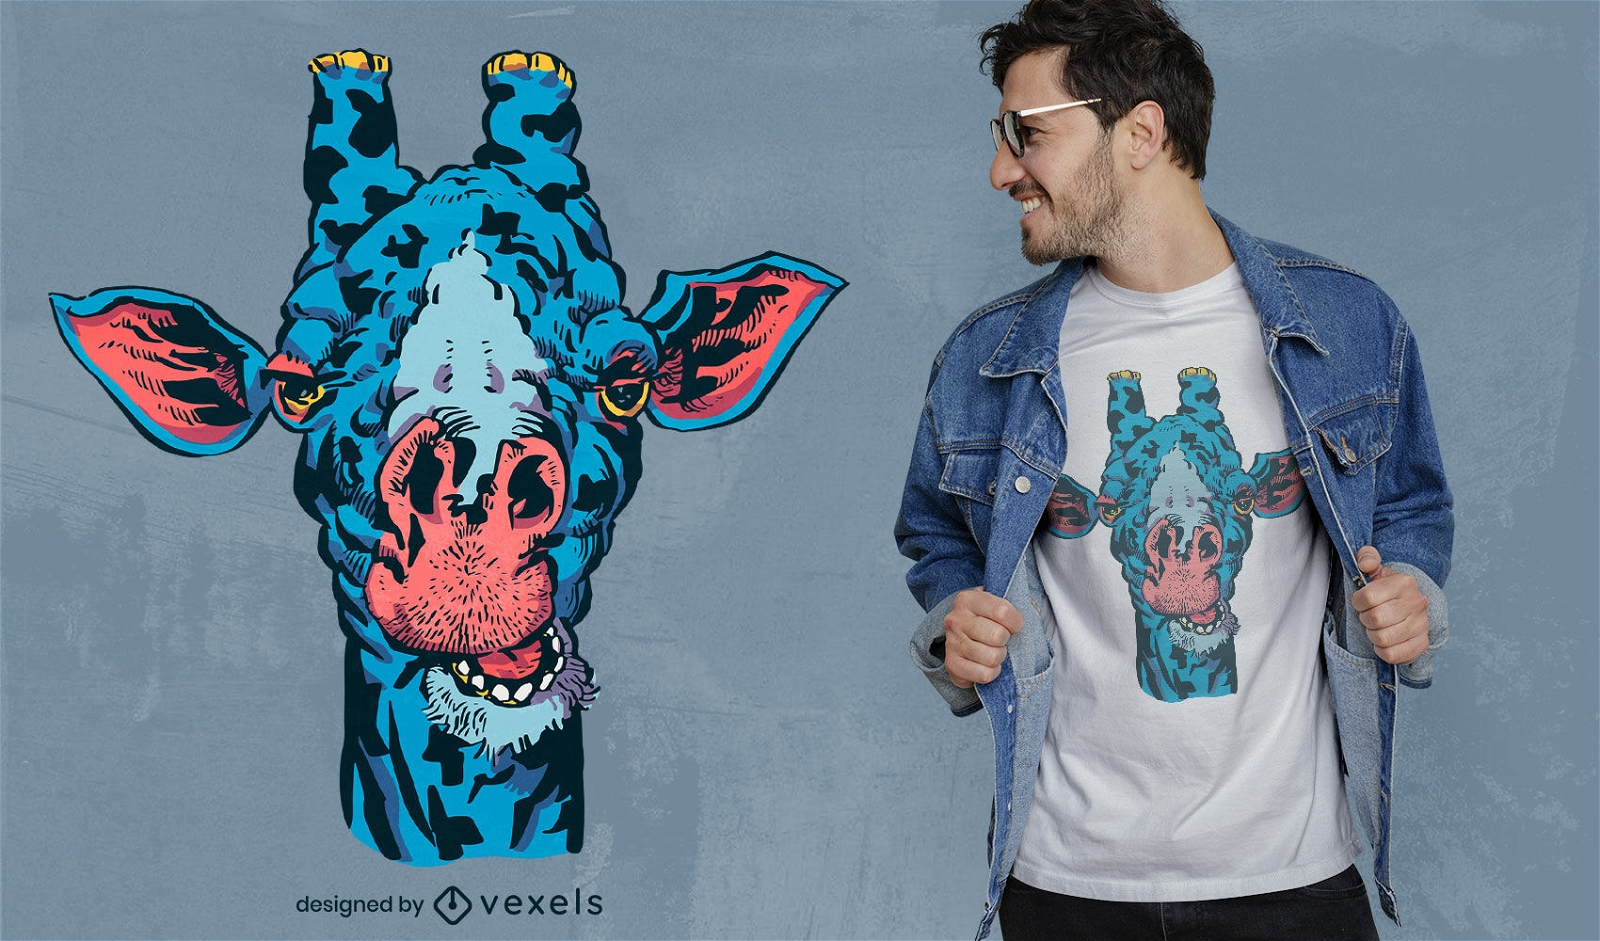
Blue giraffe wild animal t-shirt design
Choose a folder
All favorites
Create new
Save
Blue giraffe wild animal t-shirt design
Boost Your Business
With The Leading Graphic Platform For Merch.
SEE PLANS
Next
of 817
prev page
next page