Design Library
Explore Designs
New Merch Designs
Trending Merch Designs
Vectors
PNGs & SVGs
Mockups
T-Shirts
T-Shirt PSD Templates
KDP Designs
Phone Cases
Pillows
Tote Bags
Posters
Mugs
Design Tools
Designer
New!
T-shirt Maker
Mockup Generator
Quote Generator
Logo Maker
Resources
Merch Digest
Blog
Help Center
Creators Program
Learn About Merch
Changelog
API Access
Pricing
Loading...
Sign Up
Login
Merch Vectors
grafico
Design Library
Explore Designs
New Merch Designs
Trending Merch Designs
Vectors
PNGs & SVGs
Mockups
T-Shirts
T-Shirt PSD Templates
KDP Designs
Phone Cases
Pillows
Tote Bags
Posters
Mugs
Design Tools
Designer
New!
T-shirt Maker
Mockup Generator
Quote Generator
Logo Maker
Resources
Merch Digest
Blog
Help Center
Creators Program
Learn About Merch
Changelog
API Access
PLANS
Merch Vectors
grafico
35968 grafico Vector Designs for T-Shirts and merch
Download & buy editable grafico AI Vector Graphics Designs for T shirts, Phone Cases, Book Covers and other Merch
Sort by
Most relevant
Sponsored results by
Get 15% off with code: VEXELS15
Show more
Print ready
for Merch
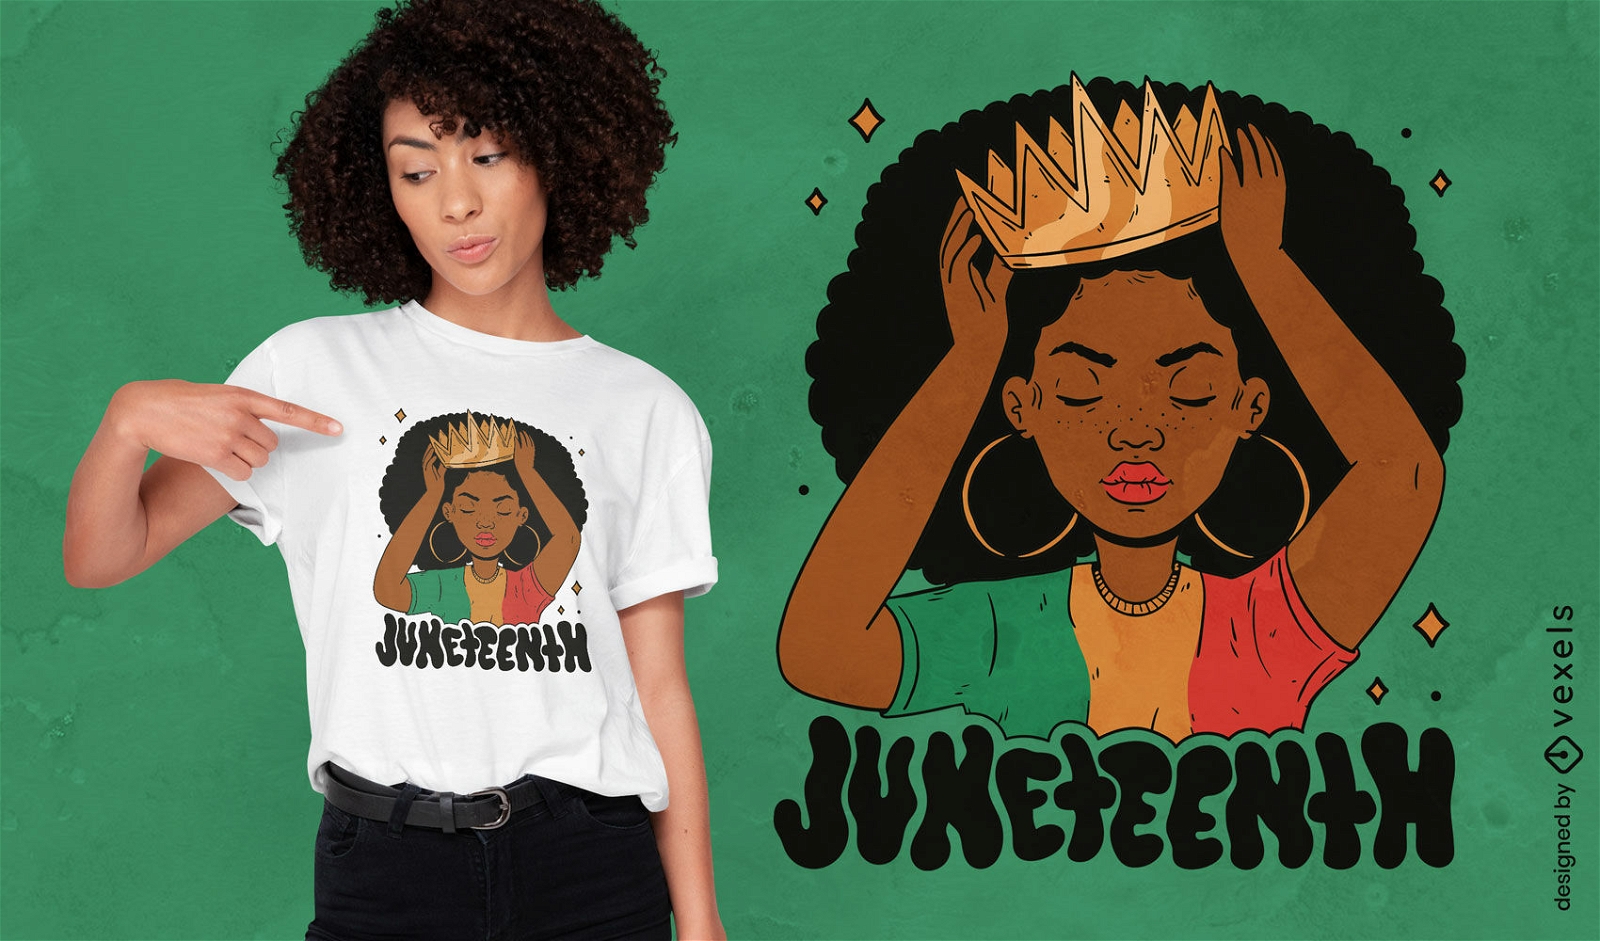
African American girl queen t-shirt design
Choose a folder
All favorites
Create new
Save
African American girl queen t-shirt design
Print ready
for Merch
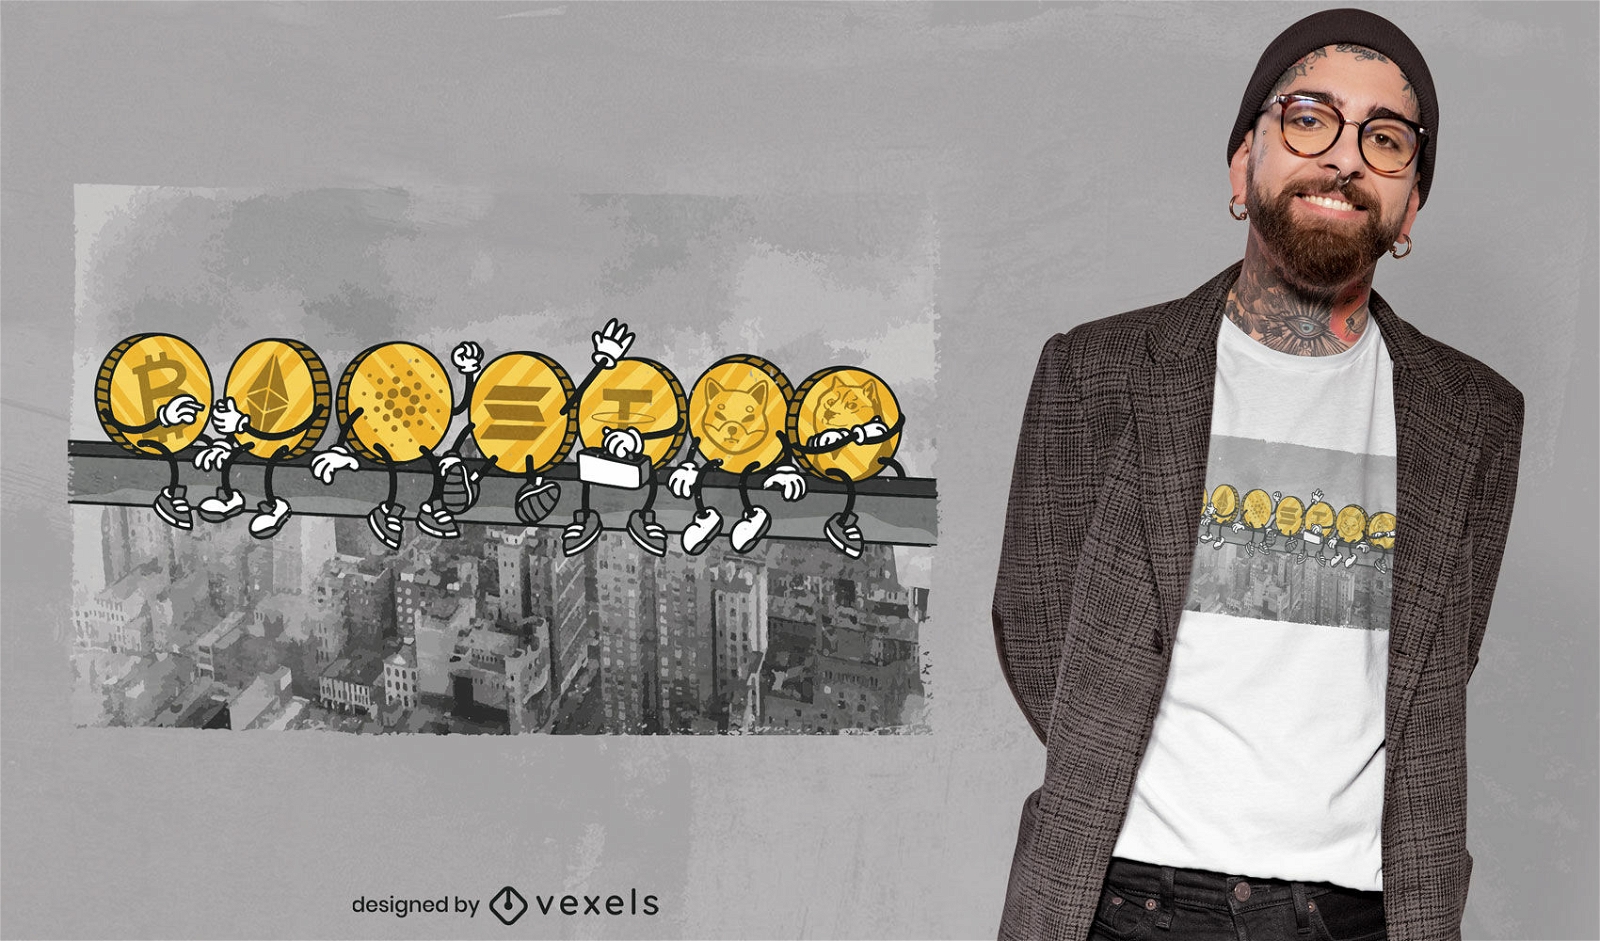
Cryptocurrency workers t-shirt design
Choose a folder
All favorites
Create new
Save
Cryptocurrency workers t-shirt design
Print ready
for Merch
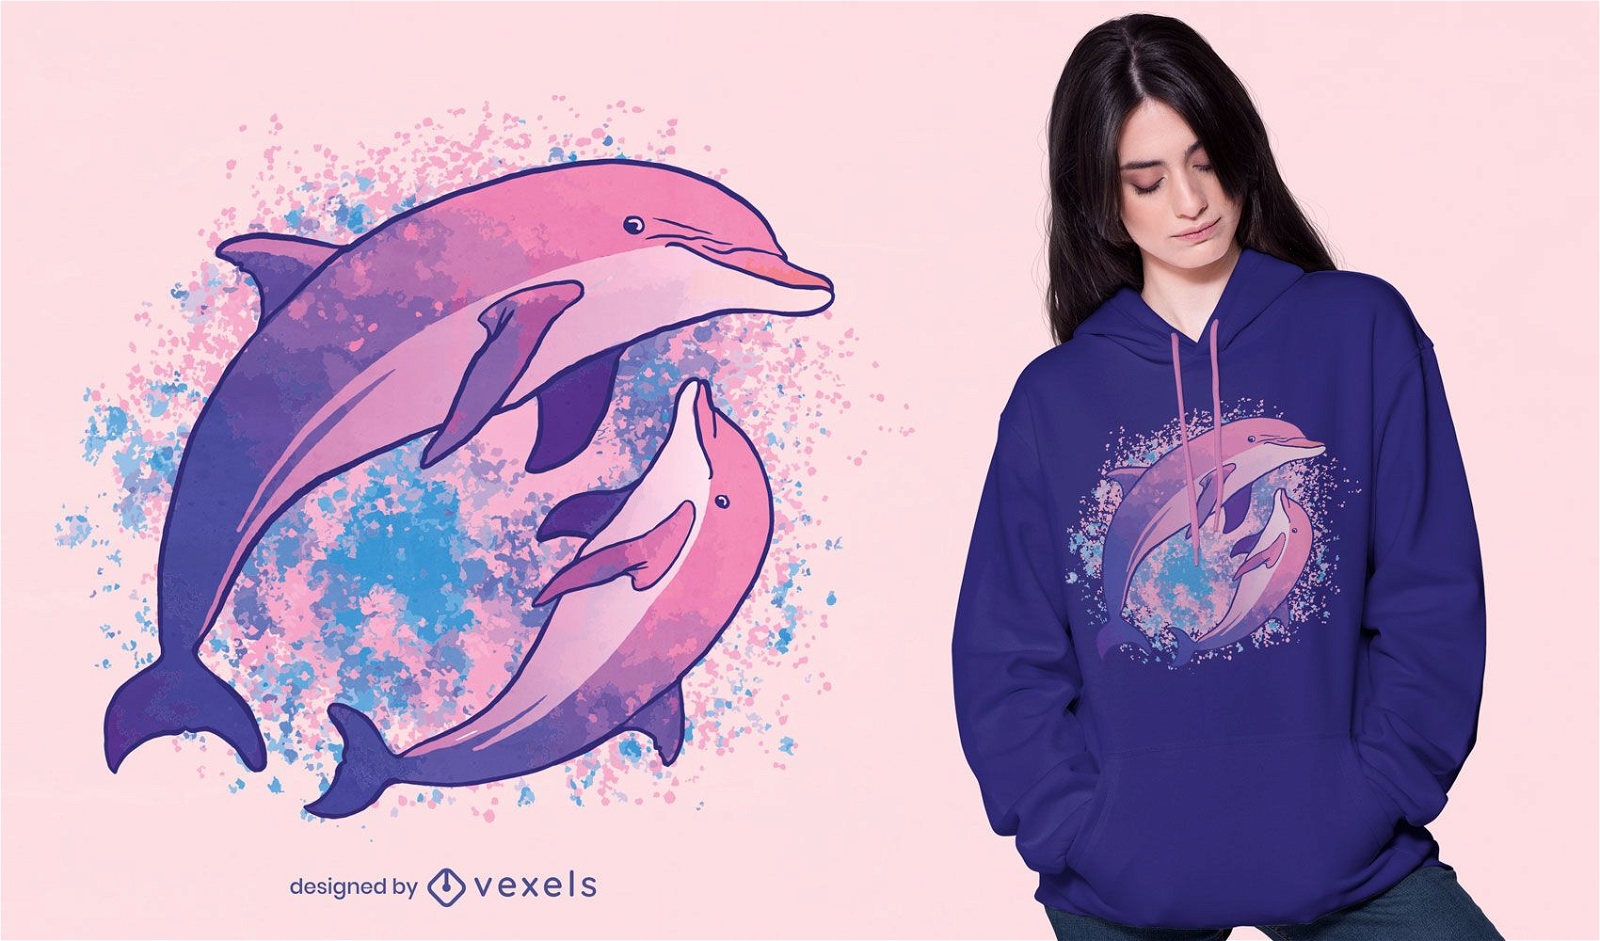
Dolphin watercolor composition t-shirt design
Choose a folder
All favorites
Create new
Save
Dolphin watercolor composition t-shirt design
Print ready
for Merch
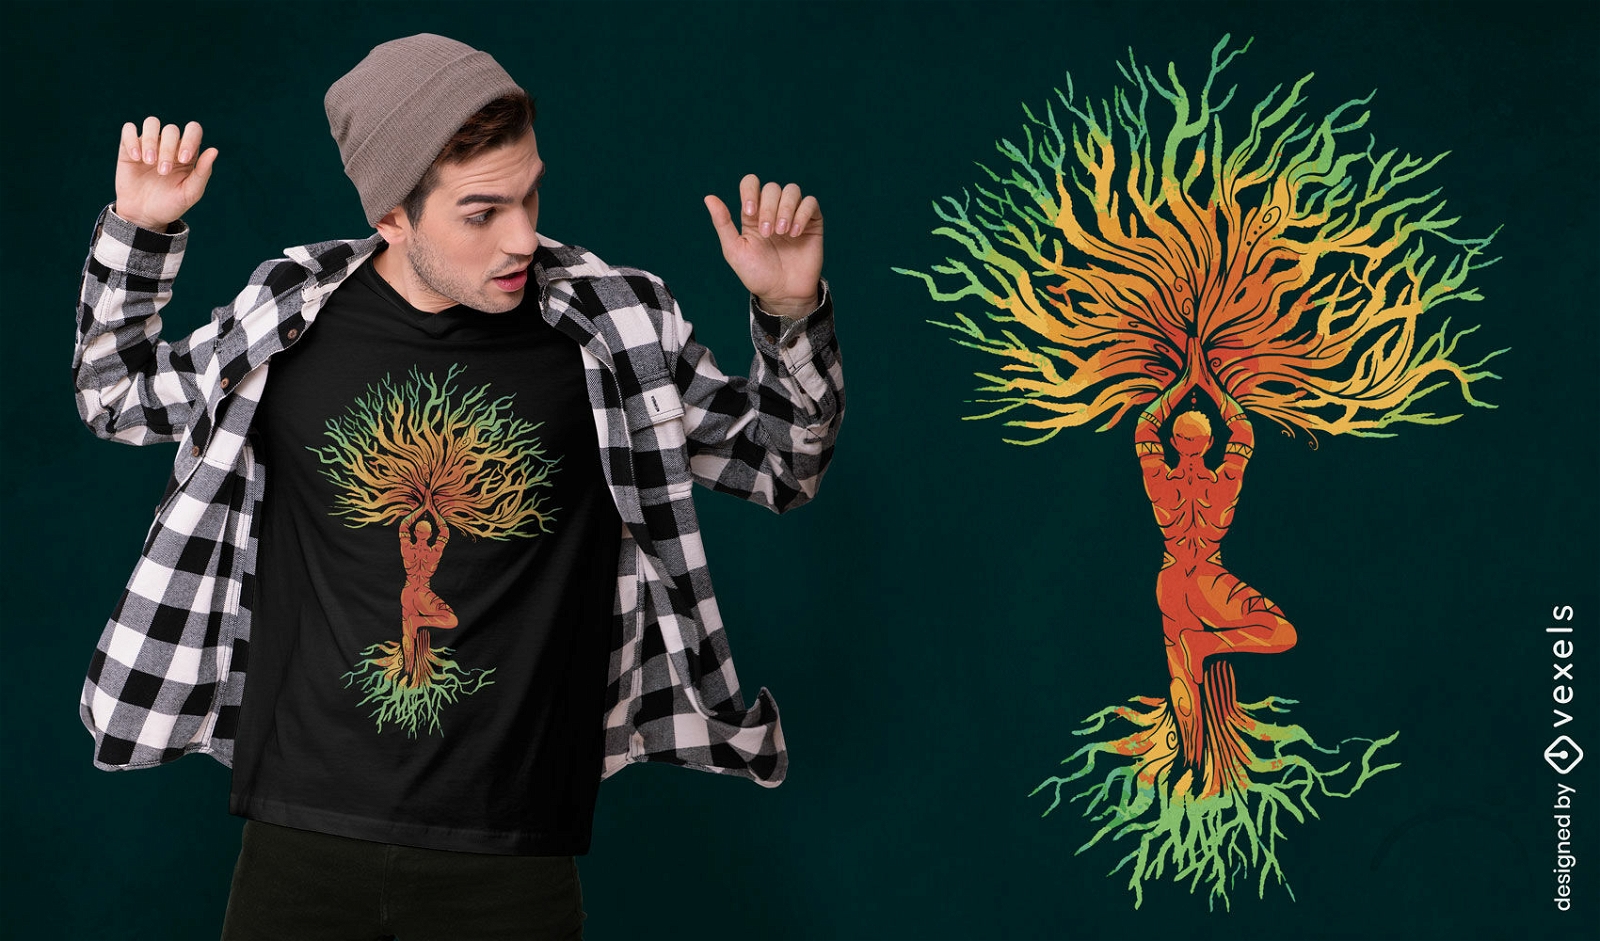
Man doing yoga in nature t-shirt design
Choose a folder
All favorites
Create new
Save
Man doing yoga in nature t-shirt design
Print ready
for Merch
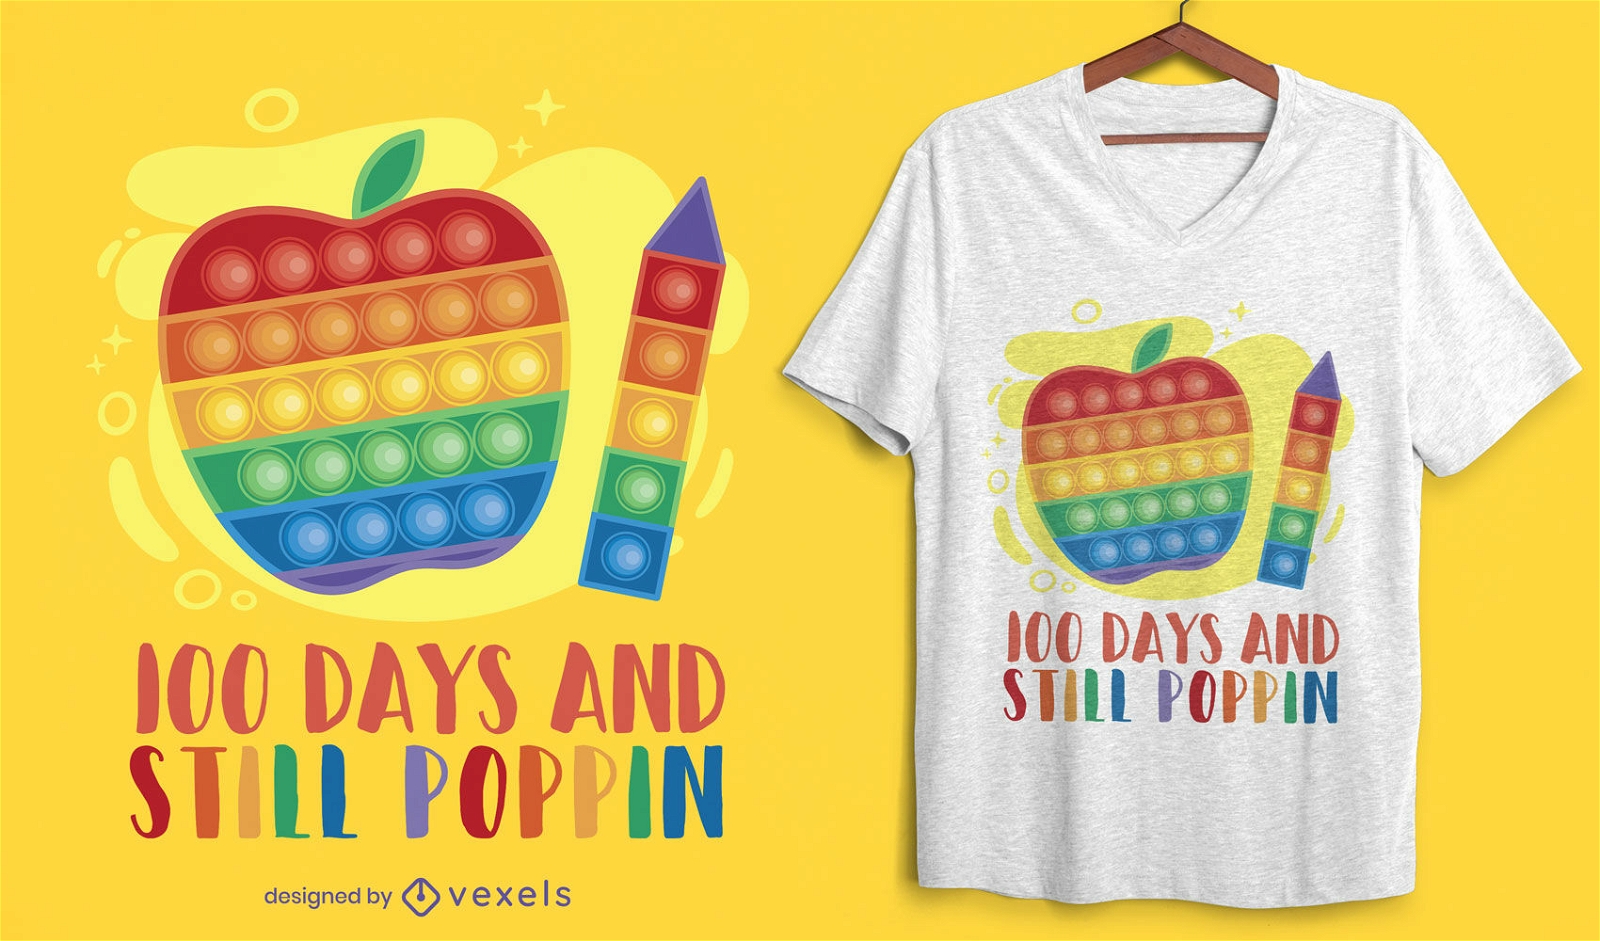
100 days of school poppin t-shirt design
Choose a folder
All favorites
Create new
Save
100 days of school poppin t-shirt design
Print ready
for Merch
Physics elements t-shirt design
Choose a folder
All favorites
Create new
Save
Physics elements t-shirt design
Print ready
for Merch
Axolotl animal meditation t-shirt design
Choose a folder
All favorites
Create new
Save
Axolotl animal meditation t-shirt design
Print ready
for Merch
Dog memes collage t-shirt design
Choose a folder
All favorites
Create new
Save
Dog memes collage t-shirt design
Print ready
for Merch
Axolotl scholar t-shirt design
Choose a folder
All favorites
Create new
Save
Axolotl scholar t-shirt design
Print ready
for Merch
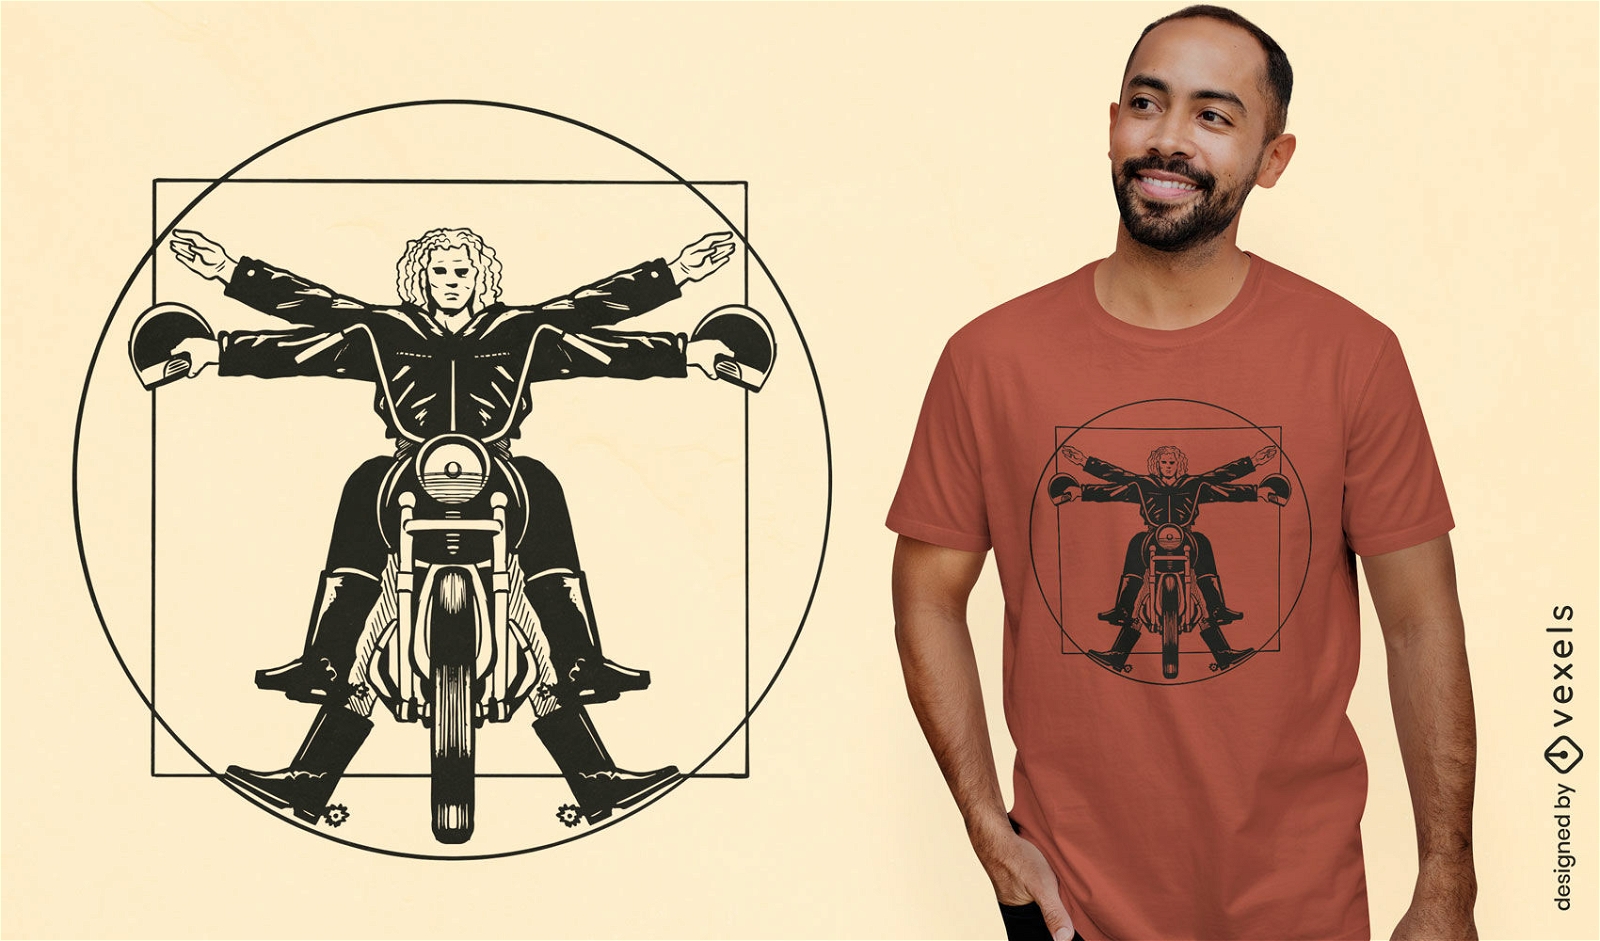
Vitruvian biker t-shirt design
Choose a folder
All favorites
Create new
Save
Vitruvian biker t-shirt design
Editable text
Print ready
for Merch
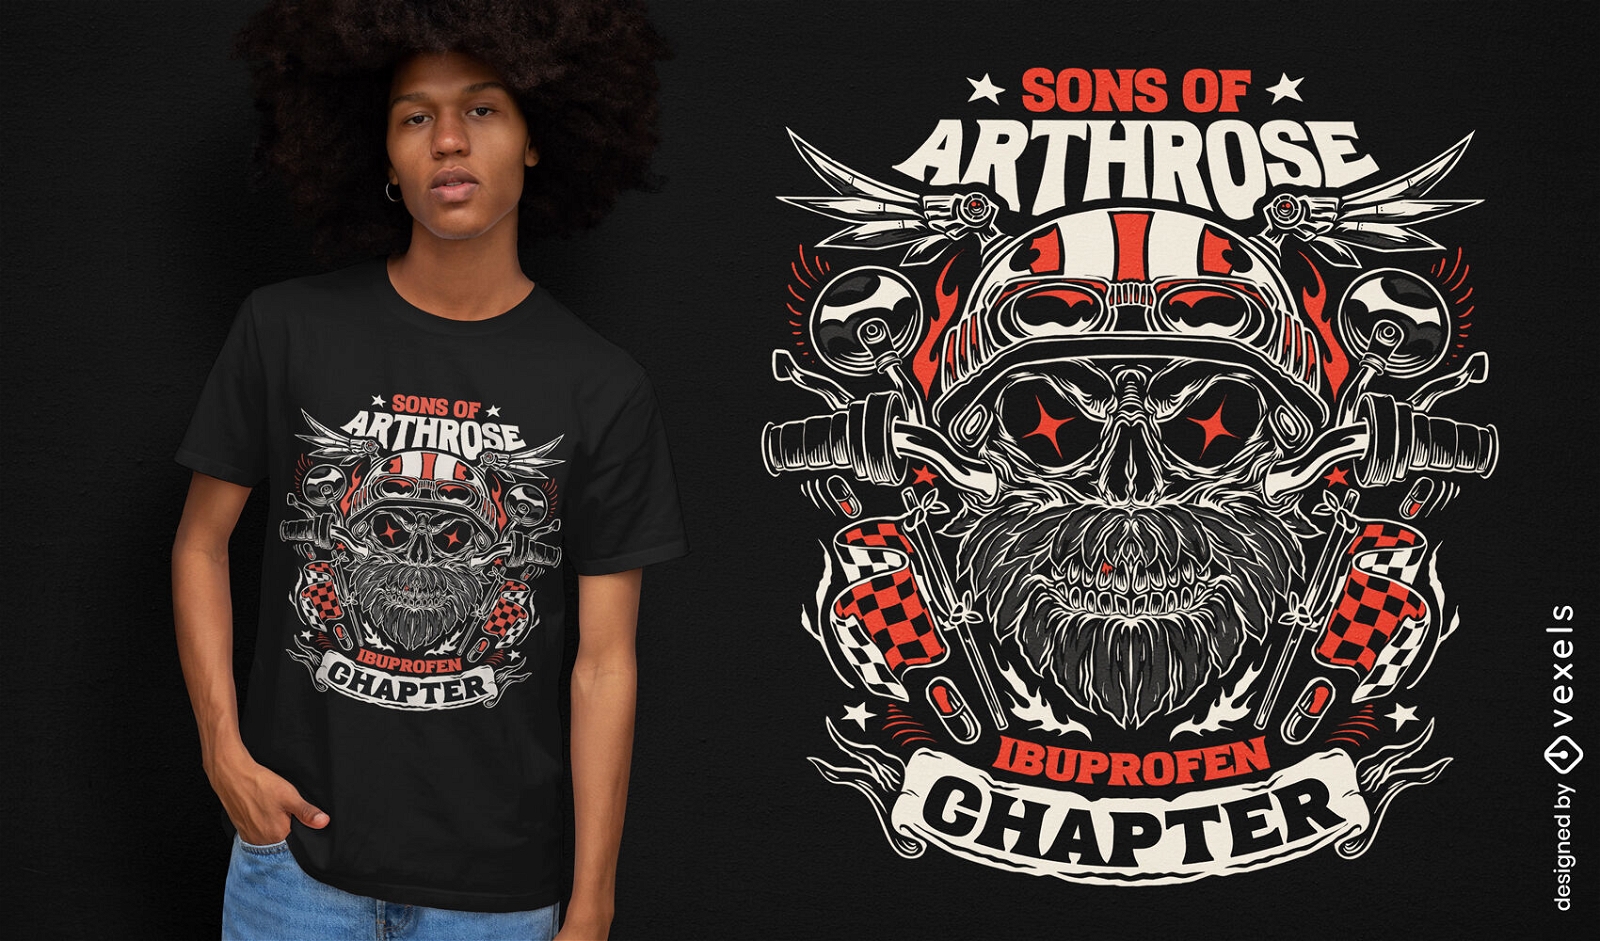
Biker skull vintage horror t-shirt design
Choose a folder
All favorites
Create new
Save
Biker skull vintage horror t-shirt design
Print ready
for Merch
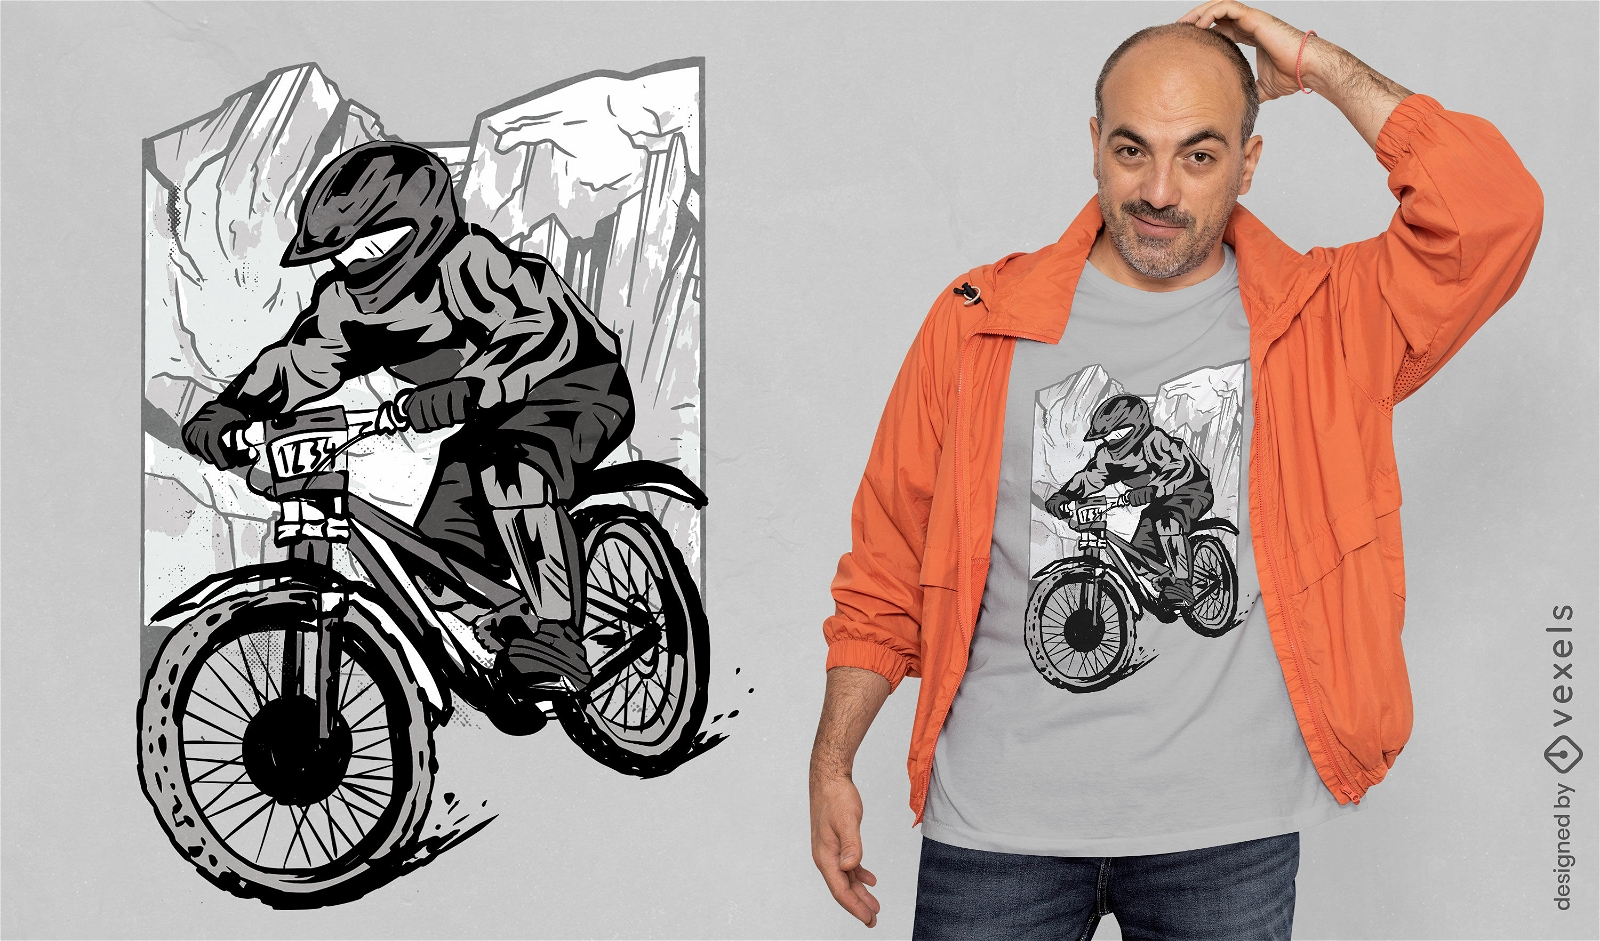
Mountain bike transport t-shirt design
Choose a folder
All favorites
Create new
Save
Mountain bike transport t-shirt design
Print ready
for Merch
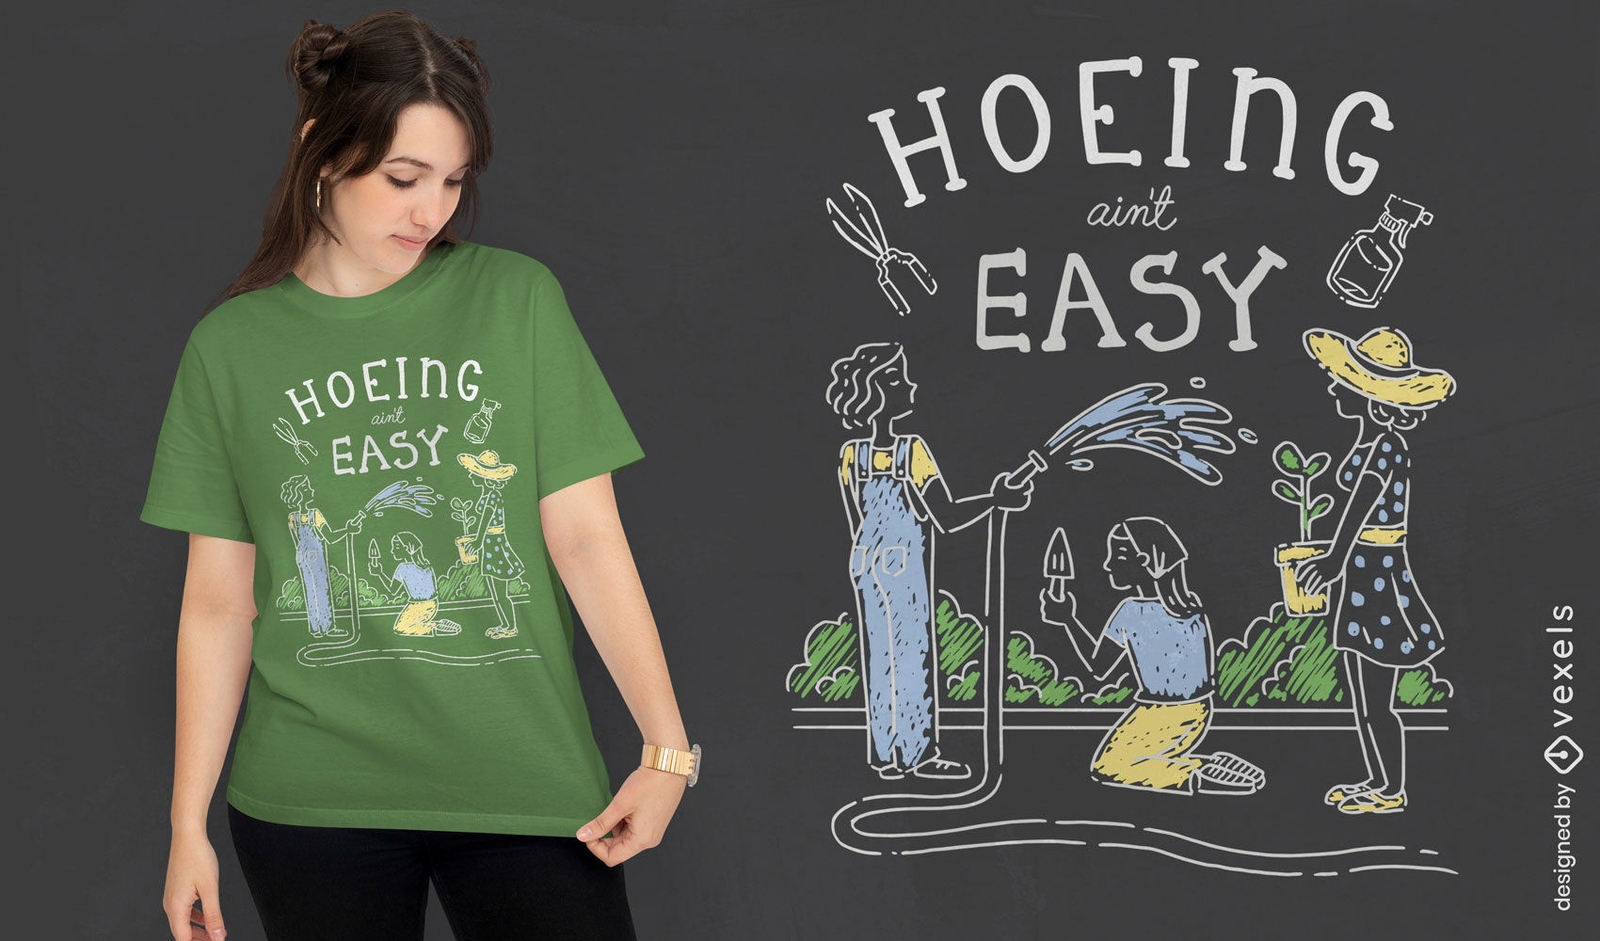
Hoeing ain't easy funny gardening pun t-shirt design
Choose a folder
All favorites
Create new
Save
Hoeing ain't easy funny gardening pun t-shirt design
Print ready
for Merch
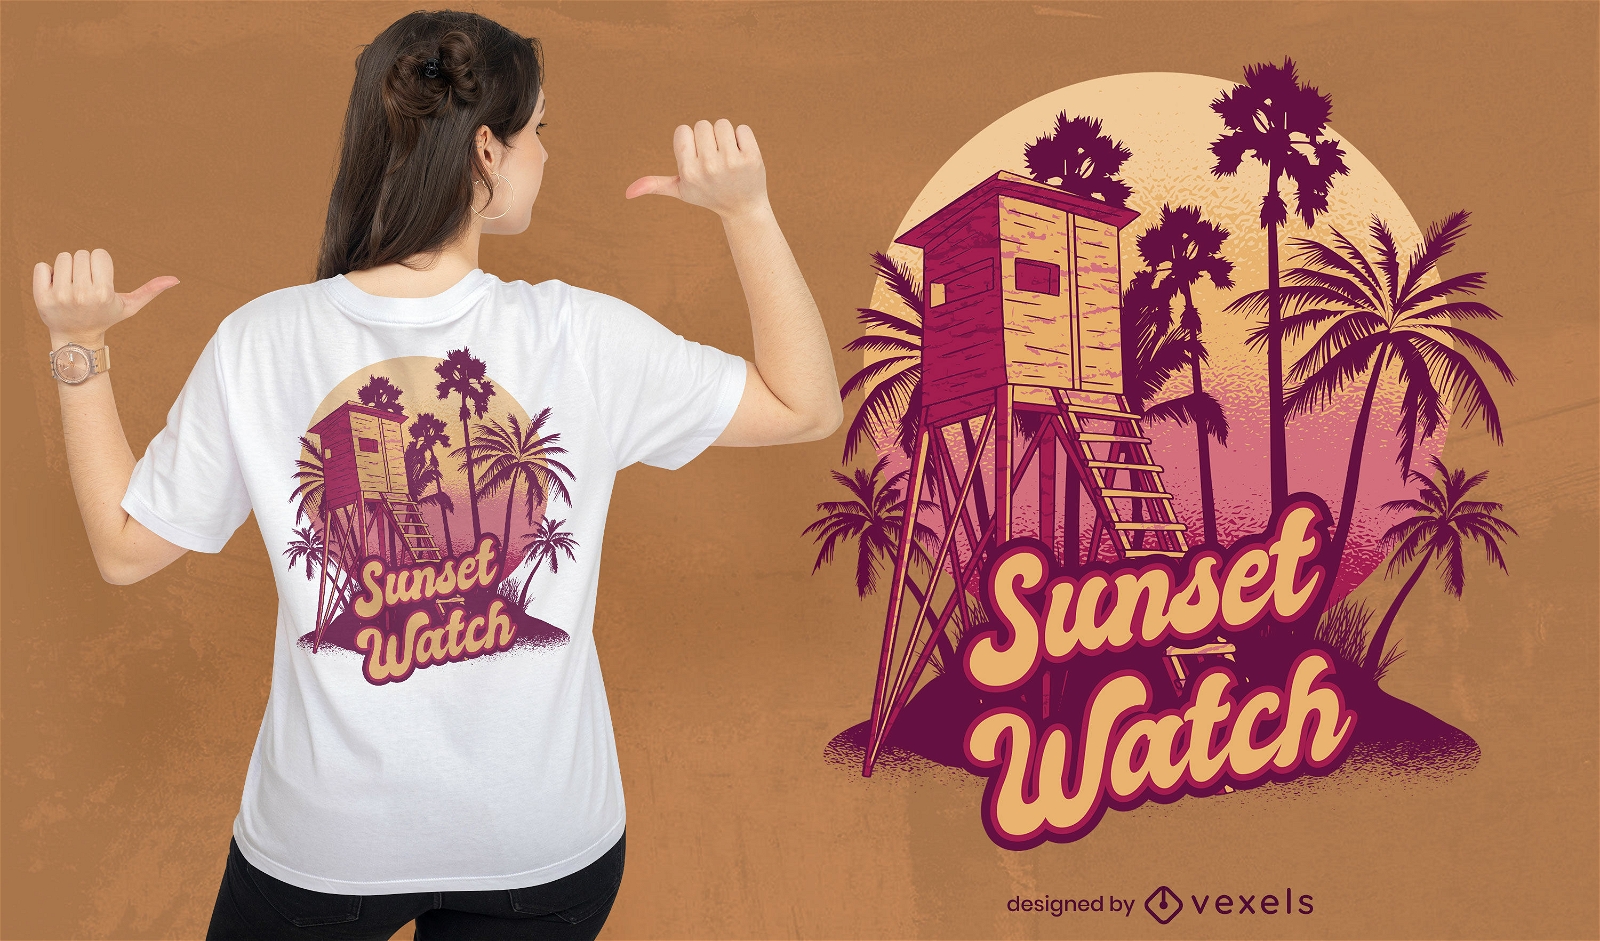
Lifeguard tower beach t-shirt design
Choose a folder
All favorites
Create new
Save
Lifeguard tower beach t-shirt design
Print ready
for Merch
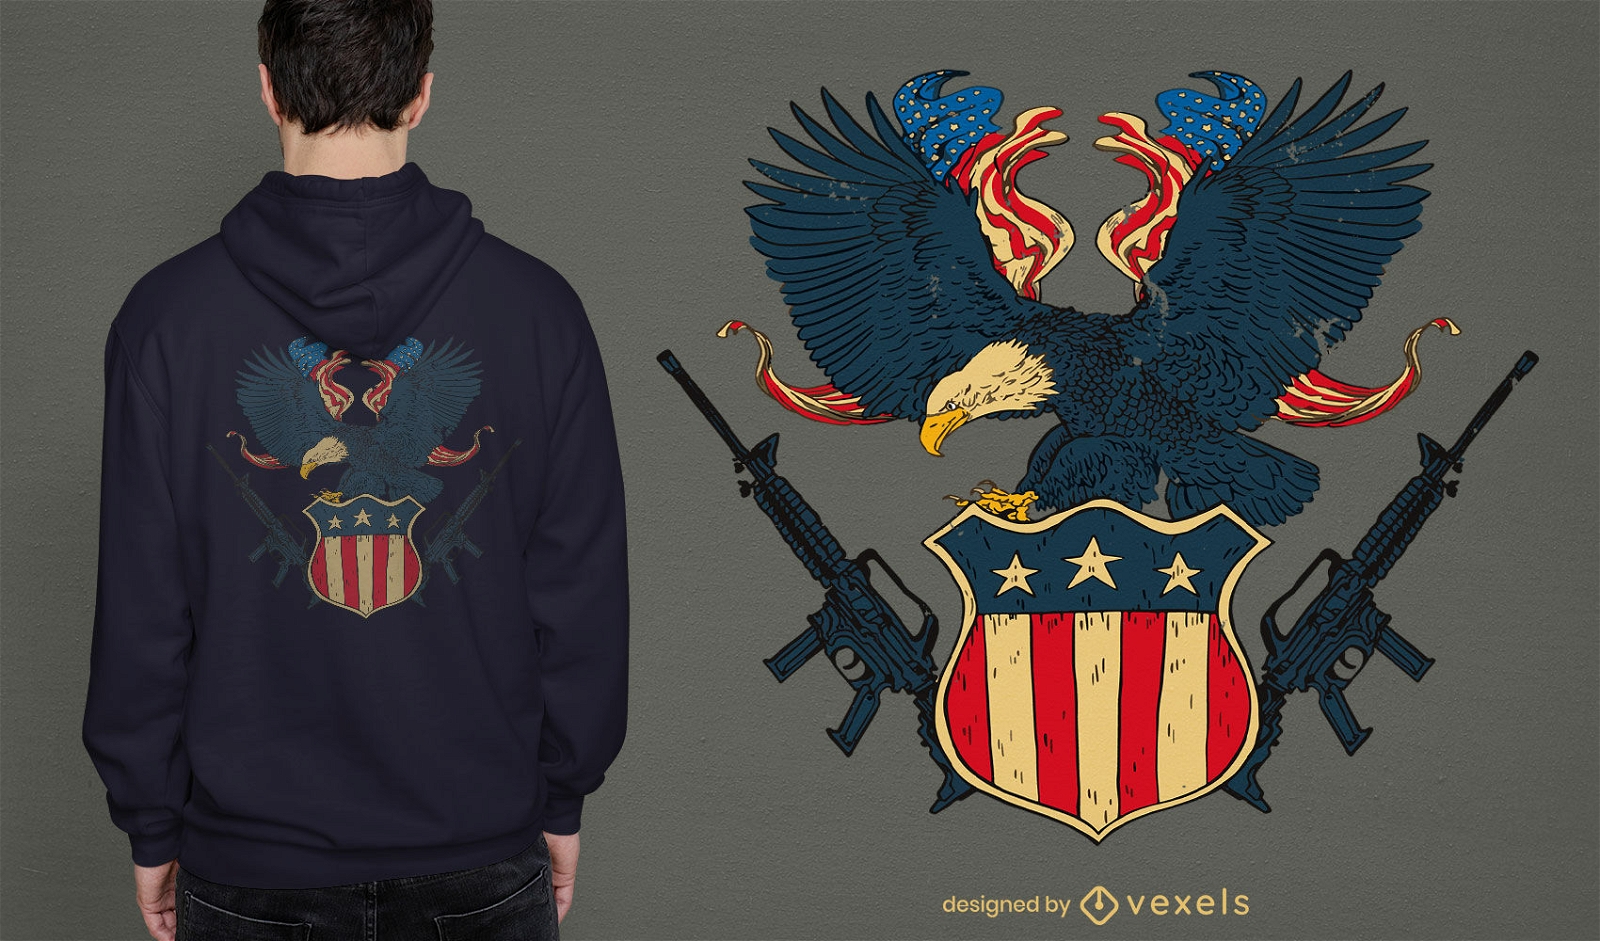
Veterans day american t-shirt design
Choose a folder
All favorites
Create new
Save
Veterans day american t-shirt design
Print ready
for Merch
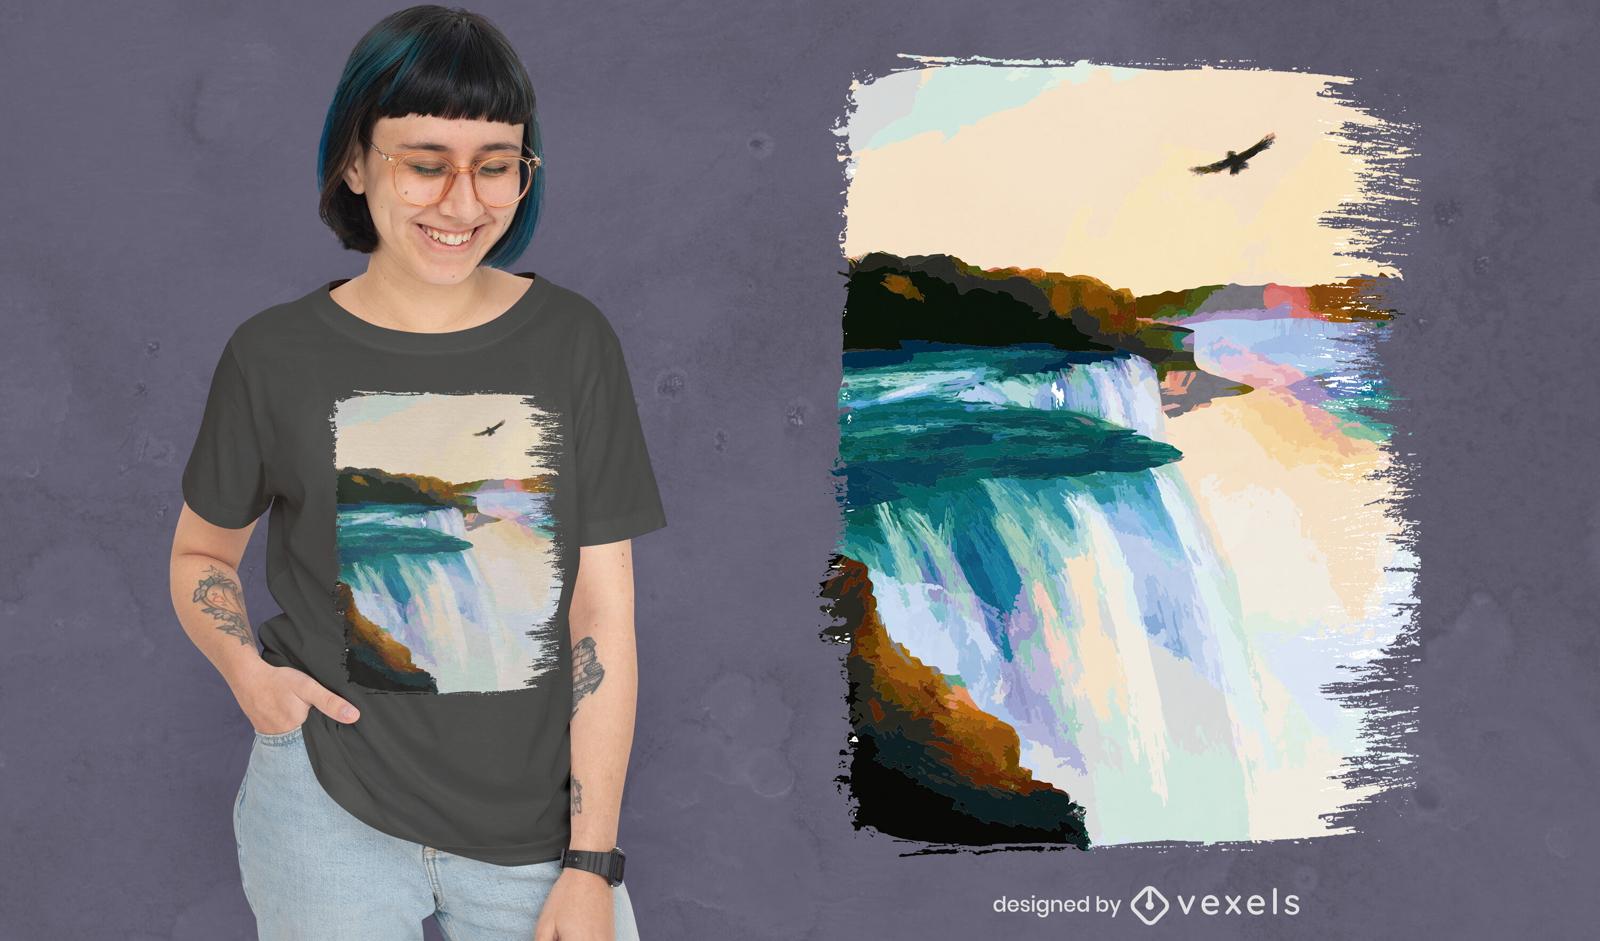
Niagara falls painting t-shirt design
Choose a folder
All favorites
Create new
Save
Niagara falls painting t-shirt design
Print ready
for Merch
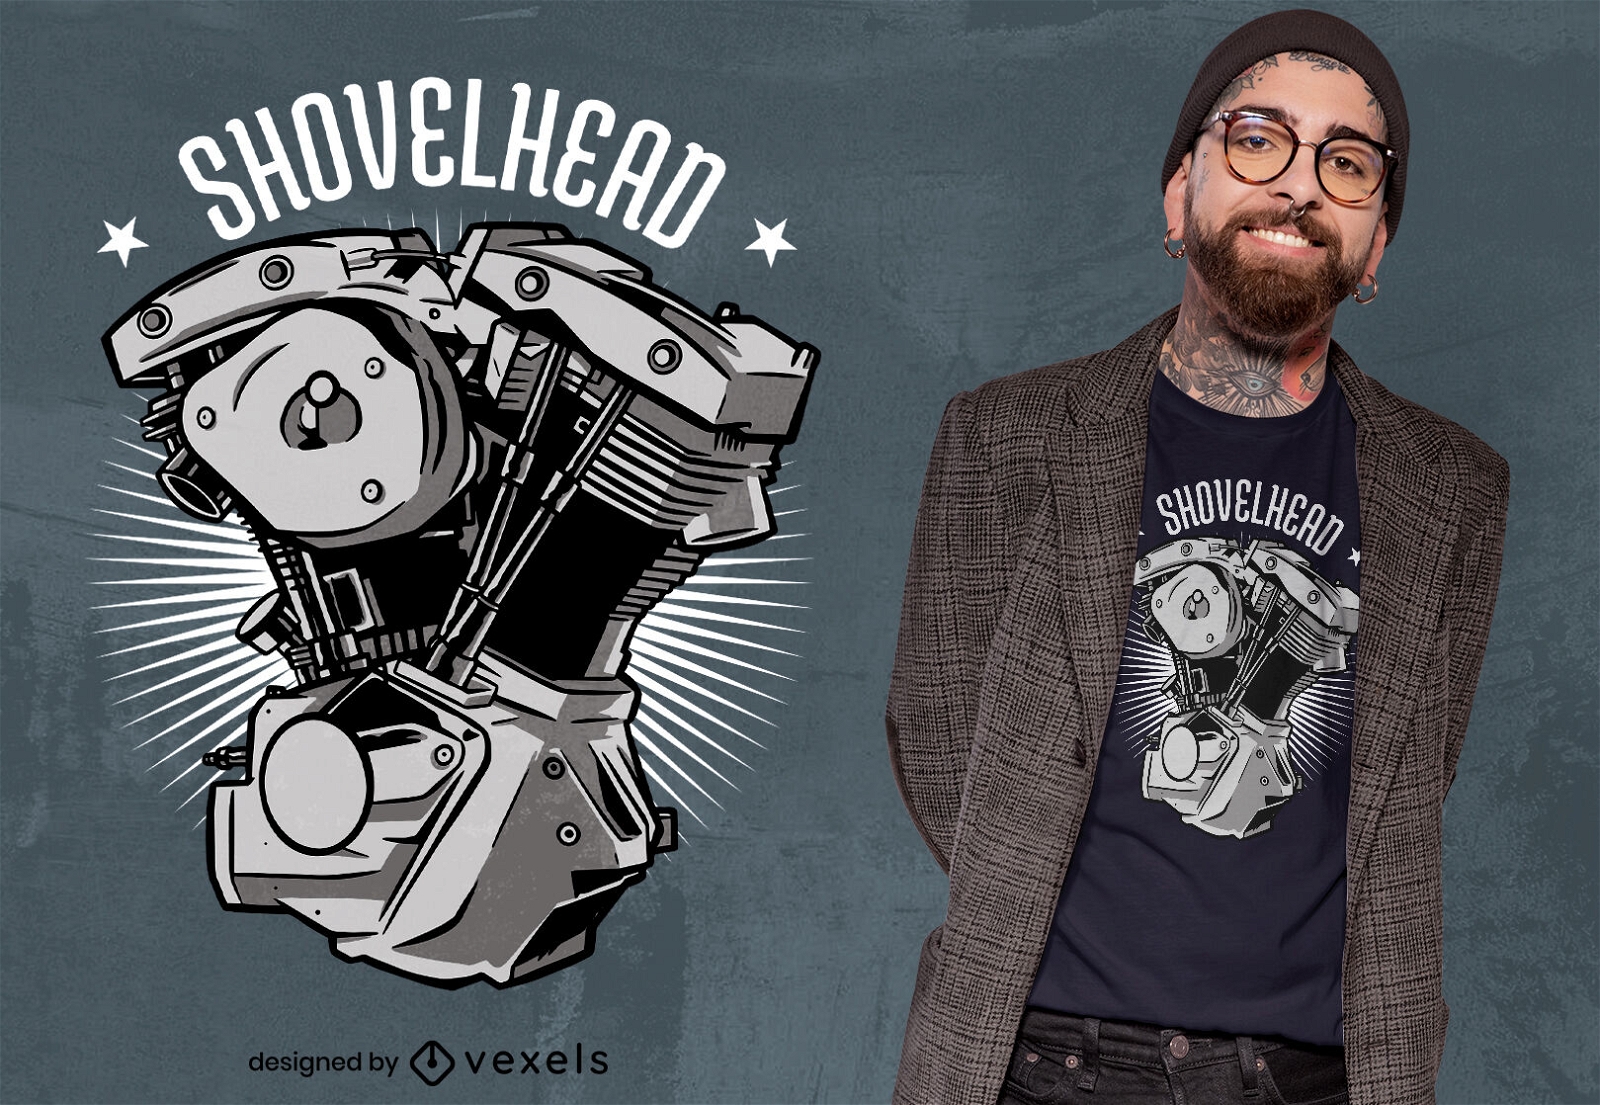
Motorcycle engine t-shirt design
Choose a folder
All favorites
Create new
Save
Motorcycle engine t-shirt design
Print ready
for Merch
Dabbing astronaut space t-shirt design
Choose a folder
All favorites
Create new
Save
Dabbing astronaut space t-shirt design
Print ready
for Merch
Aries floral zodiac sign t-shirt design
Choose a folder
All favorites
Create new
Save
Aries floral zodiac sign t-shirt design
Editable text
Print ready
for Merch
Cute fantasy dragon t-shirt design
Choose a folder
All favorites
Create new
Save
Cute fantasy dragon t-shirt design
Print ready
for Merch
Ramen noodle dog t-shirt design
Choose a folder
All favorites
Create new
Save
Ramen noodle dog t-shirt design
Print ready
for Merch
Halloween nurse t-shirt design
Choose a folder
All favorites
Create new
Save
Halloween nurse t-shirt design
Print ready
for Merch
Deer in nature realistic t-shirt design
Choose a folder
All favorites
Create new
Save
Deer in nature realistic t-shirt design
Editable text
Print ready
for Merch
Double boo sheet funny Halloween ghosts pun t-shirt design
Choose a folder
All favorites
Create new
Save
Double boo sheet funny Halloween ghosts pun t-shirt design
Print ready
for Merch
Angry quokka with coffee cup t-shirt design
Choose a folder
All favorites
Create new
Save
Angry quokka with coffee cup t-shirt design
Print ready
for Merch
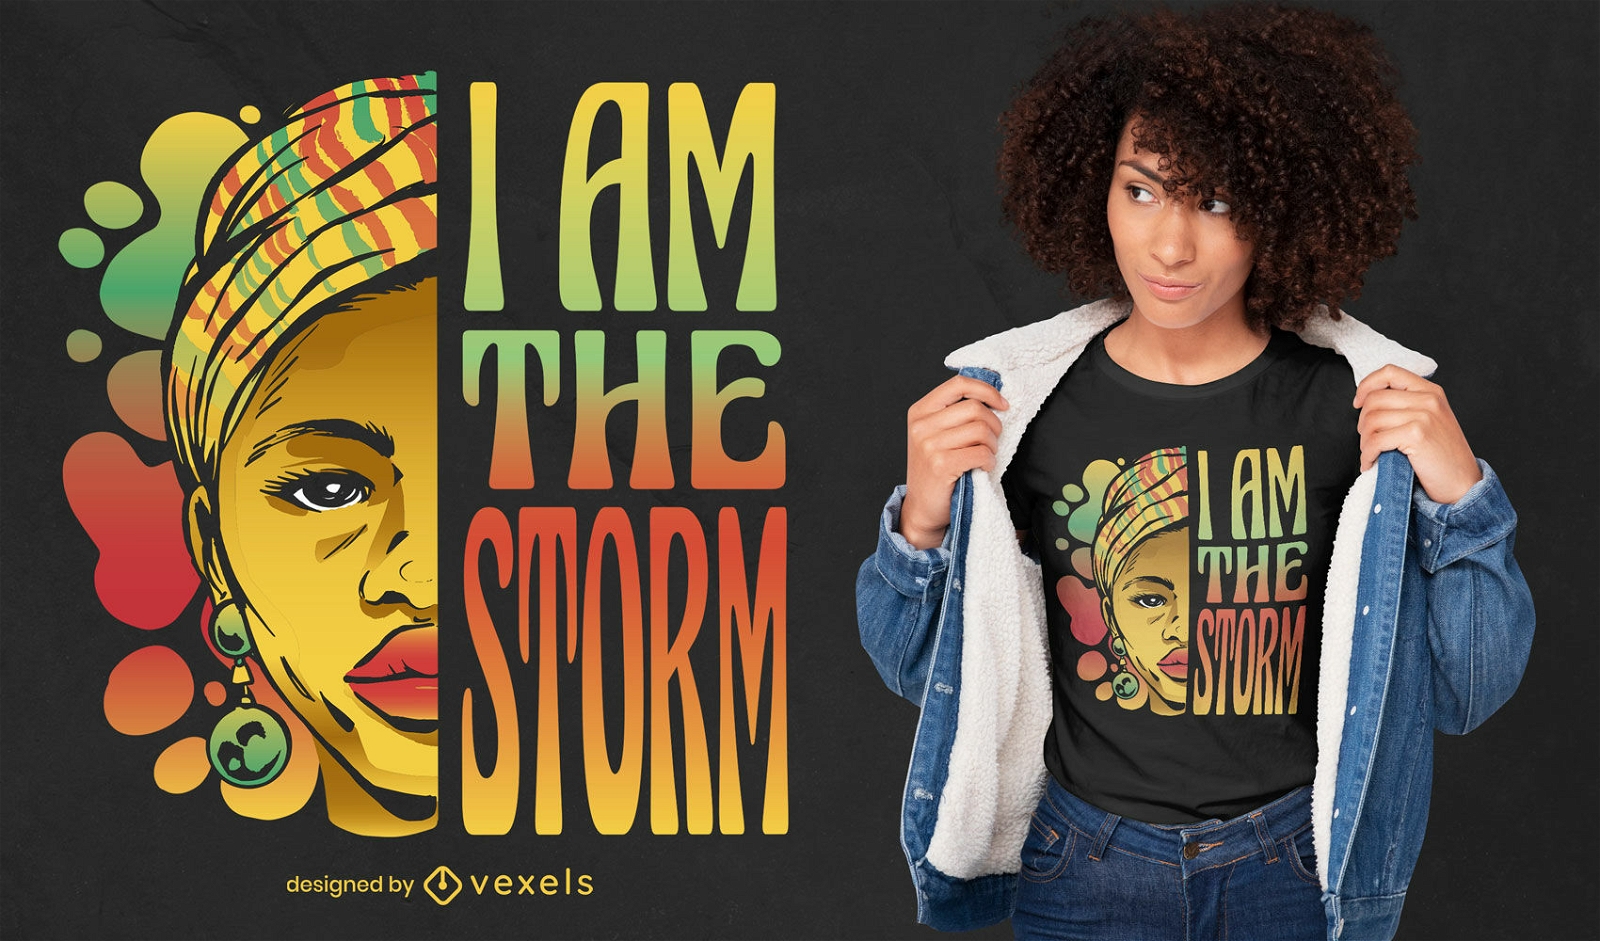
I am the storm Black History Month t-shirt design
Choose a folder
All favorites
Create new
Save
I am the storm Black History Month t-shirt design
Print ready
for Merch
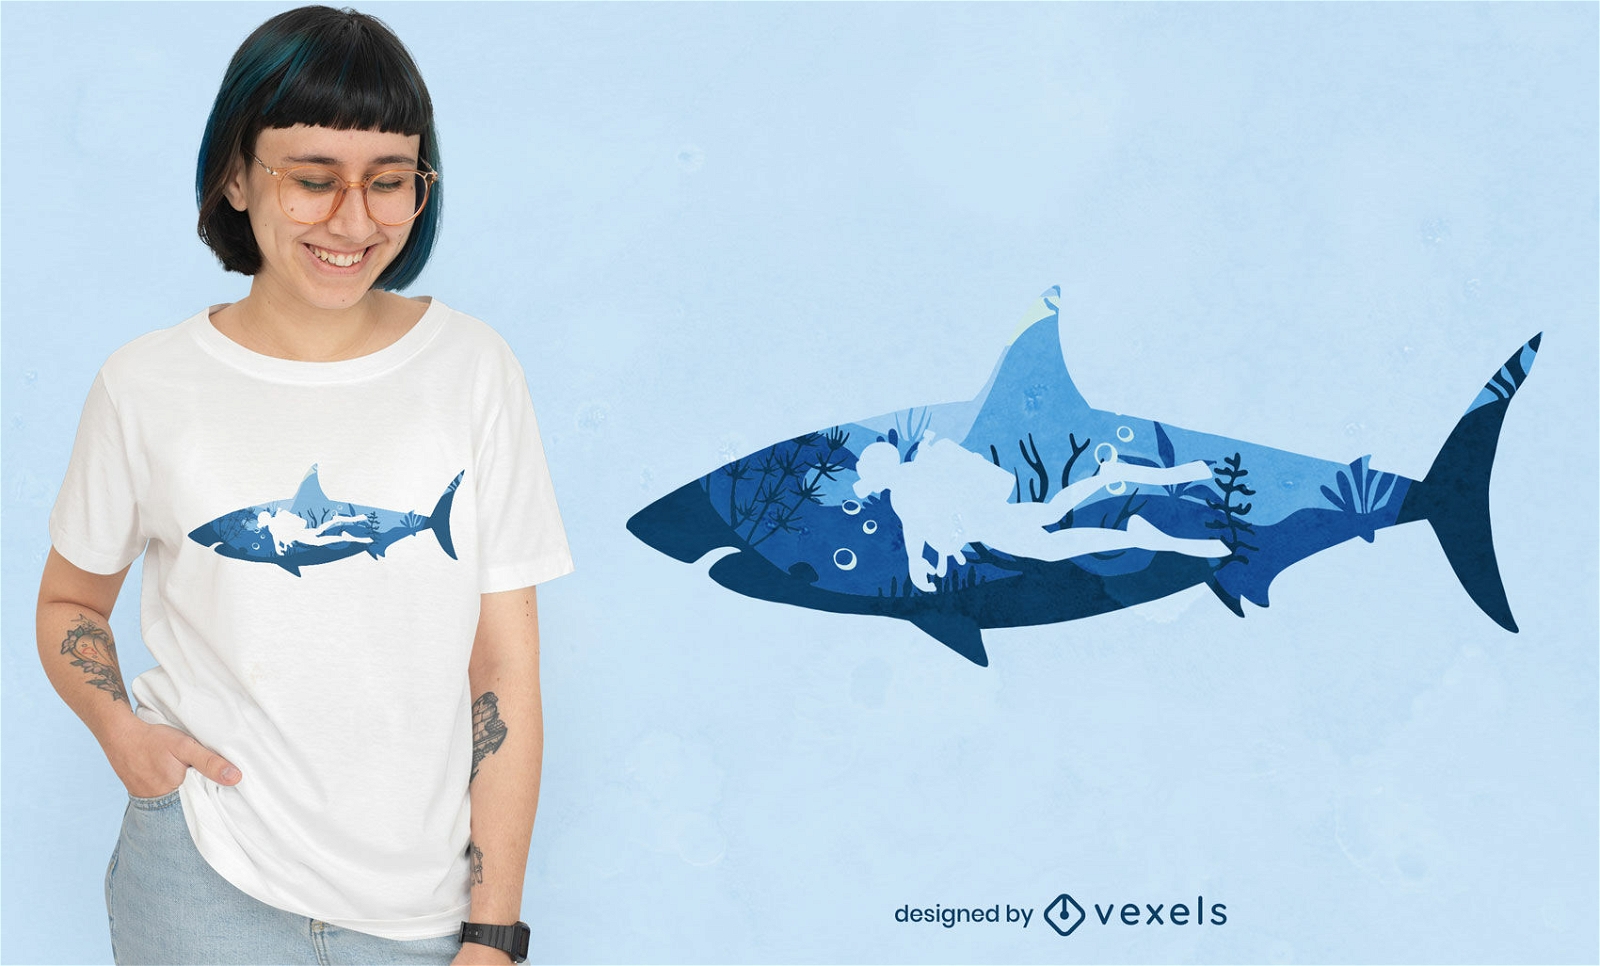
Scuba Diving Shark T-shirt Design
Choose a folder
All favorites
Create new
Save
Scuba Diving Shark T-shirt Design
Print ready
for Merch
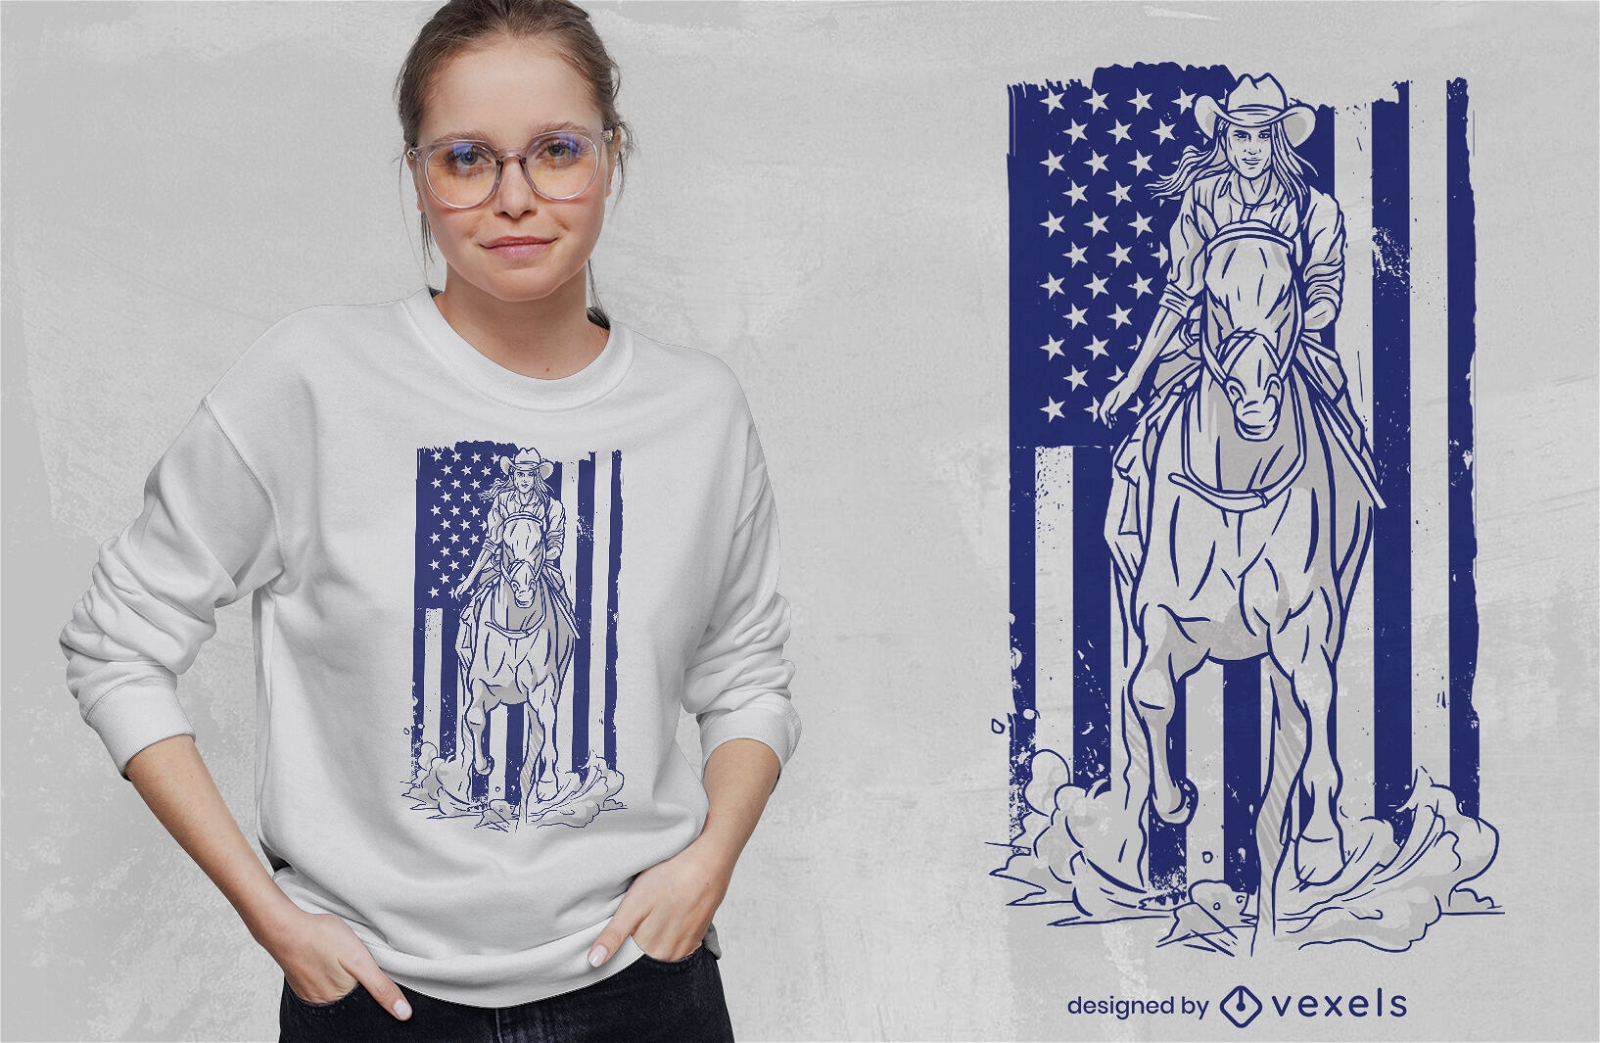
Cowgirl with american flag t-shirt design
Choose a folder
All favorites
Create new
Save
Cowgirl with american flag t-shirt design
Print ready
for Merch
Merry gainsmas Christmas crypto t-shirt design
Choose a folder
All favorites
Create new
Save
Merry gainsmas Christmas crypto t-shirt design
Print ready
for Merch
Chinese dragon creature t-shirt design
Choose a folder
All favorites
Create new
Save
Chinese dragon creature t-shirt design
Print ready
for Merch
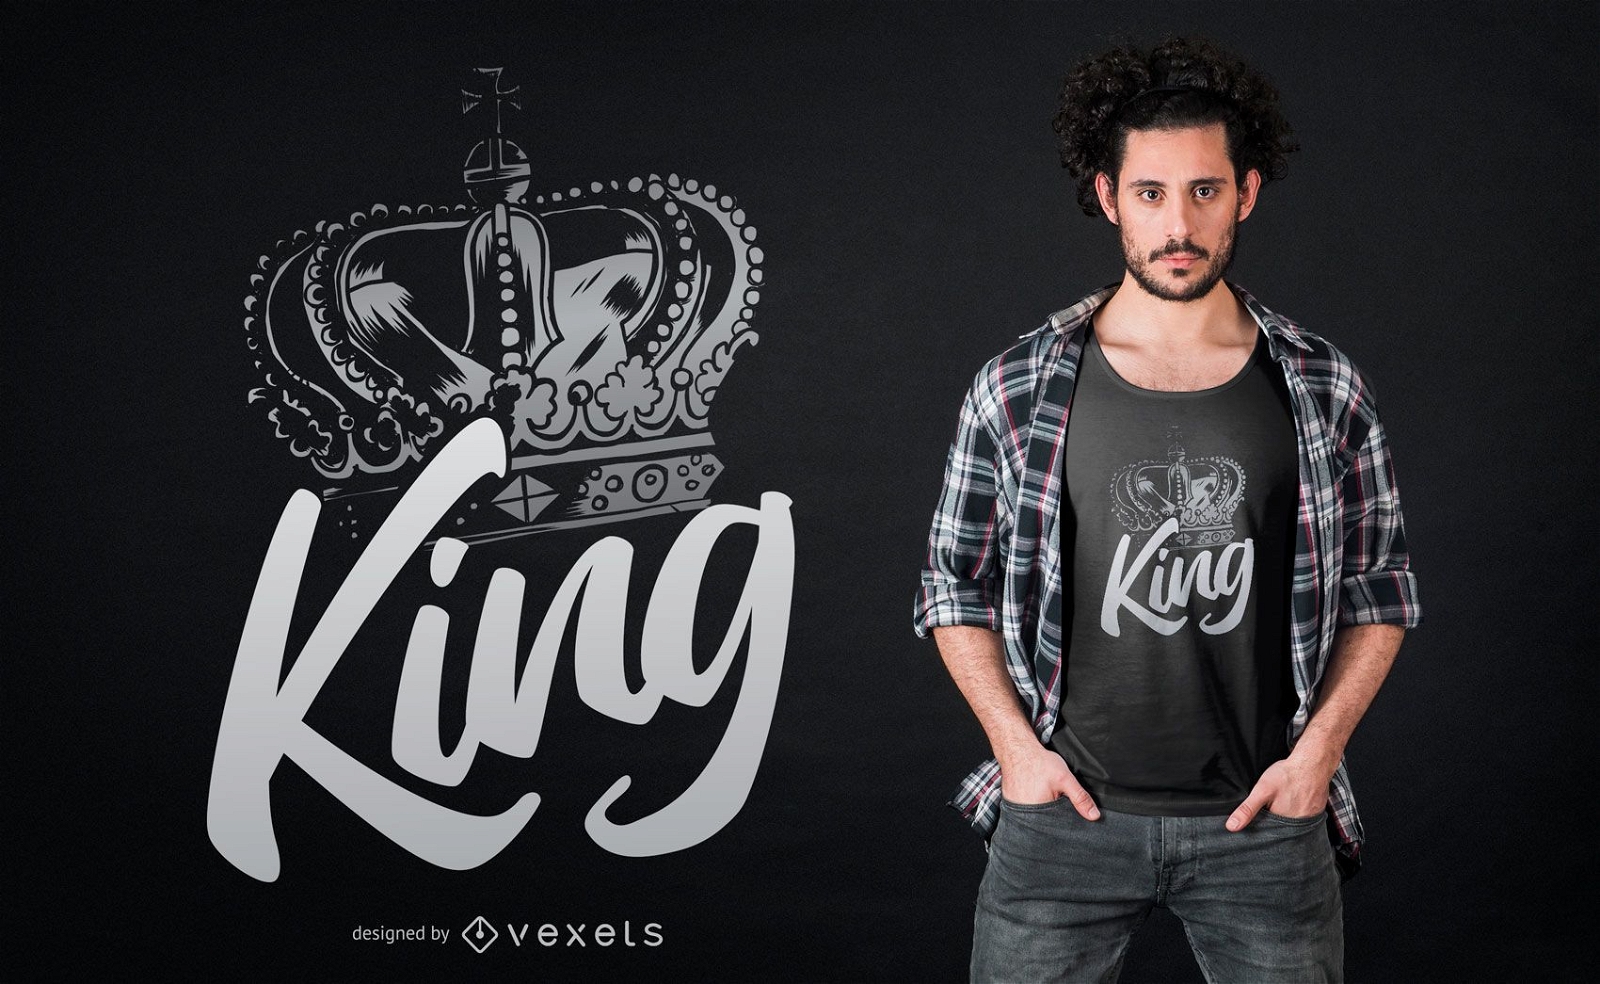
Royal crown for a king t-shirt design
Choose a folder
All favorites
Create new
Save
Royal crown for a king t-shirt design
Editable text
Print ready
for Merch
Blue car racing forwards t-shirt design
Choose a folder
All favorites
Create new
Save
Blue car racing forwards t-shirt design
Print ready
for Merch
Coffee lover cat mug design
Choose a folder
All favorites
Create new
Save
Coffee lover cat mug design
Print ready
for Merch
T-rex Ugly Sweater Christmas T-shirt Design
Choose a folder
All favorites
Create new
Save
T-rex Ugly Sweater Christmas T-shirt Design
Print ready
for Merch
Cookie baking squad Christmas t-shirt design
Choose a folder
All favorites
Create new
Save
Cookie baking squad Christmas t-shirt design
Print ready
for Merch
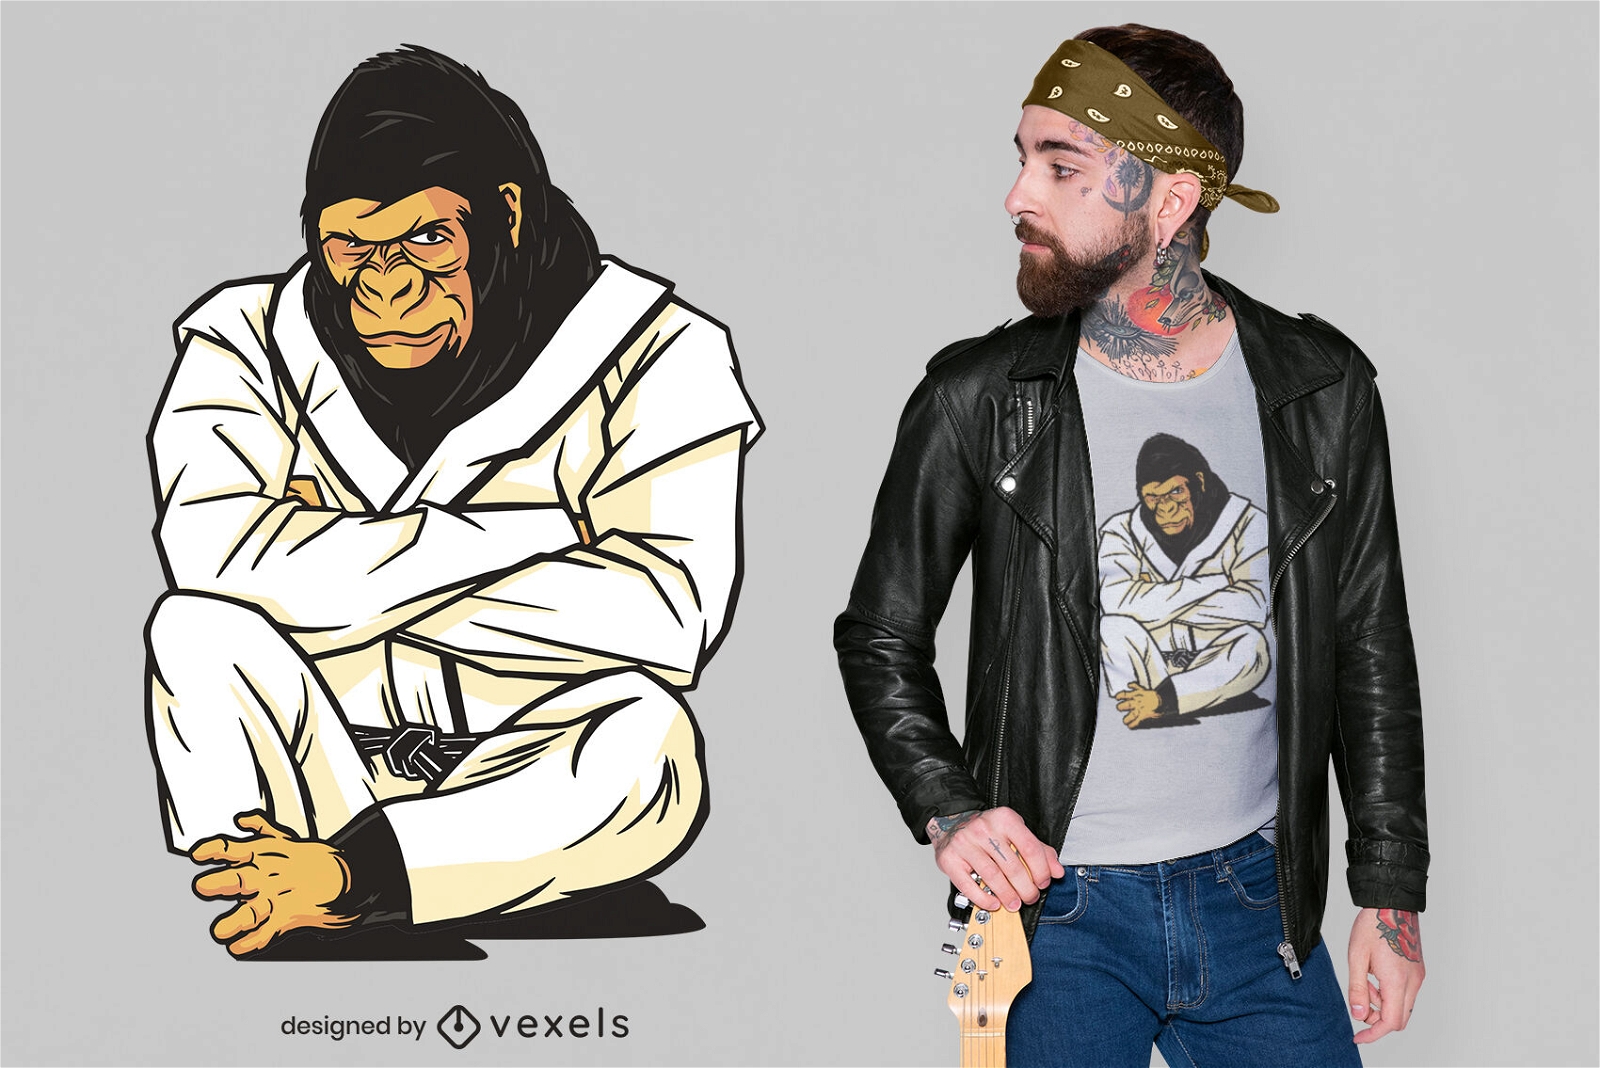
Cool karate gorilla t-shirt design
Choose a folder
All favorites
Create new
Save
Cool karate gorilla t-shirt design
Print ready
for Merch
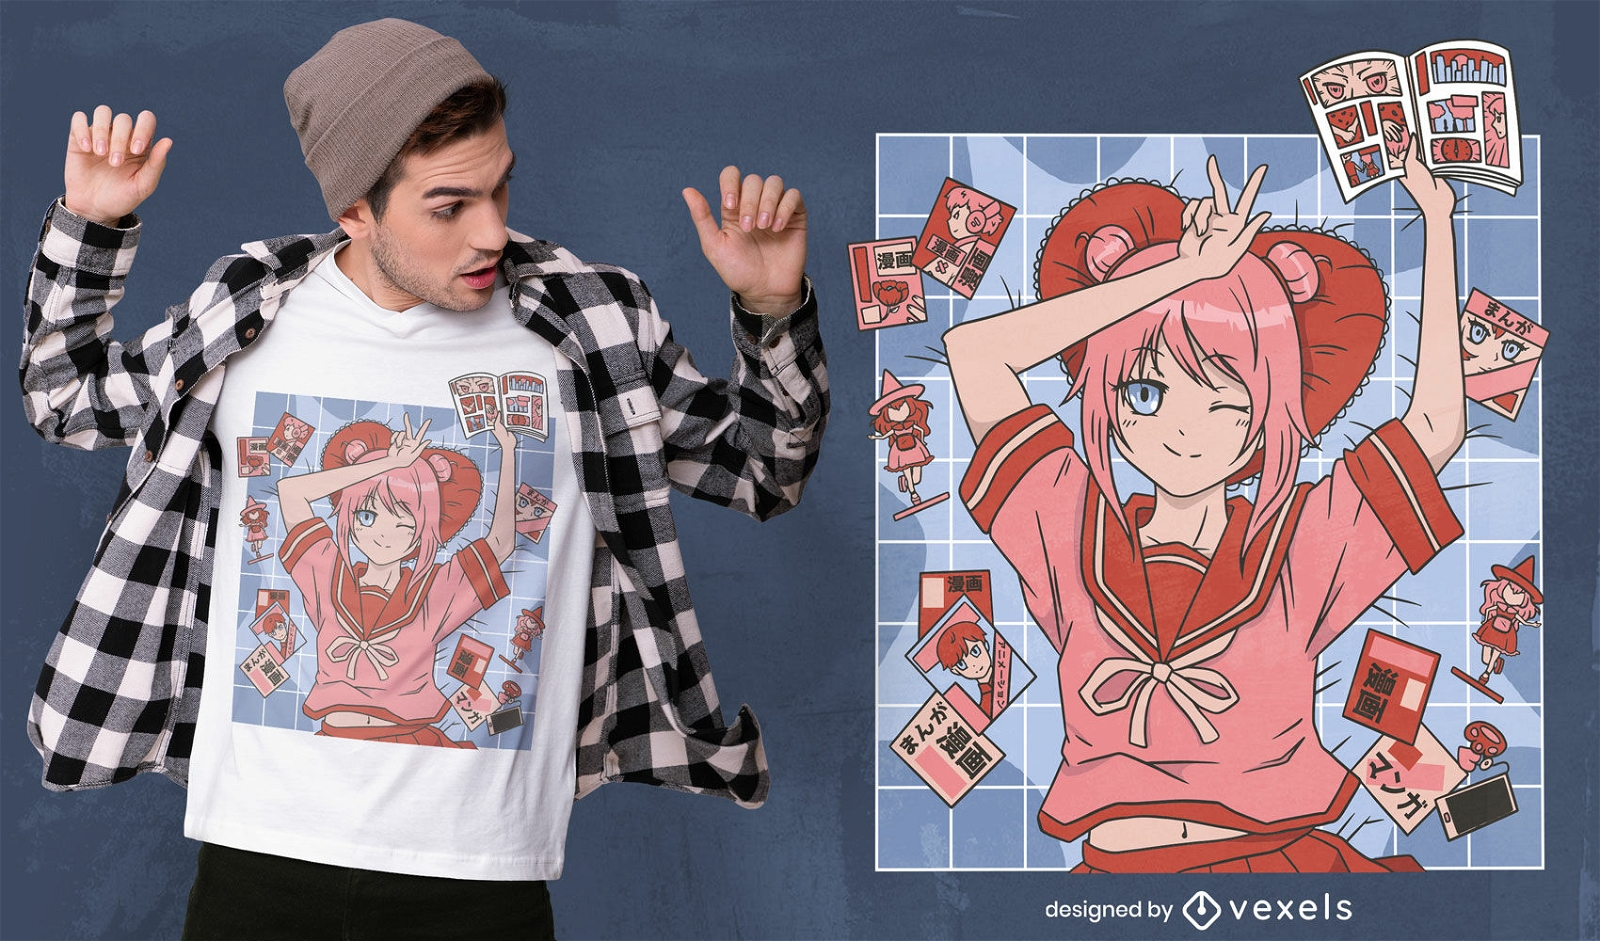
Anime girl with comic books t-shirt design
Choose a folder
All favorites
Create new
Save
Anime girl with comic books t-shirt design
Print ready
for Merch
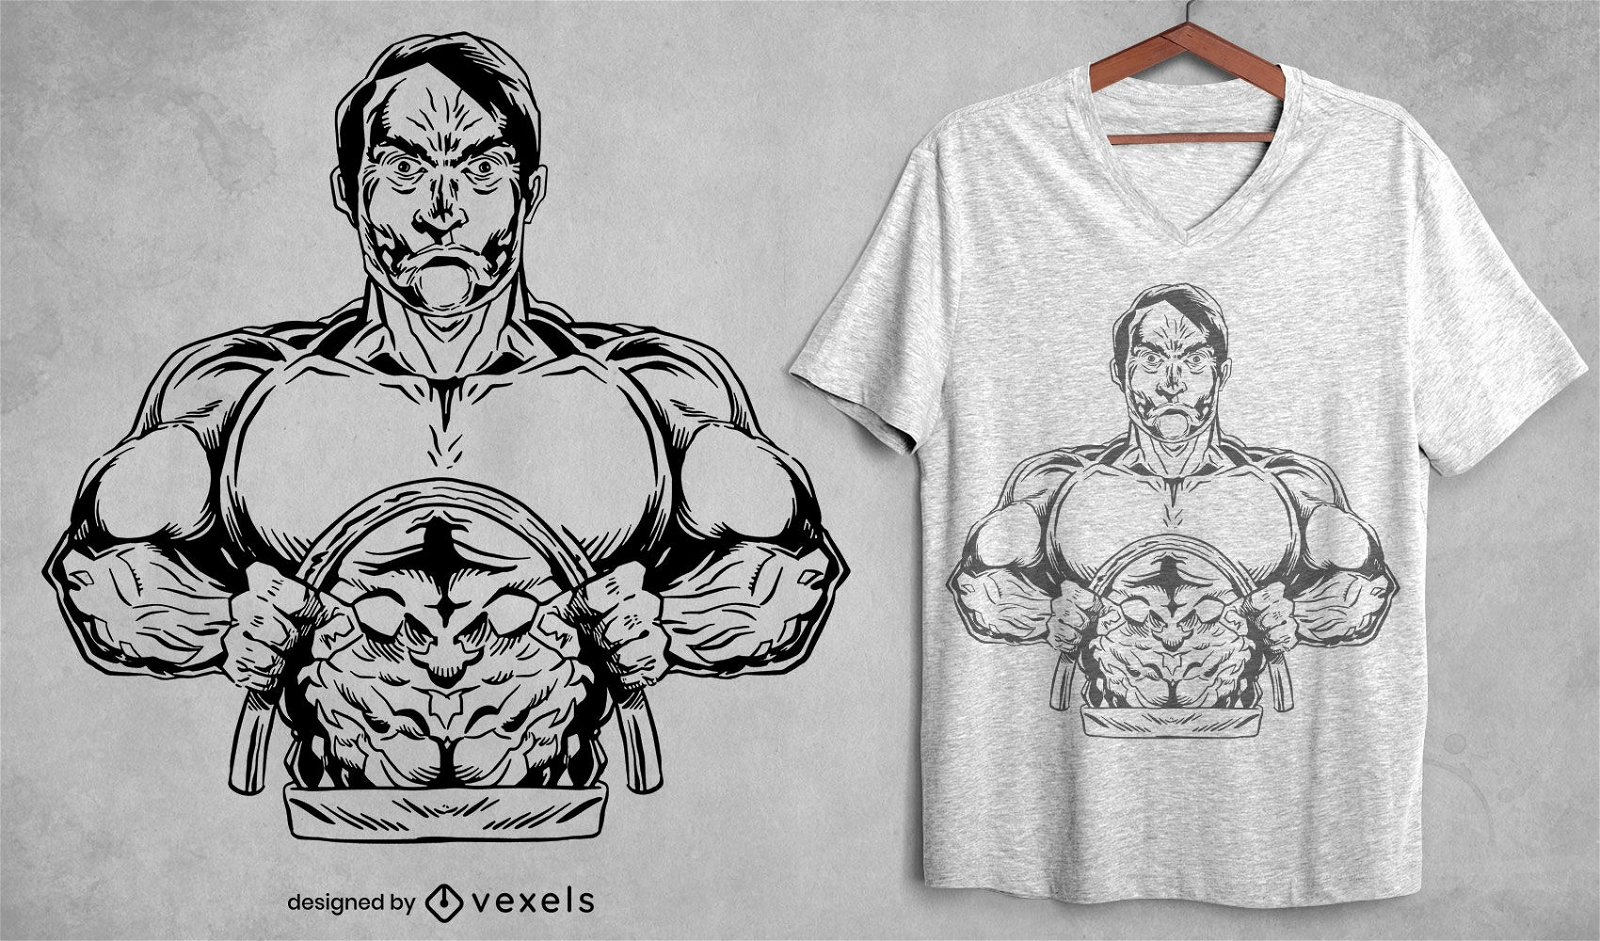
Muscle strong man t-shirt design
Choose a folder
All favorites
Create new
Save
Muscle strong man t-shirt design
Print ready
for Merch
Tribal owl t-shirt design
Choose a folder
All favorites
Create new
Save
Tribal owl t-shirt design
Editable text
Print ready
for Merch
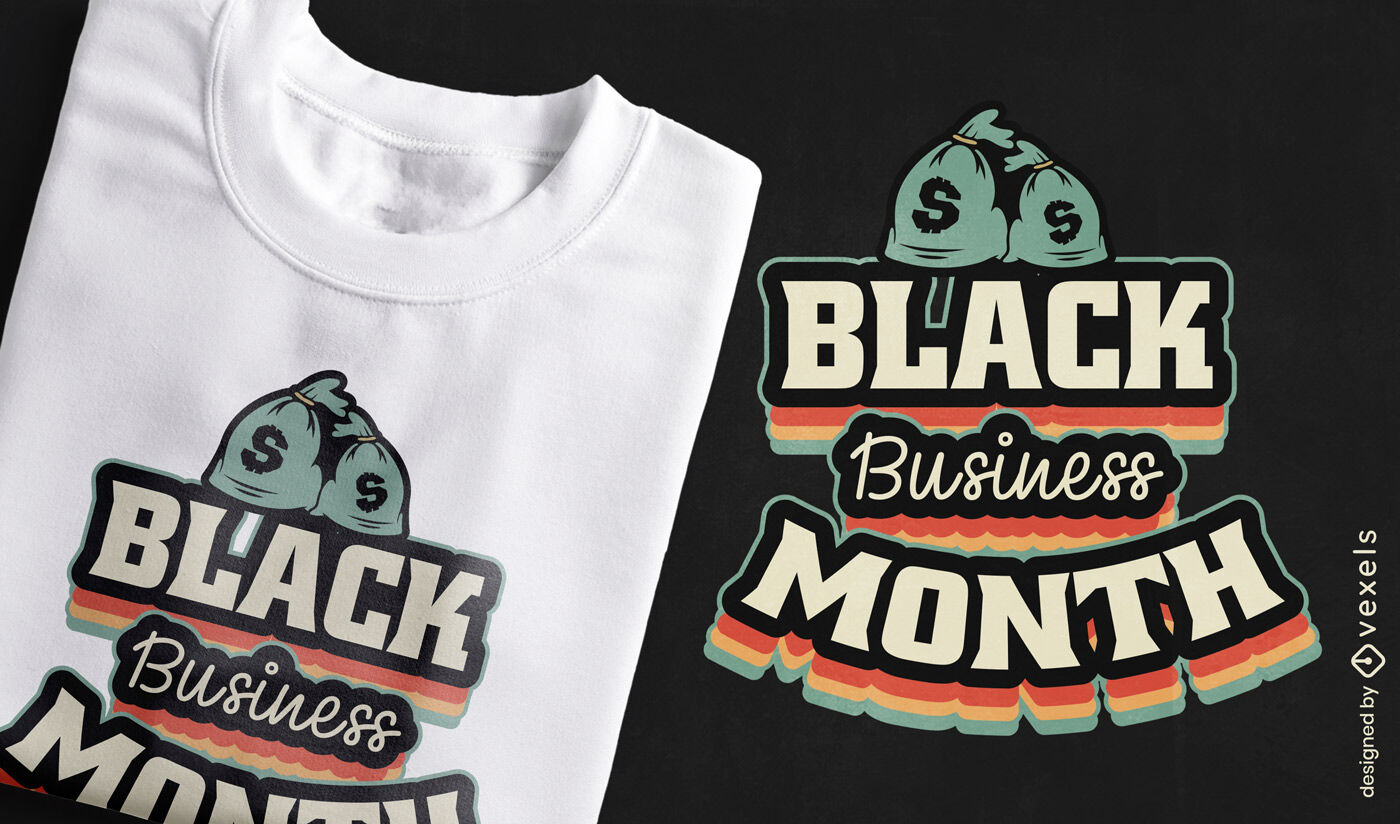
Black Business Month t-shirt design
Choose a folder
All favorites
Create new
Save
Black Business Month t-shirt design
Print ready
for Merch
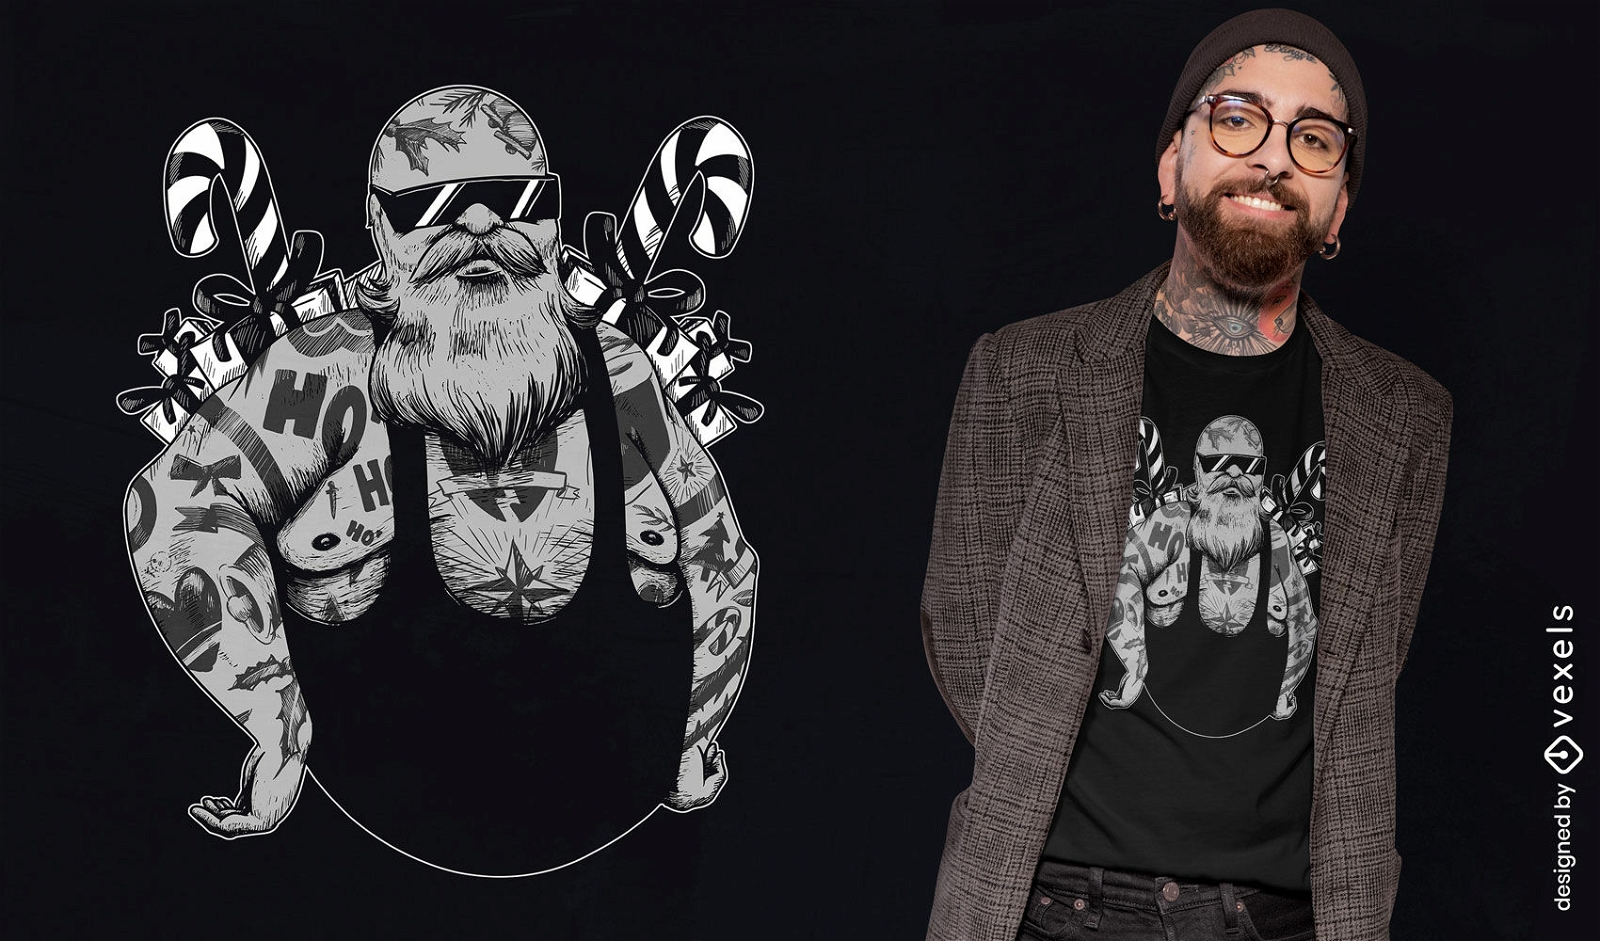
Badass Santa Christmas t-shirt design
Choose a folder
All favorites
Create new
Save
Badass Santa Christmas t-shirt design
Print ready
for Merch
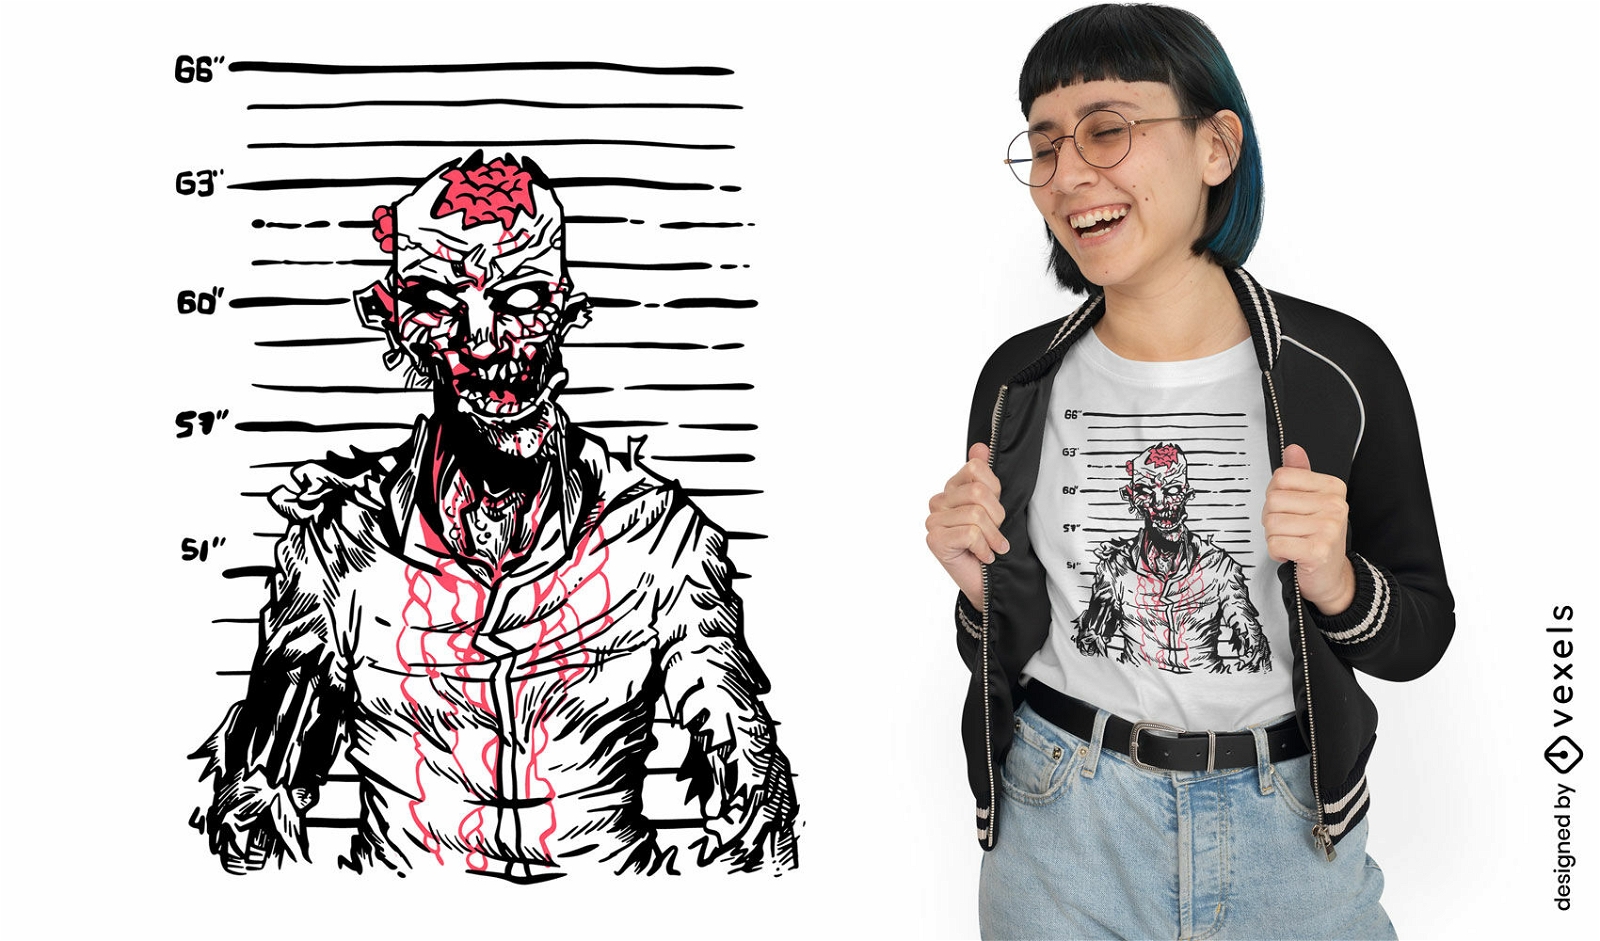
Zombie in jail halloween t-shirt design
Choose a folder
All favorites
Create new
Save
Zombie in jail halloween t-shirt design
Print ready
for Merch
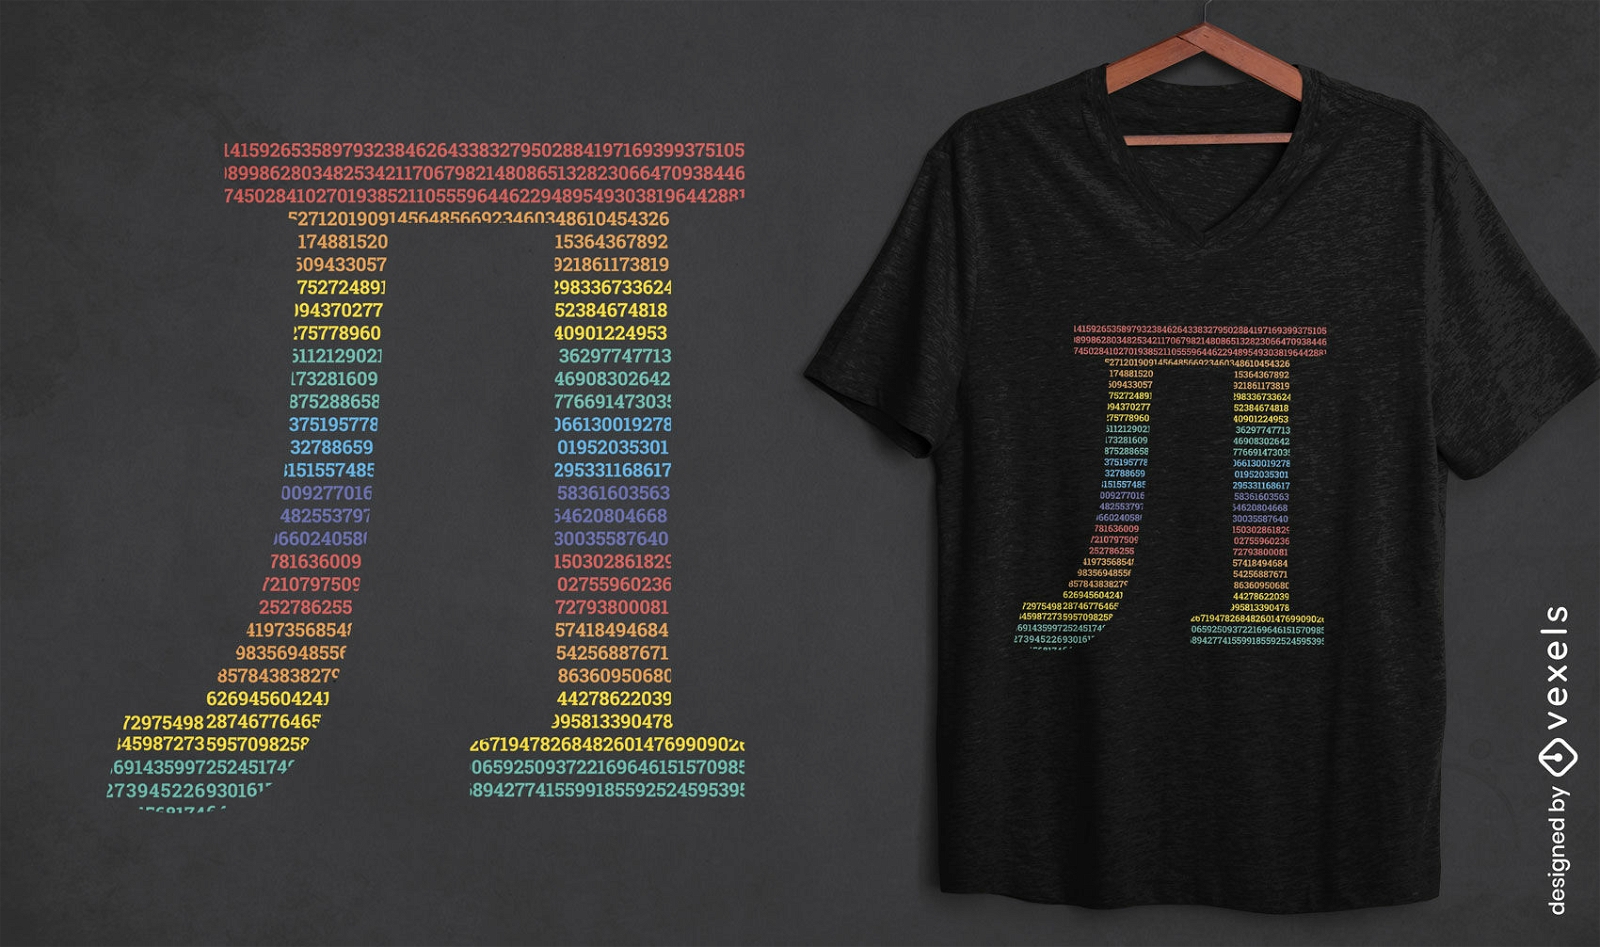
Rainbow color pi sign t-shirt design
Choose a folder
All favorites
Create new
Save
Rainbow color pi sign t-shirt design
Print ready
for Merch
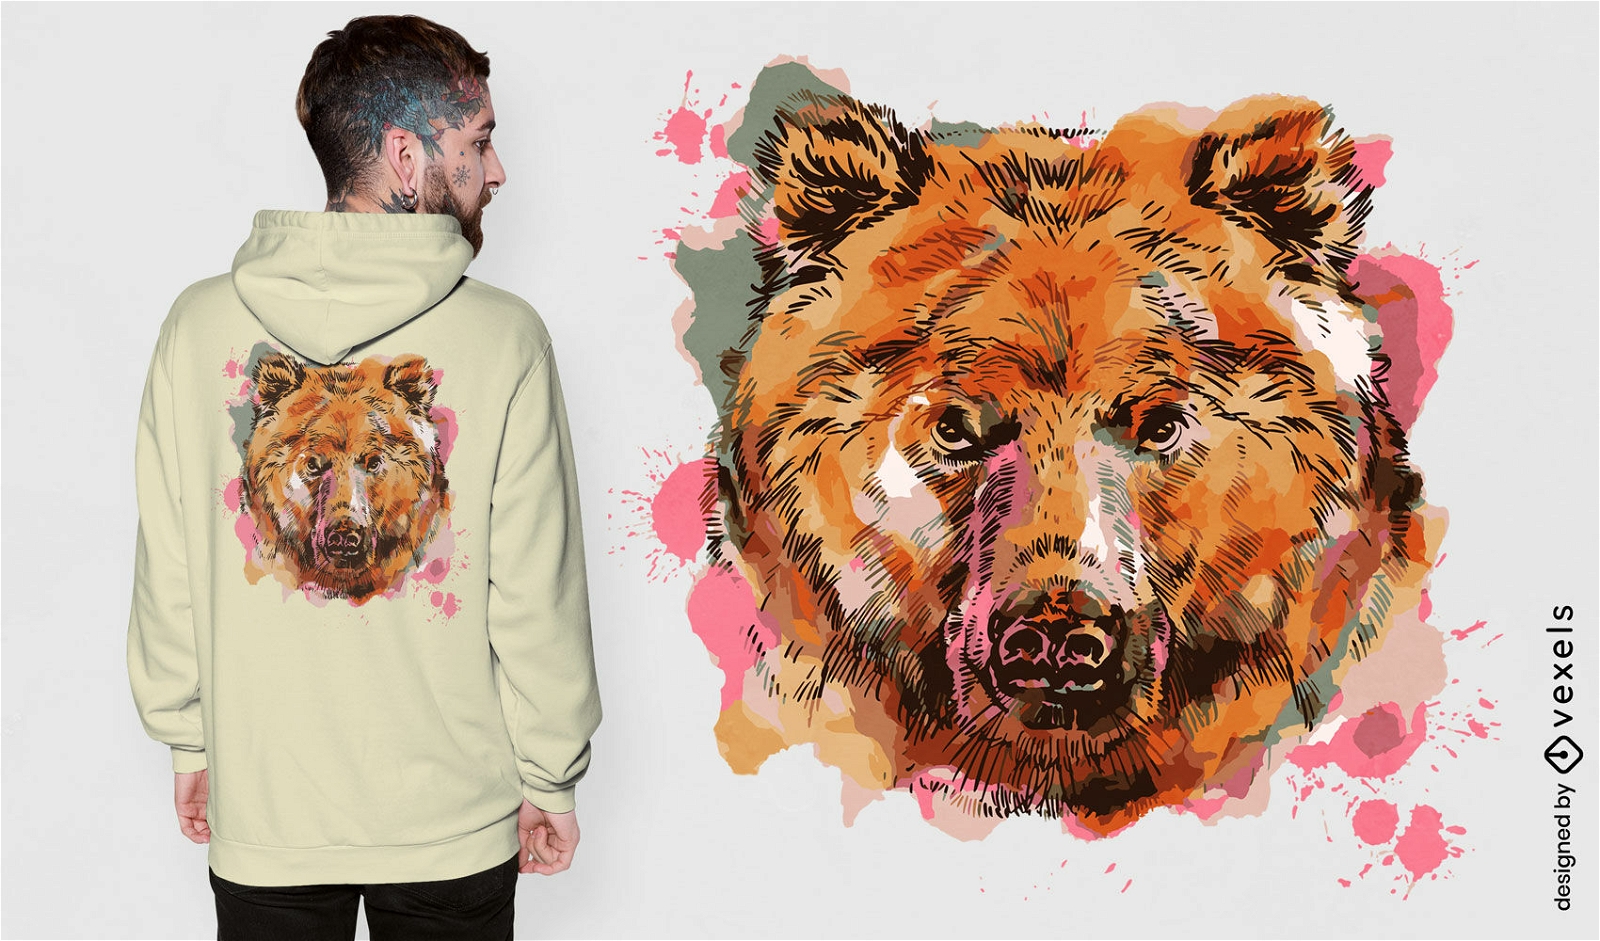
Bear wild animal watercolor t-shirt design
Choose a folder
All favorites
Create new
Save
Bear wild animal watercolor t-shirt design
Print ready
for Merch
Unicorn witch hallowen cute t-shirt design
Choose a folder
All favorites
Create new
Save
Unicorn witch hallowen cute t-shirt design
Print ready
for Merch
Warrior knight in armour t-shirt design
Choose a folder
All favorites
Create new
Save
Warrior knight in armour t-shirt design
Editable text
Print ready
for Merch
Dragon dice treasure t-shirt design
Choose a folder
All favorites
Create new
Save
Dragon dice treasure t-shirt design
Editable text
Print ready
for Merch
Napping Christmas tradition t-shirt design
Choose a folder
All favorites
Create new
Save
Napping Christmas tradition t-shirt design
Editable text
Print ready
for Merch
Dungeon master sword t-shirt design
Choose a folder
All favorites
Create new
Save
Dungeon master sword t-shirt design
Print ready
for Merch
Hotdog lovers t-shirt design
Choose a folder
All favorites
Create new
Save
Hotdog lovers t-shirt design
Boost Your Business
With The Leading Graphic Platform For Merch.
SEE PLANS
Next
of 720
prev page
next page