Design Library
Explore Designs
New Merch Designs
Trending Merch Designs
Vectors
PNGs & SVGs
Mockups
T-Shirts
T-Shirt PSD Templates
KDP Designs
Phone Cases
Pillows
Tote Bags
Posters
Mugs
Design Tools
Designer
New!
T-shirt Maker
Mockup Generator
Quote Generator
Logo Maker
Resources
Merch Digest
Blog
Help Center
Creators Program
Learn About Merch
Changelog
API Access
Pricing
Loading...
Sign Up
Login
PSD Templates
grafico
Design Library
Explore Designs
New Merch Designs
Trending Merch Designs
Vectors
PNGs & SVGs
Mockups
T-Shirts
T-Shirt PSD Templates
KDP Designs
Phone Cases
Pillows
Tote Bags
Posters
Mugs
Design Tools
Designer
New!
T-shirt Maker
Mockup Generator
Quote Generator
Logo Maker
Resources
Merch Digest
Blog
Help Center
Creators Program
Learn About Merch
Changelog
API Access
PLANS
PSD Templates
grafico
4214 grafico PSD T Shirt Designs and Mockups
Download editable grafico PSD t shirt designs or mockups
Sort by
Most relevant
Sponsored results by
Get 15% off with code: VEXELS15
Show more
Editable text
Print ready
for Merch
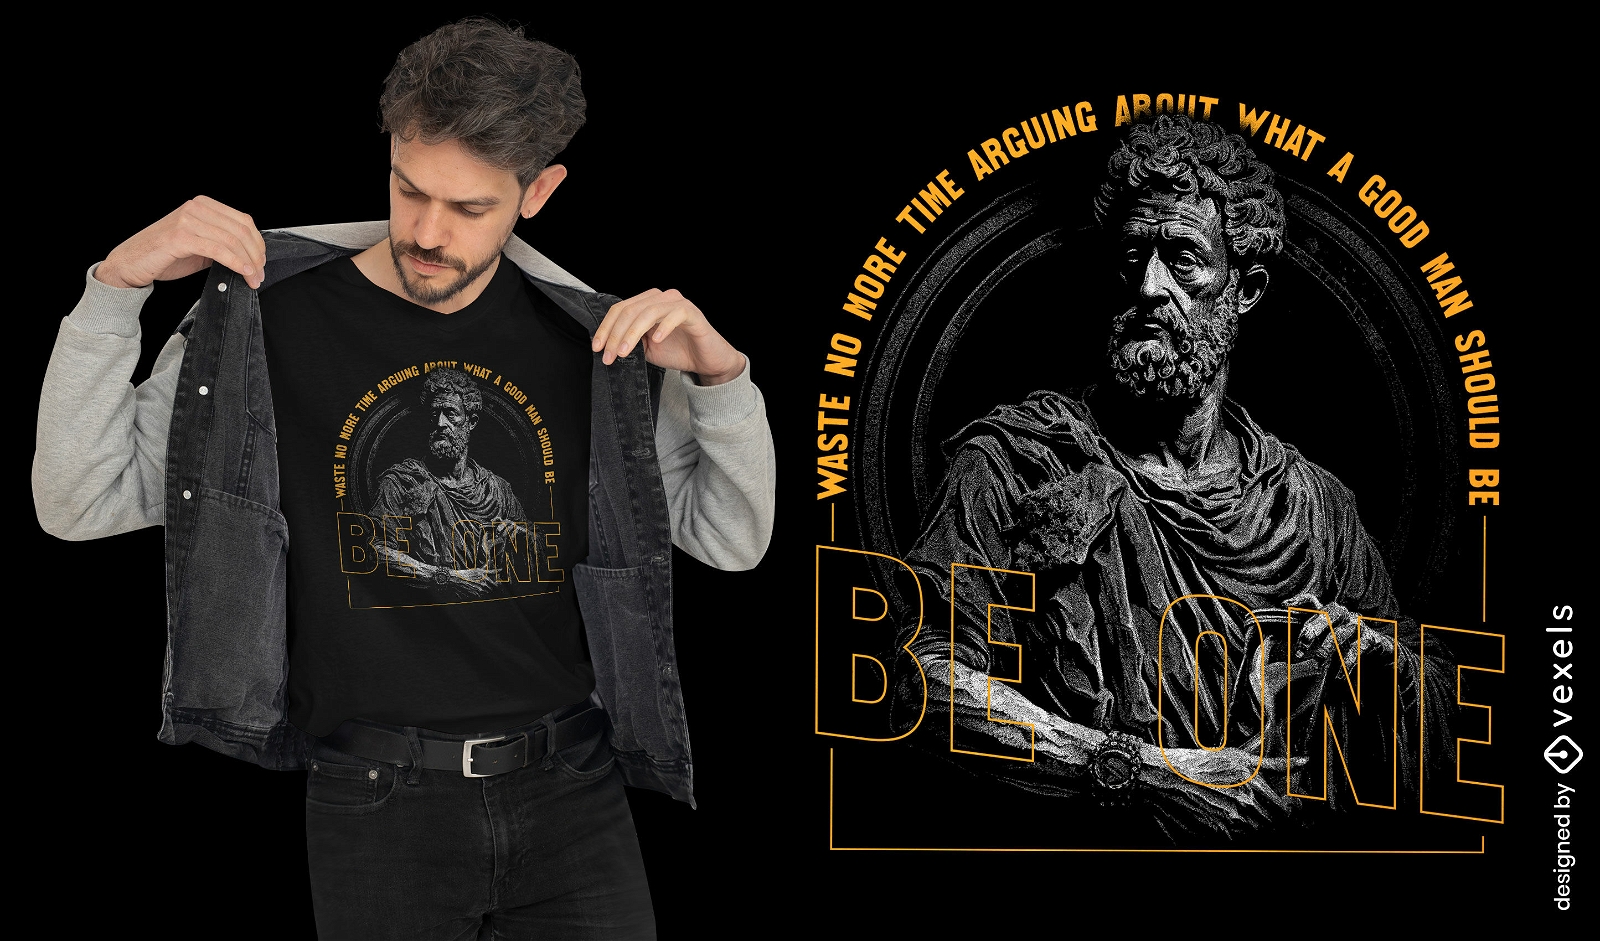
Marcus Aurelius realistic statue t-shirt design
Choose a folder
All favorites
Create new
Save
Marcus Aurelius realistic statue t-shirt design
Print ready
for Merch
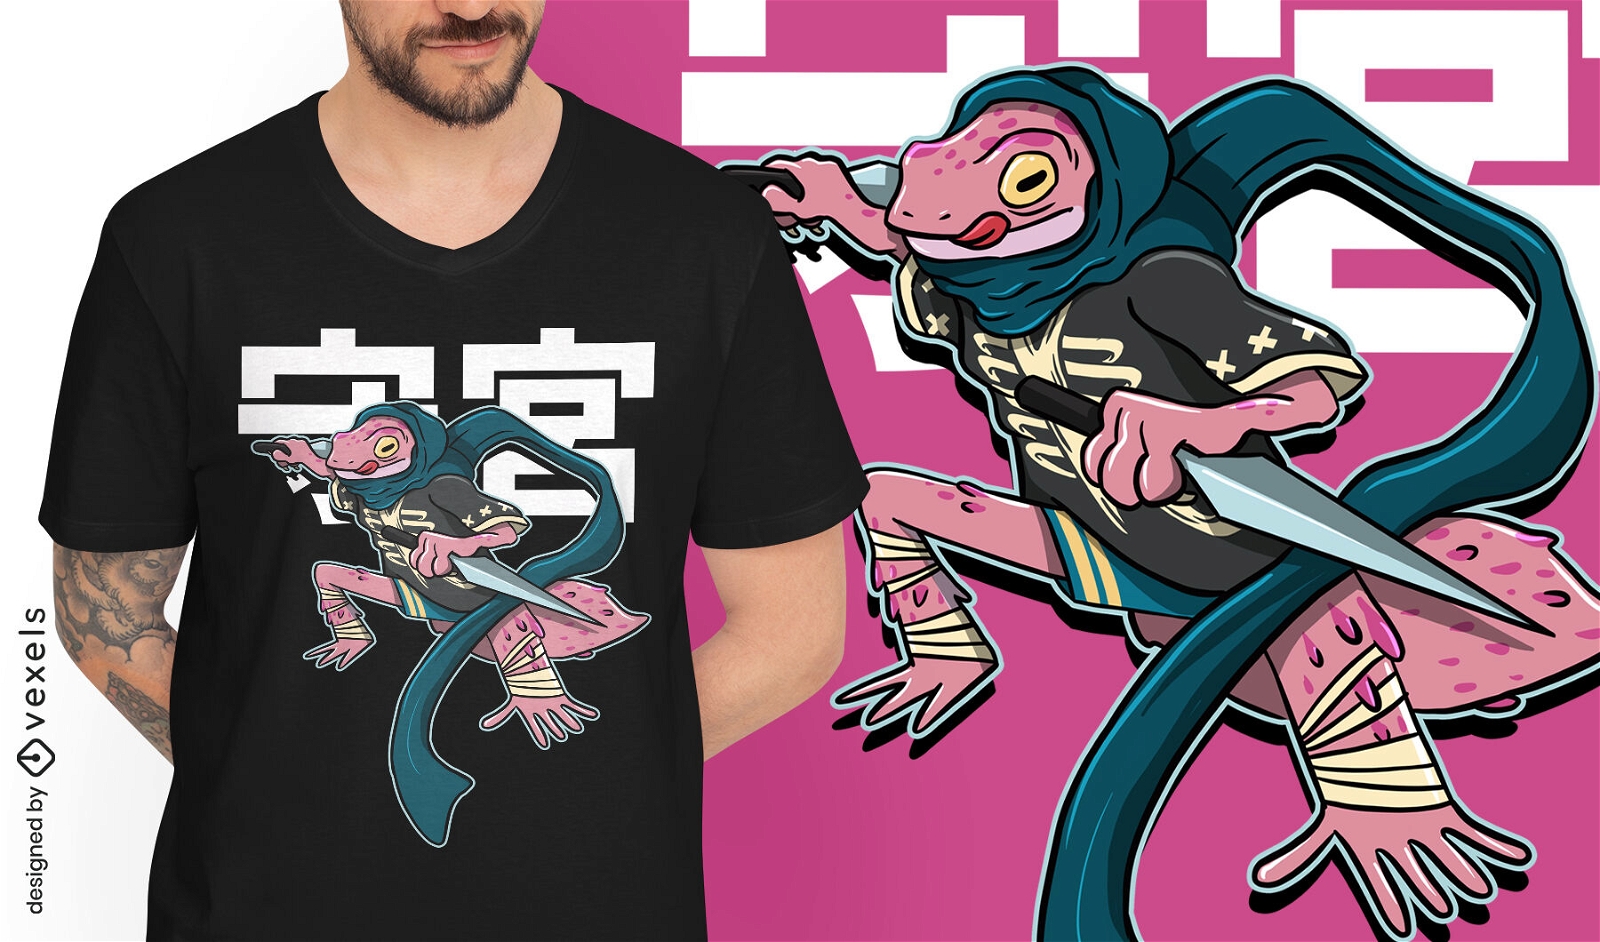
Gecko modern samurai t-shirt design
Choose a folder
All favorites
Create new
Save
Gecko modern samurai t-shirt design
Print ready
for Merch
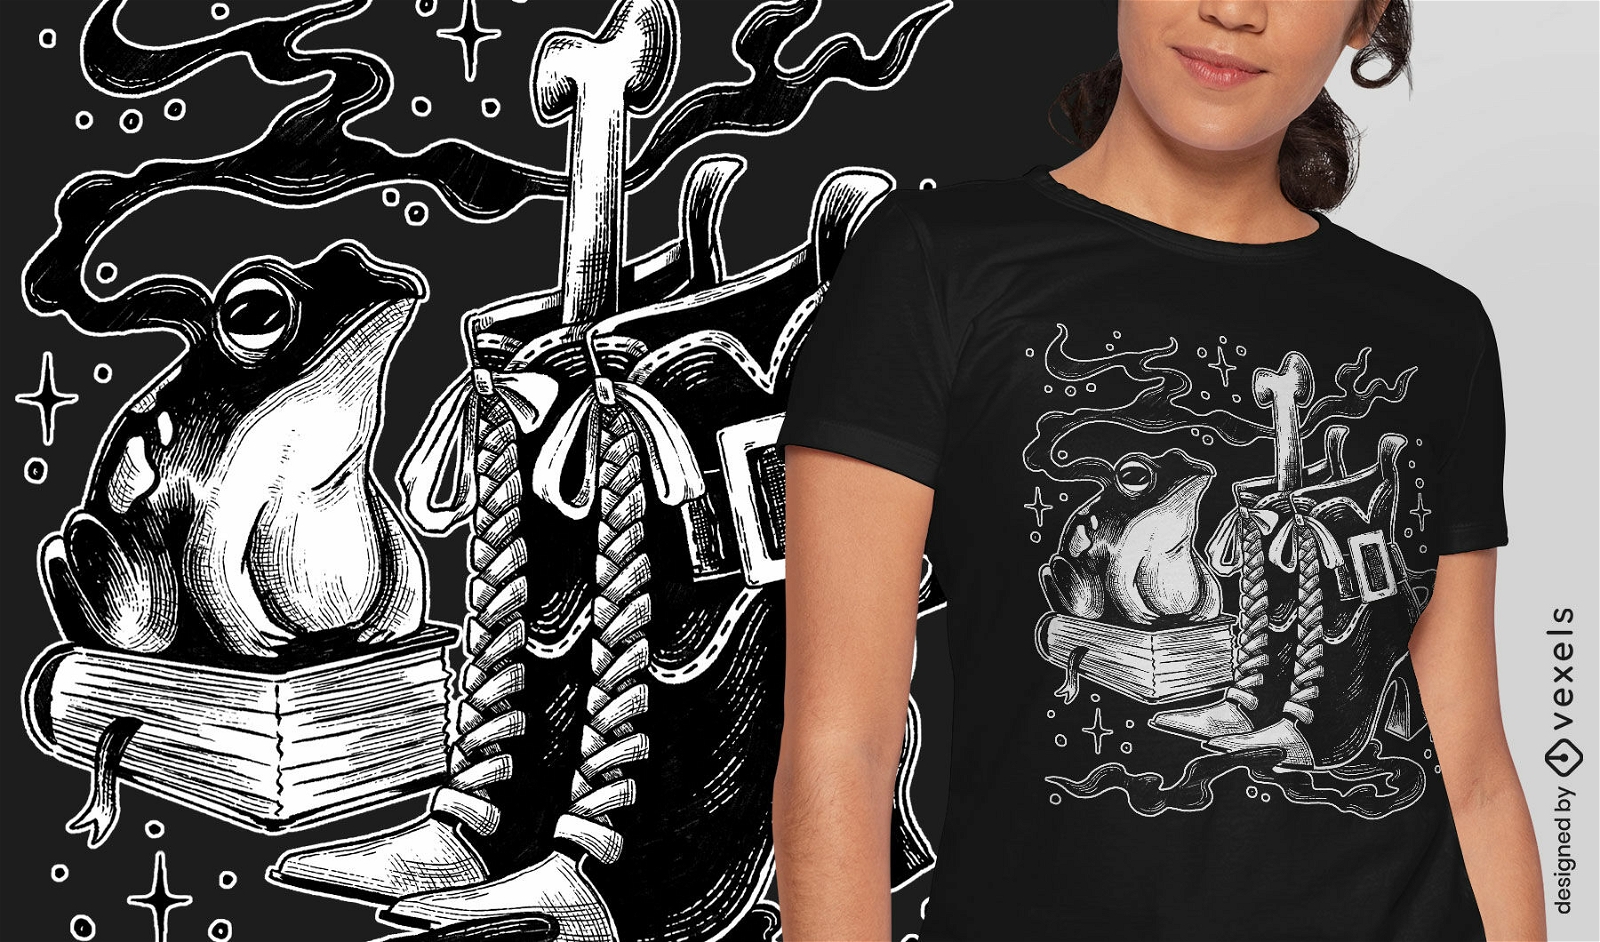
Witch elements t-shirt design
Choose a folder
All favorites
Create new
Save
Witch elements t-shirt design
Print ready
for Merch
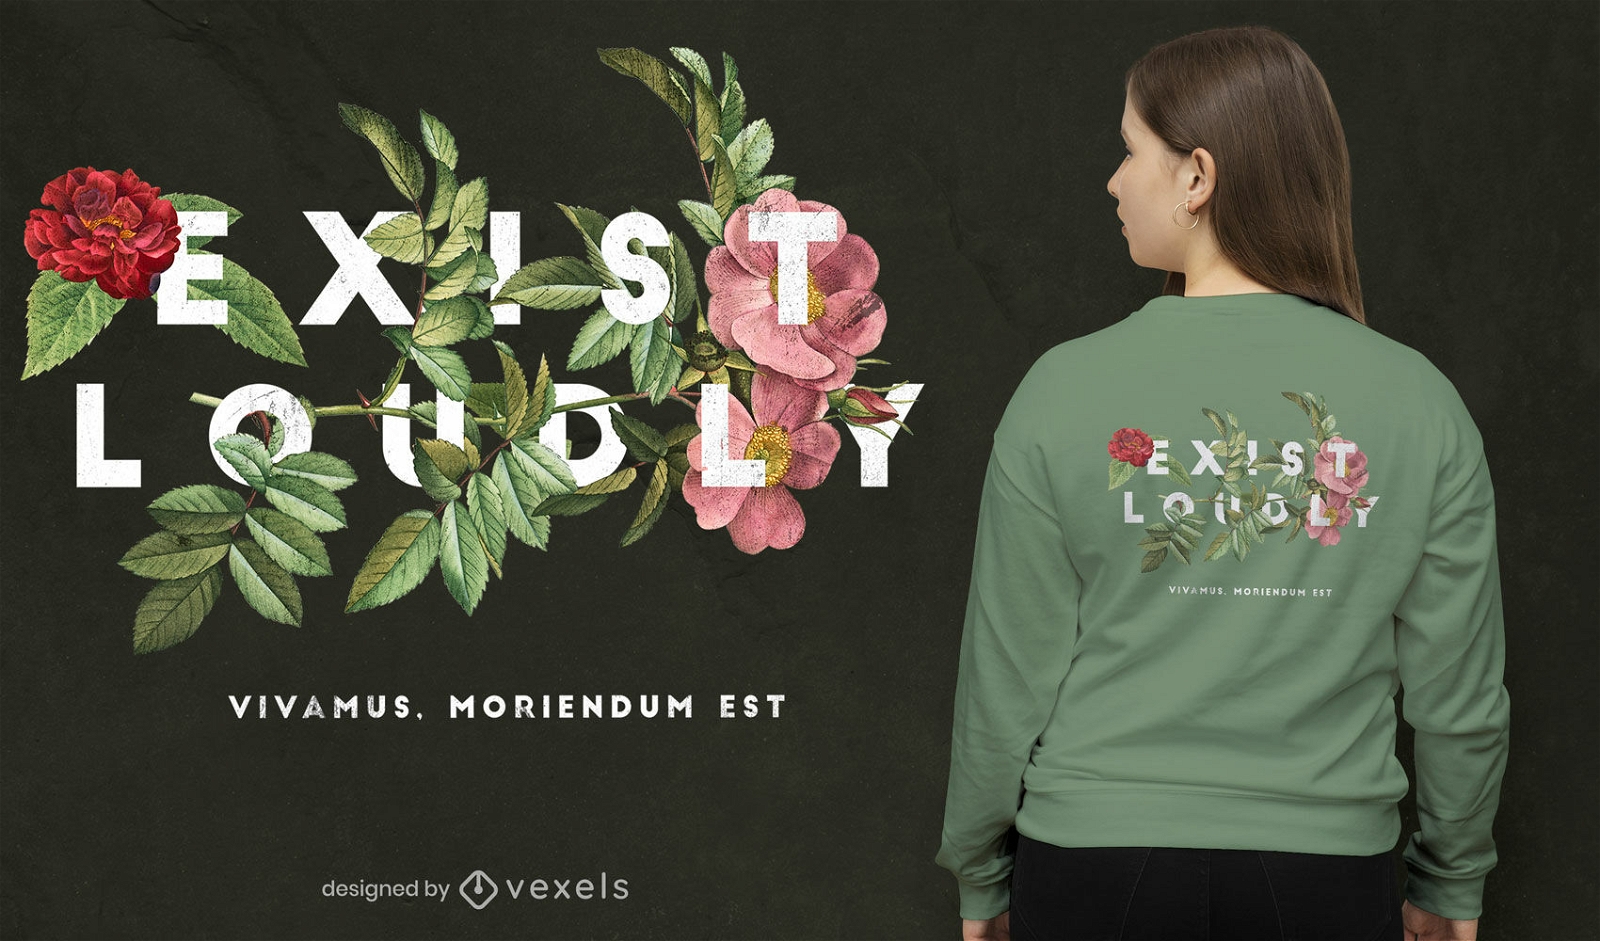
Exist loudly flowers psd t-shirt design
Choose a folder
All favorites
Create new
Save
Exist loudly flowers psd t-shirt design
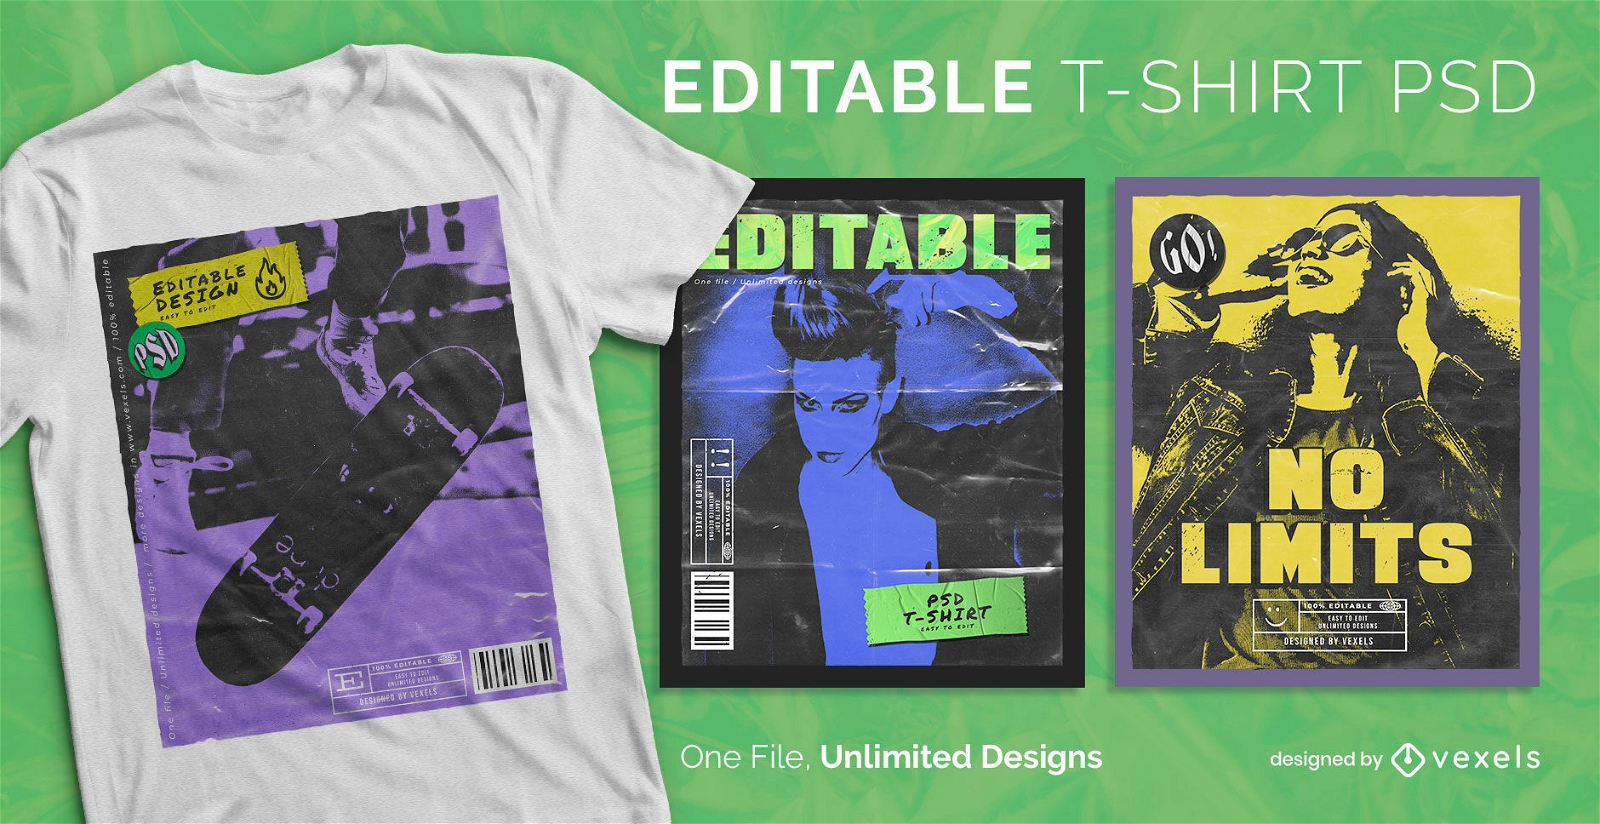
Scalable PSD T-Shirt
for Merch
Vintage magazine scalable t-shirt psd
Choose a folder
All favorites
Create new
Save
Vintage magazine scalable t-shirt psd
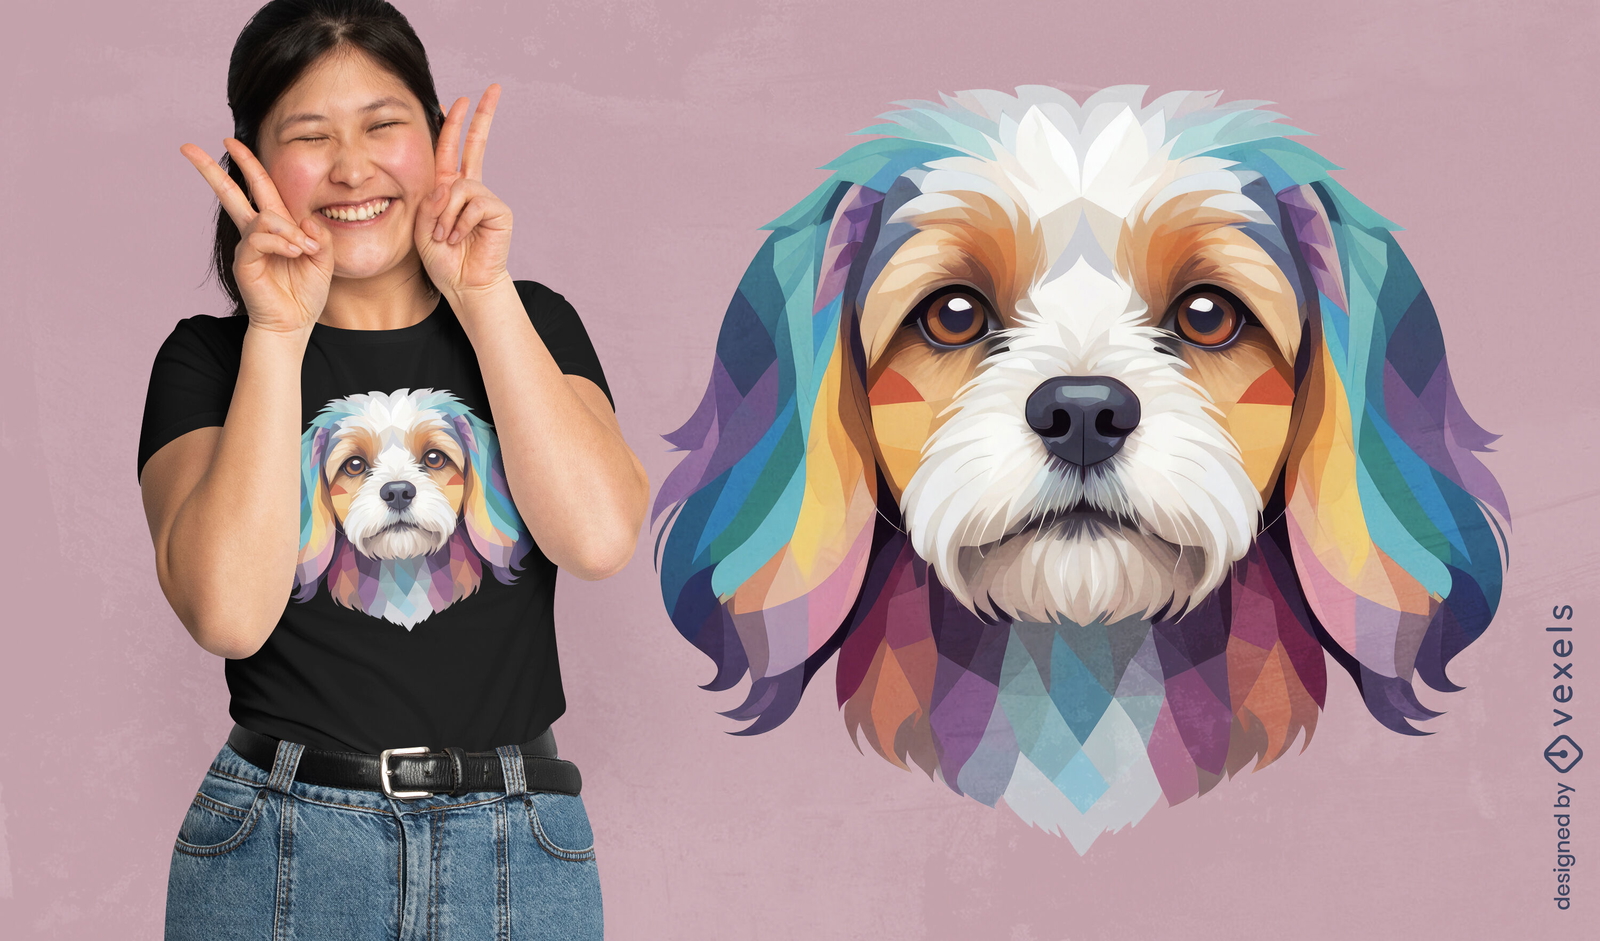
Print ready
for Merch
Colorful cavachon dog t-shirt design
Choose a folder
All favorites
Create new
Save
Colorful cavachon dog t-shirt design
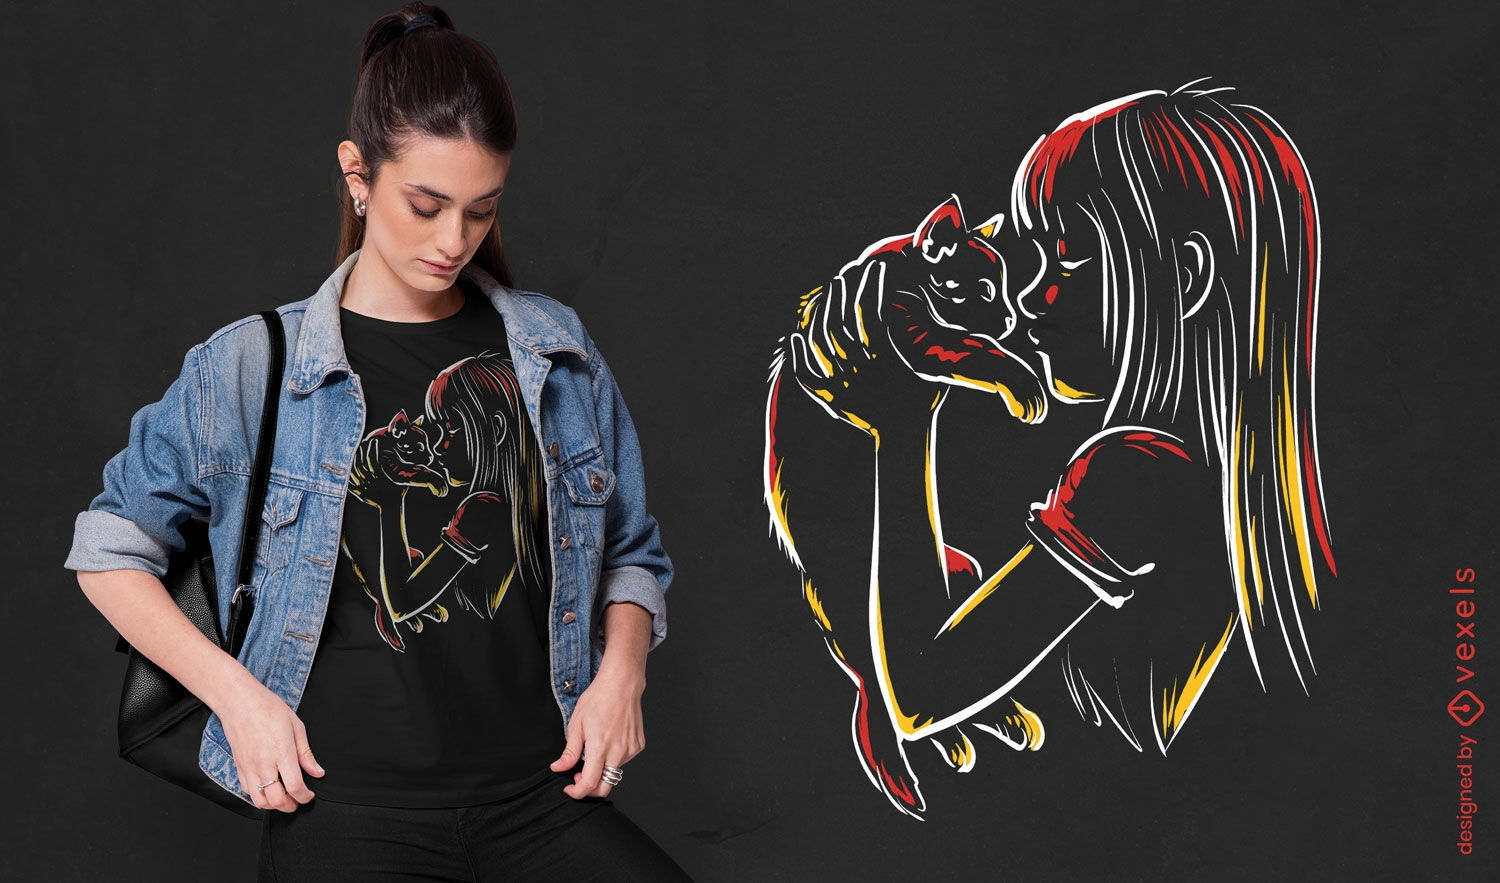
Print ready
for Merch
Tender cat and girl silhouette t-shirt design
Choose a folder
All favorites
Create new
Save
Tender cat and girl silhouette t-shirt design
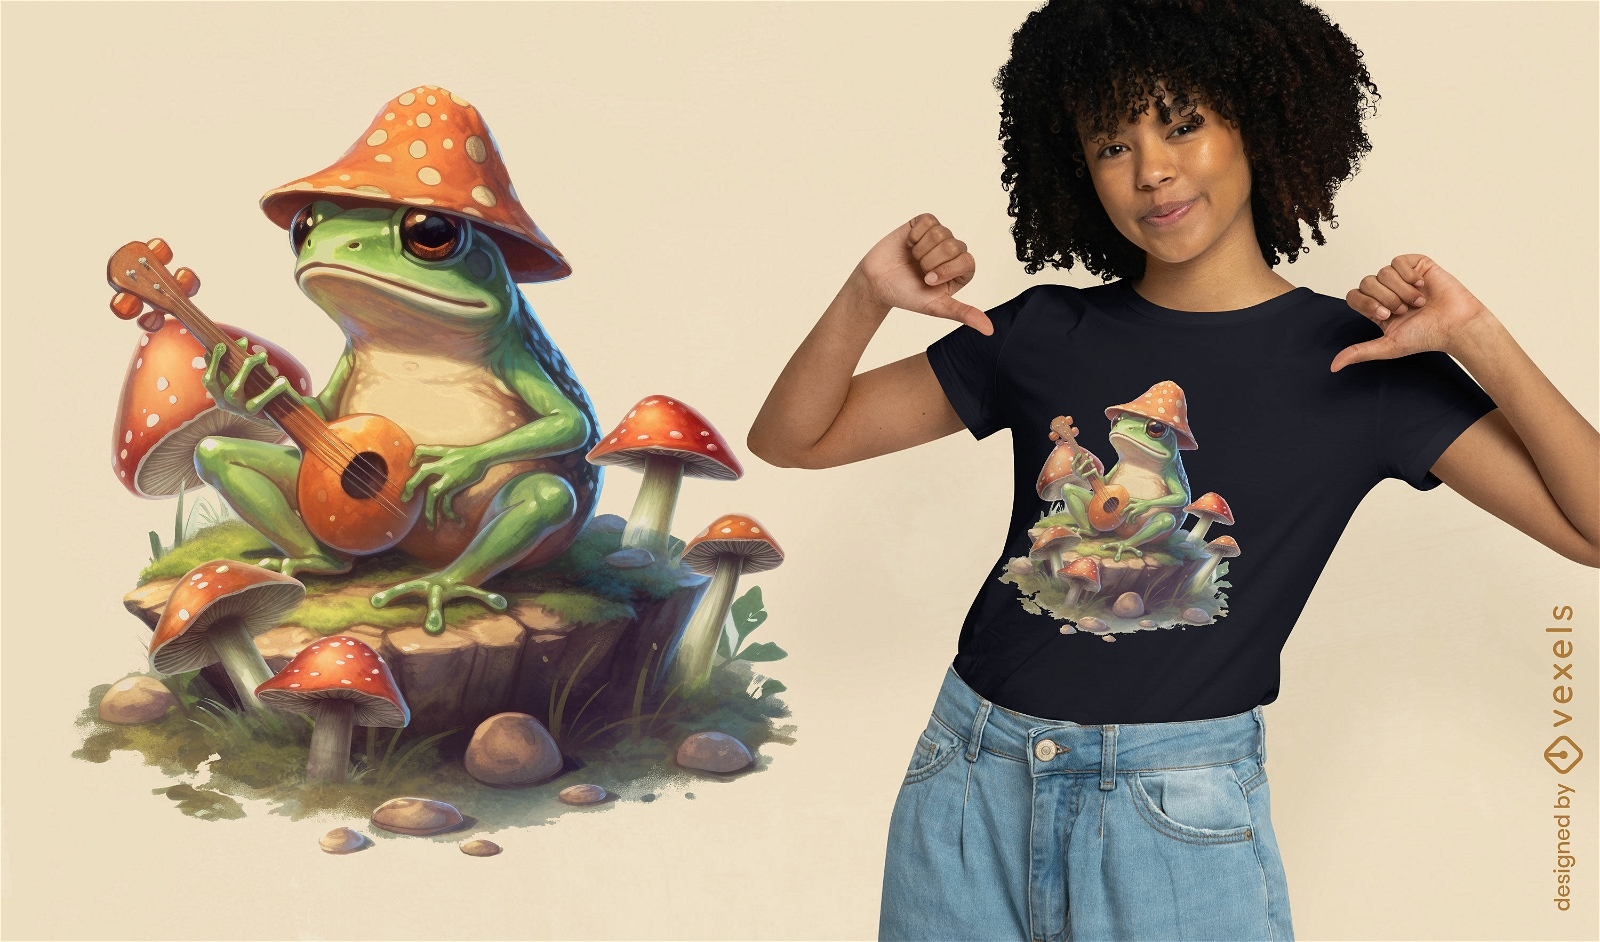
Print ready
for Merch
Musical frog with banjo t-shirt design
Choose a folder
All favorites
Create new
Save
Musical frog with banjo t-shirt design
Print ready
for Merch
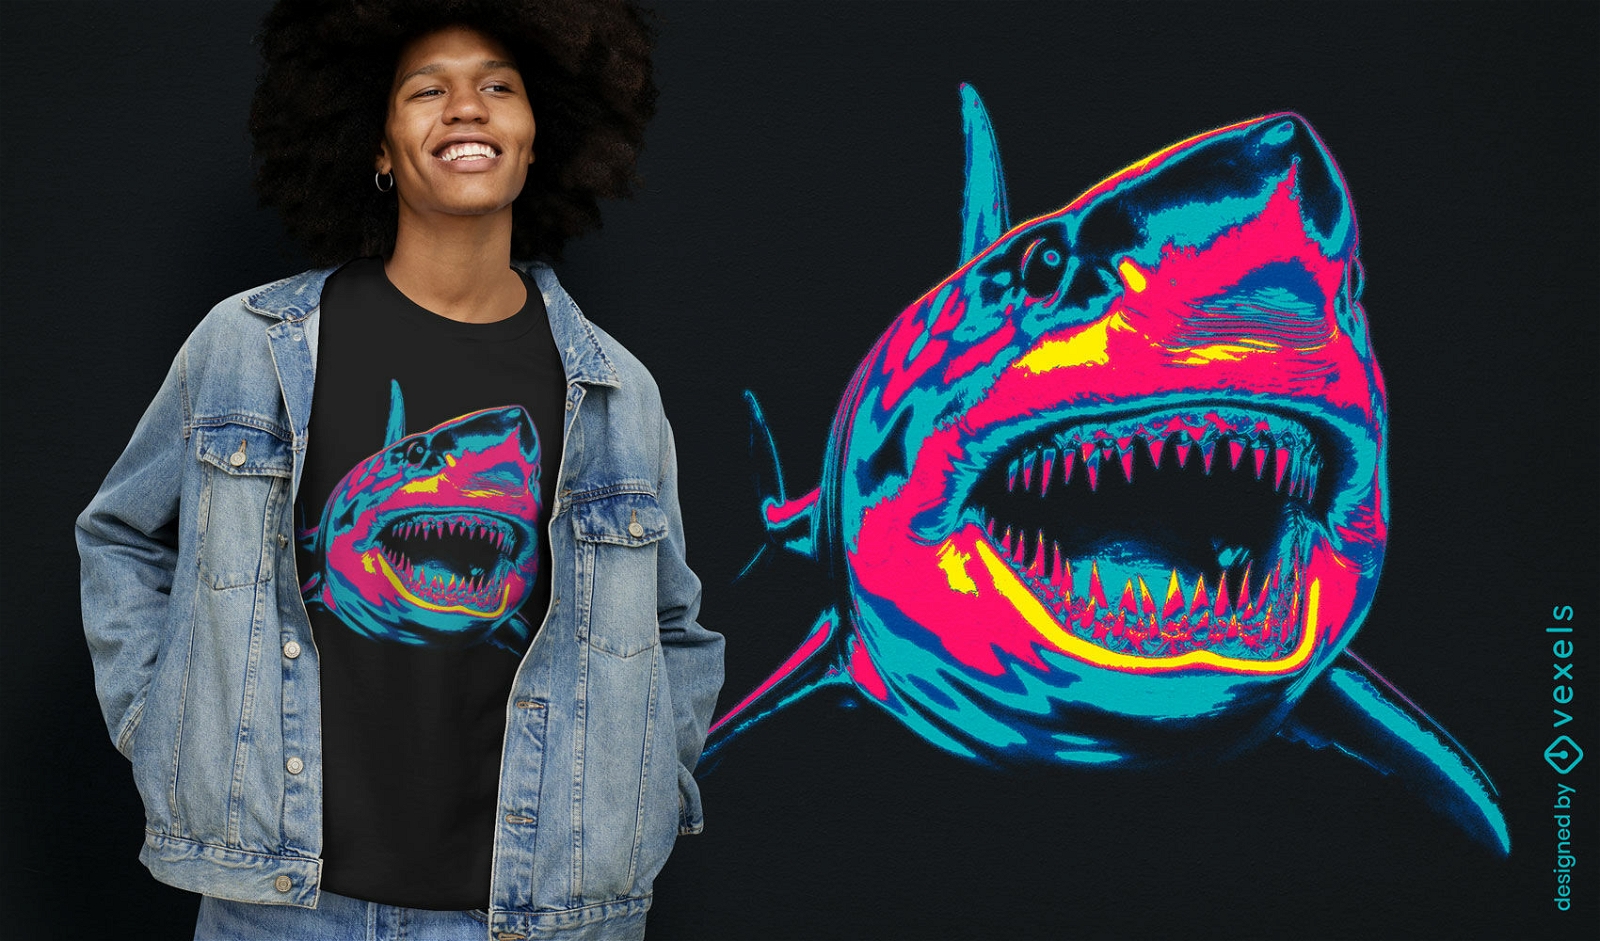
Neon shark t-shirt design
Choose a folder
All favorites
Create new
Save
Neon shark t-shirt design
Print ready
for Merch
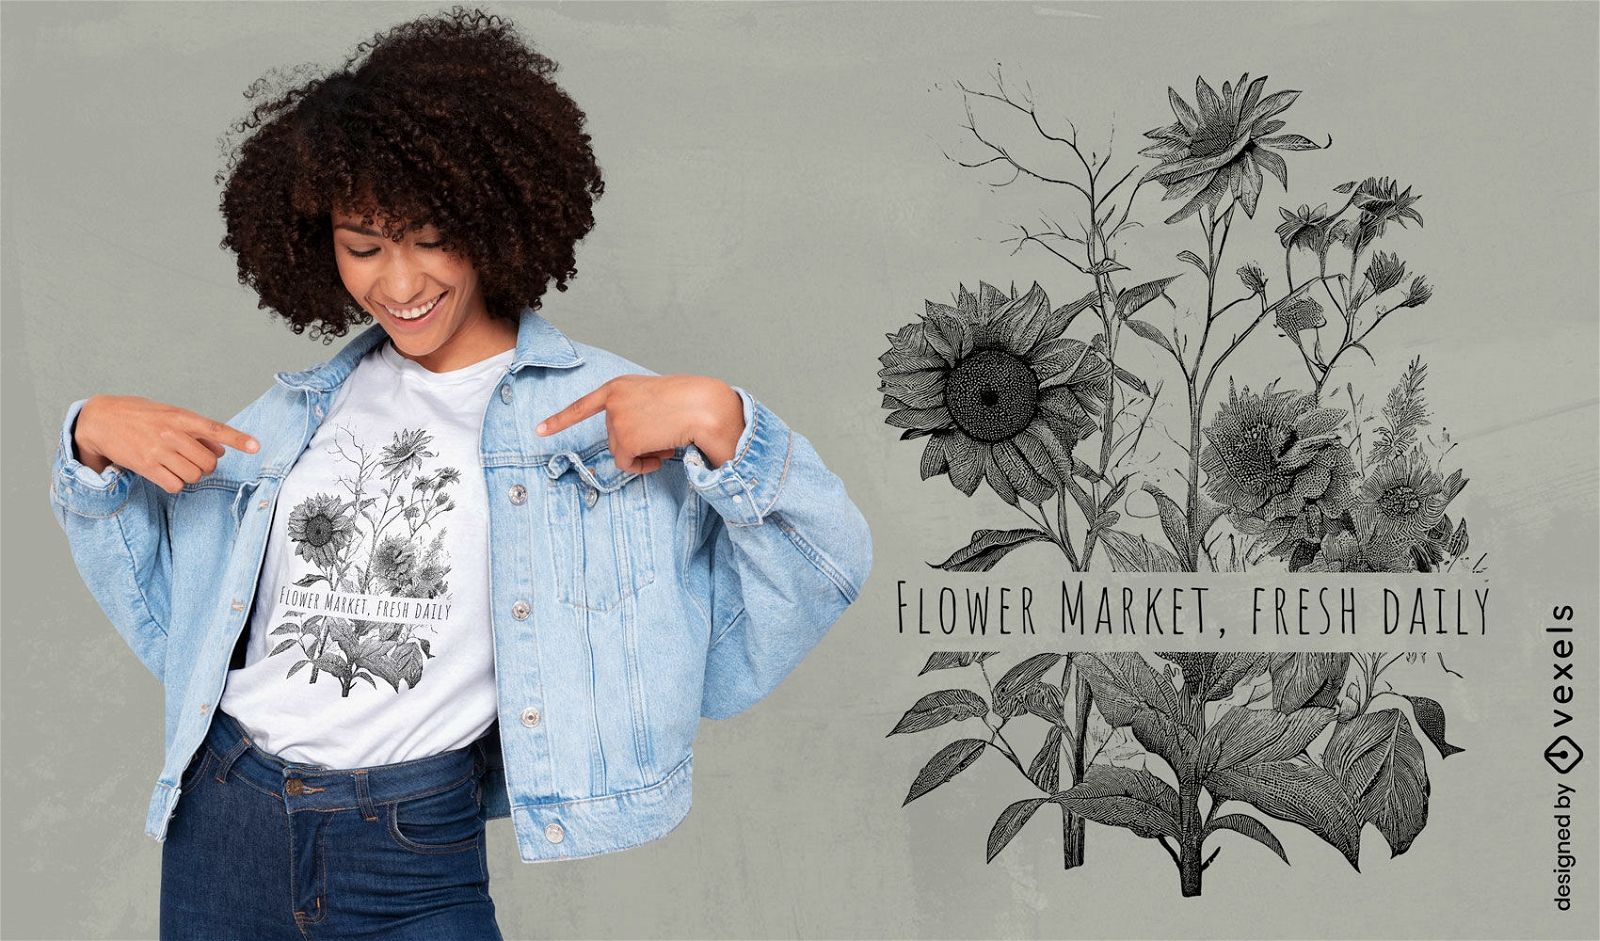
Botanical flower market t-shirt design
Choose a folder
All favorites
Create new
Save
Botanical flower market t-shirt design
Print ready
for Merch
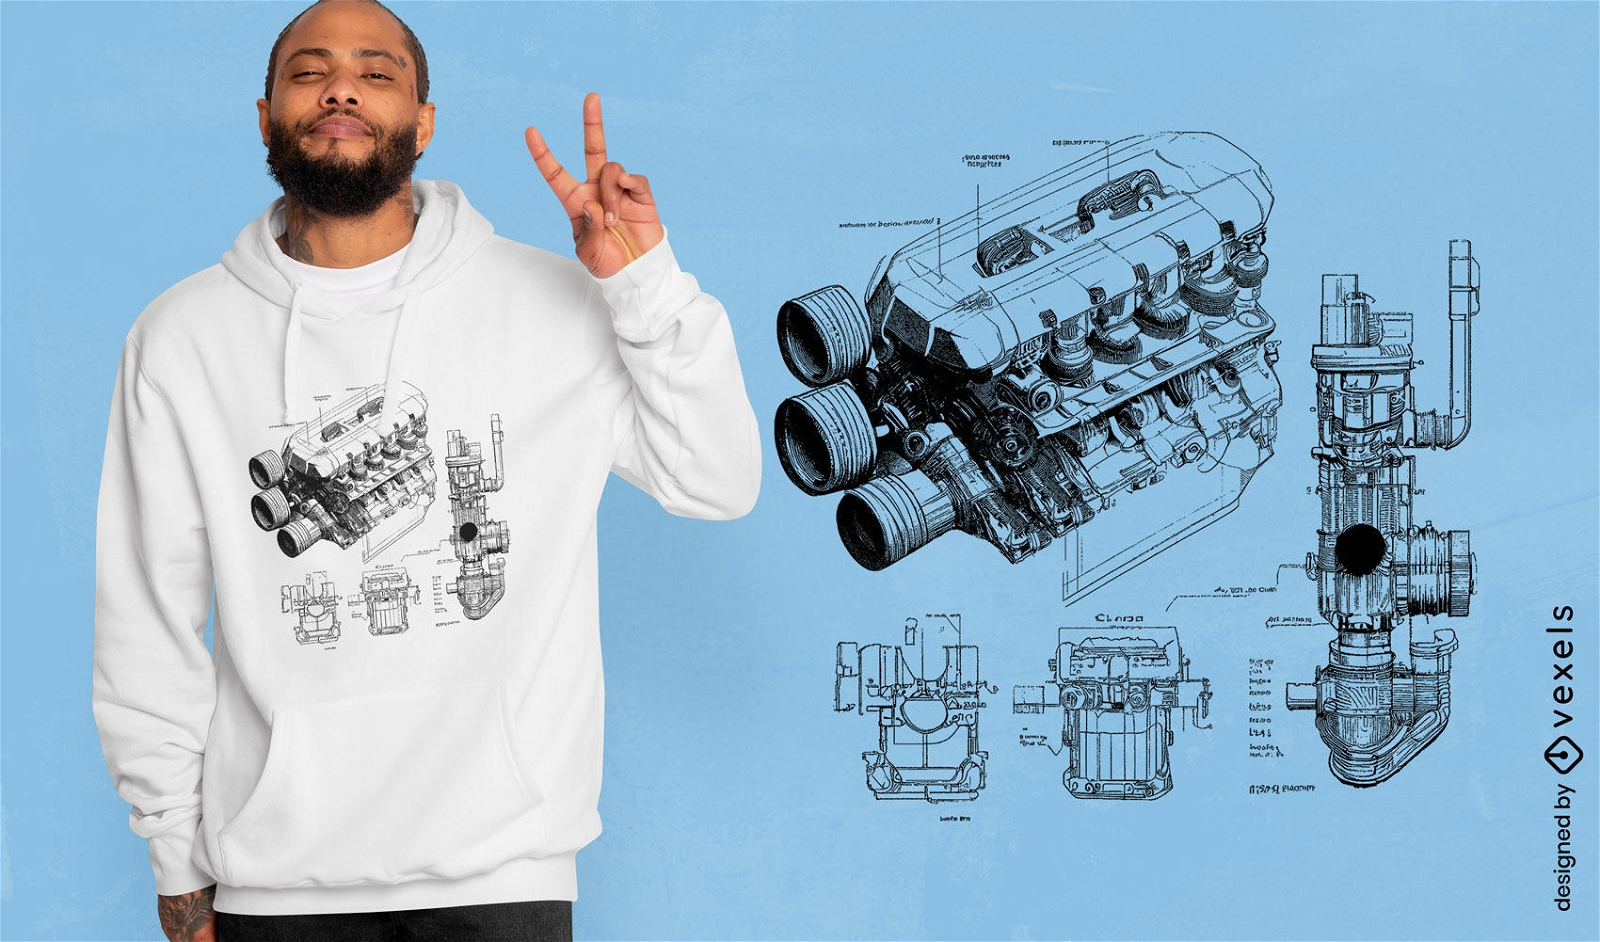
Engine blueprint t-shirt design
Choose a folder
All favorites
Create new
Save
Engine blueprint t-shirt design
Print ready
for Merch
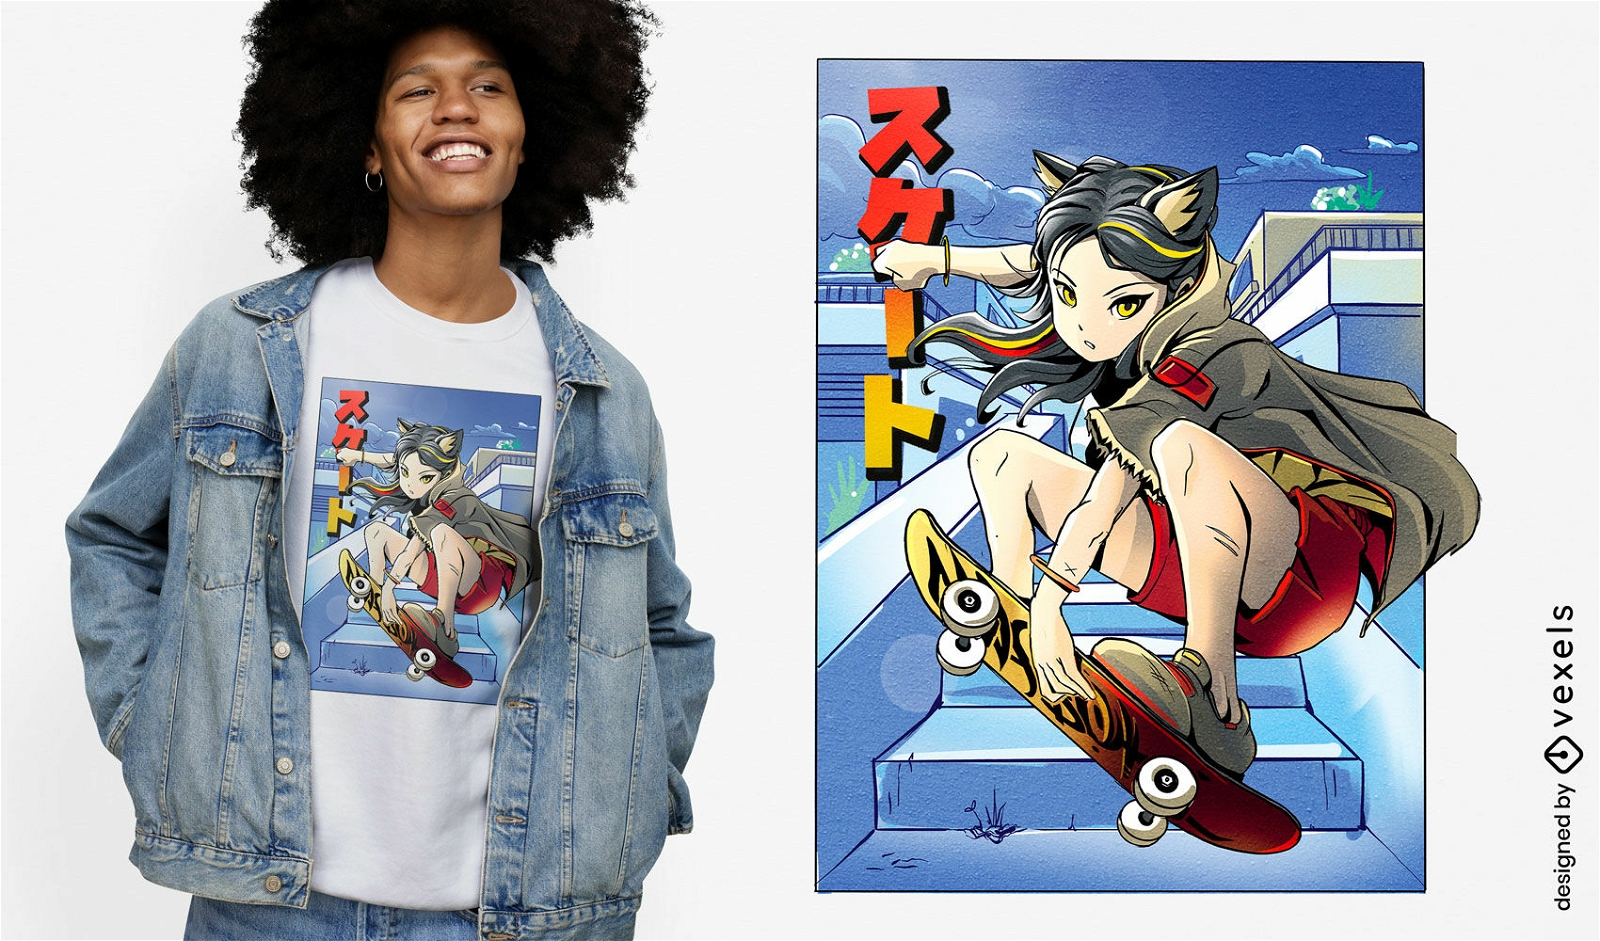
Anime cat girl skateboarding t-shirt design
Choose a folder
All favorites
Create new
Save
Anime cat girl skateboarding t-shirt design
Editable text
Print ready
for Merch
Halloween Grim Reaper doodle t-shirt design
Choose a folder
All favorites
Create new
Save
Halloween Grim Reaper doodle t-shirt design
Editable text
Print ready
for Merch
Space warrior t-shirt design
Choose a folder
All favorites
Create new
Save
Space warrior t-shirt design
Editable text
Print ready
for Merch
Astronaut and alien monster t-shirt design
Choose a folder
All favorites
Create new
Save
Astronaut and alien monster t-shirt design
Editable text
for Merch
Spiral gothic text scalable t-shirt psd
Choose a folder
All favorites
Create new
Save
Spiral gothic text scalable t-shirt psd
Print ready
for Merch
Dark magic elements t-shirt design
Choose a folder
All favorites
Create new
Save
Dark magic elements t-shirt design
Print ready
for Merch
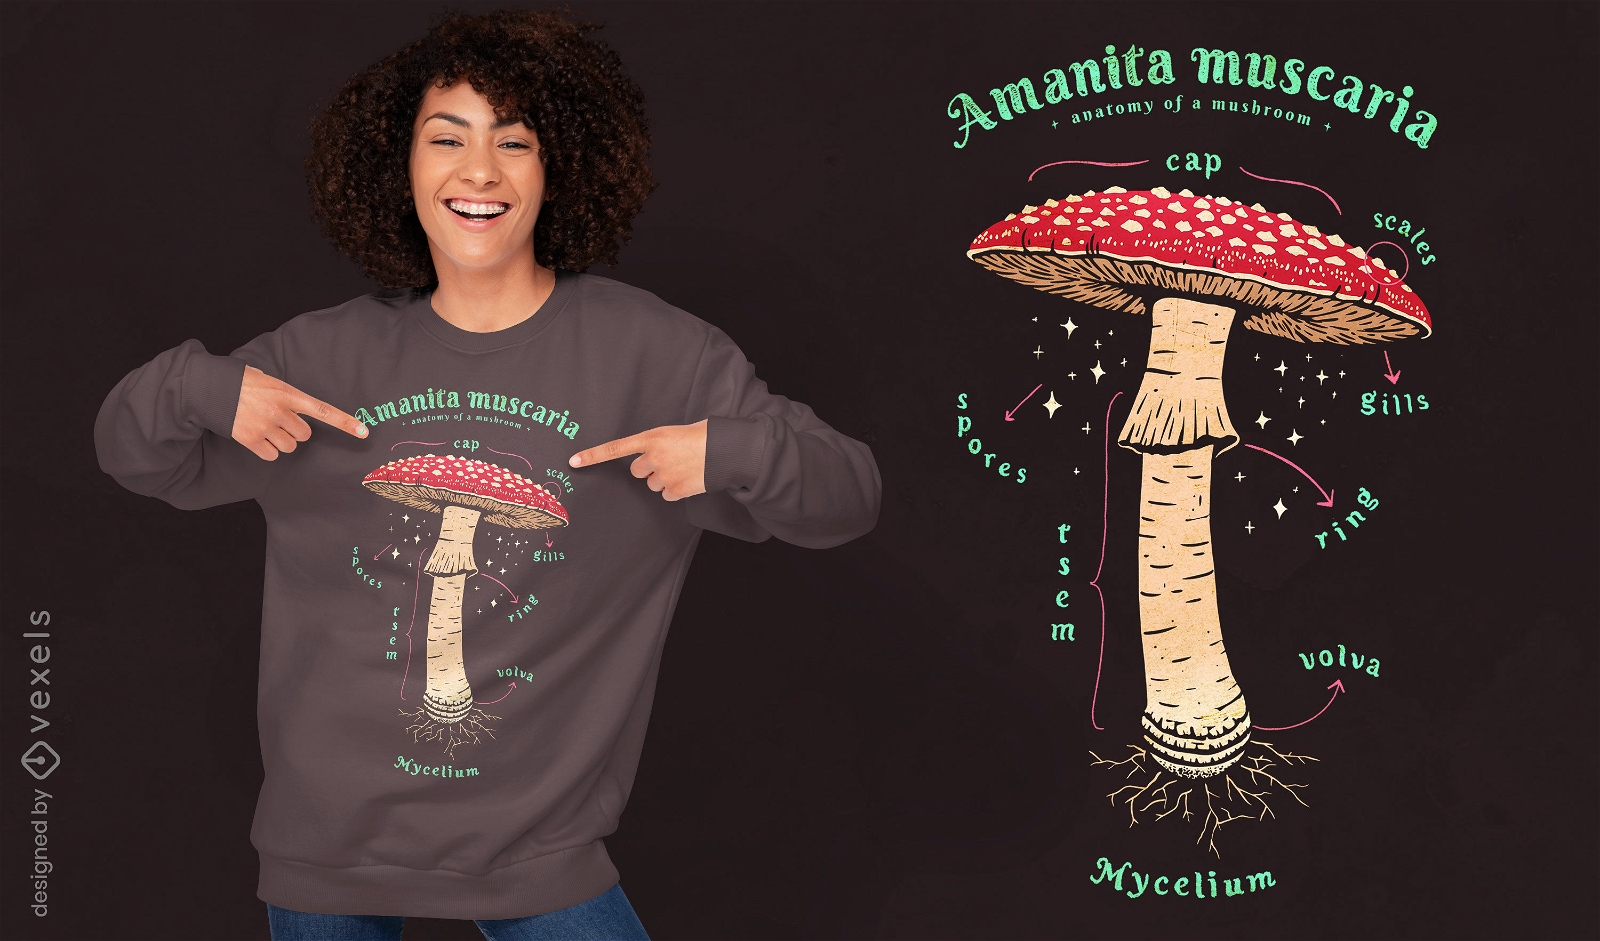
Mushroom antomy nature t-shirt psd
Choose a folder
All favorites
Create new
Save
Mushroom antomy nature t-shirt psd
Print ready
for Merch
Special forces soldier t-shirt design
Choose a folder
All favorites
Create new
Save
Special forces soldier t-shirt design
Editable text
for Merch
Steampunk compass scalable t-shirt psd
Choose a folder
All favorites
Create new
Save
Steampunk compass scalable t-shirt psd
Print ready
for Merch
Philadelphia skyline t-shirt design
Choose a folder
All favorites
Create new
Save
Philadelphia skyline t-shirt design
Print ready
for Merch
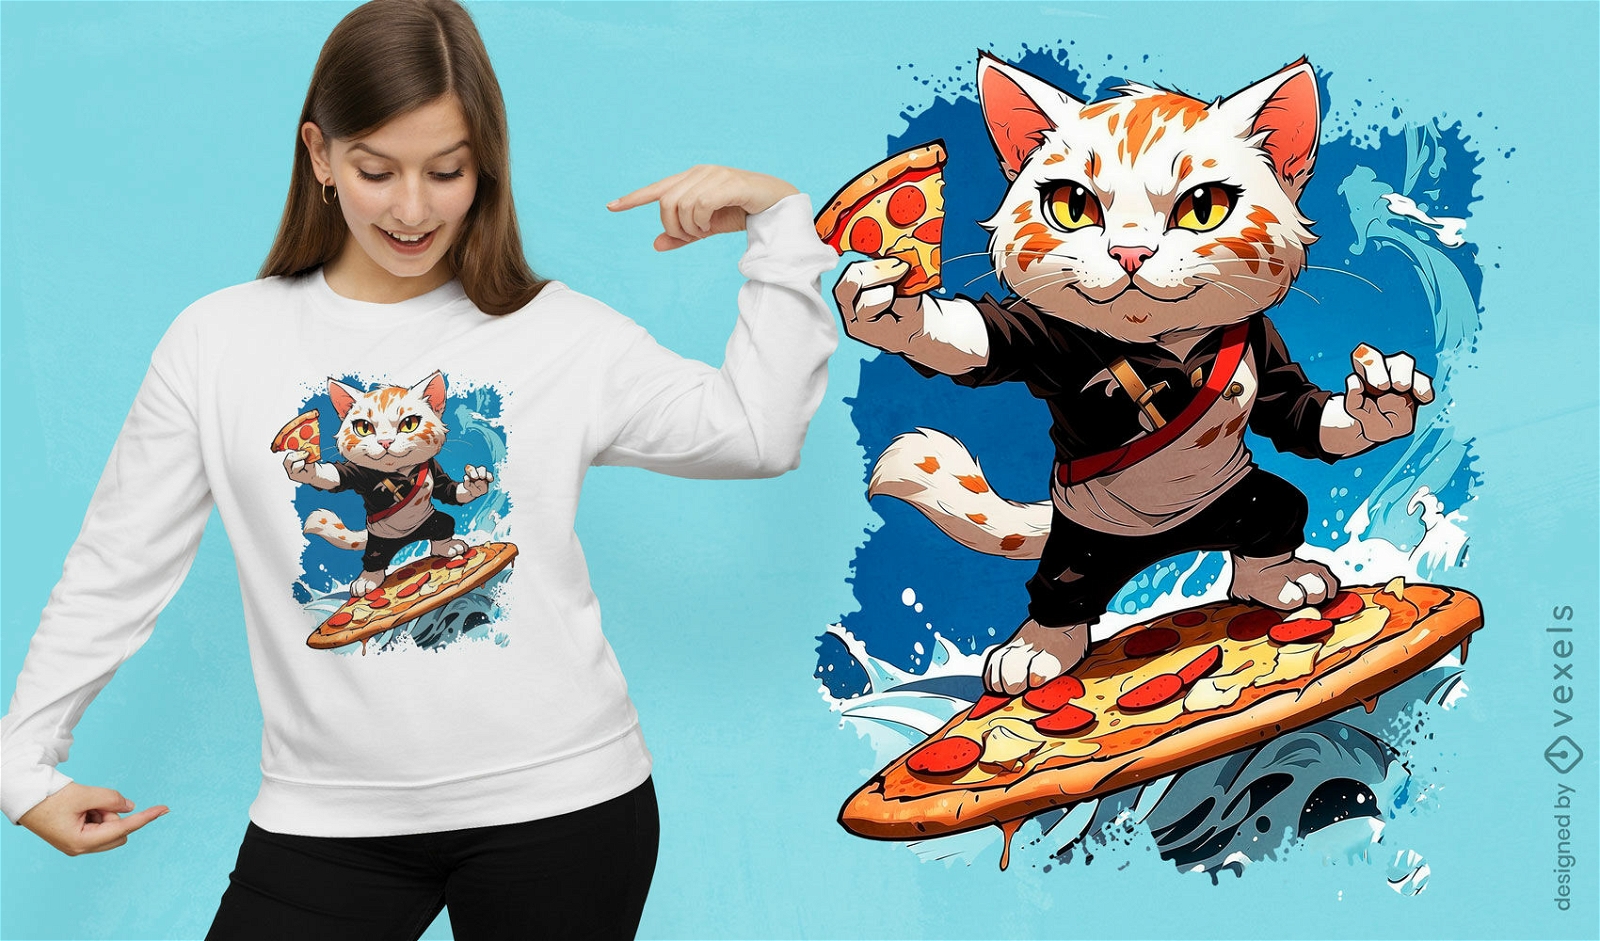
Surfing cat pizza party t-shirt design
Choose a folder
All favorites
Create new
Save
Surfing cat pizza party t-shirt design
Print ready
for Merch
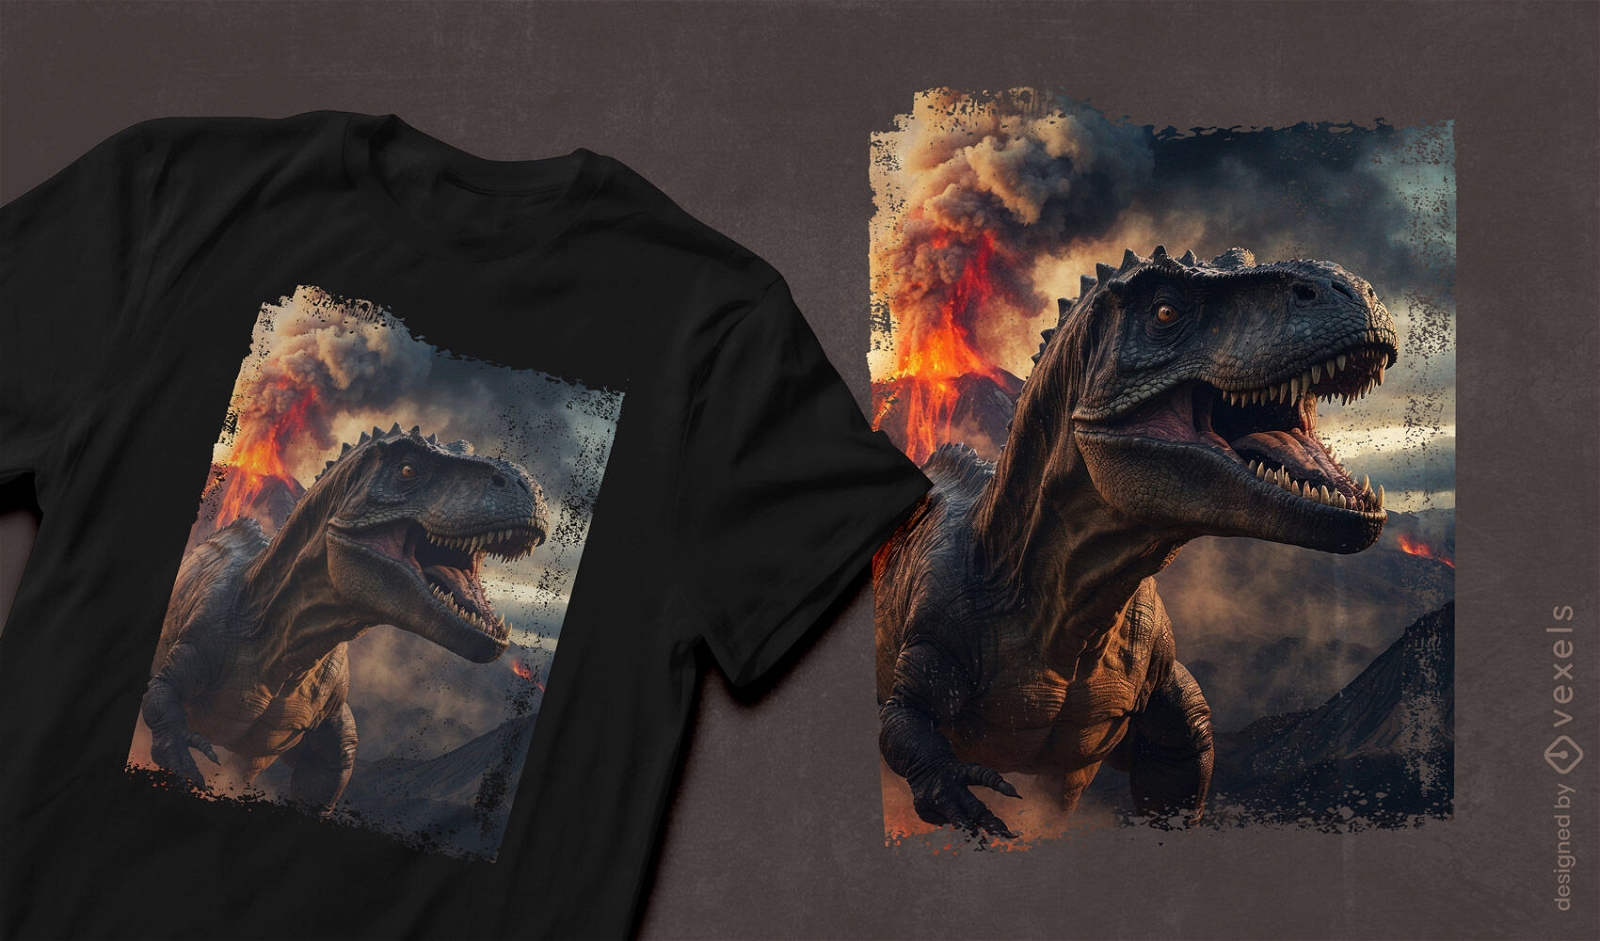
Realistic roaring T-Rex t-shirt design
Choose a folder
All favorites
Create new
Save
Realistic roaring T-Rex t-shirt design
Print ready
for Merch
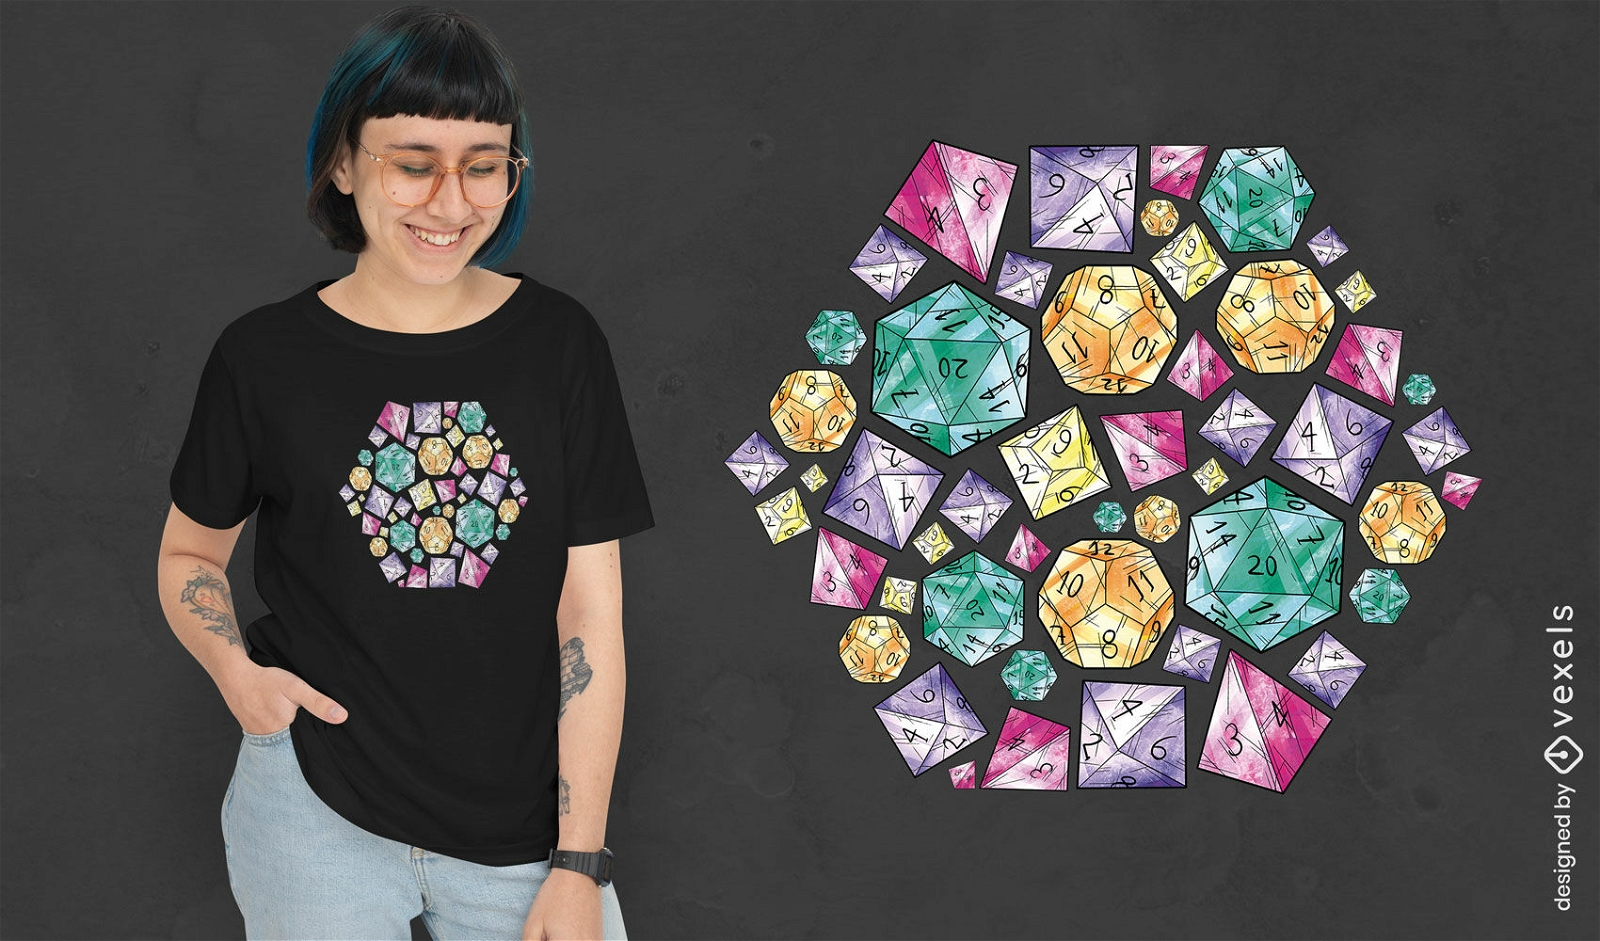
RPG dice collection t-shirt design
Choose a folder
All favorites
Create new
Save
RPG dice collection t-shirt design
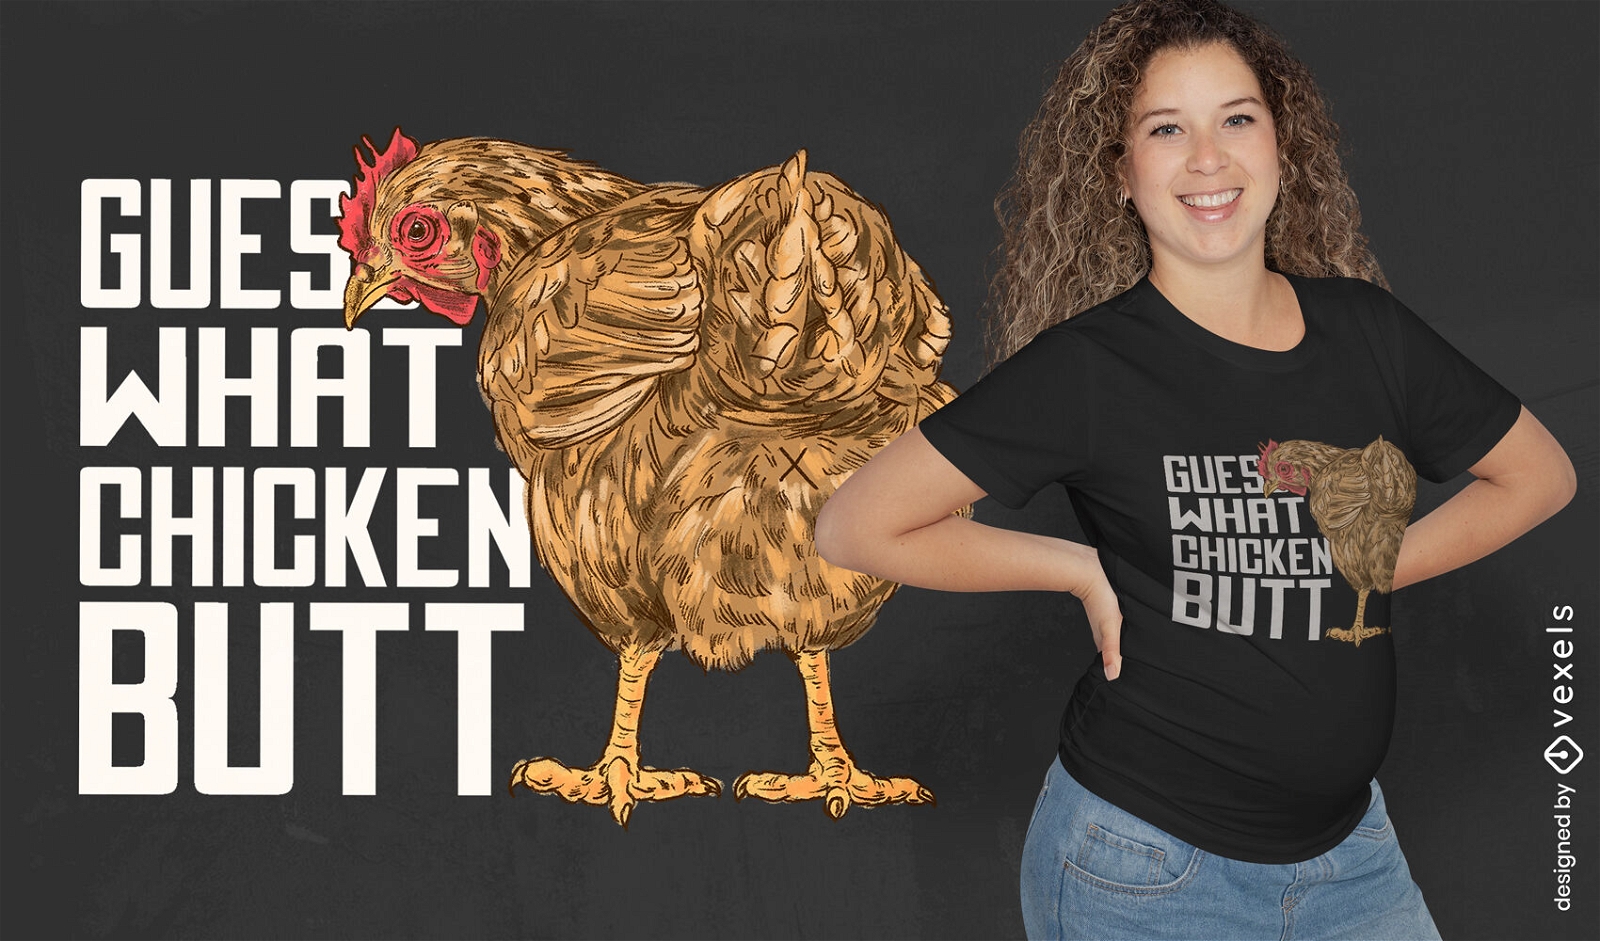
Editable text
Print ready
for Merch
Chicken butt quote t-shirt design
Choose a folder
All favorites
Create new
Save
Chicken butt quote t-shirt design
Print ready
for Merch
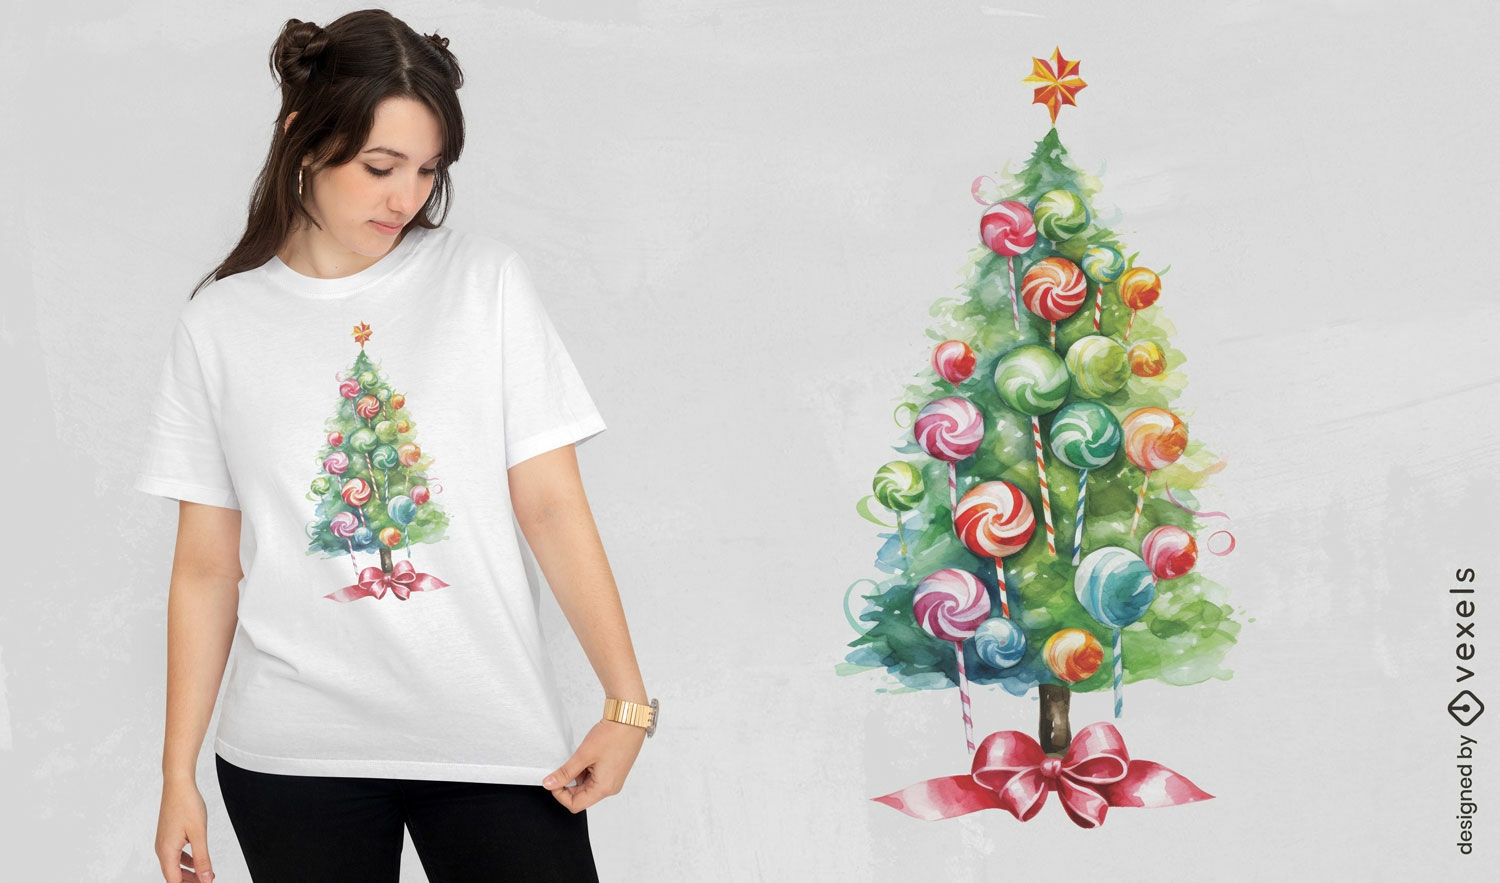
Christmas tree lollipop t-shirt design
Choose a folder
All favorites
Create new
Save
Christmas tree lollipop t-shirt design
Print ready
for Merch
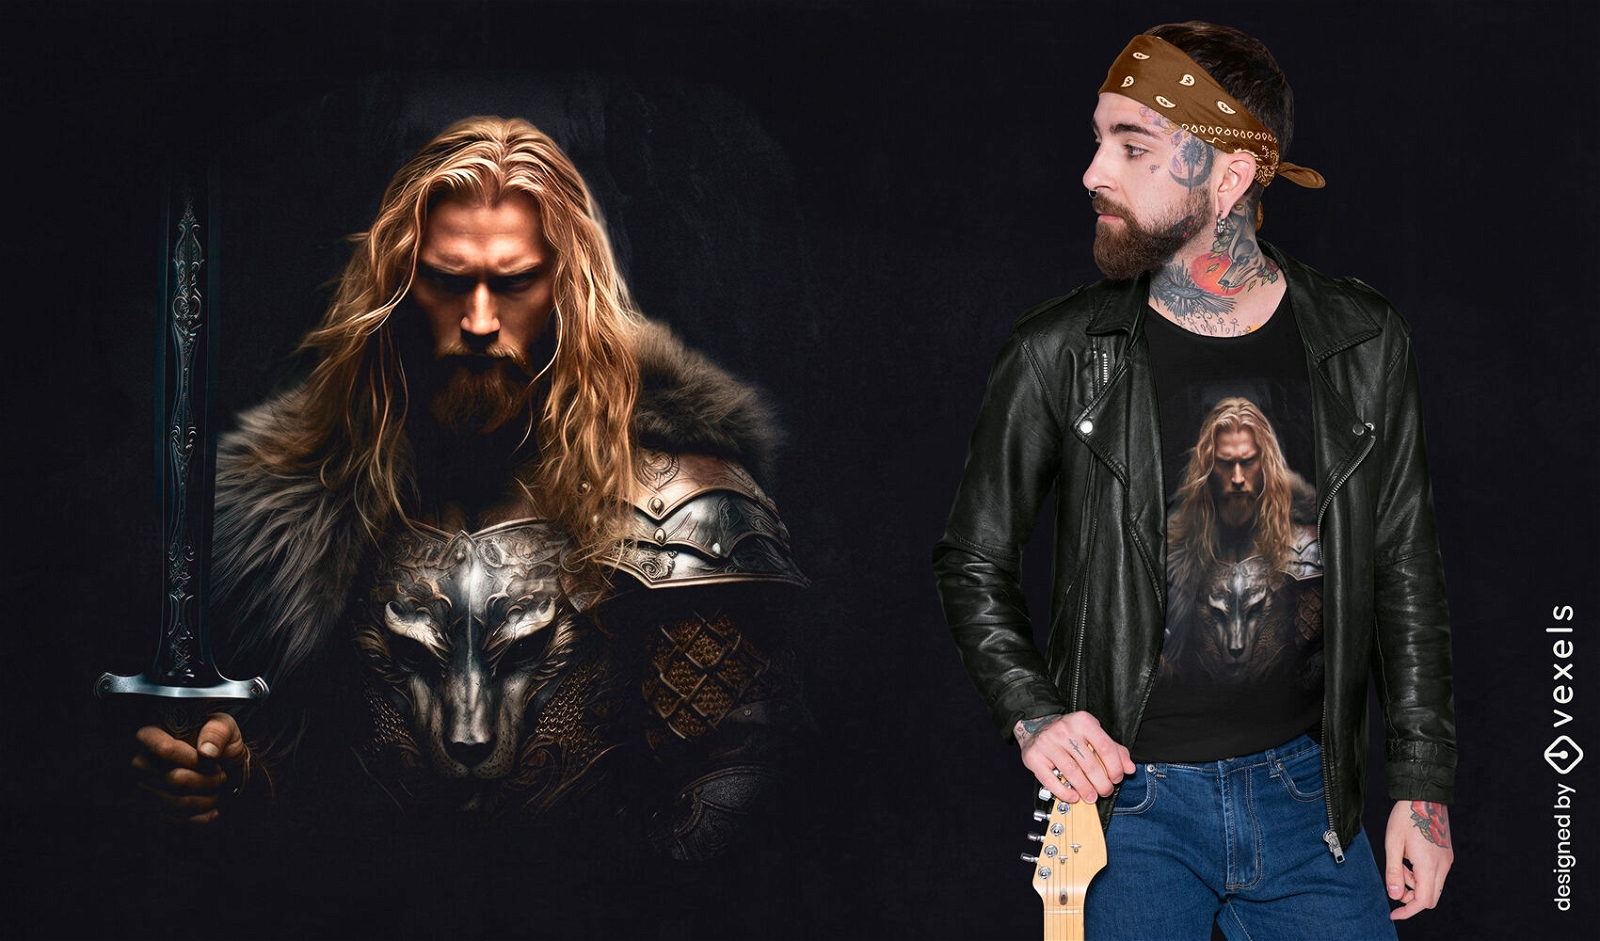
Fantasy warrior psd t-shirt design
Choose a folder
All favorites
Create new
Save
Fantasy warrior psd t-shirt design
Print ready
for Merch
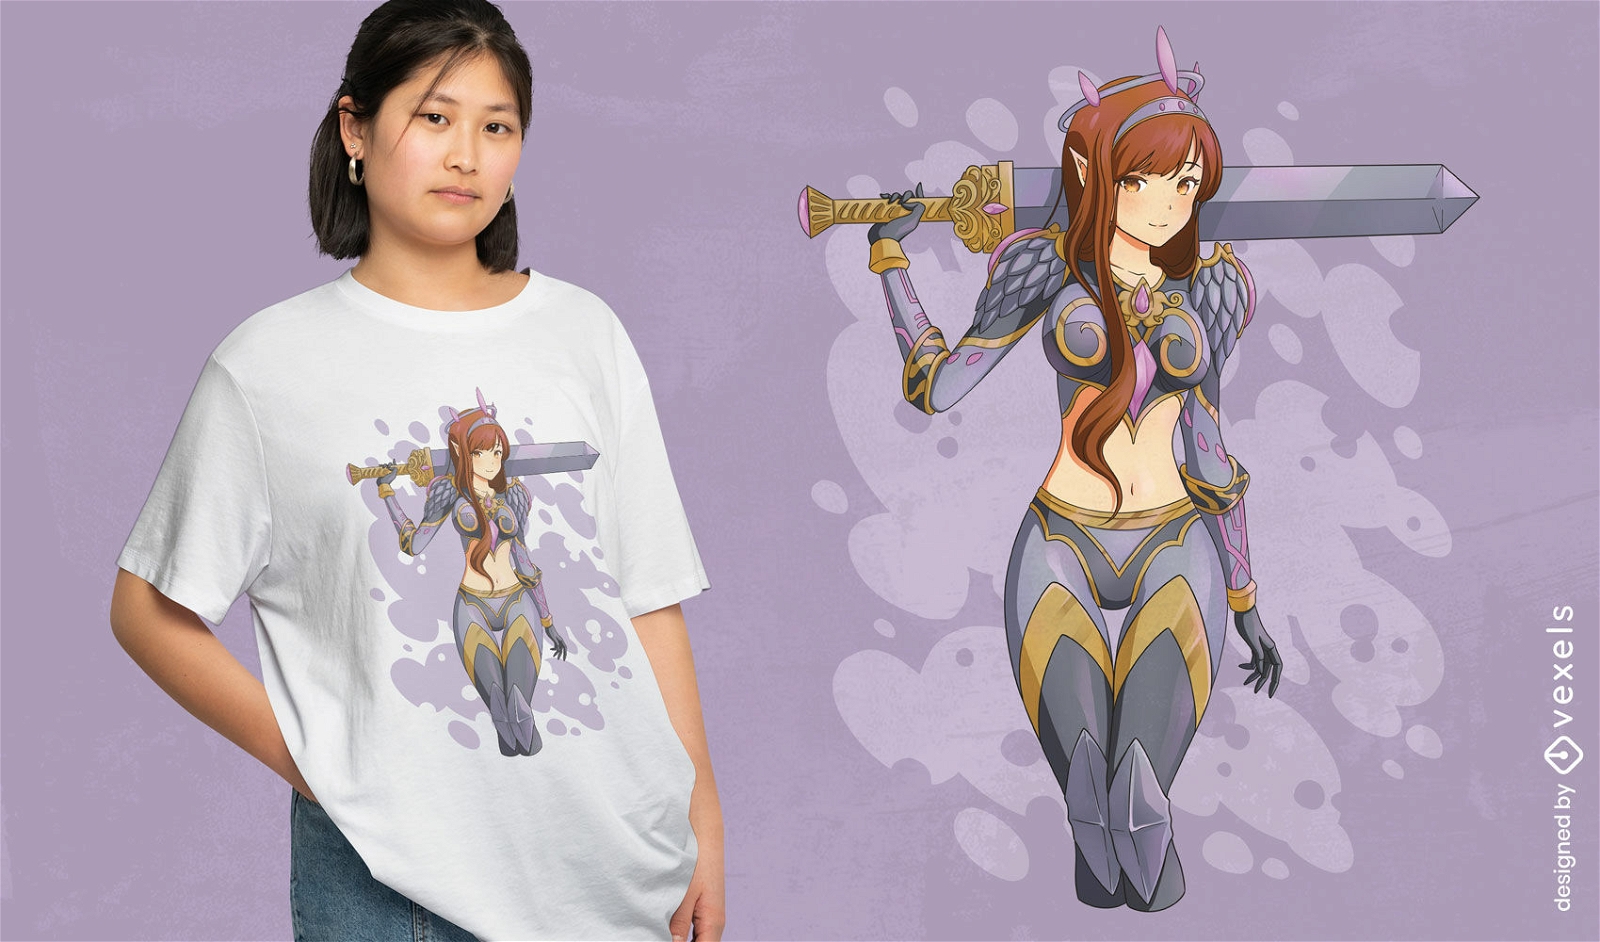
Elf warrior anime girl t-shirt design
Choose a folder
All favorites
Create new
Save
Elf warrior anime girl t-shirt design
Editable text
for Merch
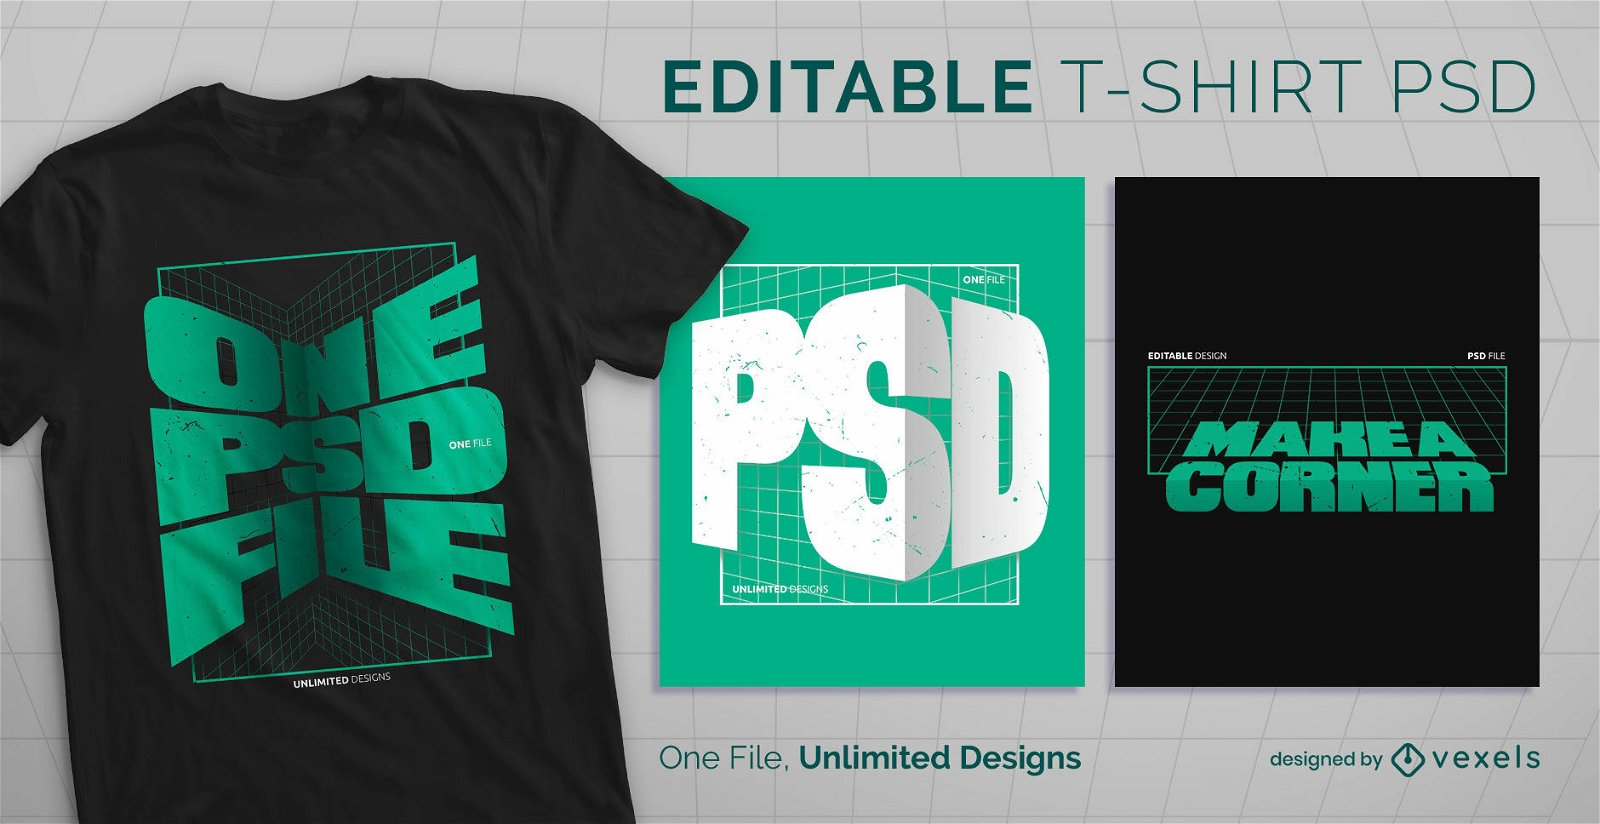
Corner text scalable t-shirt psd
Choose a folder
All favorites
Create new
Save
Corner text scalable t-shirt psd
Print ready
for Merch
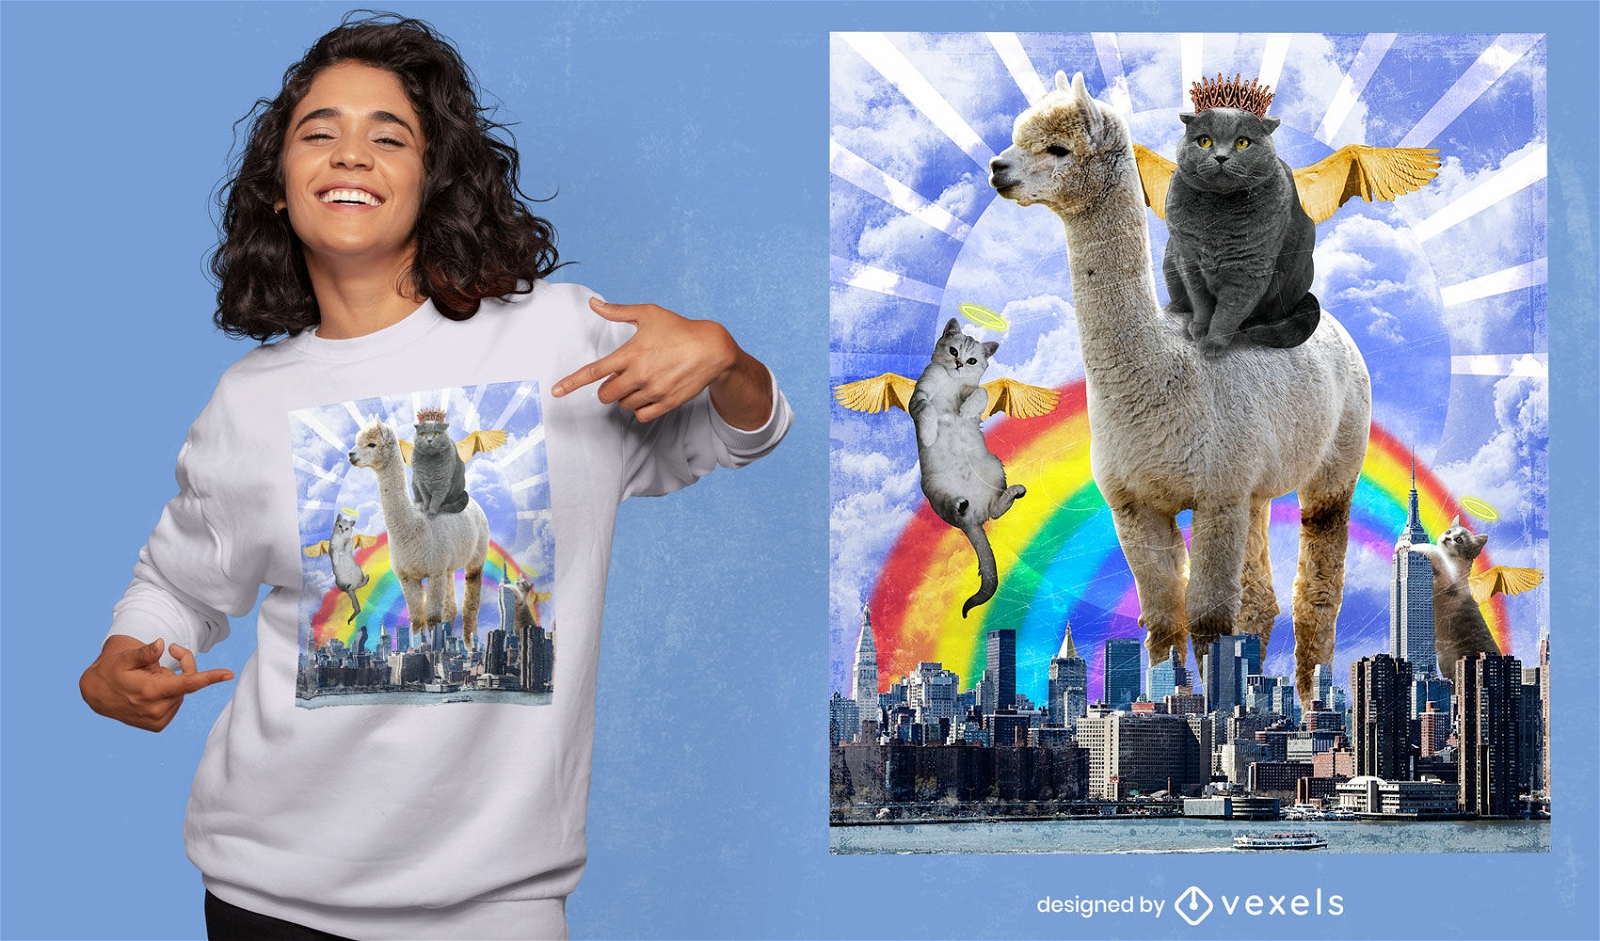
Angel cats surreal collage psd t-shirt design
Choose a folder
All favorites
Create new
Save
Angel cats surreal collage psd t-shirt design
Print ready
for Merch
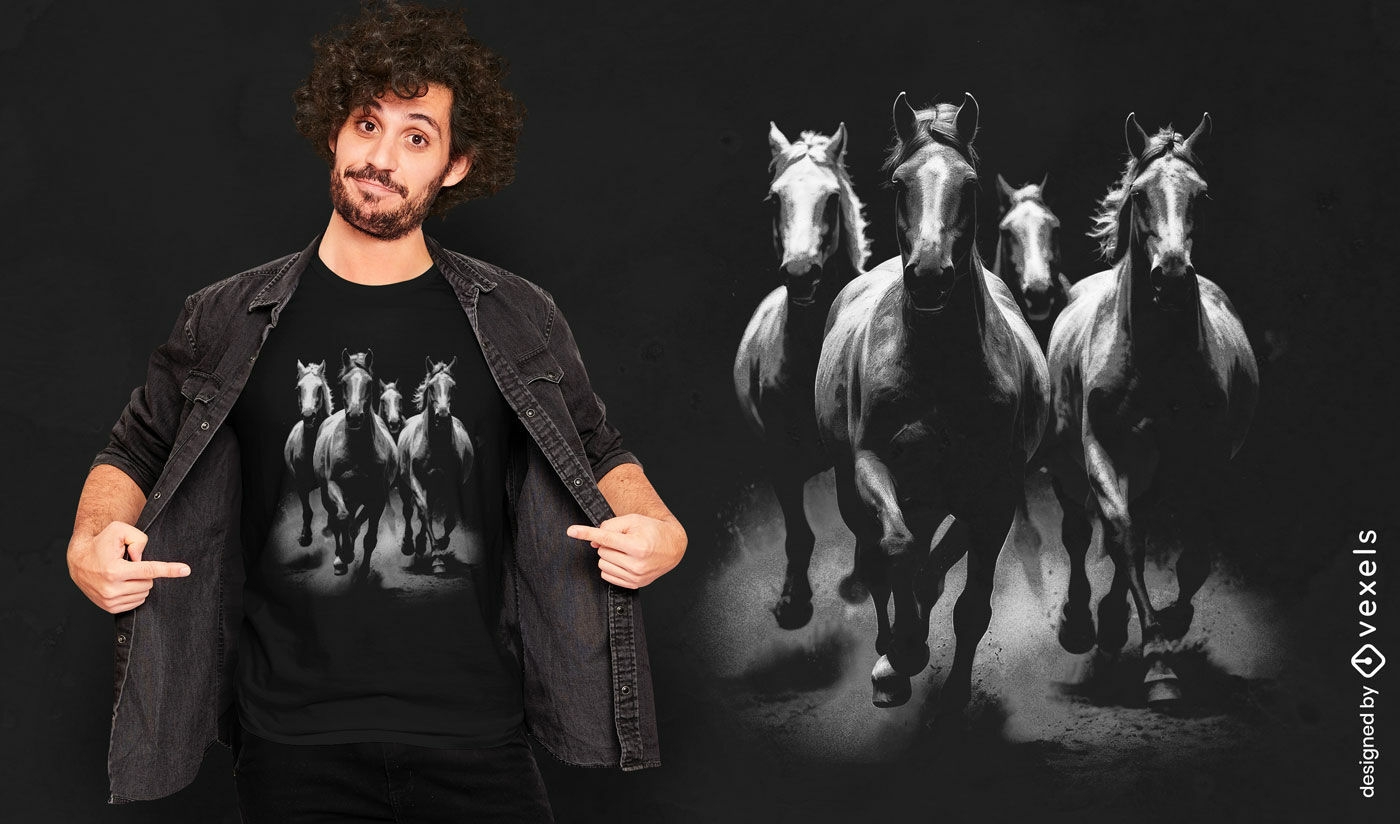
Herd of horses t-shirt design
Choose a folder
All favorites
Create new
Save
Herd of horses t-shirt design
Editable text
Print ready
for Merch
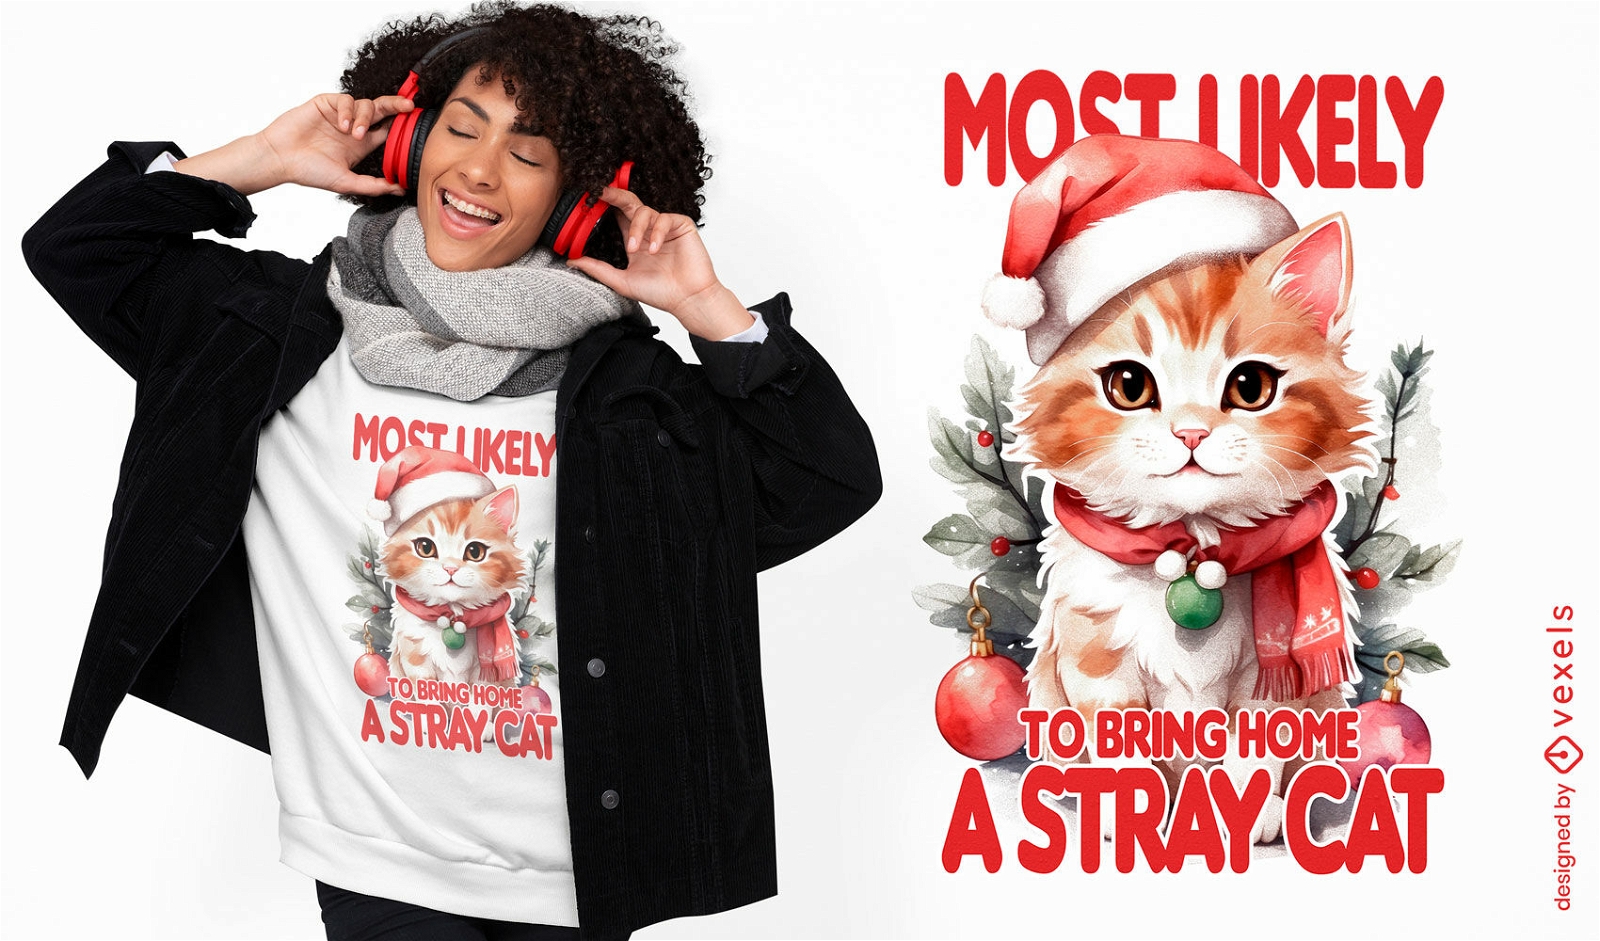
Christmas cat present t-shirt design
Choose a folder
All favorites
Create new
Save
Christmas cat present t-shirt design
Print ready
for Merch
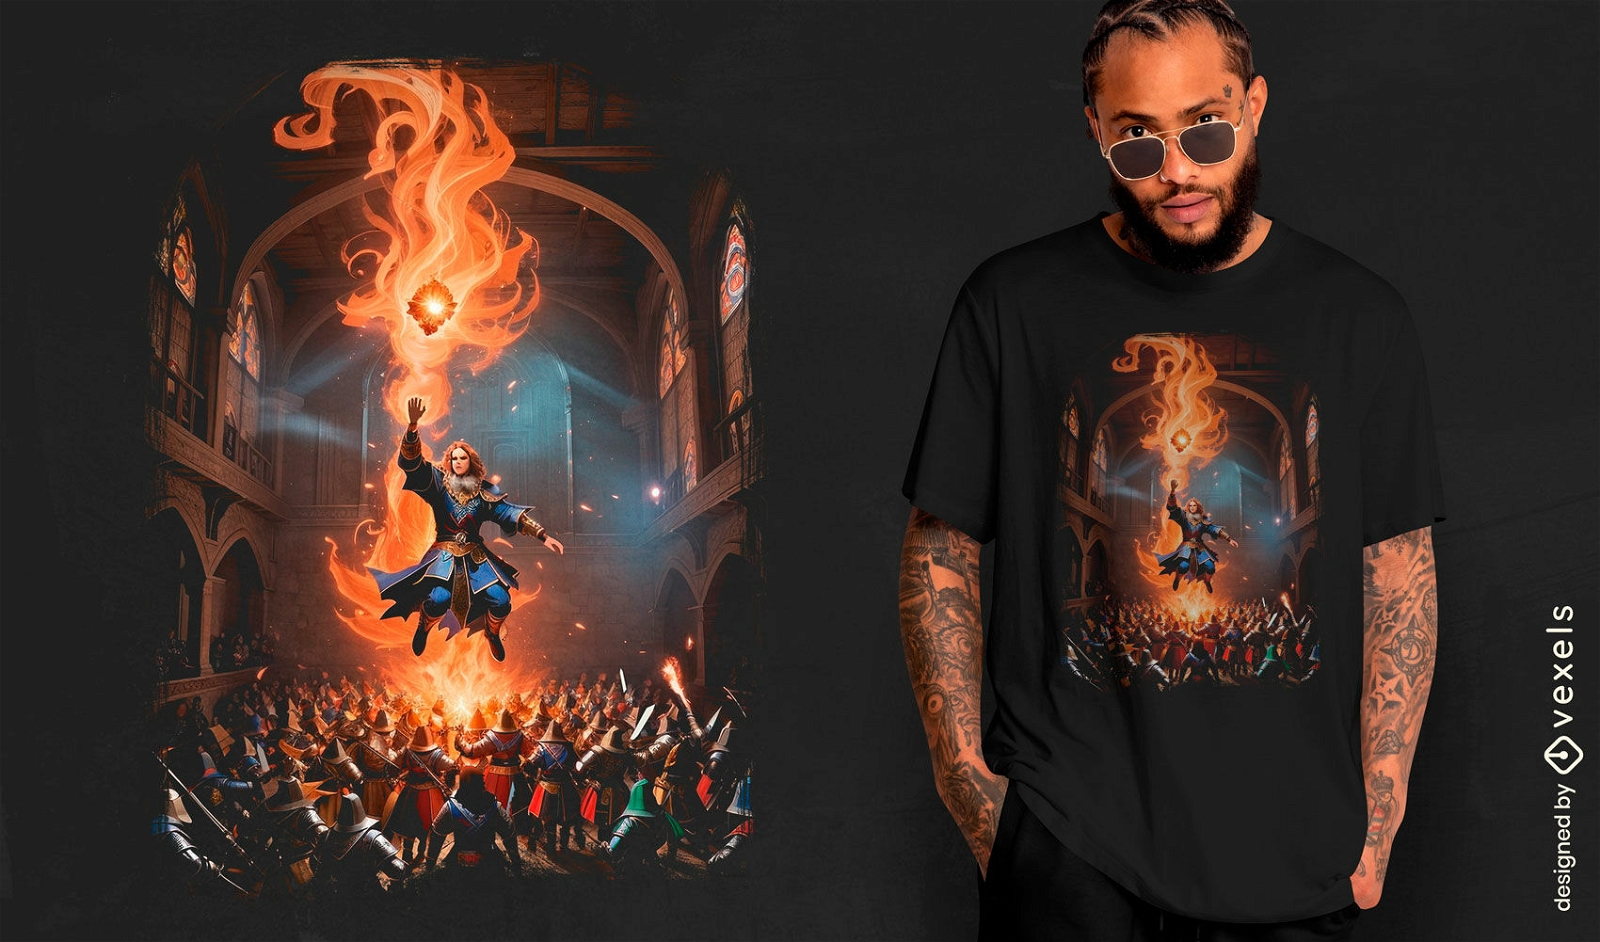
Fiery sorcerer battle t-shirt design
Choose a folder
All favorites
Create new
Save
Fiery sorcerer battle t-shirt design
Print ready
for Merch
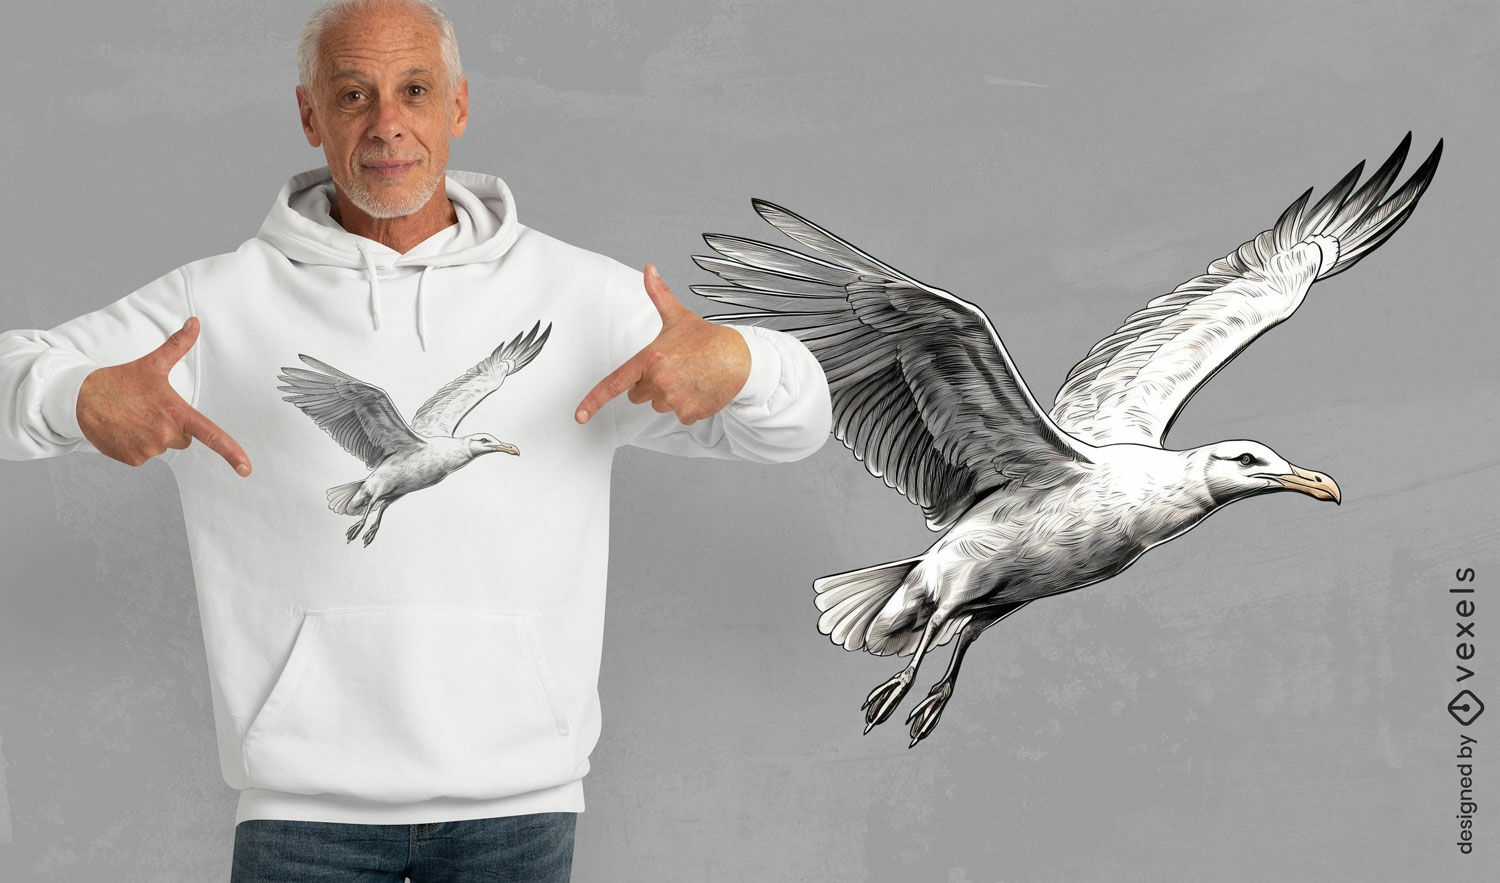
Flying seagull t-shirt design
Choose a folder
All favorites
Create new
Save
Flying seagull t-shirt design
Print ready
for Merch
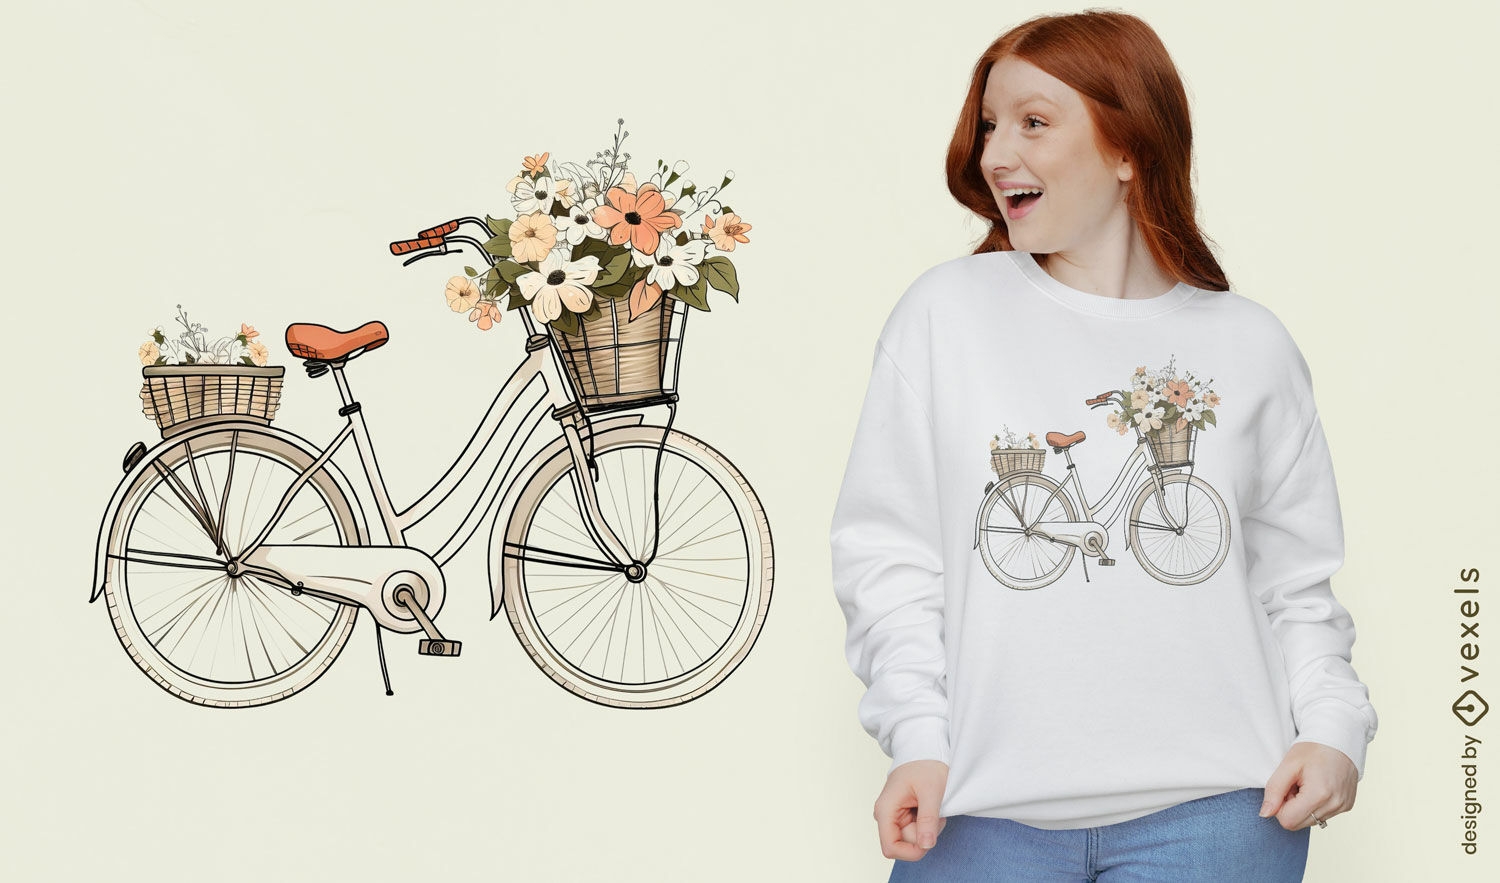
Vintage floral bicycle t-shirt design
Choose a folder
All favorites
Create new
Save
Vintage floral bicycle t-shirt design
Print ready
for Merch
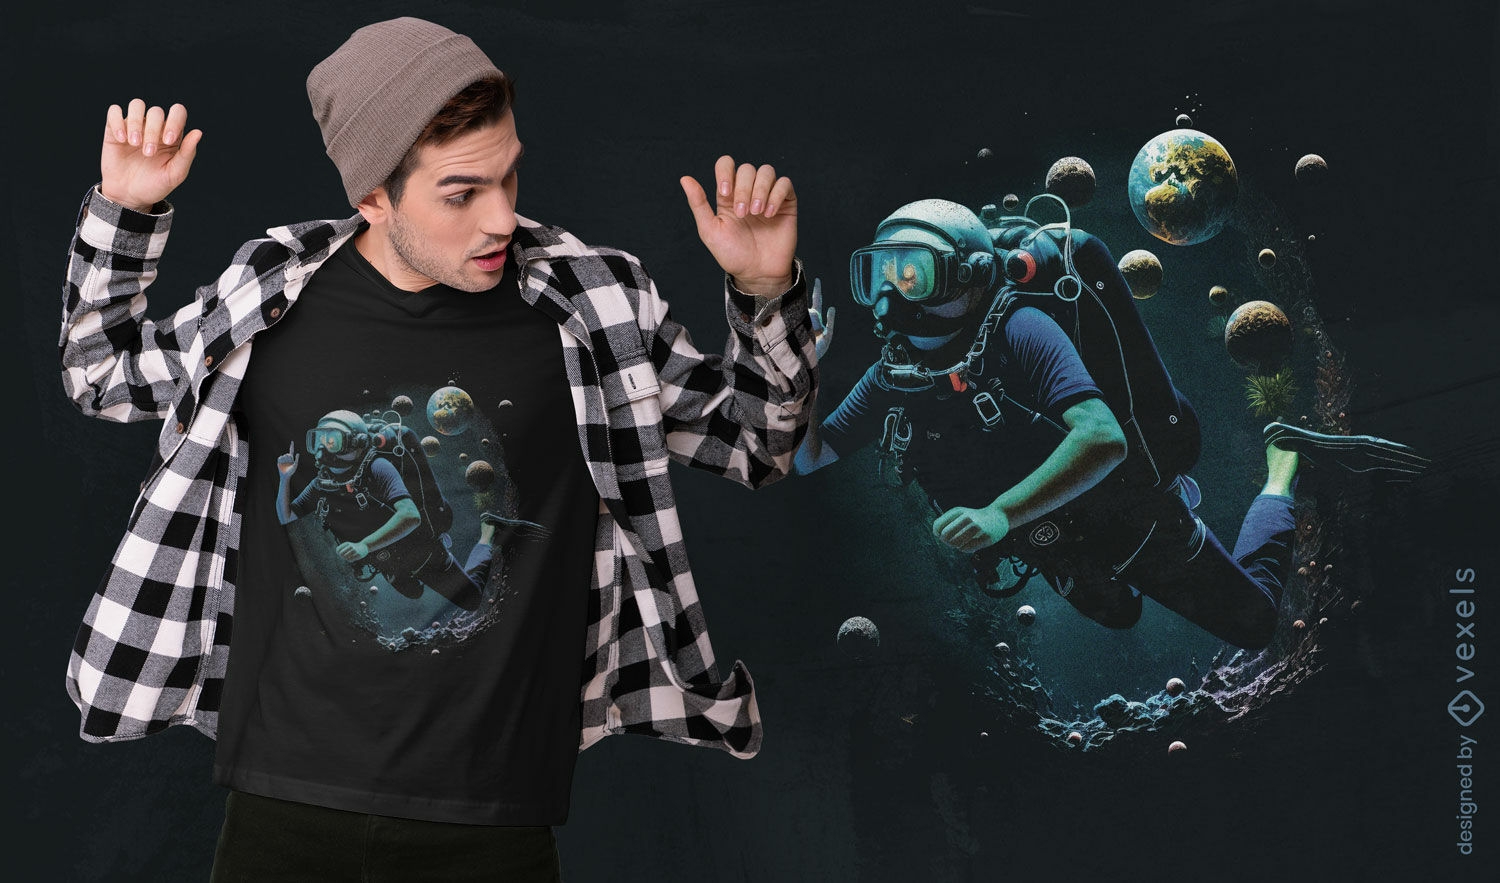
Astronaut diving planets t-shirt design
Choose a folder
All favorites
Create new
Save
Astronaut diving planets t-shirt design
Editable text
Print ready
for Merch
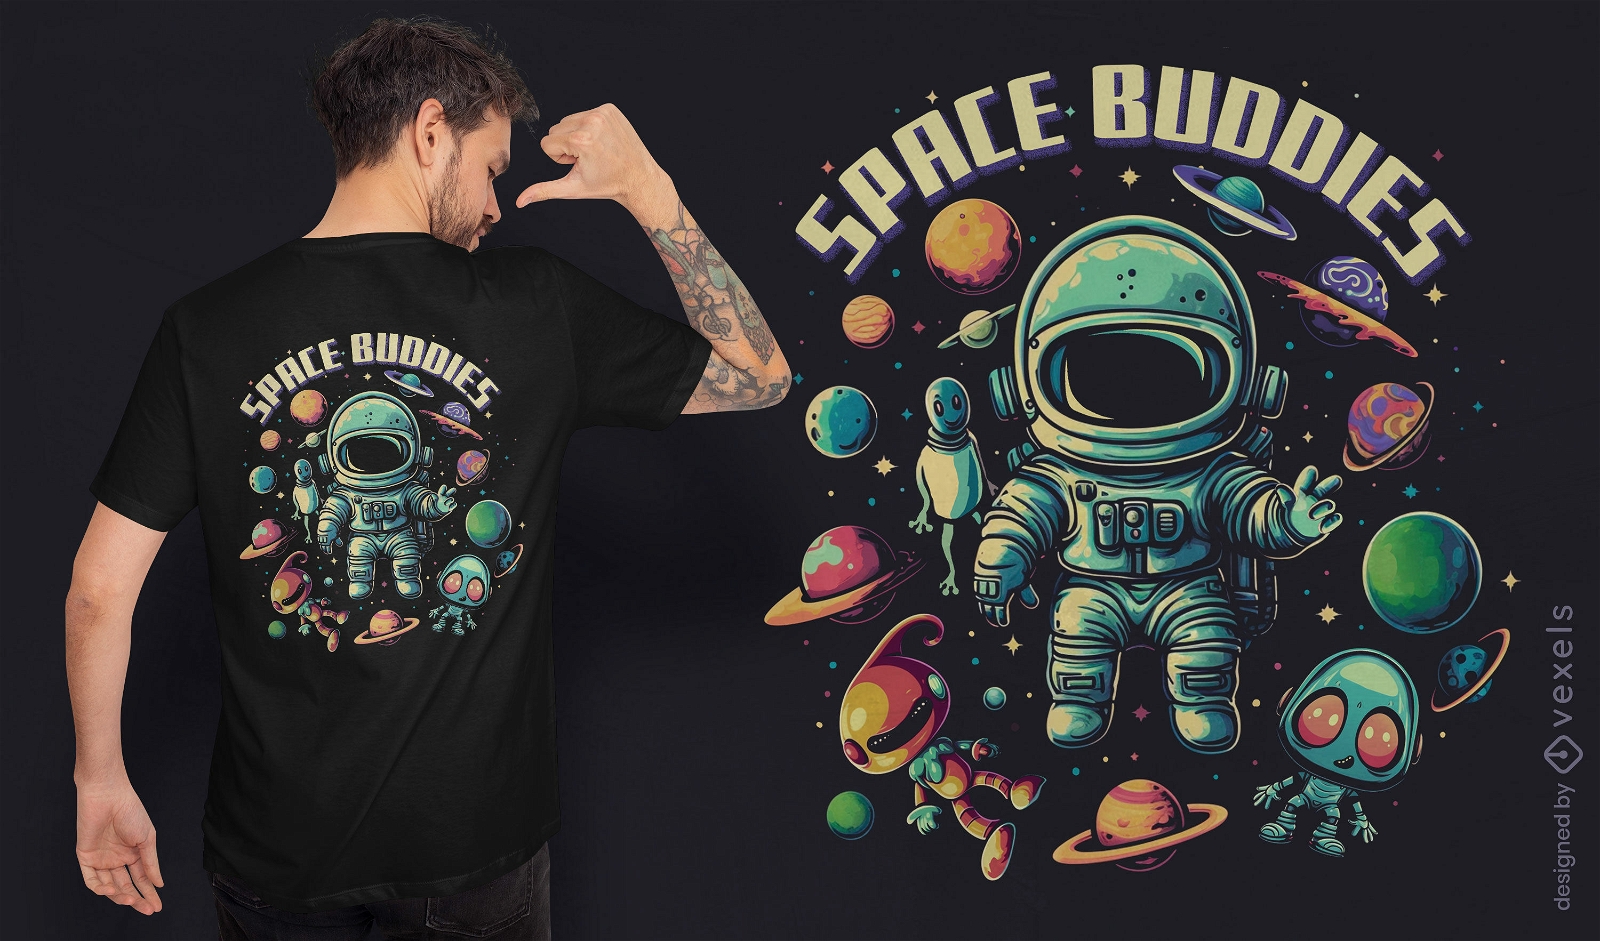
Space buddies t-shirt design
Choose a folder
All favorites
Create new
Save
Space buddies t-shirt design
Print ready
for Merch
Skeletal yurei ghost japanese t-shirt design
Choose a folder
All favorites
Create new
Save
Skeletal yurei ghost japanese t-shirt design
Editable text
Print ready
for Merch
Vintage mountain adventure t-shirt design
Choose a folder
All favorites
Create new
Save
Vintage mountain adventure t-shirt design
Print ready
for Merch
Gaming zombie hand t-shirt design
Choose a folder
All favorites
Create new
Save
Gaming zombie hand t-shirt design
Print ready
for Merch
Cute astronaut cat in space t-shirt design
Choose a folder
All favorites
Create new
Save
Cute astronaut cat in space t-shirt design
Editable text
Print ready
for Merch
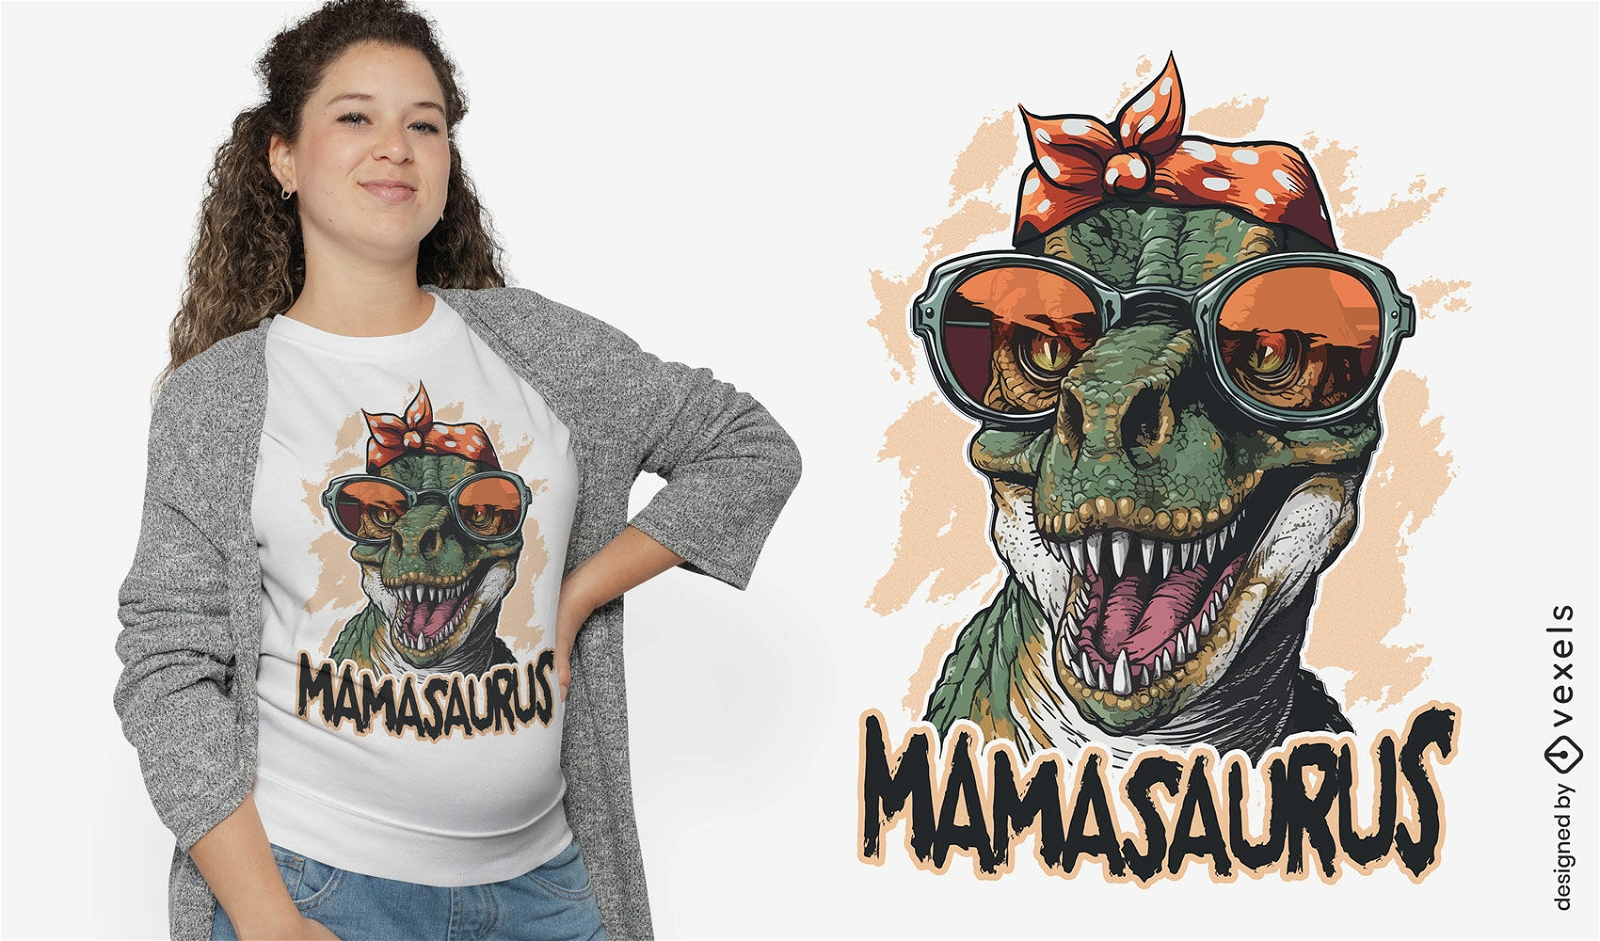
Cool mamasaurus t-shirt design
Choose a folder
All favorites
Create new
Save
Cool mamasaurus t-shirt design
Editable text
Print ready
for Merch
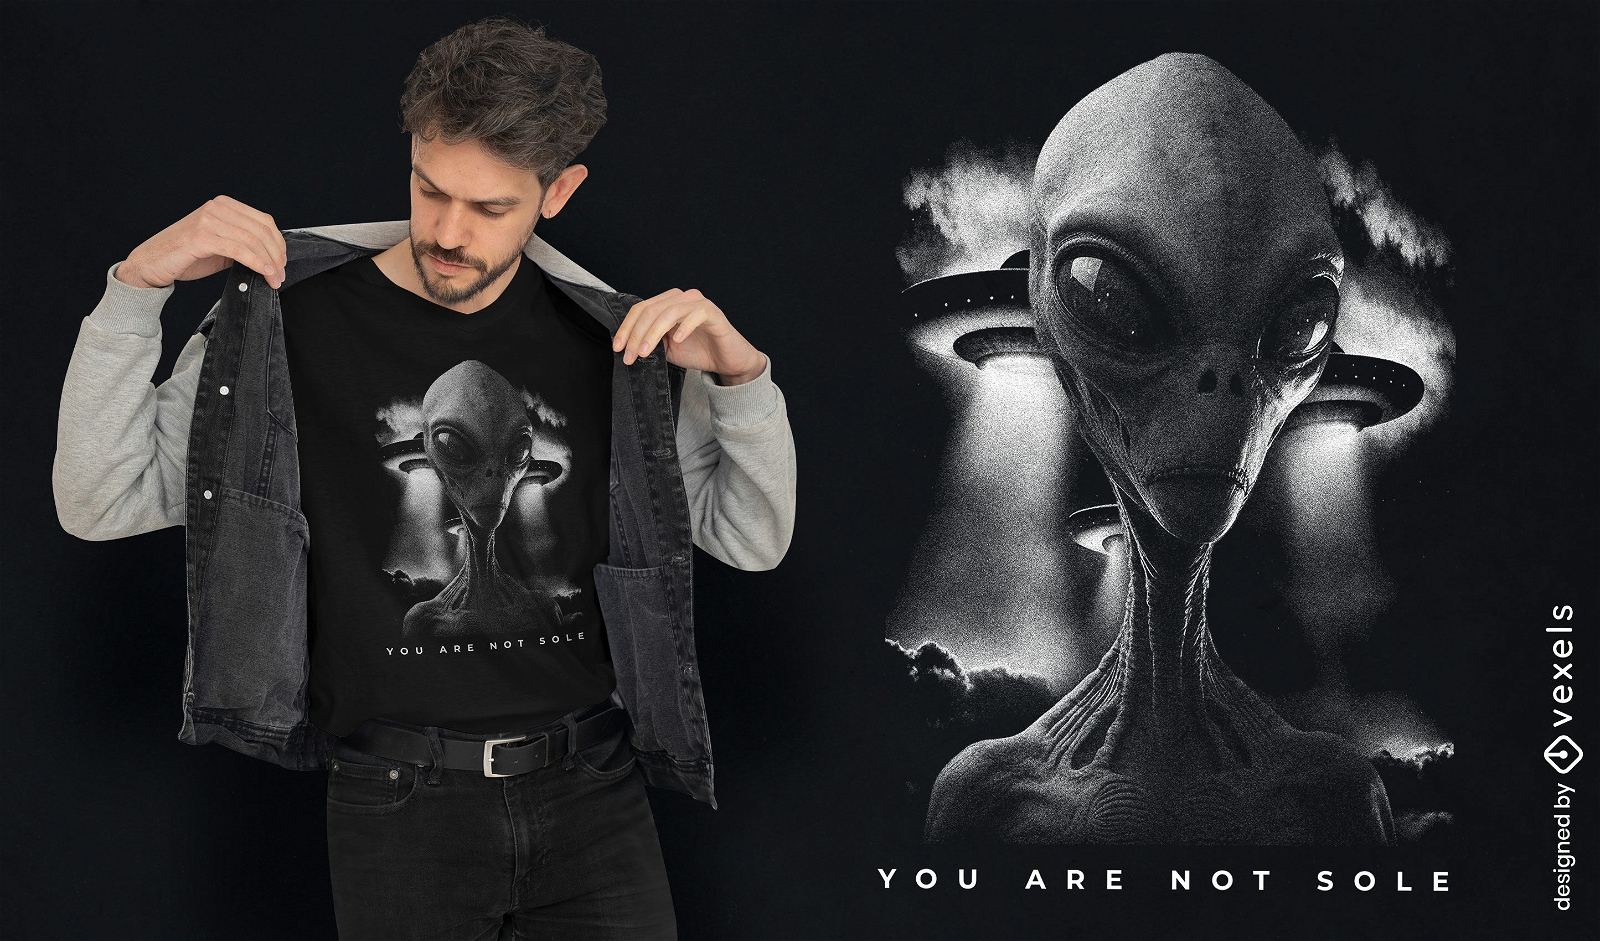
Alien encounter t-shirt design
Choose a folder
All favorites
Create new
Save
Alien encounter t-shirt design
Print ready
for Merch
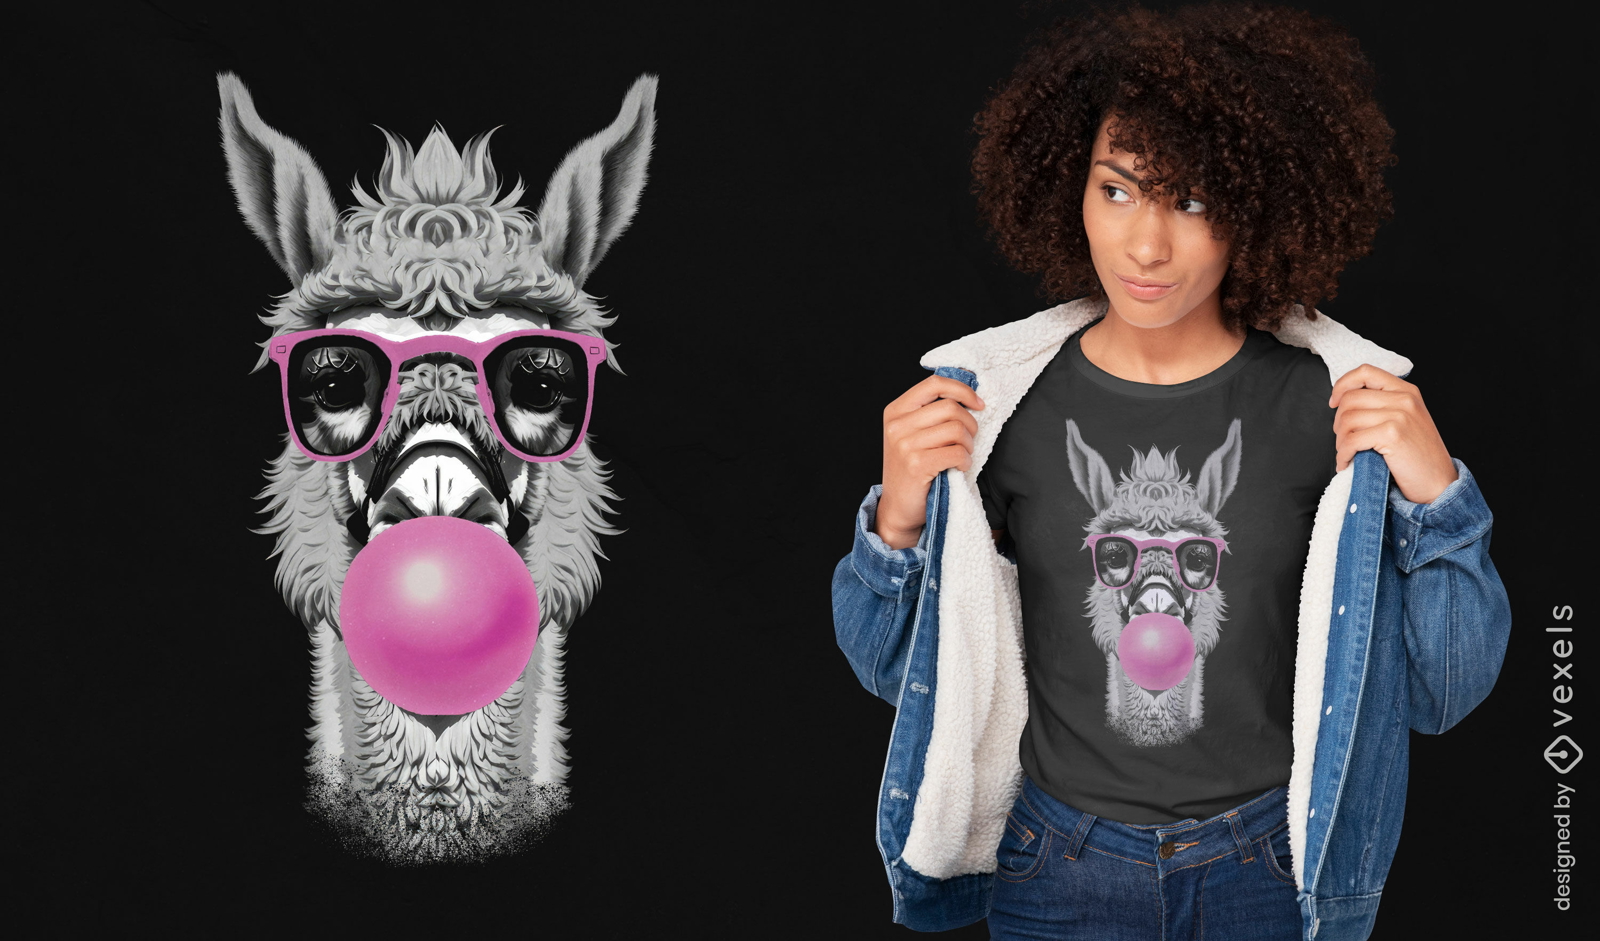
Hip llama with glasses t-shirt design
Choose a folder
All favorites
Create new
Save
Hip llama with glasses t-shirt design
Editable text
Print ready
for Merch
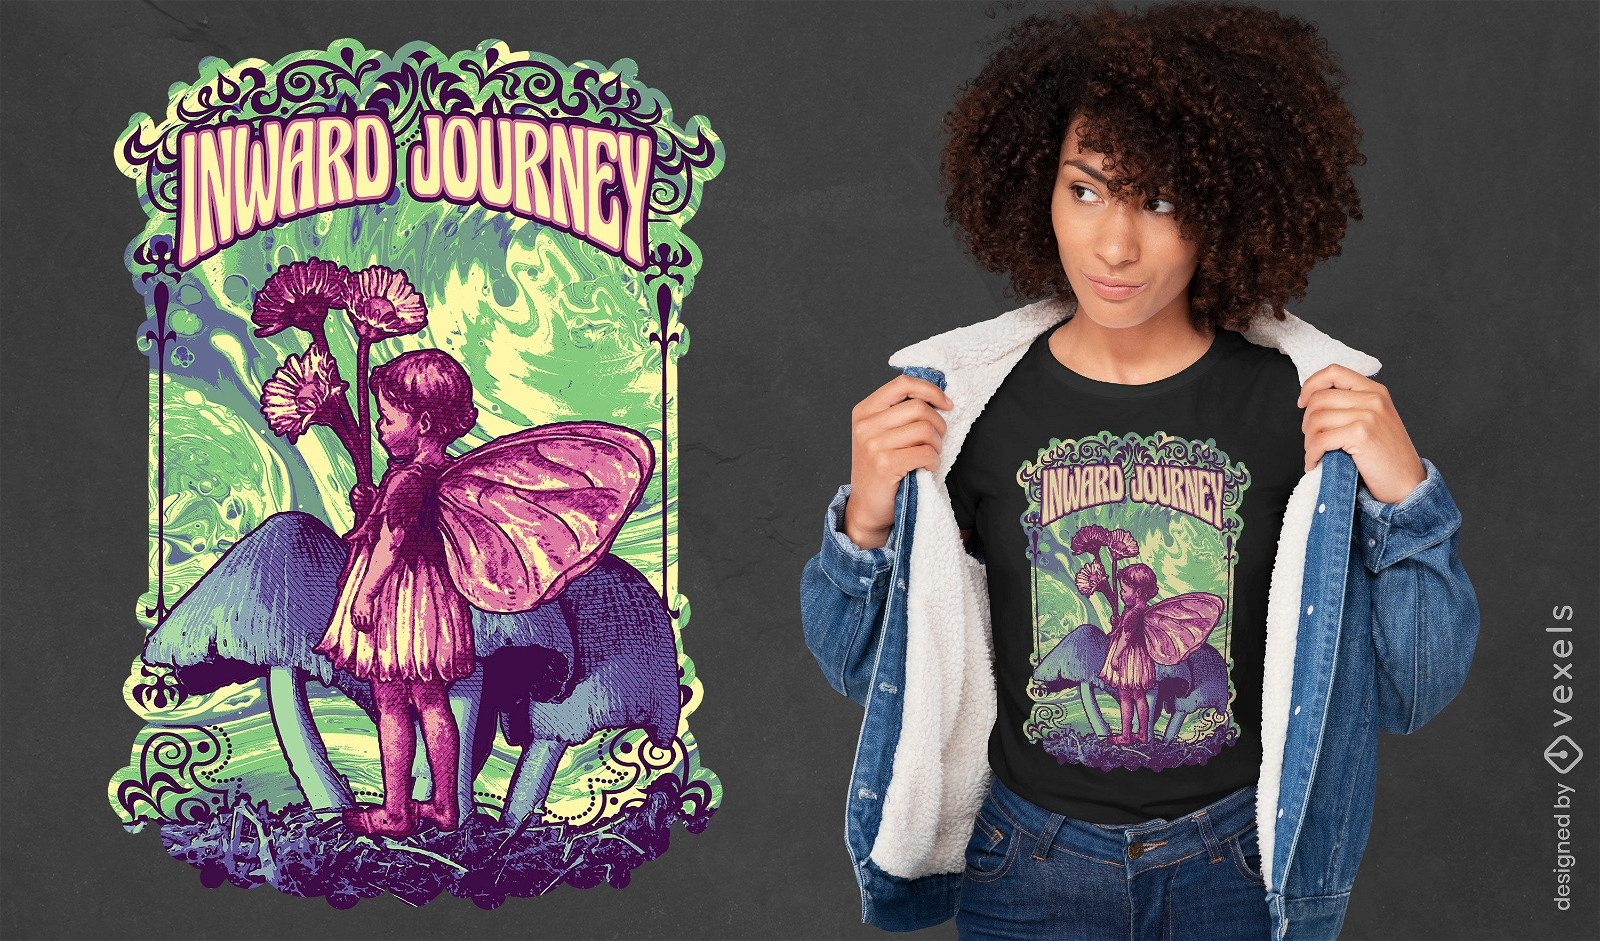
Little fairy on mushrooms psd t-shirt design
Choose a folder
All favorites
Create new
Save
Little fairy on mushrooms psd t-shirt design
Print ready
for Merch
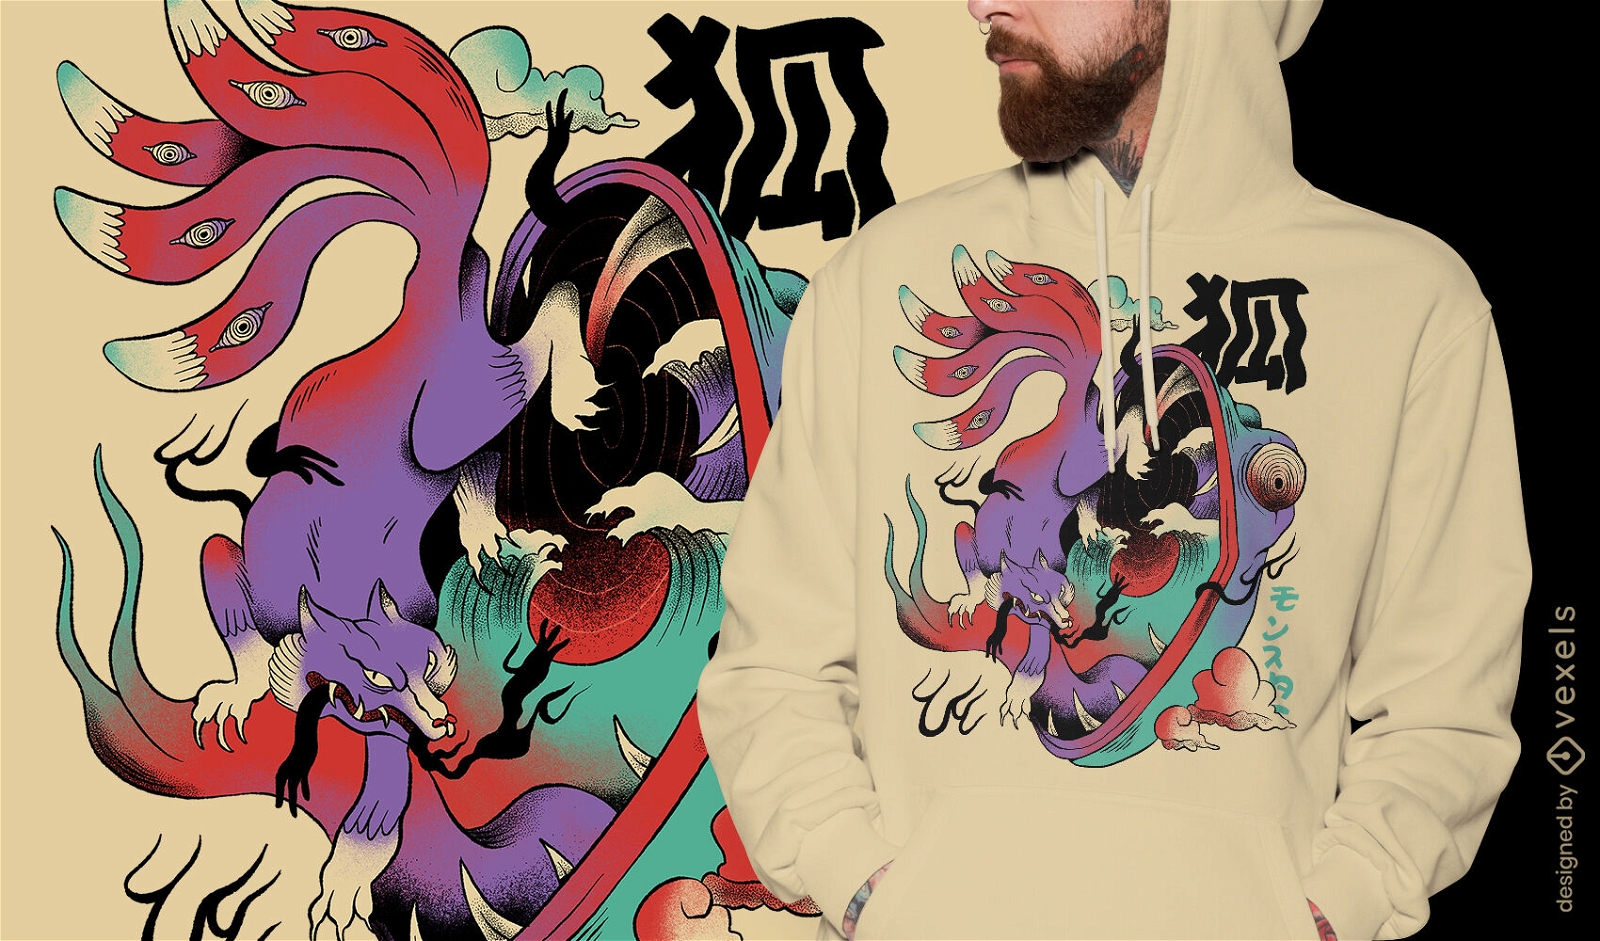
Fox in japanese psychedelic t-shirt design
Choose a folder
All favorites
Create new
Save
Fox in japanese psychedelic t-shirt design
Scalable PSD T-Shirt
for Merch
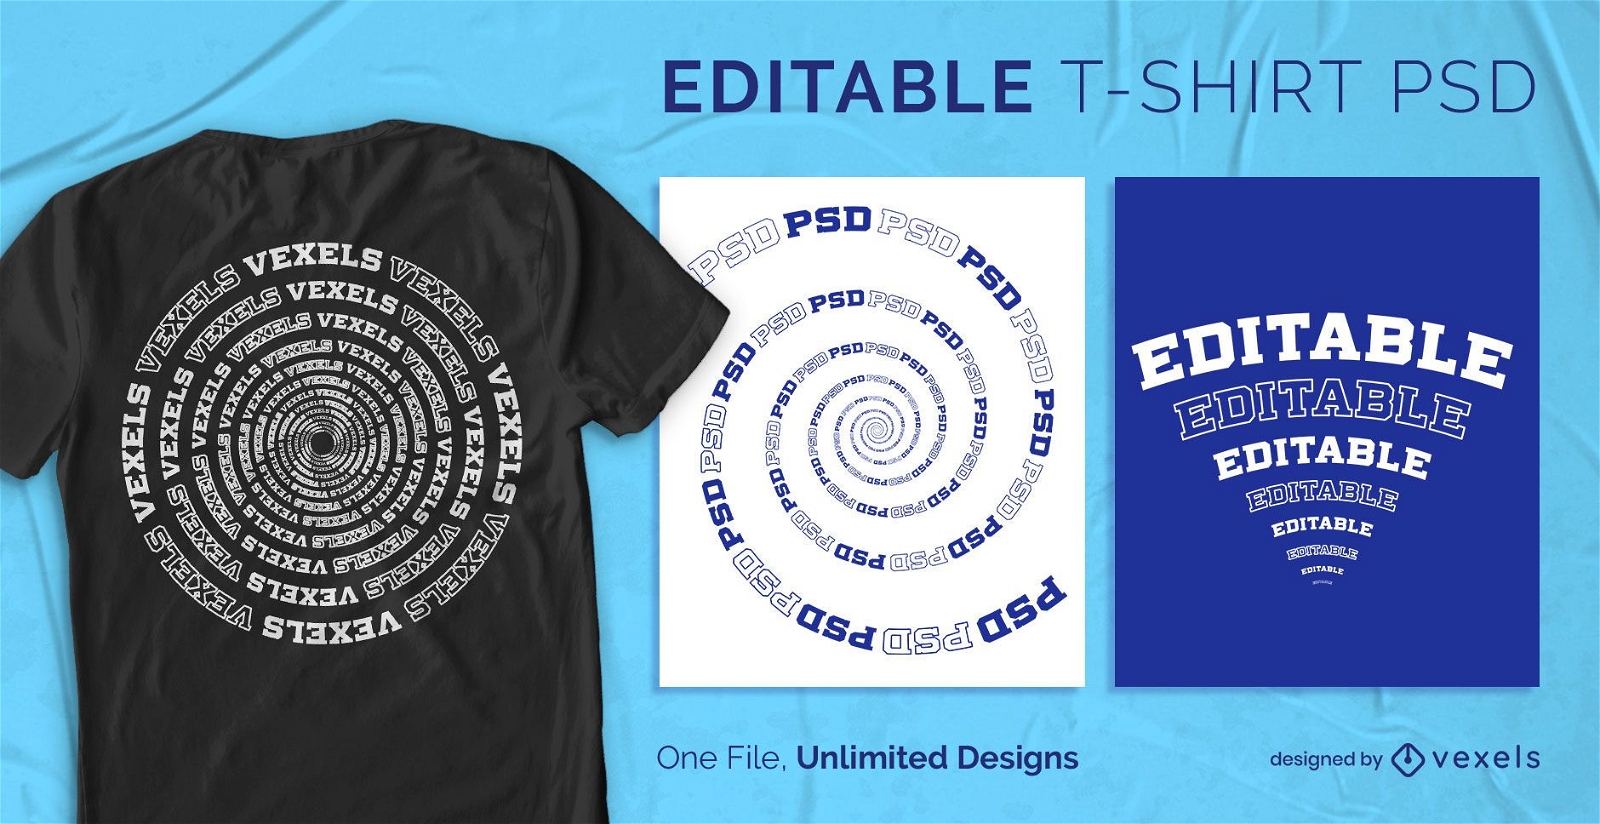
Spirals and curves scalable t-shirt psd
Choose a folder
All favorites
Create new
Save
Spirals and curves scalable t-shirt psd
Editable text
Print ready
for Merch
Promoted grandpa again t-shirt design
Choose a folder
All favorites
Create new
Save
Promoted grandpa again t-shirt design
Print ready
for Merch
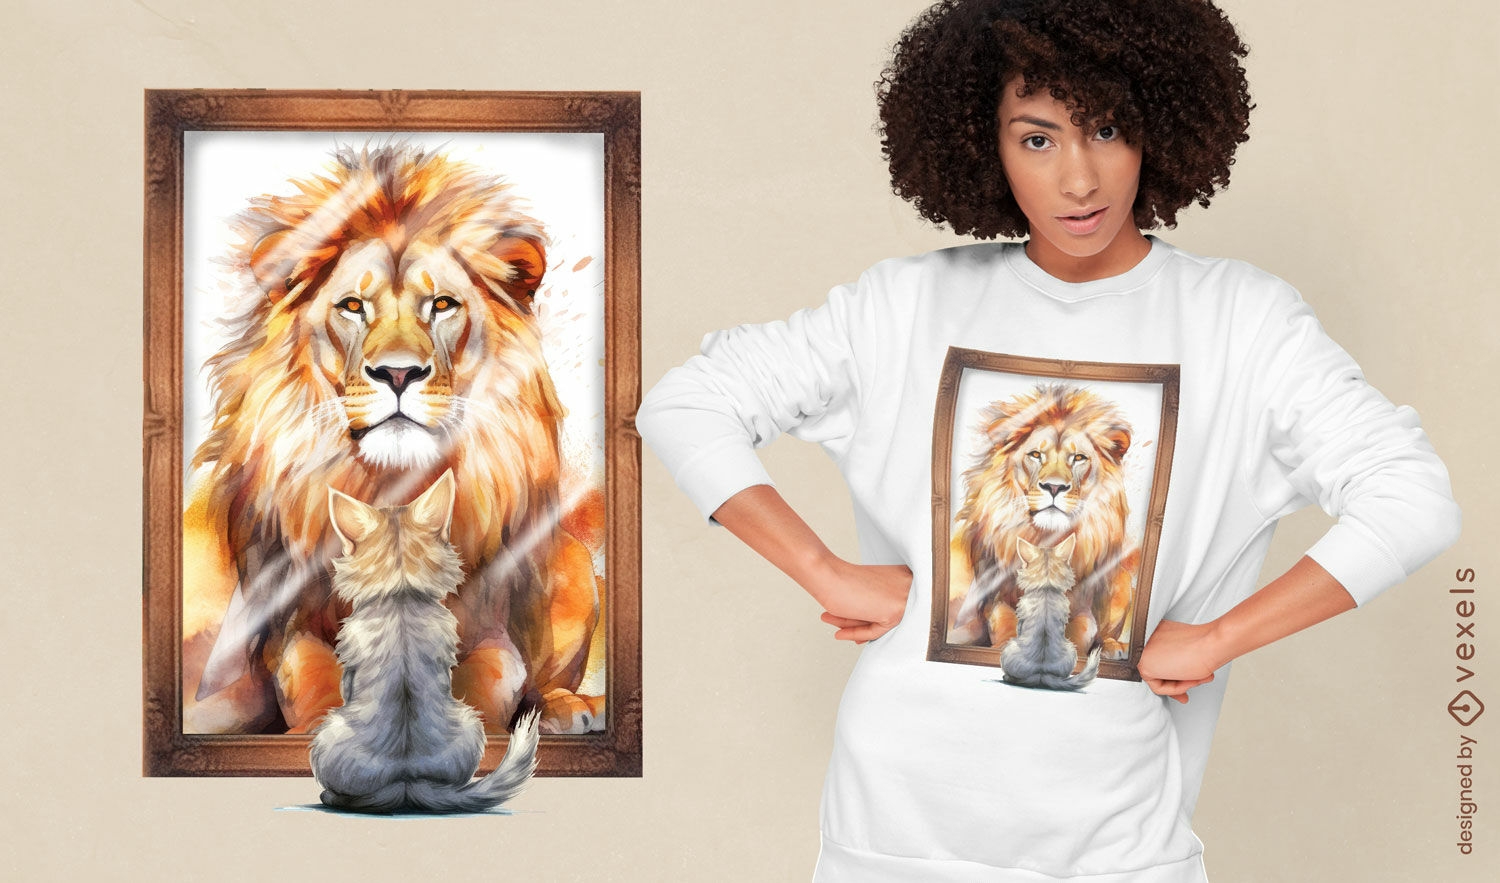
Cat and lion transformation t-shirt design
Choose a folder
All favorites
Create new
Save
Cat and lion transformation t-shirt design
Editable text
Print ready
for Merch
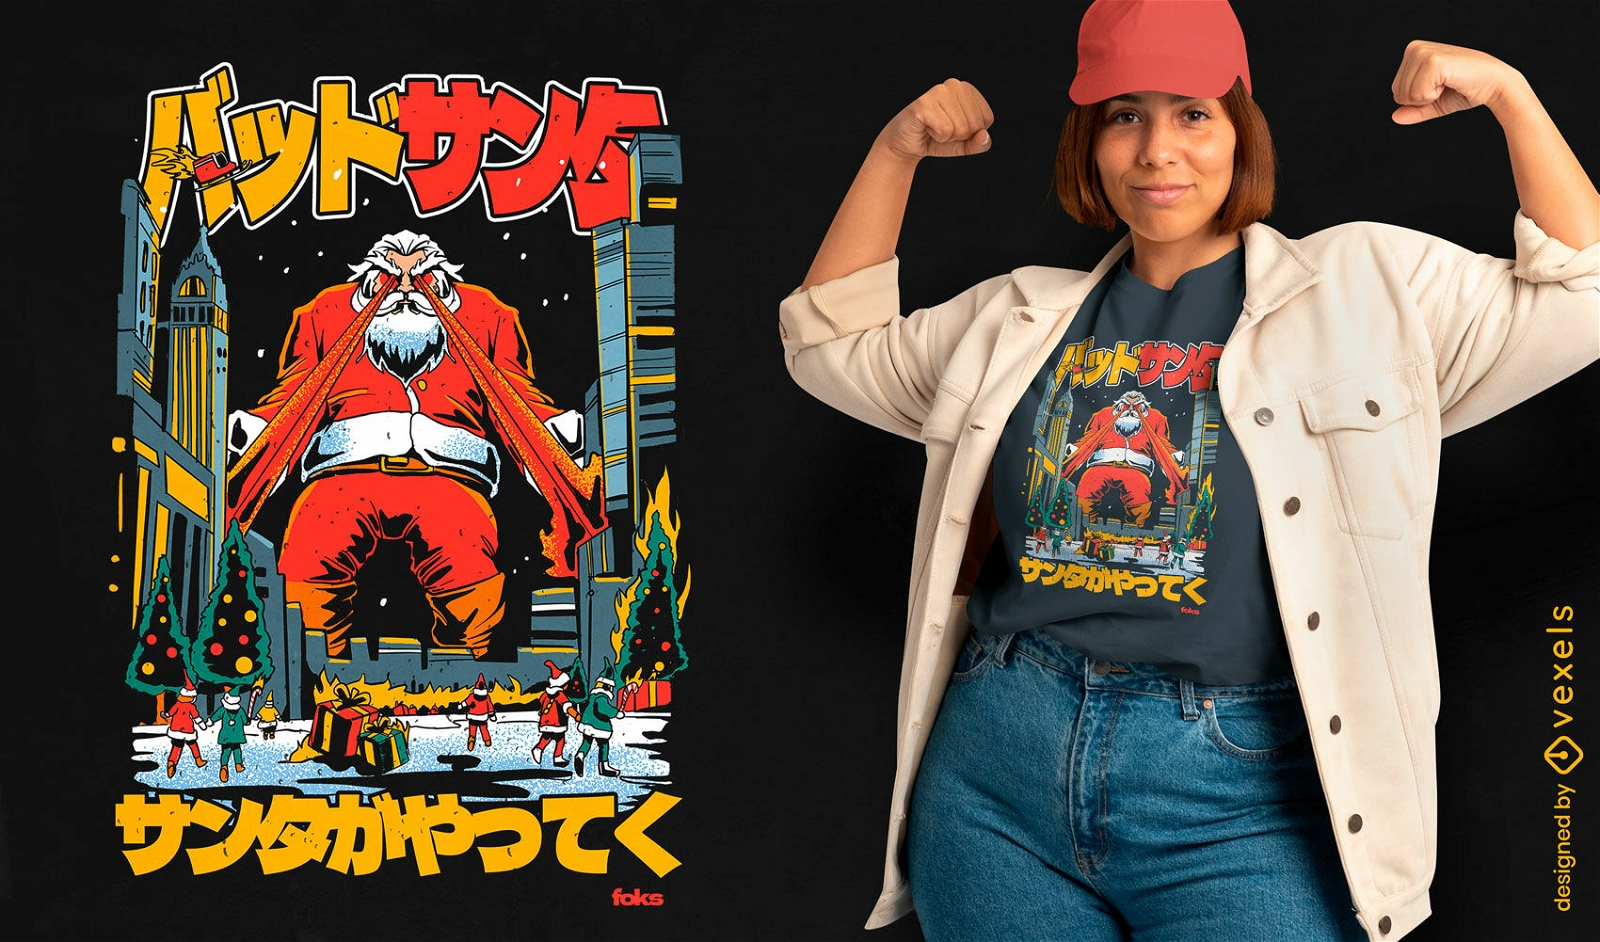
Santa Claus kanji lasers t-shirt design
Choose a folder
All favorites
Create new
Save
Santa Claus kanji lasers t-shirt design
Boost Your Business
With The Leading Graphic Platform For Merch.
SEE PLANS
Next
of 85
prev page
next page