Design Library
Explore Designs
New Merch Designs
Trending Merch Designs
Vectors
PNGs & SVGs
Mockups
T-Shirts
T-Shirt PSD Templates
KDP Designs
Phone Cases
Pillows
Tote Bags
Posters
Mugs
Design Tools
Designer
New!
T-shirt Maker
Mockup Generator
Quote Generator
Logo Maker
Resources
Merch Digest
Blog
Help Center
Creators Program
Learn About Merch
Changelog
API Access
Pricing
Loading...
Sign Up
Login
All
grafico
Design Library
Explore Designs
New Merch Designs
Trending Merch Designs
Vectors
PNGs & SVGs
Mockups
T-Shirts
T-Shirt PSD Templates
KDP Designs
Phone Cases
Pillows
Tote Bags
Posters
Mugs
Design Tools
Designer
New!
T-shirt Maker
Mockup Generator
Quote Generator
Logo Maker
Resources
Merch Digest
Blog
Help Center
Creators Program
Learn About Merch
Changelog
API Access
PLANS
All
grafico
40818 grafico designs graphics for t-shirt and print on demand merch
Download grafico t-shirt designs and other merch graphics like book covers, phone cases, tote bags and more.
Sort by
Most relevant
Sponsored results by
Get 15% off with code: VEXELS15
Show more
Print ready
for Merch
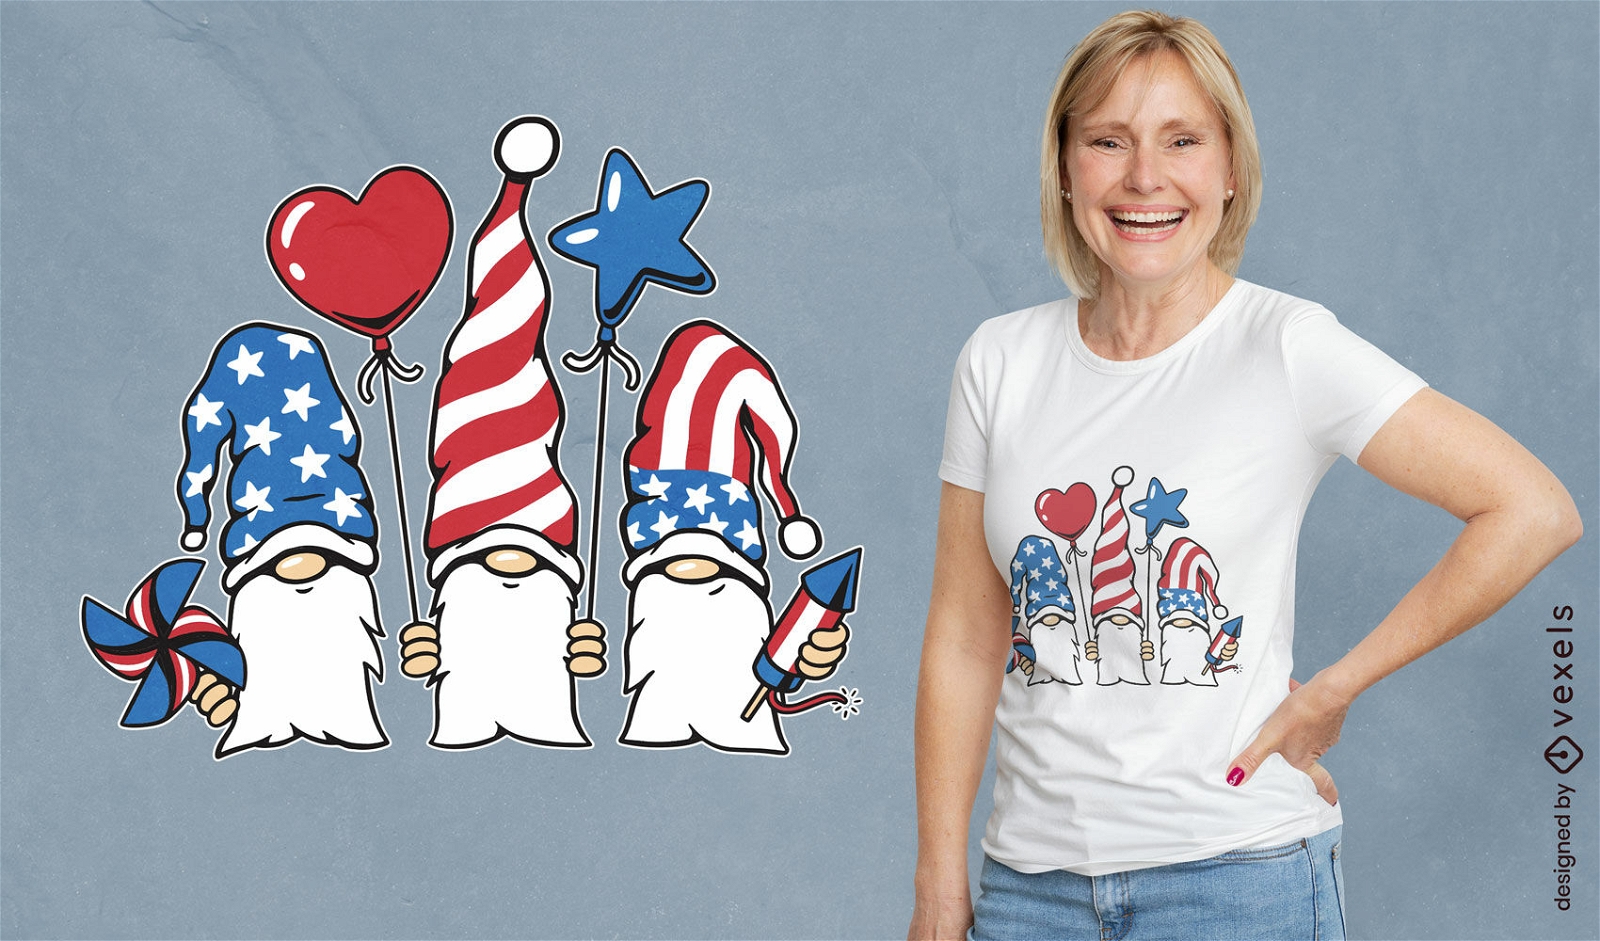
Independence day gnomes t-shirt design
Choose a folder
All favorites
Create new
Save
Independence day gnomes t-shirt design
Print ready
for Merch
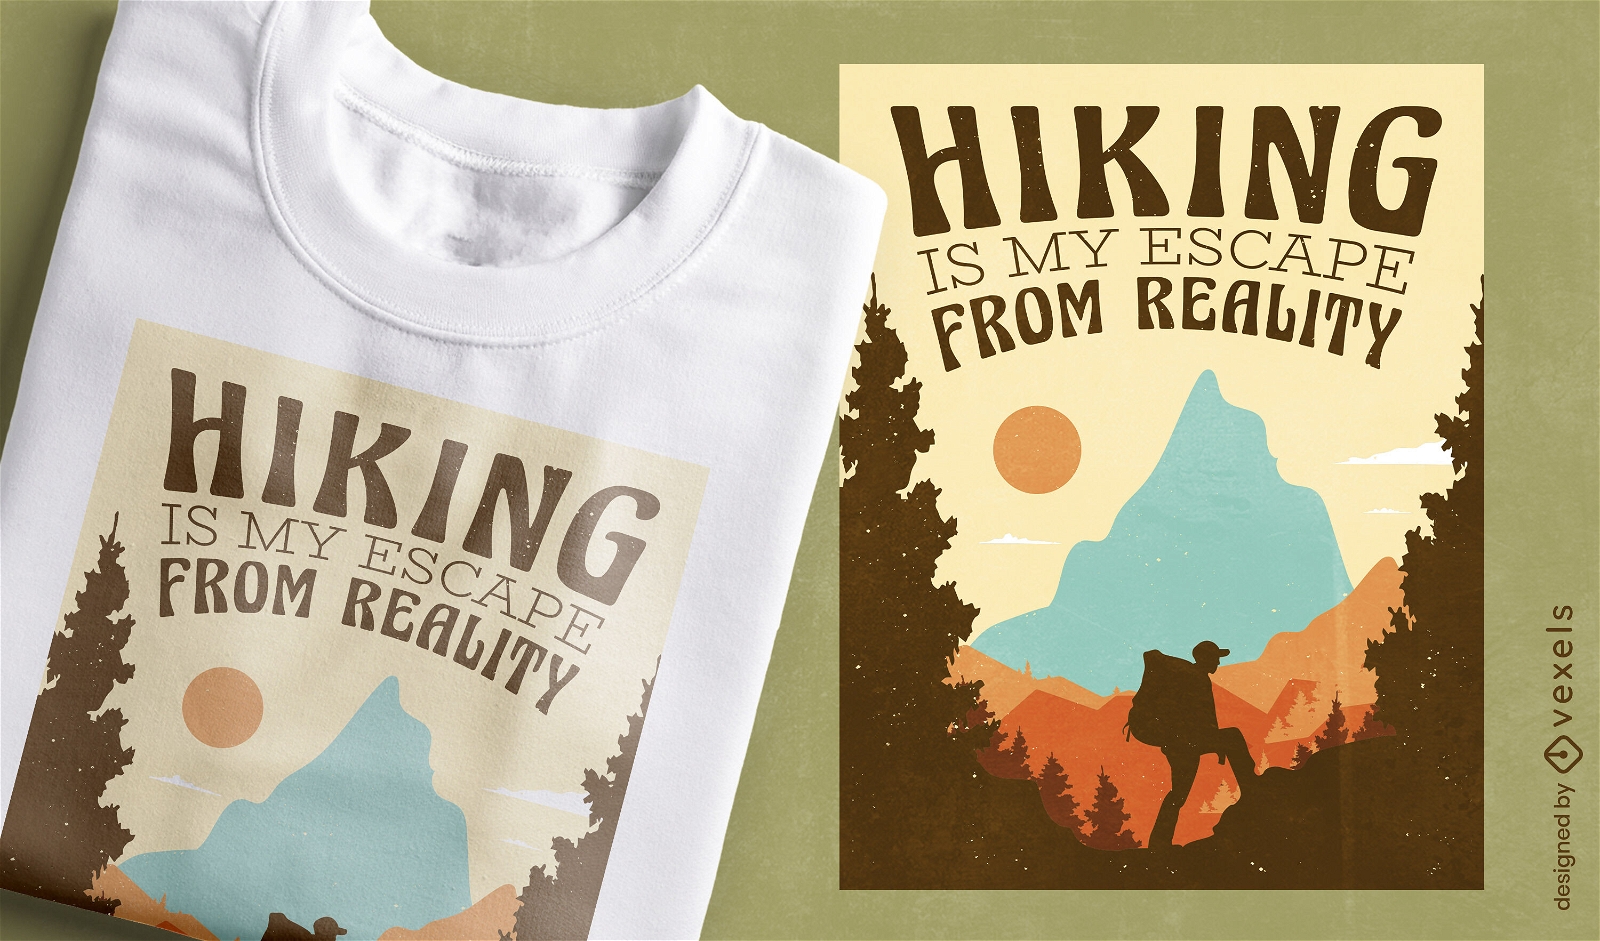
Hiking is my escape from reality t-shirt design
Choose a folder
All favorites
Create new
Save
Hiking is my escape from reality t-shirt design
Print ready
for Merch
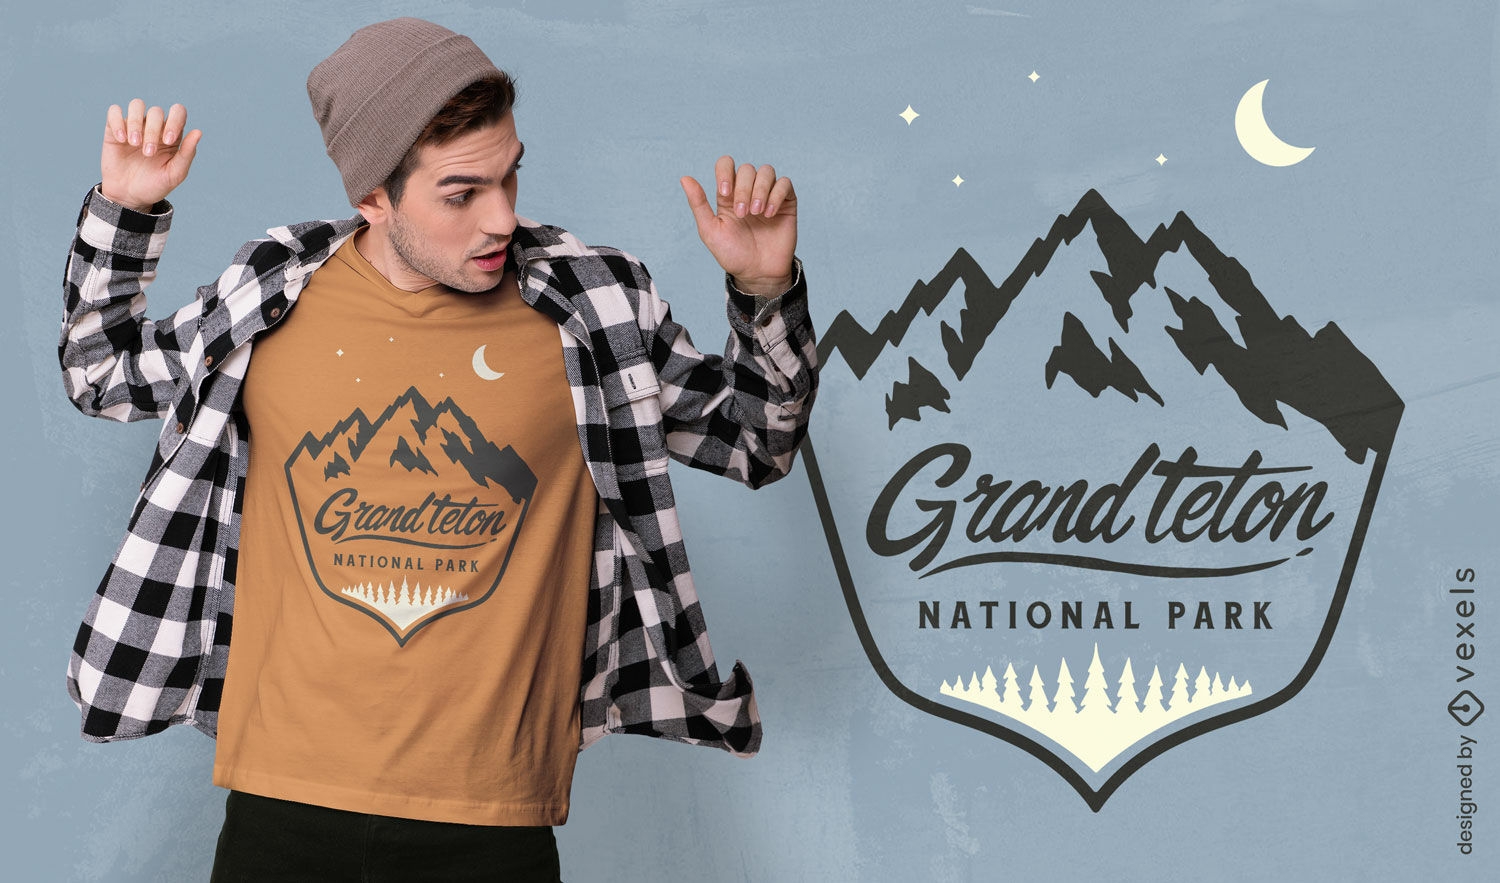
Grand teton national mountains t-shirt design
Choose a folder
All favorites
Create new
Save
Grand teton national mountains t-shirt design
Print ready
for Merch
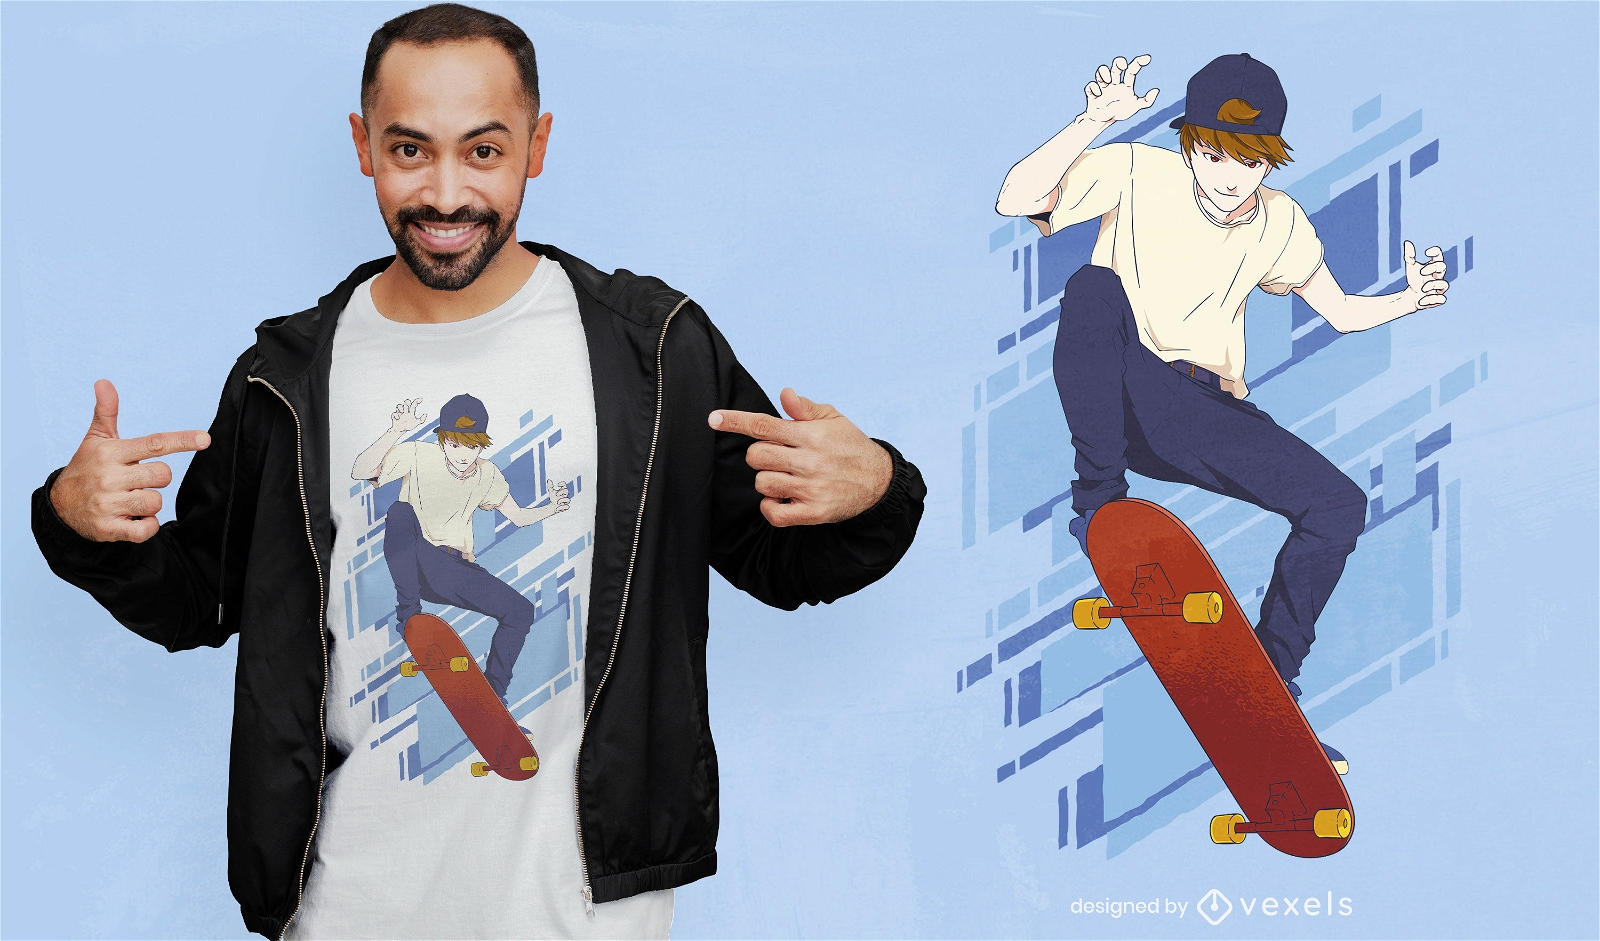
Anime skater boy t-shirt design
Choose a folder
All favorites
Create new
Save
Anime skater boy t-shirt design
Print ready
for Merch
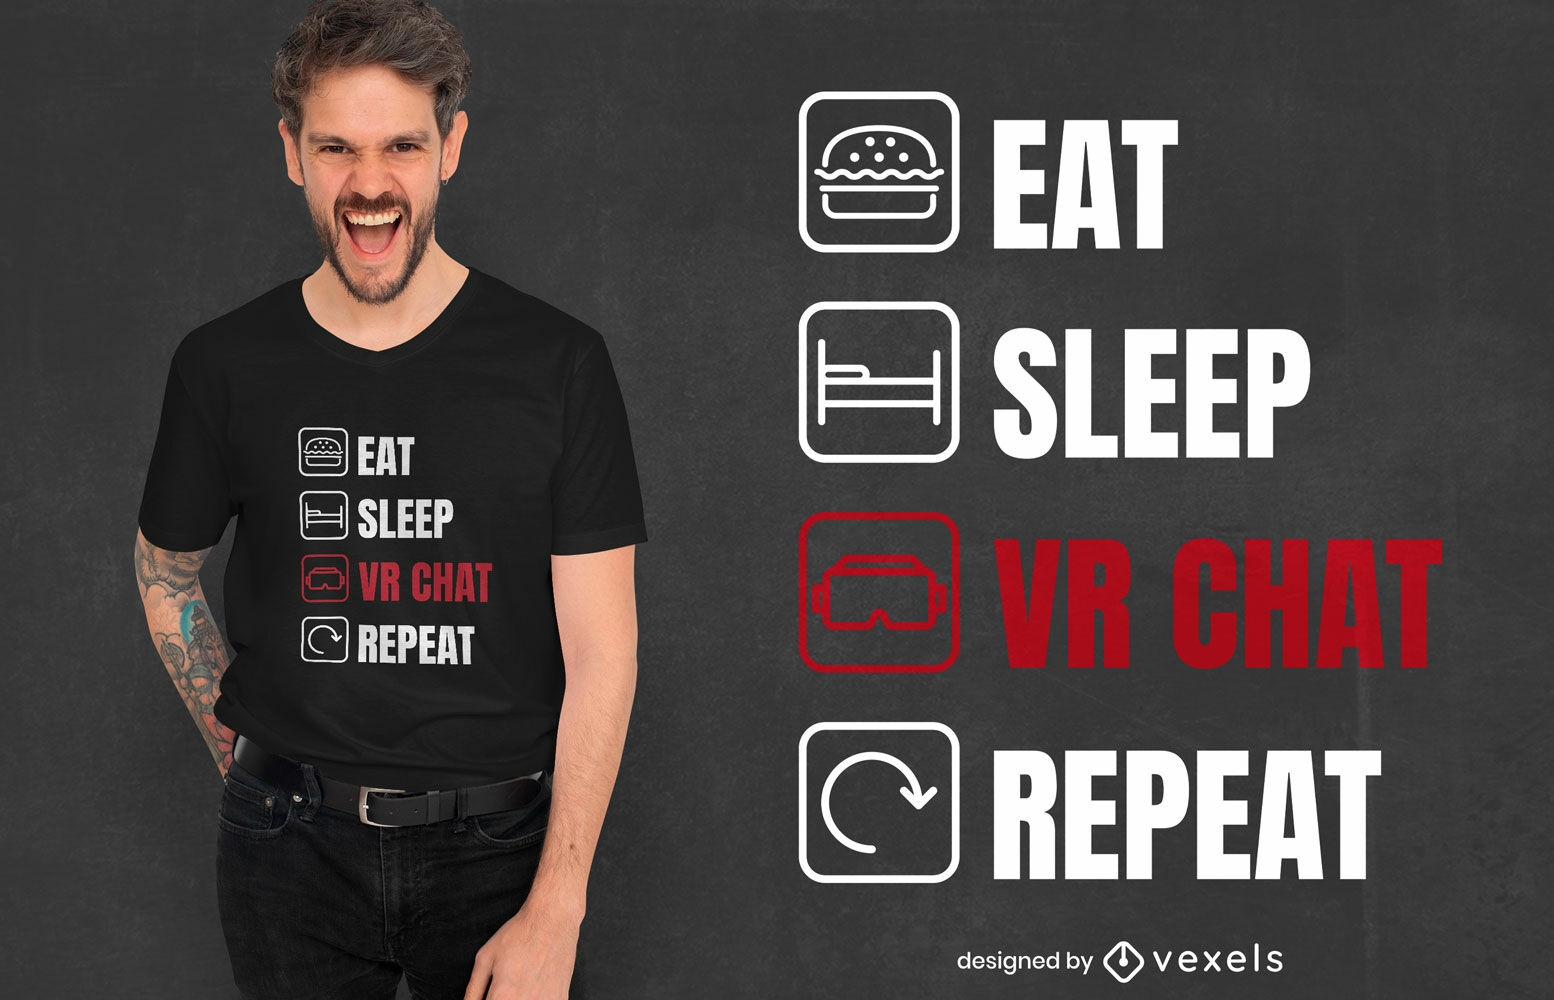
Eat sleep VR chat repeat t-shirt design
Choose a folder
All favorites
Create new
Save
Eat sleep VR chat repeat t-shirt design
Print ready
for Merch
Wild vibes urban t-rex t-shirt design
Choose a folder
All favorites
Create new
Save
Wild vibes urban t-rex t-shirt design
Print ready
for Merch
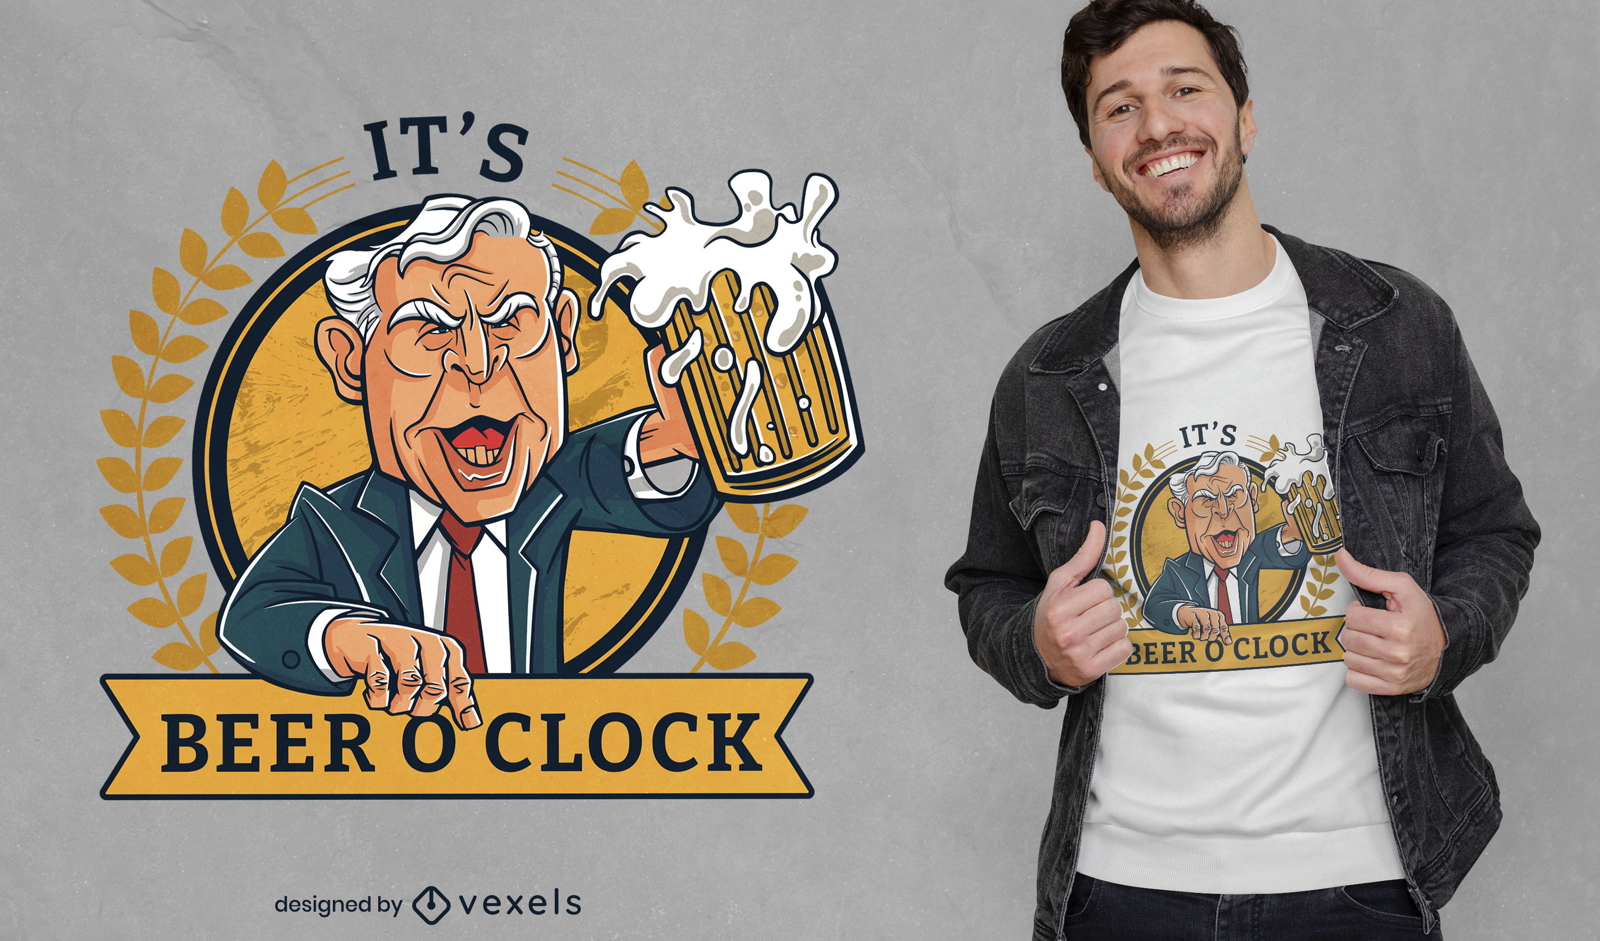
Beer o' clock man t-shirt design
Choose a folder
All favorites
Create new
Save
Beer o' clock man t-shirt design
Print ready
for Merch
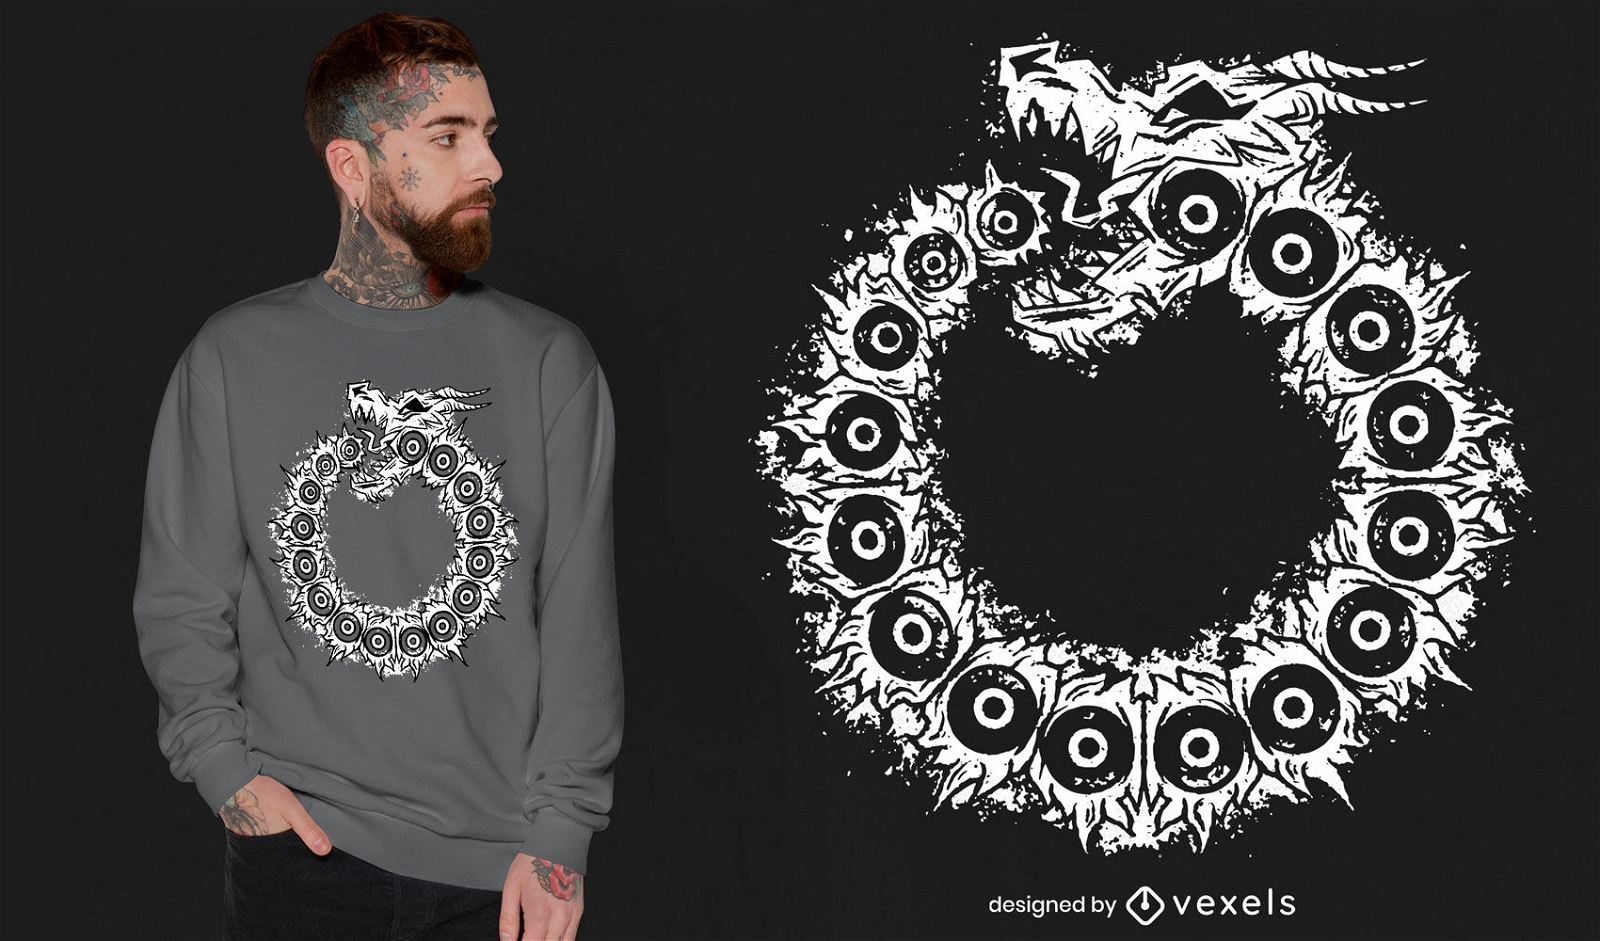
Grunge dragon symbol t-shirt design
Choose a folder
All favorites
Create new
Save
Grunge dragon symbol t-shirt design
Print ready
for Merch
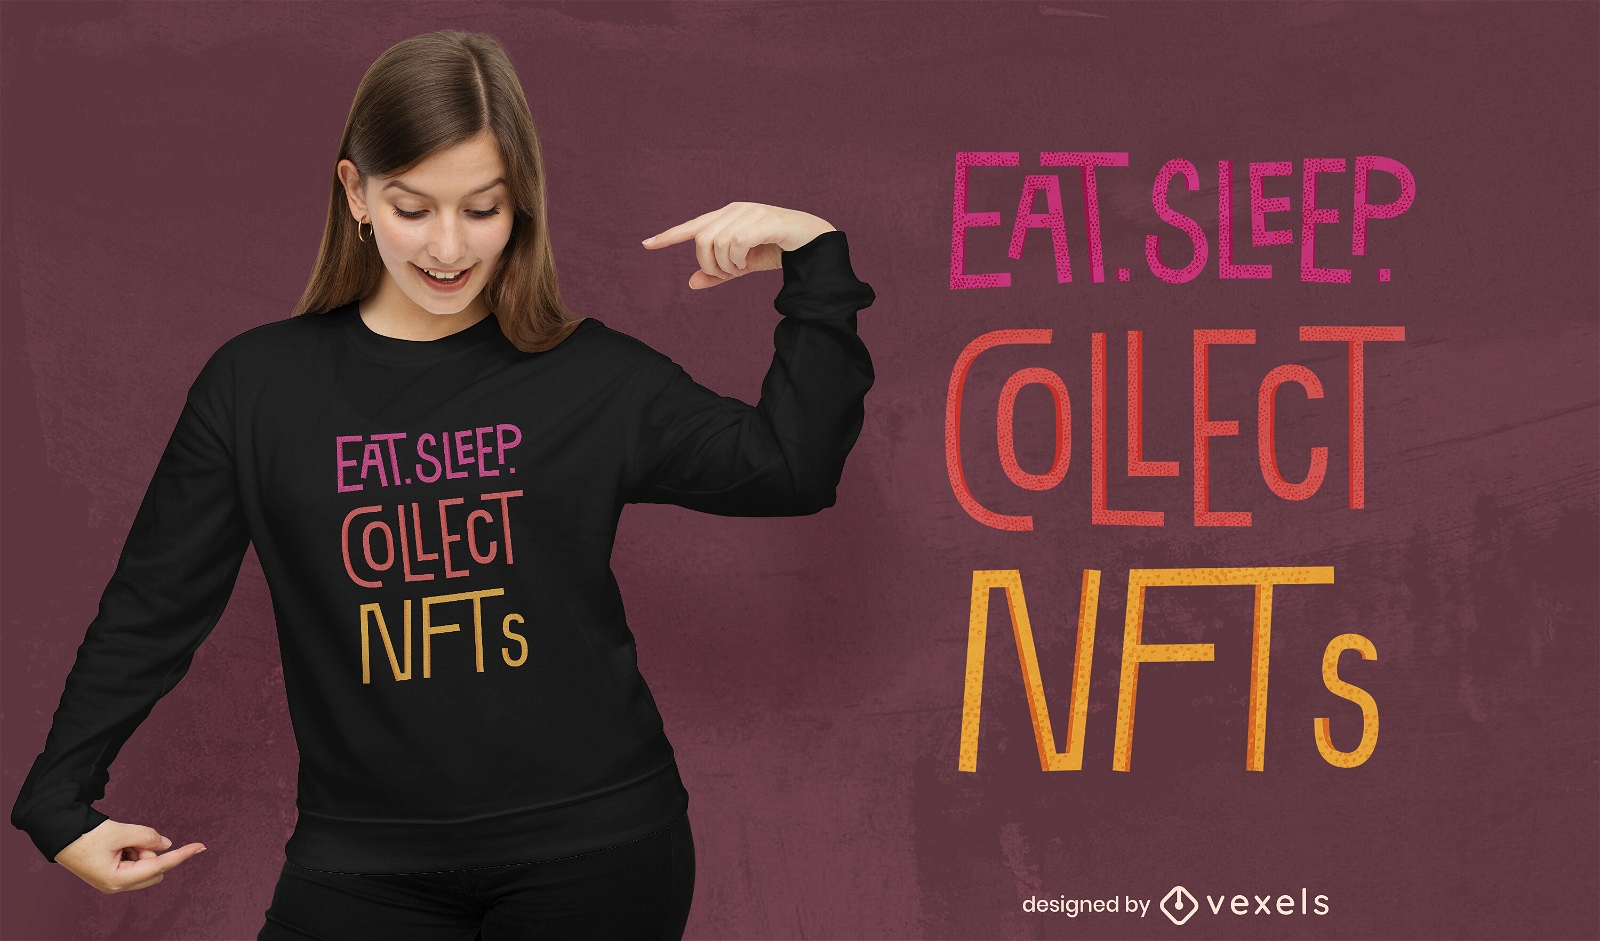
Eat sleep and collect nft t-shirt design
Choose a folder
All favorites
Create new
Save
Eat sleep and collect nft t-shirt design
Print ready
for Merch
Flaming darts t-shirt design
Choose a folder
All favorites
Create new
Save
Flaming darts t-shirt design
Print ready
for Merch
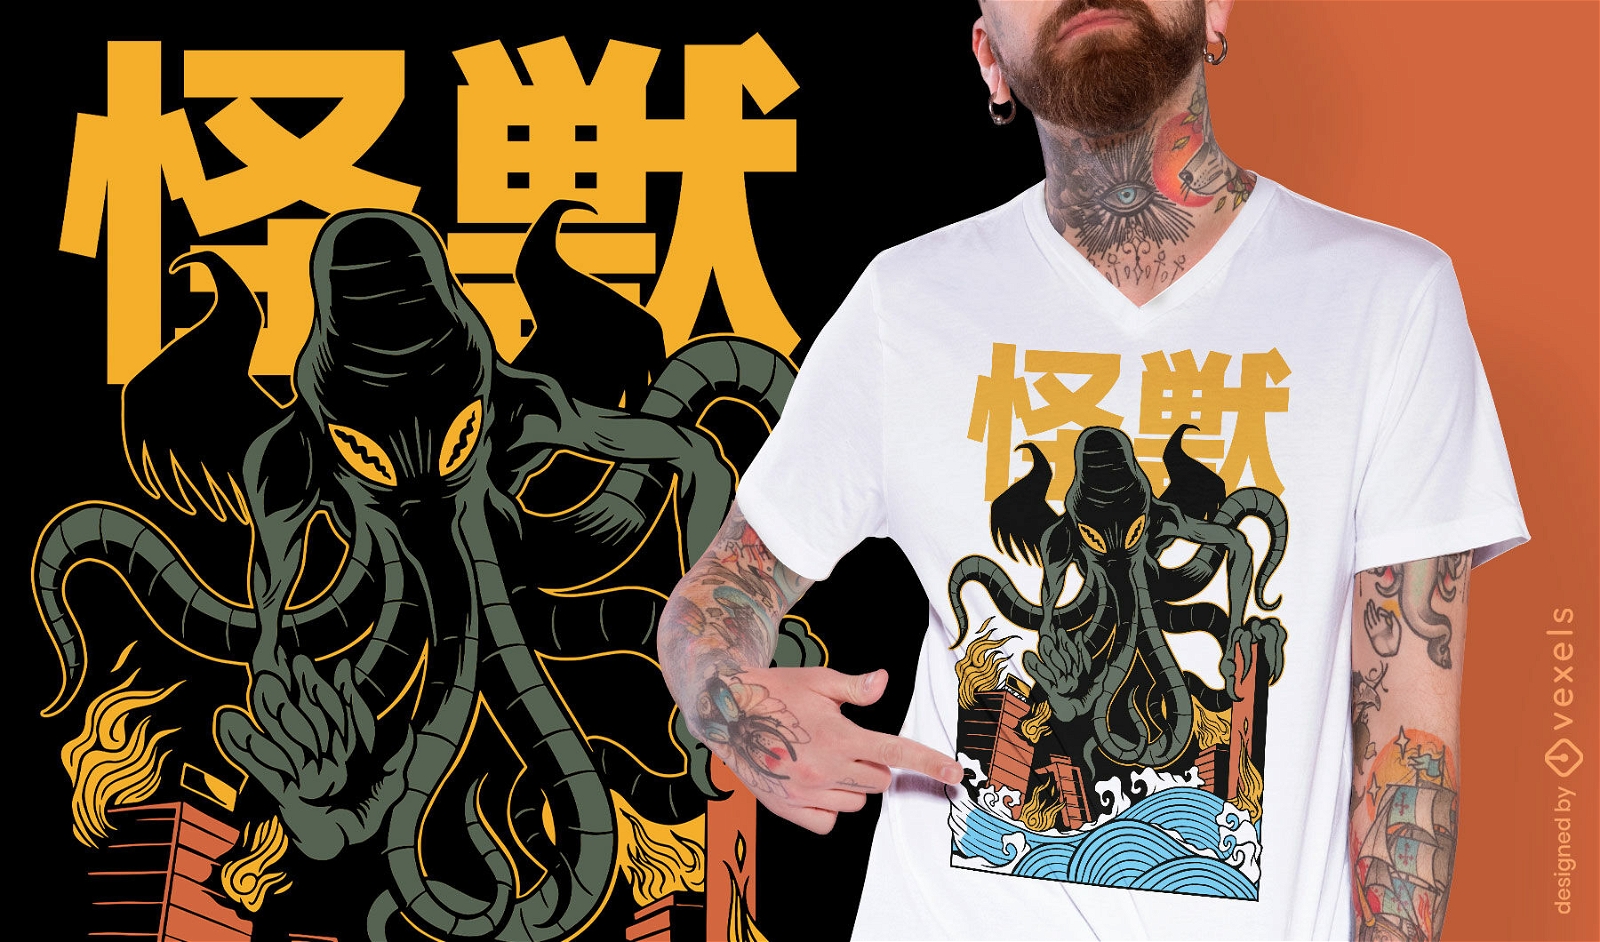
Japanese kaiju Cthulhu T-shirt Design
Choose a folder
All favorites
Create new
Save
Japanese kaiju Cthulhu T-shirt Design
Print ready
for Merch
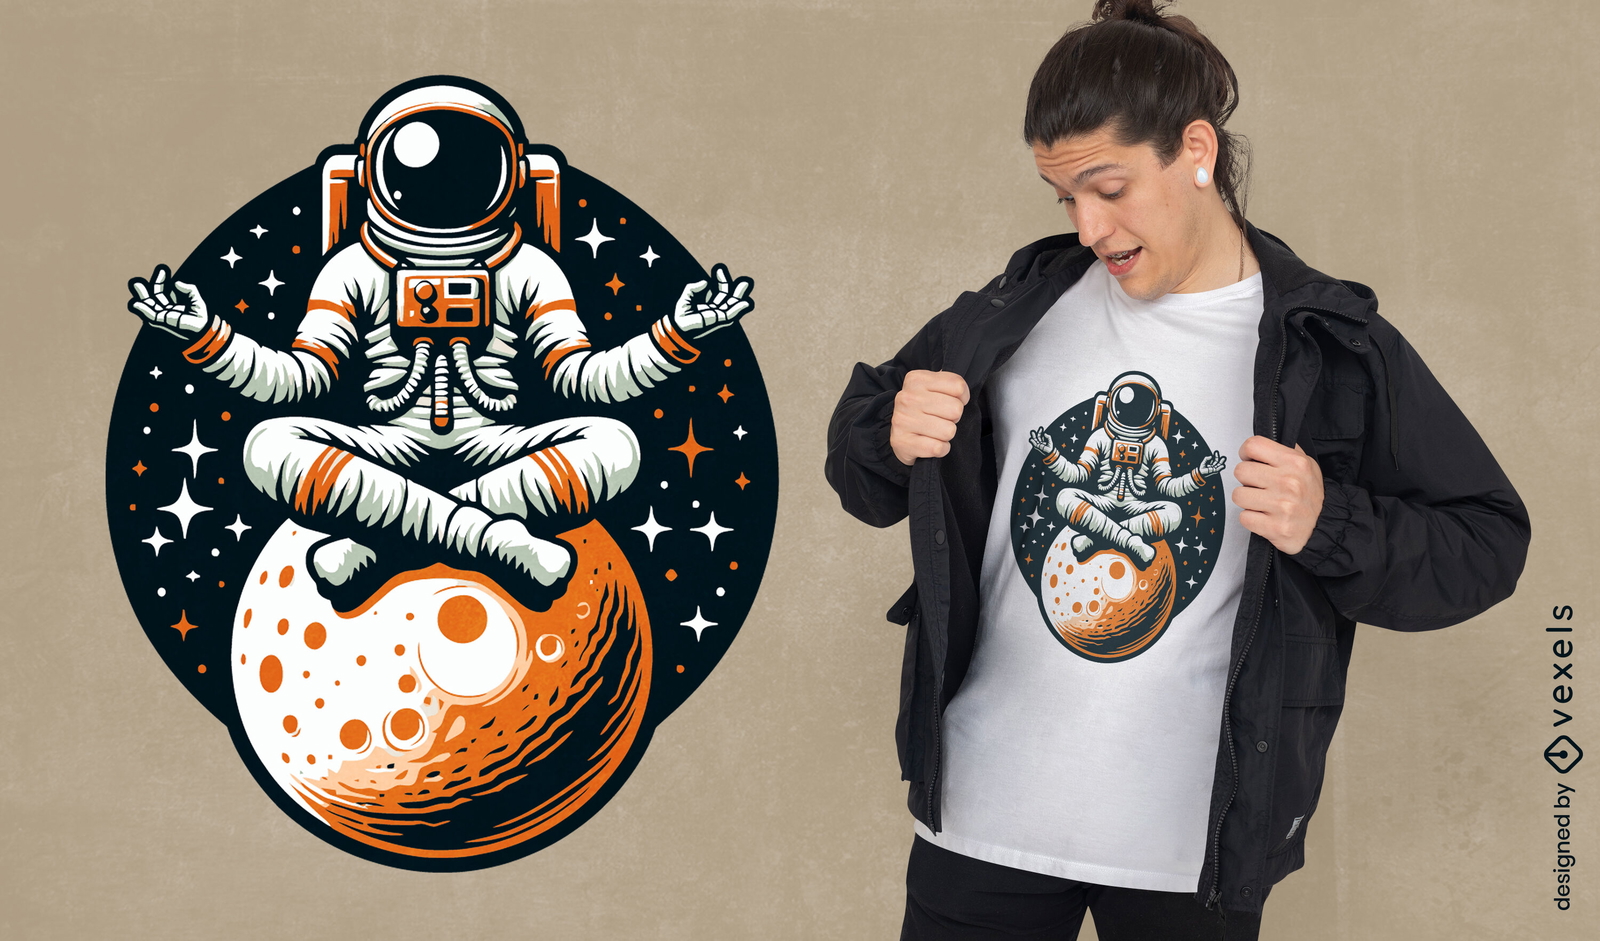
Astronaut yoga t-shirt design
Choose a folder
All favorites
Create new
Save
Astronaut yoga t-shirt design
Editable text
Print ready
for Merch
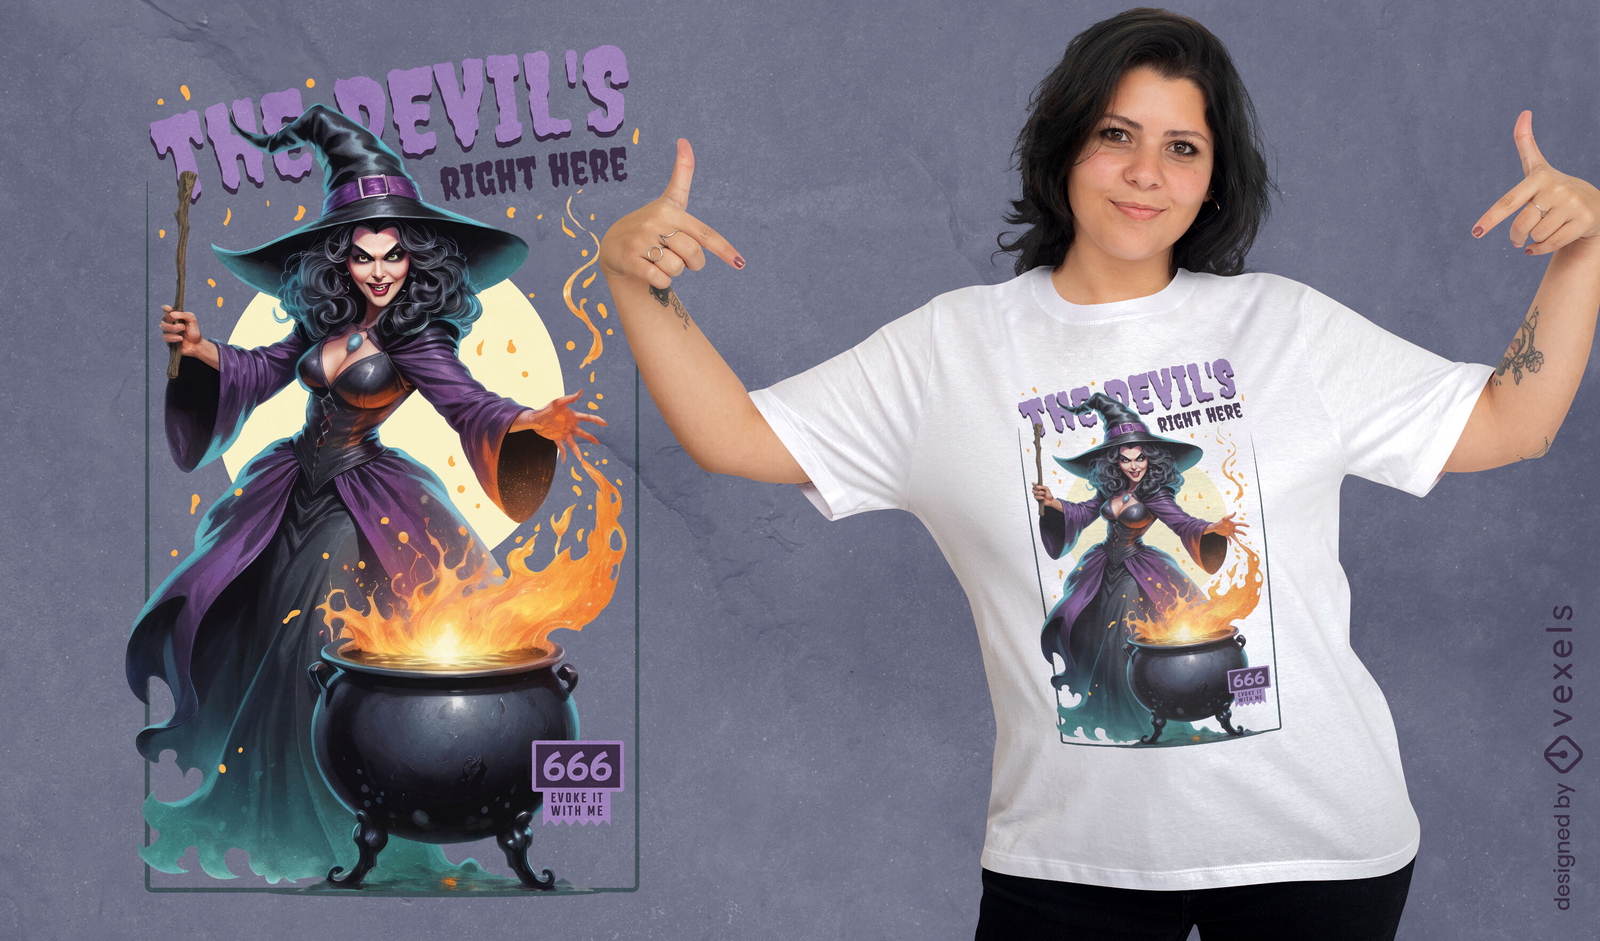
The Devil's right here t-shirt design
Choose a folder
All favorites
Create new
Save
The Devil's right here t-shirt design
Print ready
for Merch
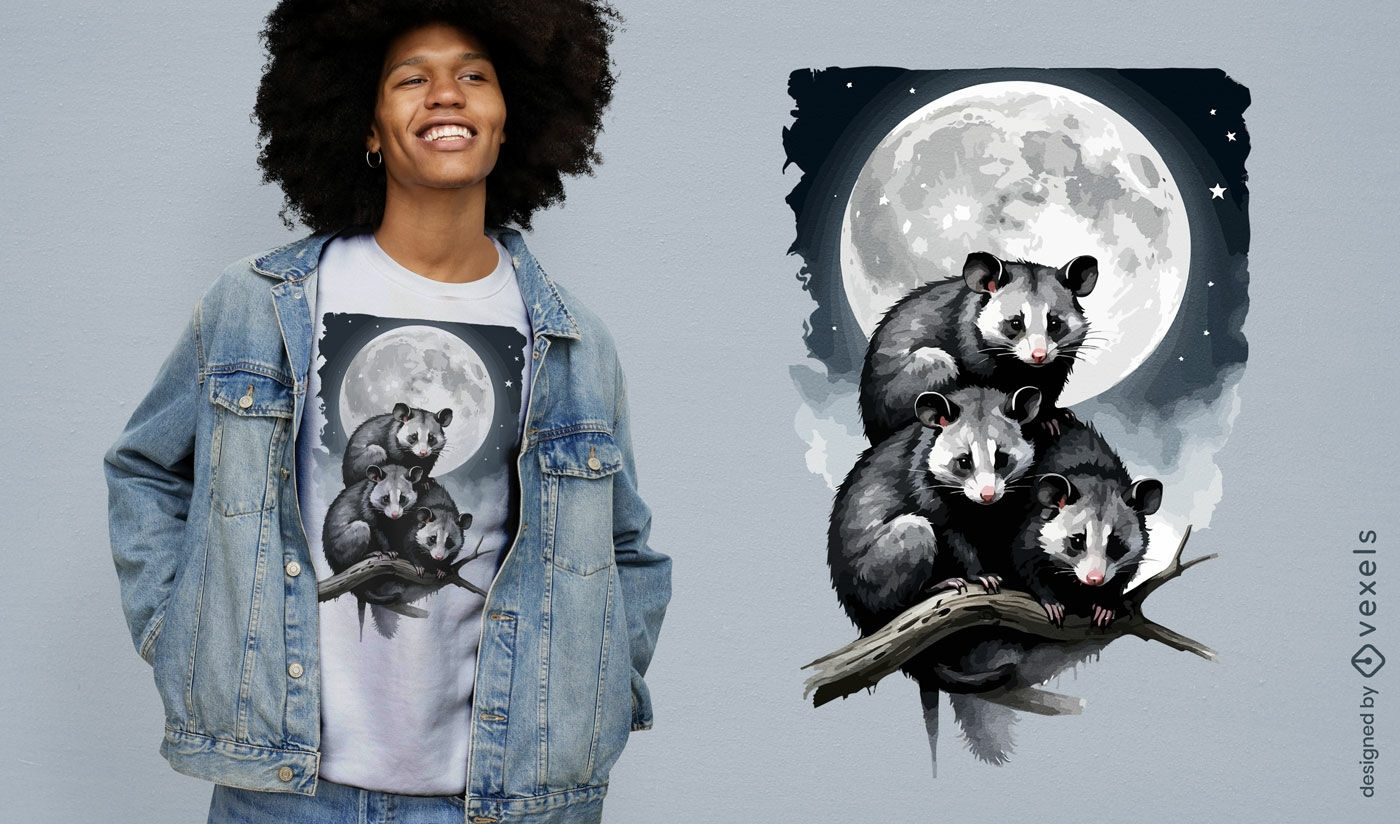
Moonlit opossum t-shirt design
Choose a folder
All favorites
Create new
Save
Moonlit opossum t-shirt design
Print ready
for Merch
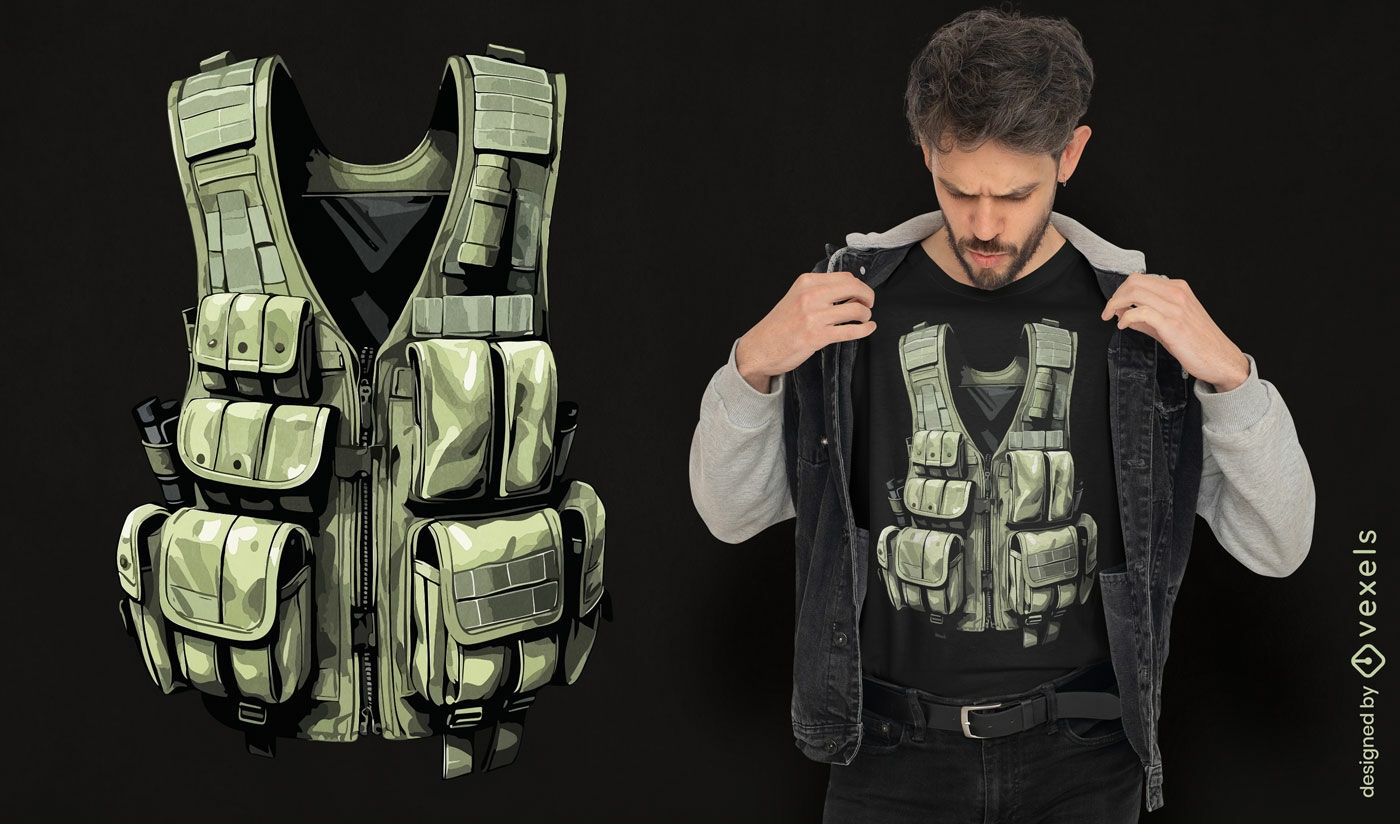
Tactical vest t-shirt design
Choose a folder
All favorites
Create new
Save
Tactical vest t-shirt design
Print ready
for Merch
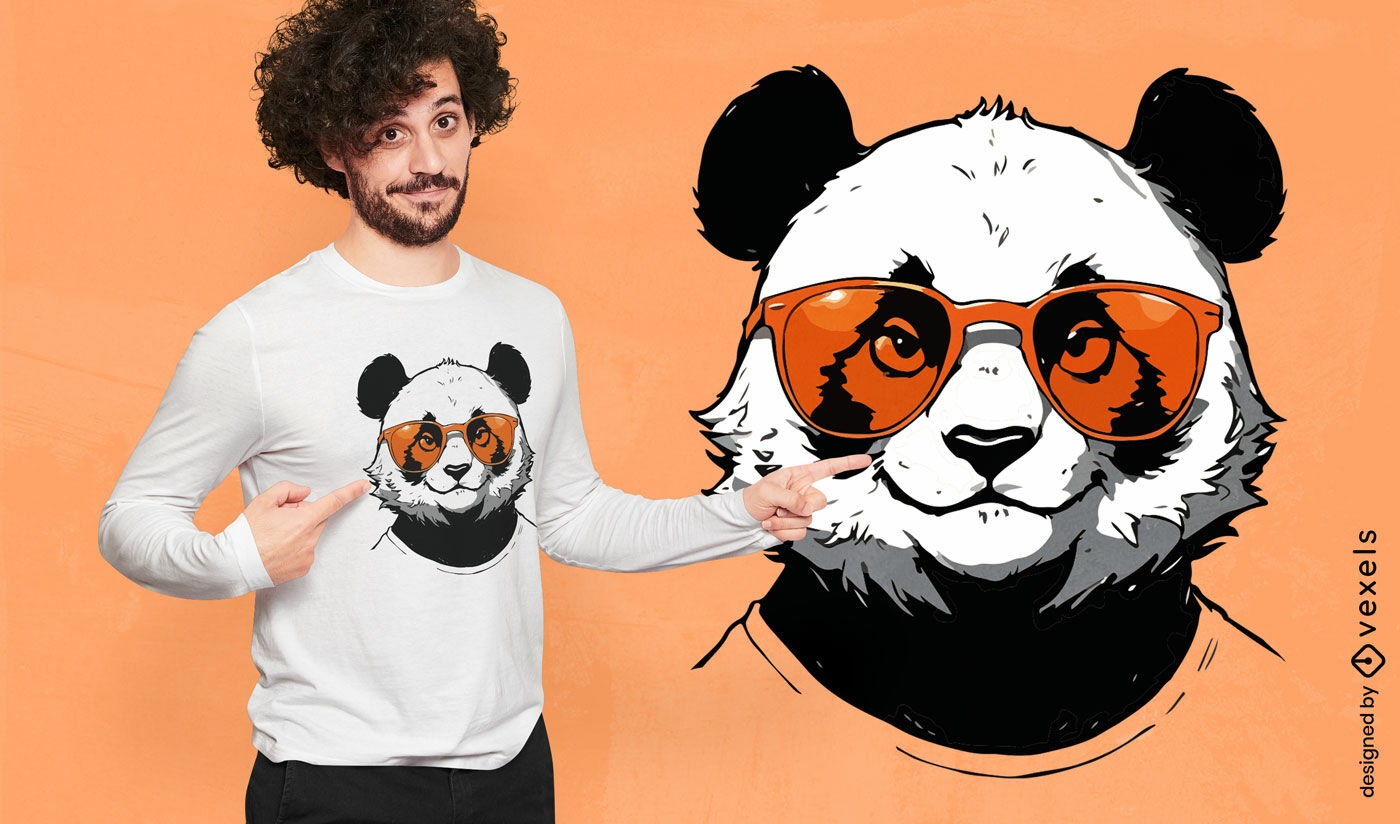
Panda with orange sunglasses t-shirt design
Choose a folder
All favorites
Create new
Save
Panda with orange sunglasses t-shirt design
Editable text
Print ready
for Merch
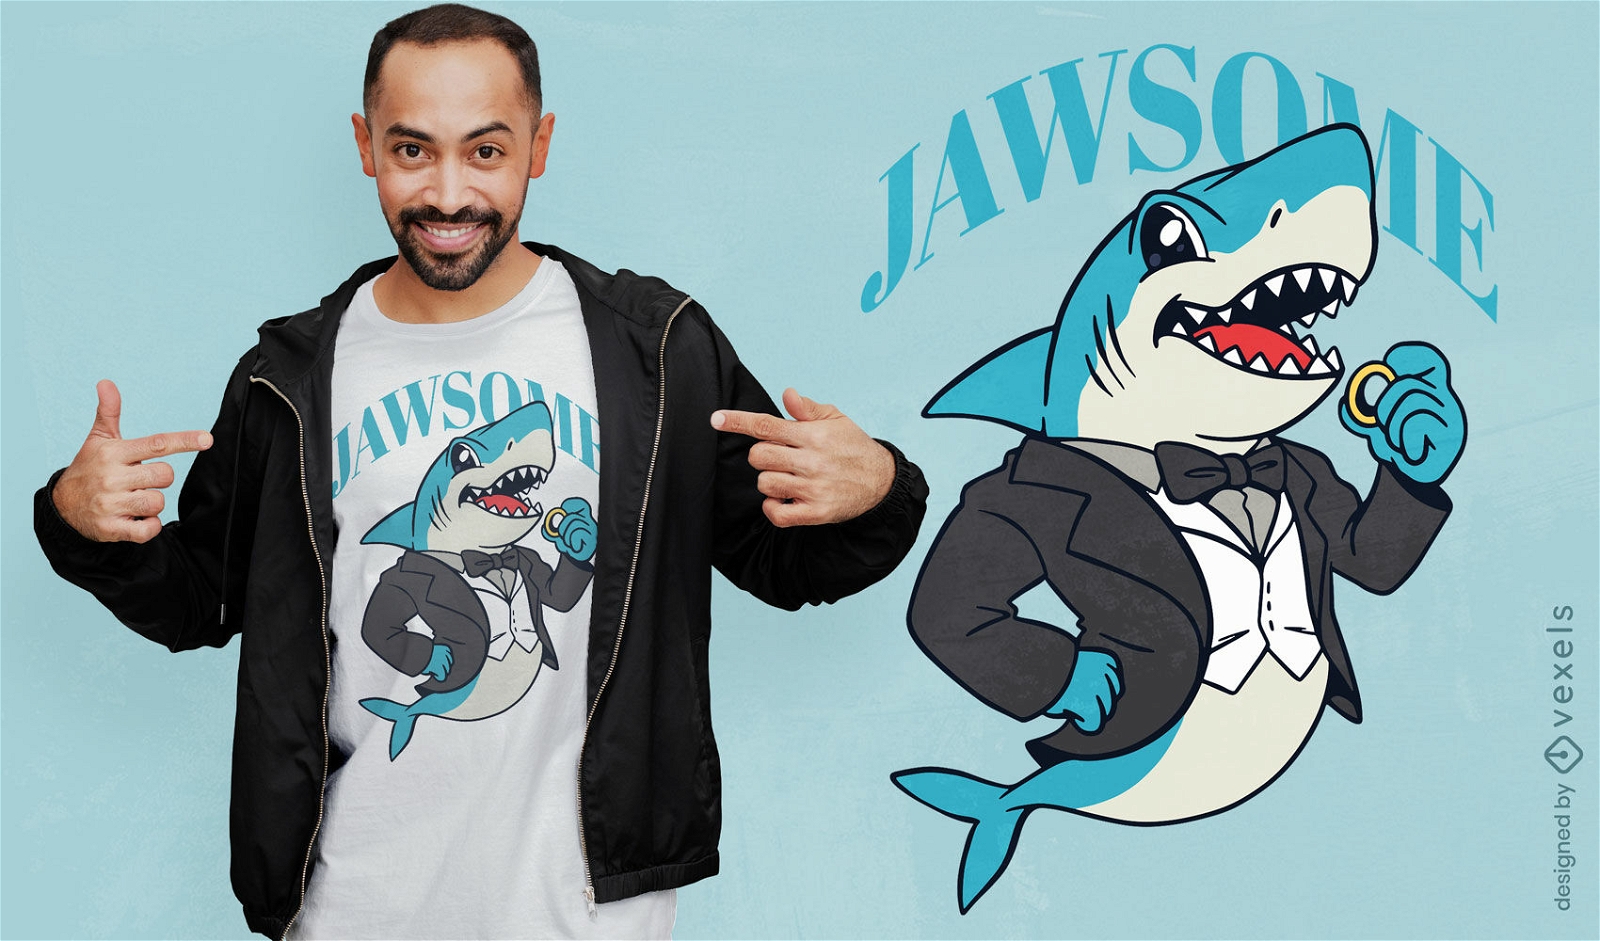
Shark wedding pun t-shirt design
Choose a folder
All favorites
Create new
Save
Shark wedding pun t-shirt design
Editable text
Print ready
for Merch
Mayo jar t-shirt design
Choose a folder
All favorites
Create new
Save
Mayo jar t-shirt design
Print ready
for Merch
Viking warrior with red backdrop t-shirt design
Choose a folder
All favorites
Create new
Save
Viking warrior with red backdrop t-shirt design
Print ready
for Merch
Humorous weightlifting skeleton t-shirt design
Choose a folder
All favorites
Create new
Save
Humorous weightlifting skeleton t-shirt design
Print ready
for Merch
K9 unit t-shirt design
Choose a folder
All favorites
Create new
Save
K9 unit t-shirt design
Print ready
for Merch
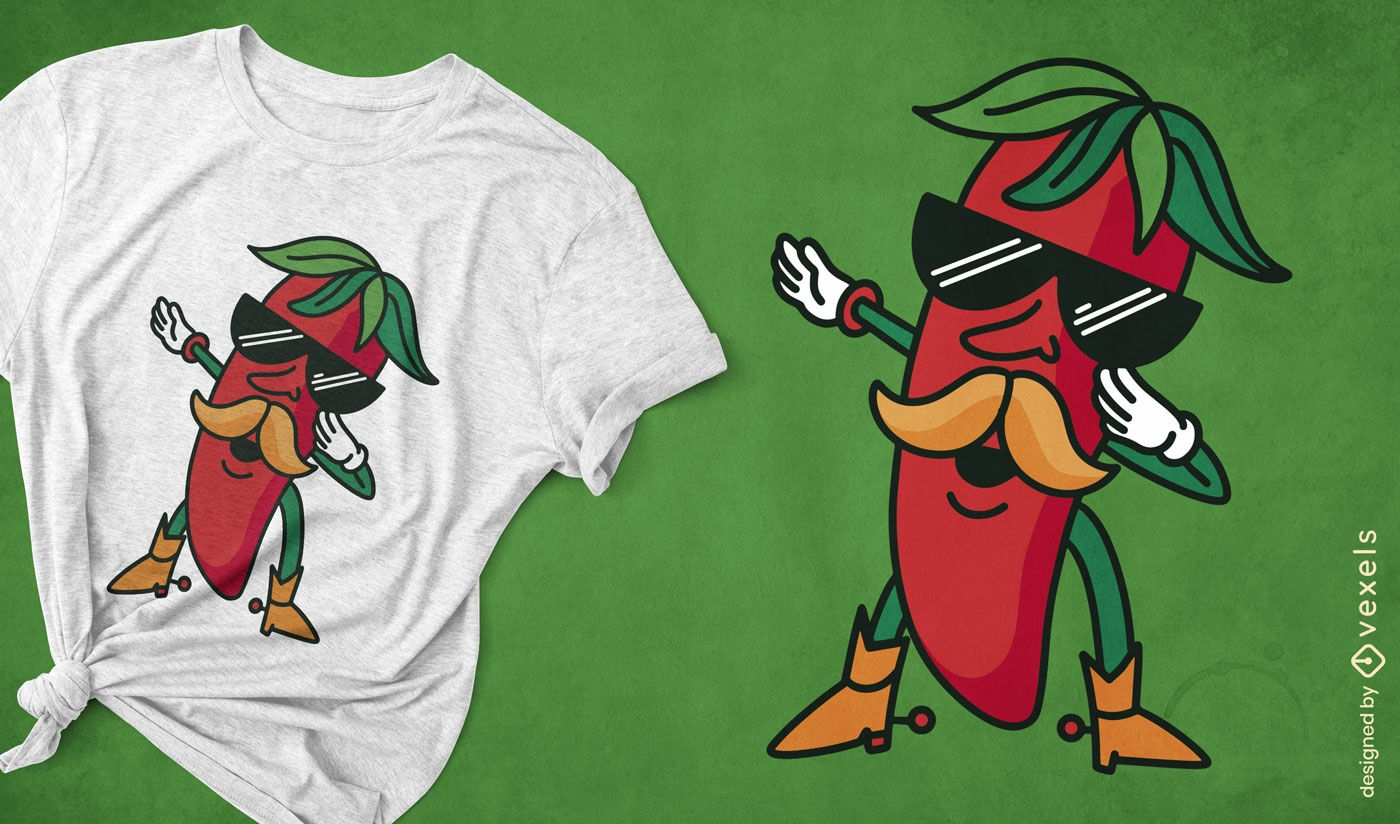
Spicy chili character t-shirt design
Choose a folder
All favorites
Create new
Save
Spicy chili character t-shirt design
Print ready
for Merch
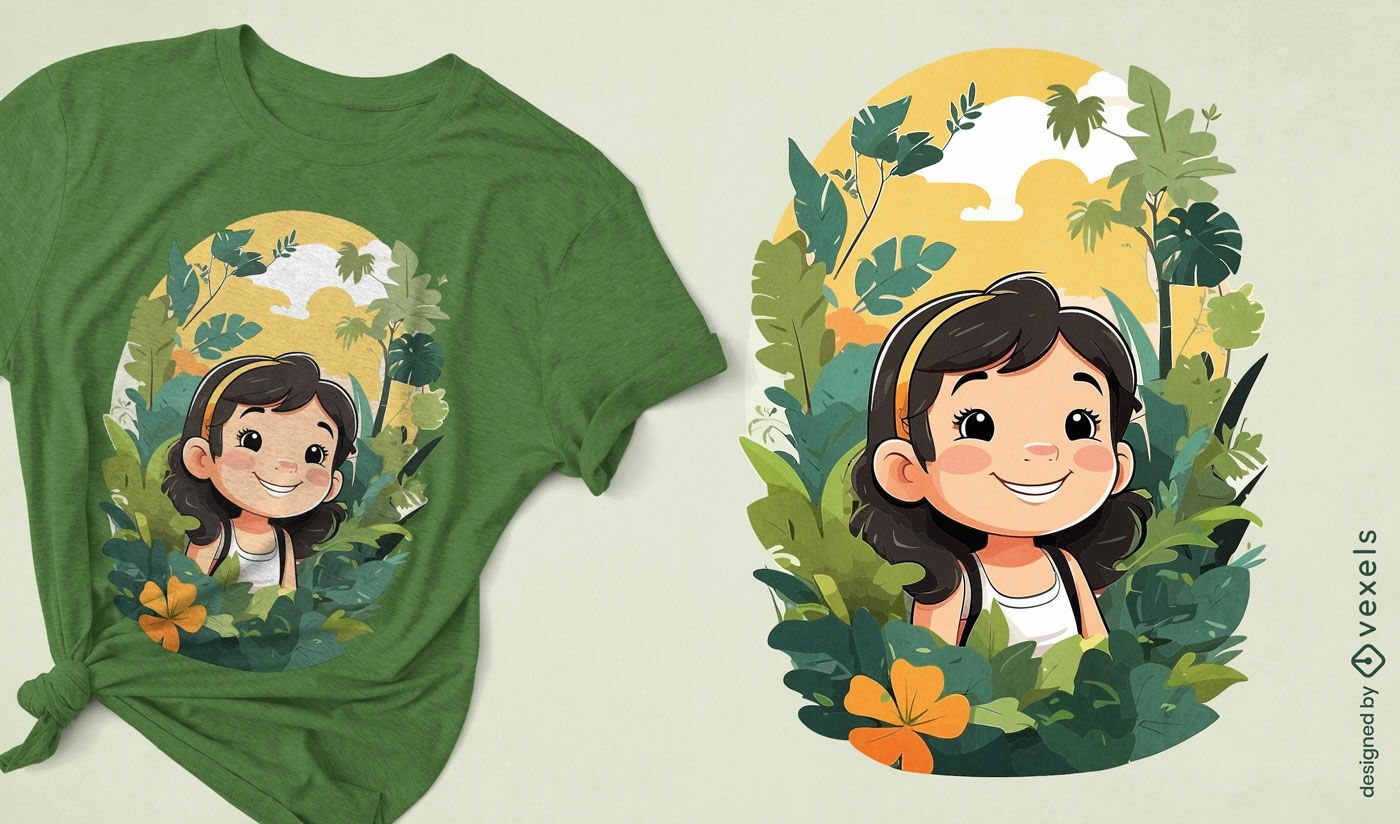
Jungle adventure kids t-shirt design
Choose a folder
All favorites
Create new
Save
Jungle adventure kids t-shirt design
Print ready
for Merch
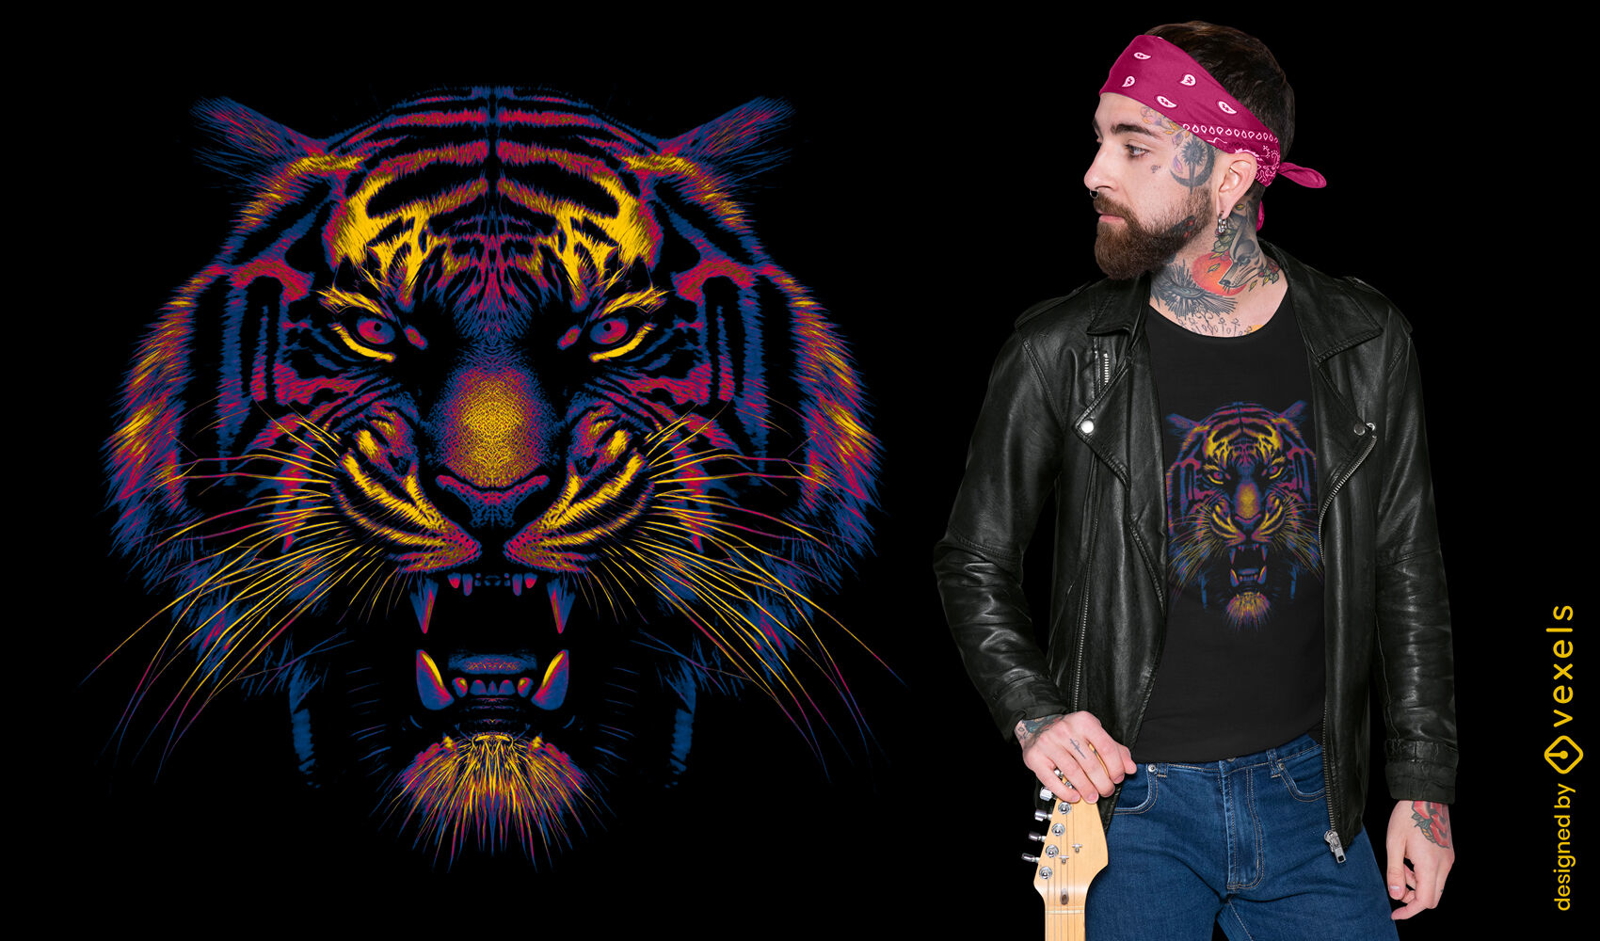
Vibrant tiger face t-shirt design
Choose a folder
All favorites
Create new
Save
Vibrant tiger face t-shirt design
Print ready
for Merch
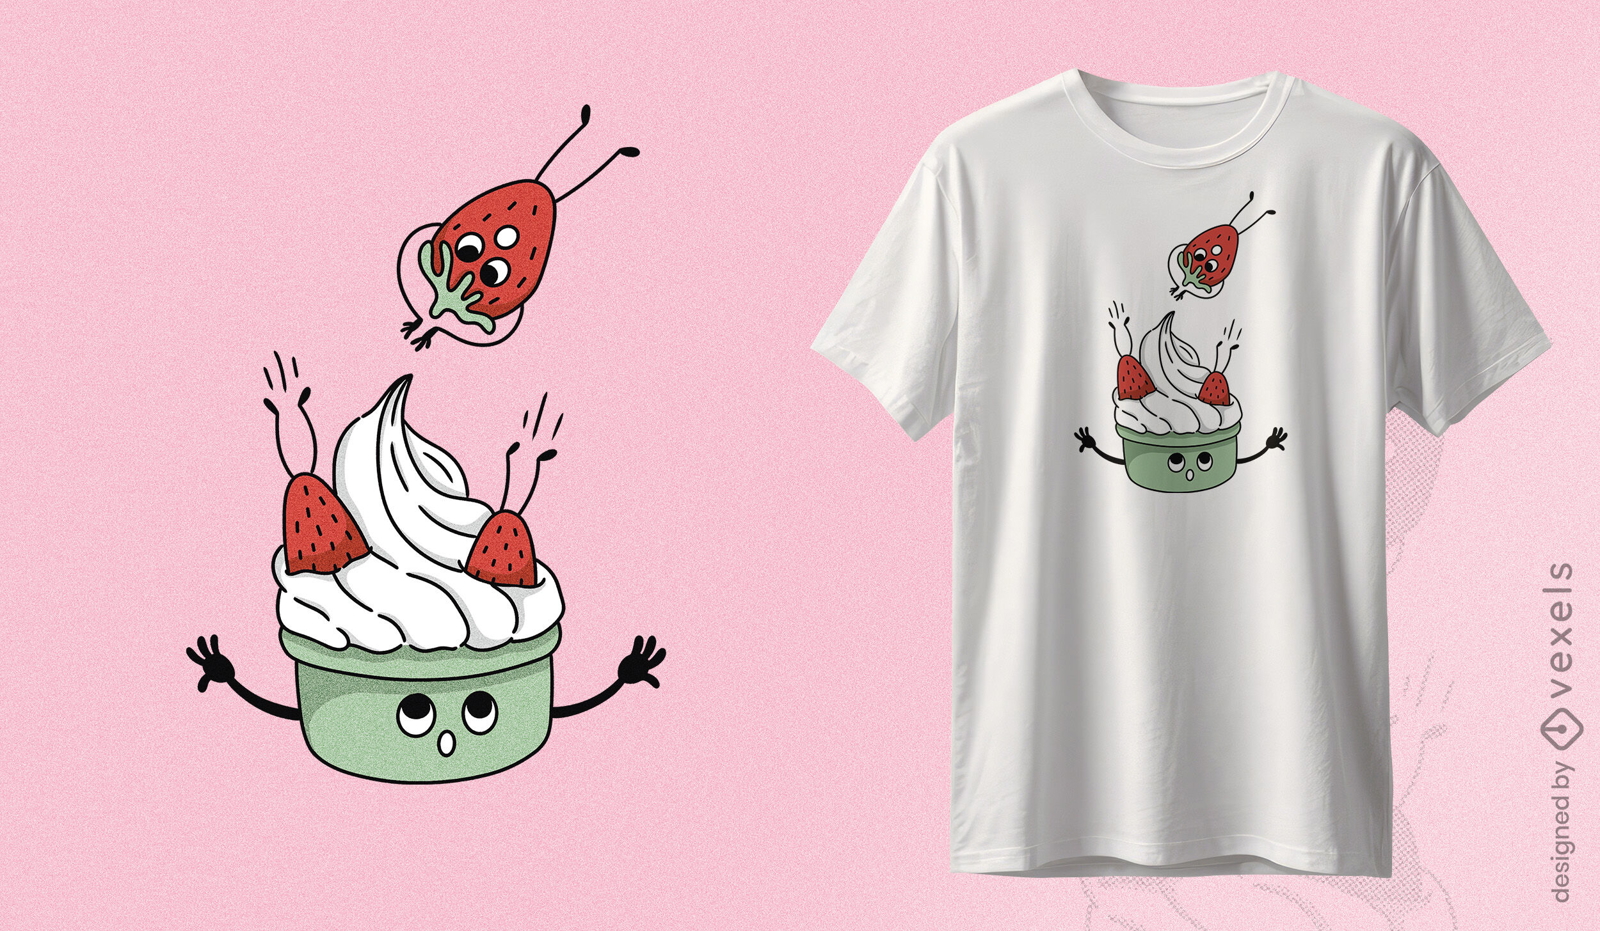
Playful strawberries and cream t-shirt design Whimsical t-shirt design featuring joyful strawberries jumping to a bowl of cream with playful facial expressions.
Choose a folder
All favorites
Create new
Save
Playful strawberries and cream t-shirt design Whimsical t-shirt design featuring joyful strawberries jumping to a bowl of cream with playful facial expressions.
Editable text
Print ready
for Merch
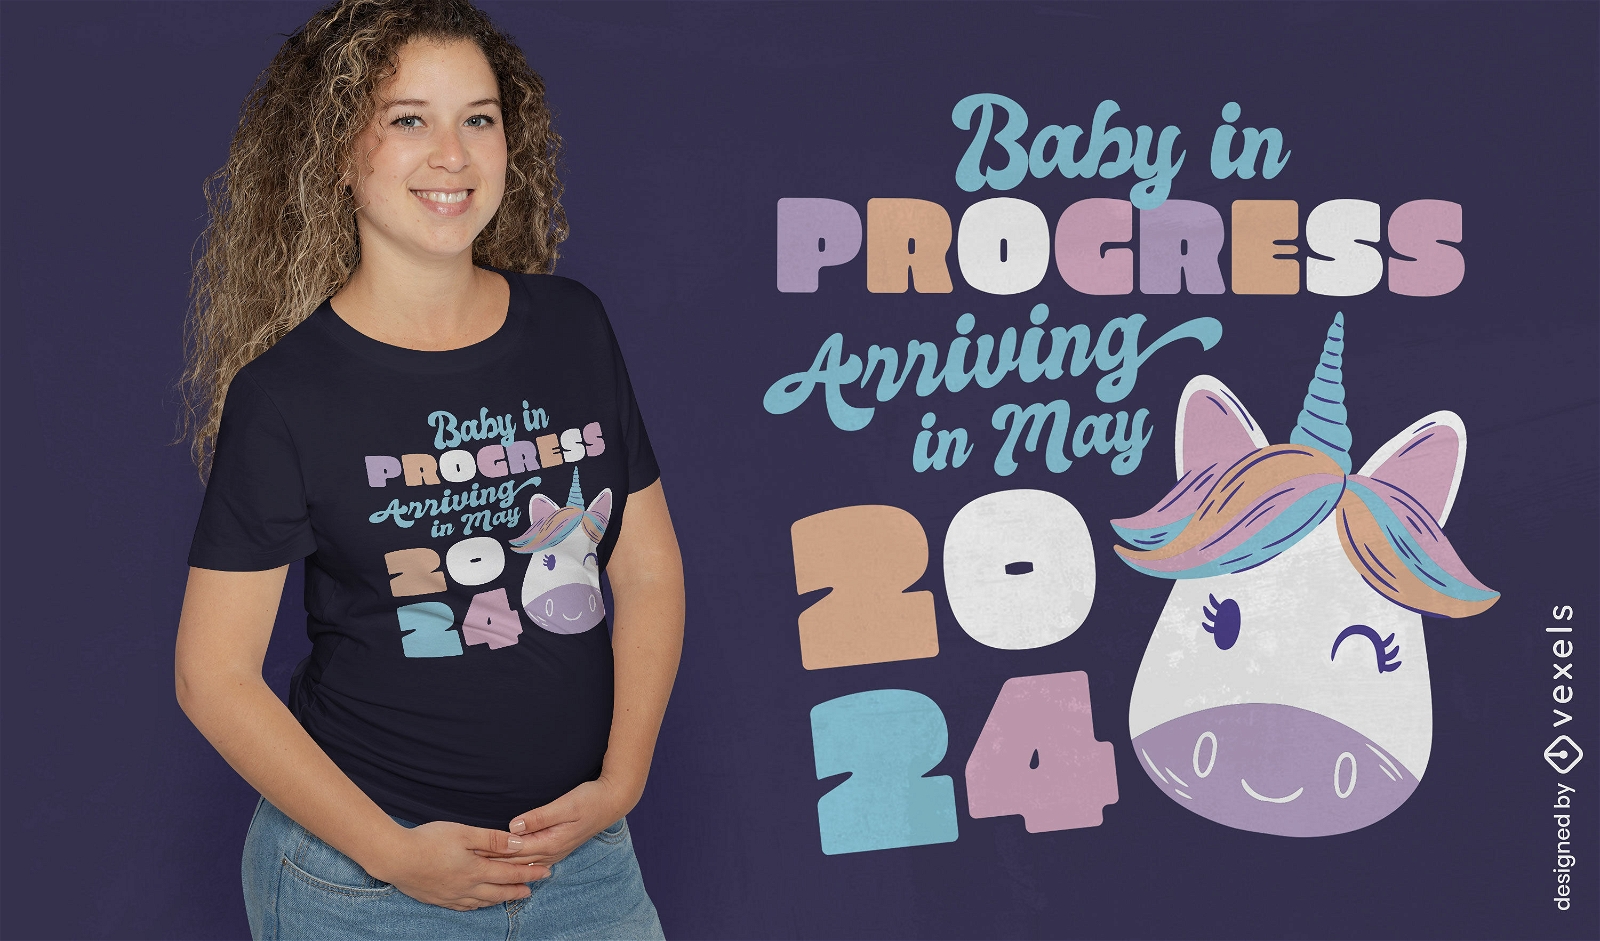
Maternity unicorn t-shirt design
Choose a folder
All favorites
Create new
Save
Maternity unicorn t-shirt design
Print ready
for Merch
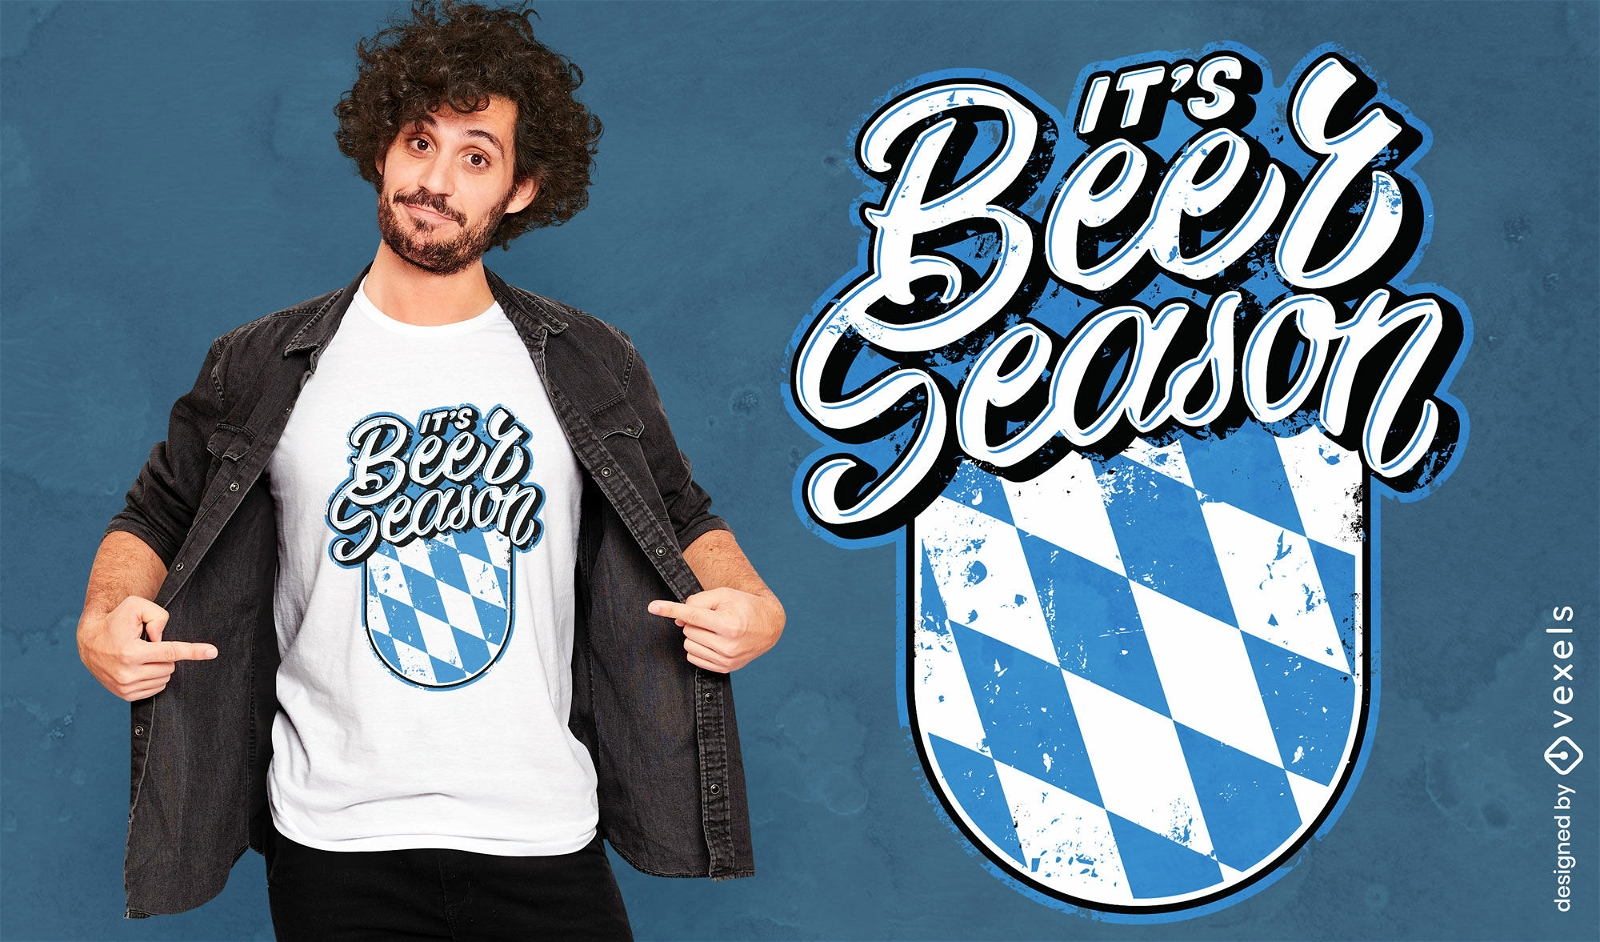
Beer season Oktoberfest quote t-shirt design
Choose a folder
All favorites
Create new
Save
Beer season Oktoberfest quote t-shirt design
Print ready
for Merch
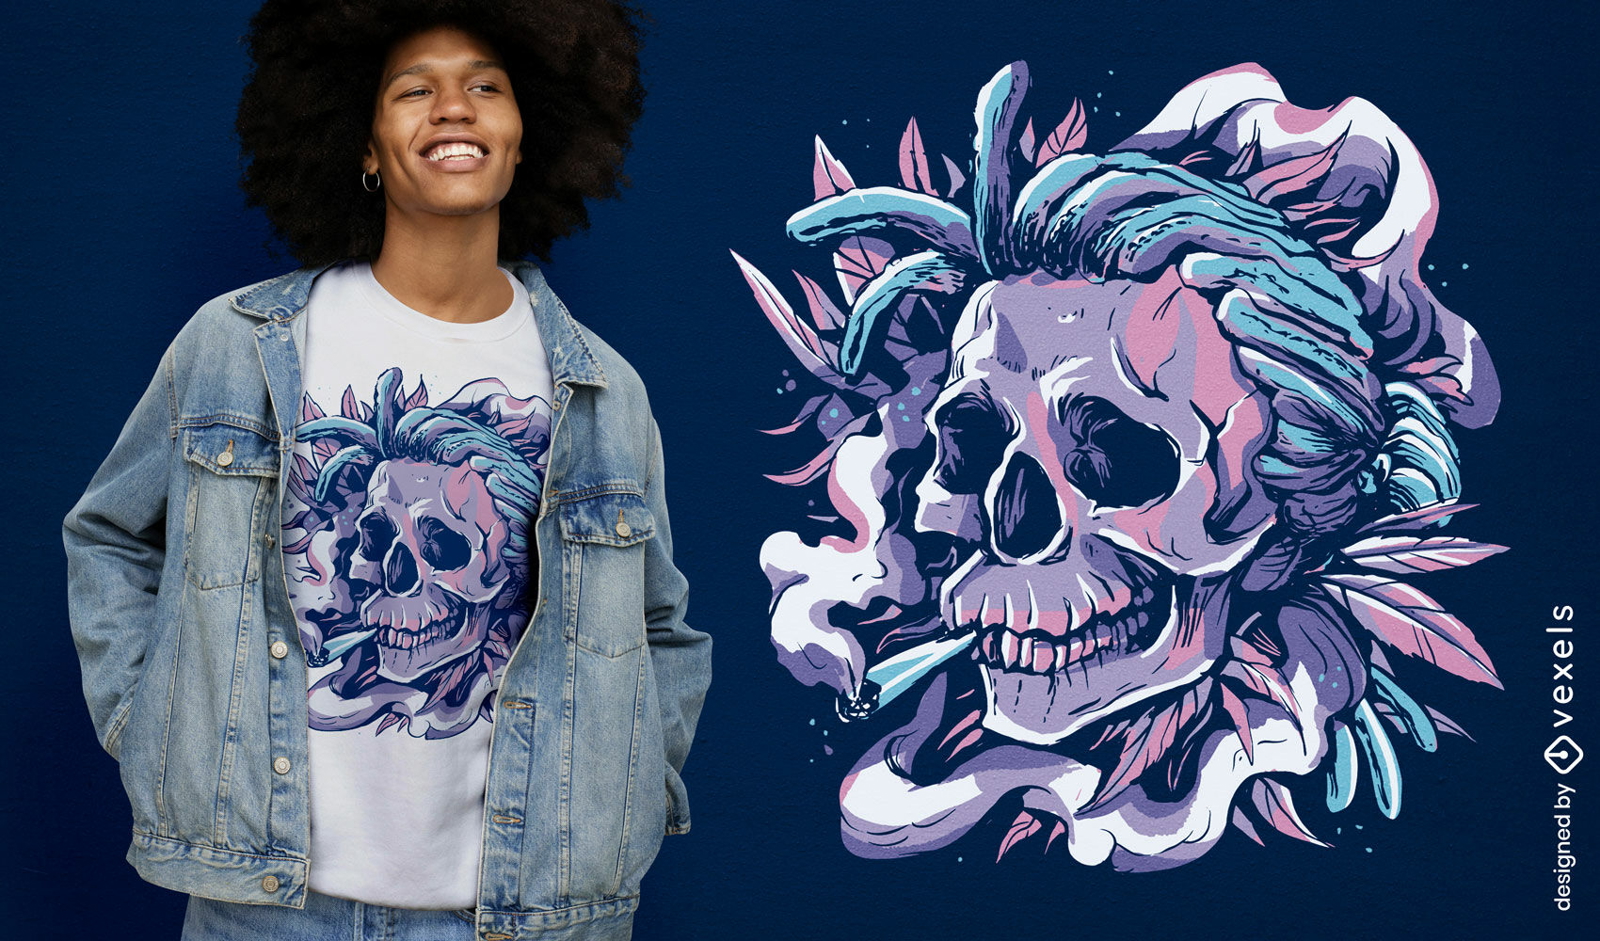
Trippy skull smoking weed t-shirt design
Choose a folder
All favorites
Create new
Save
Trippy skull smoking weed t-shirt design
Print ready
for Merch
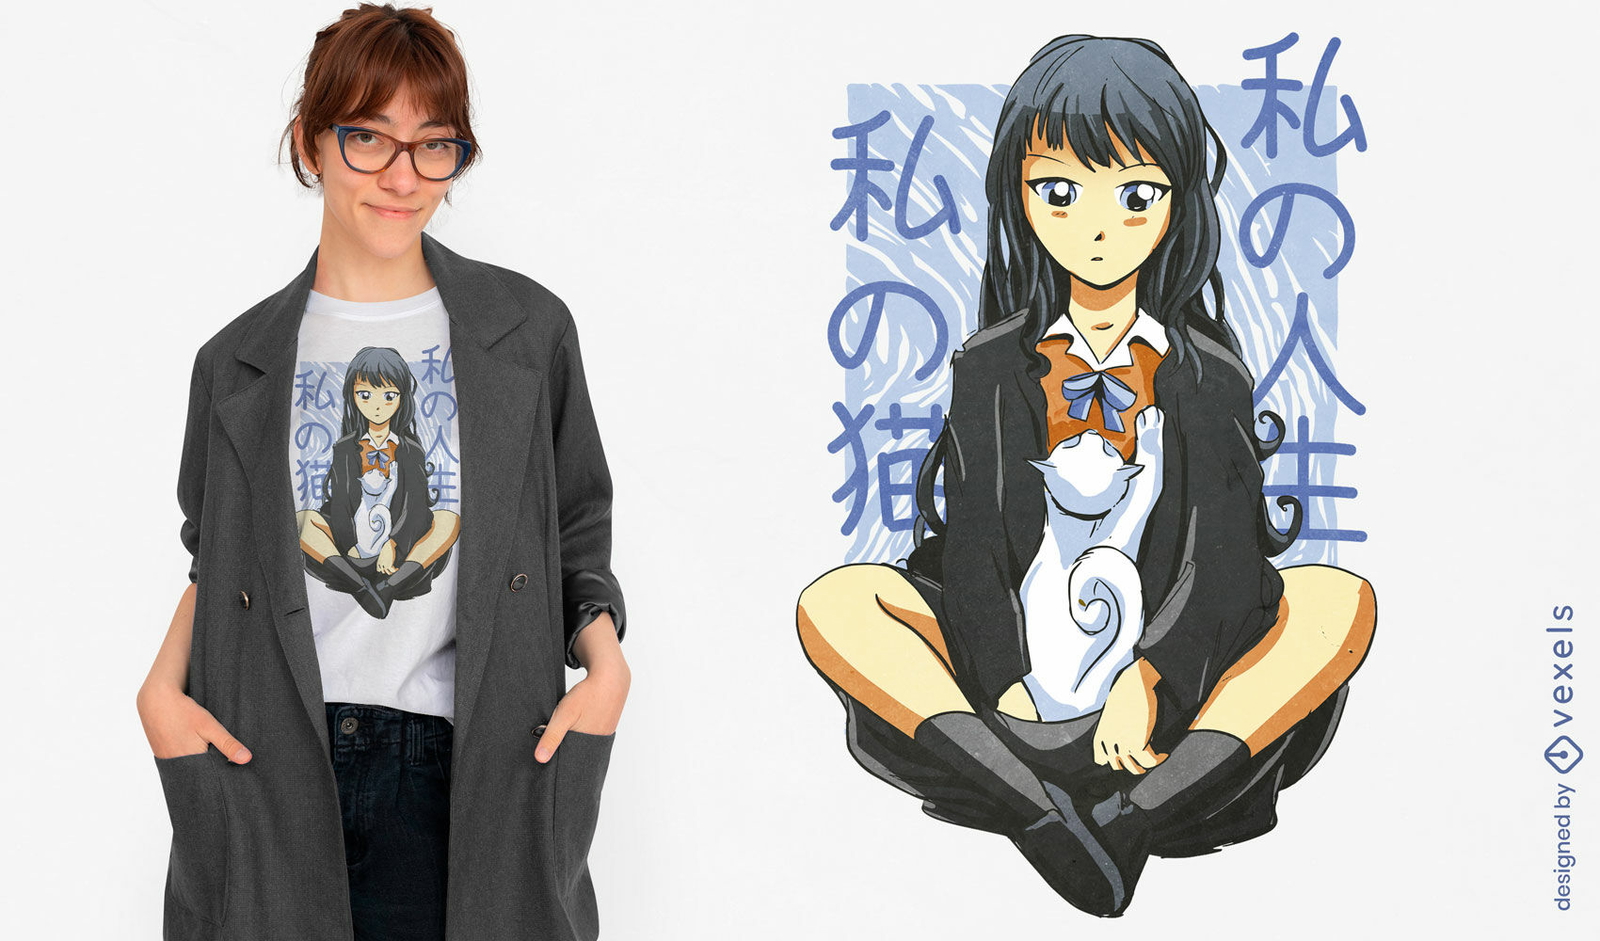
Anime girl sitting with cat t-shirt design
Choose a folder
All favorites
Create new
Save
Anime girl sitting with cat t-shirt design
Print ready
for Merch
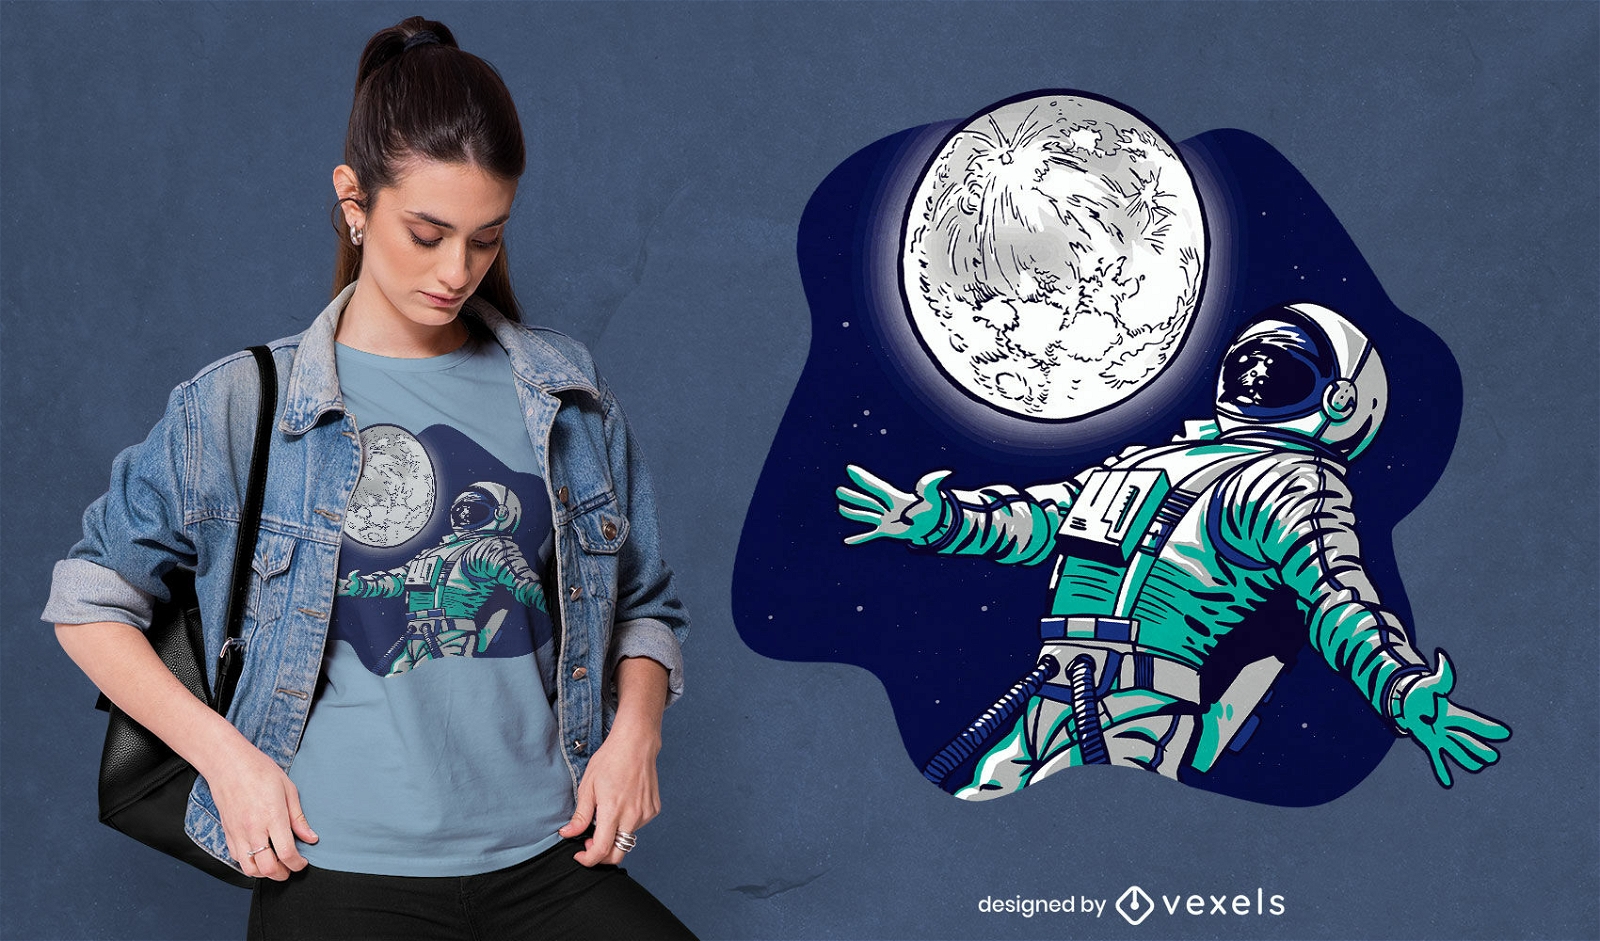
Astronaut and the moon t-shirt design
Choose a folder
All favorites
Create new
Save
Astronaut and the moon t-shirt design
Print ready
for Merch
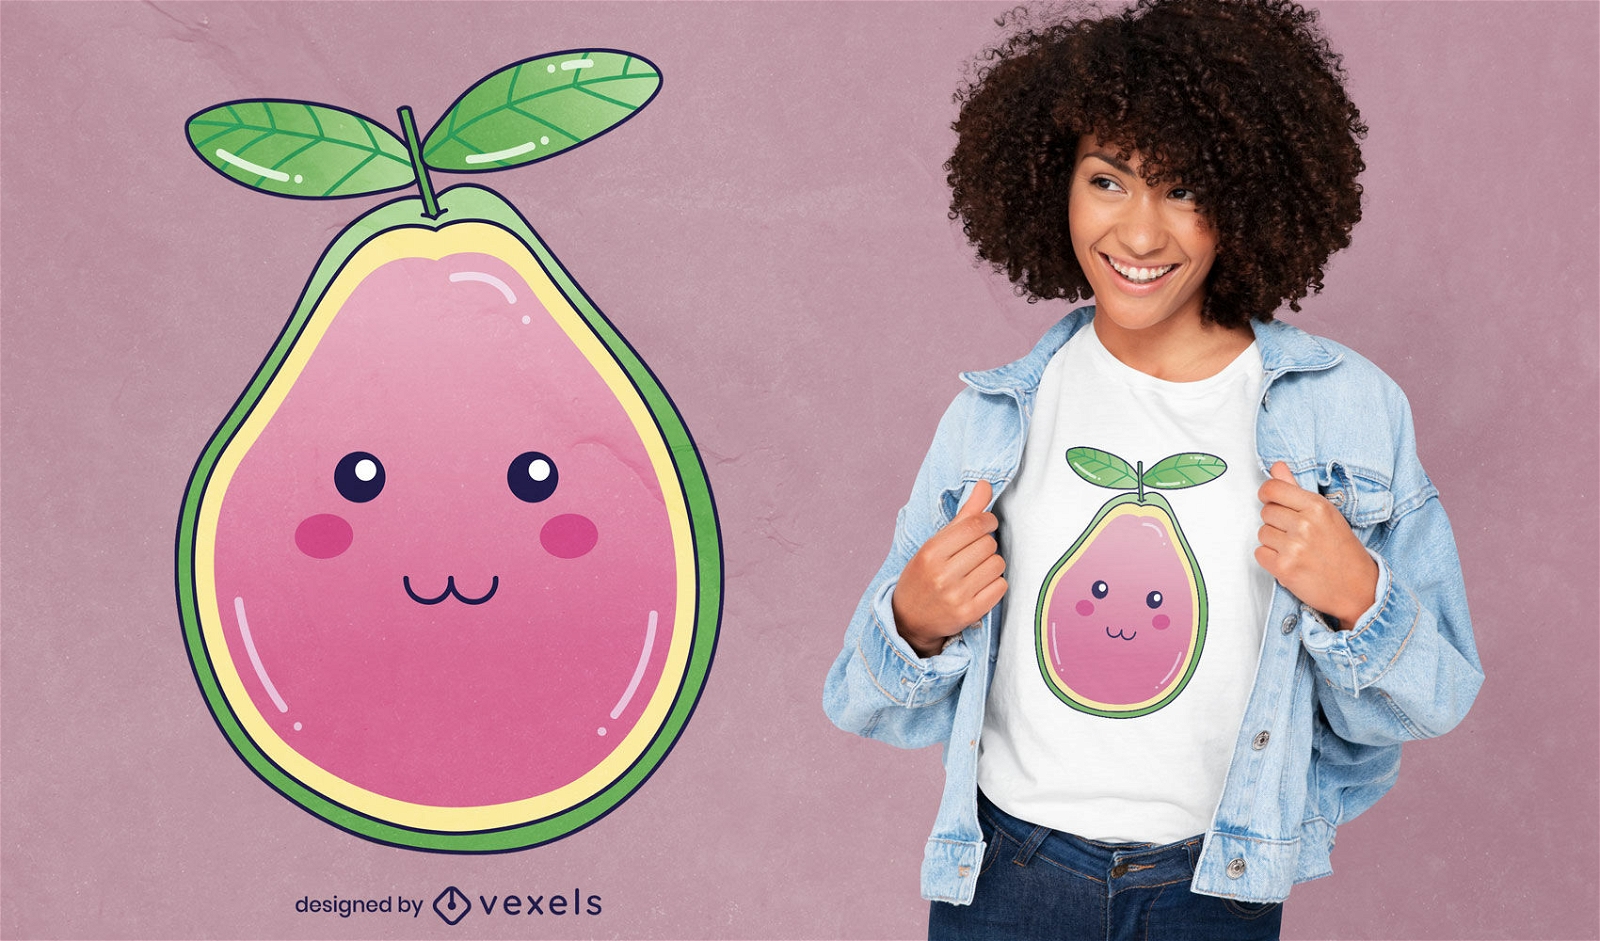
Kawaii guava fruit food t-shirt design
Choose a folder
All favorites
Create new
Save
Kawaii guava fruit food t-shirt design
Editable text
Print ready
for Merch
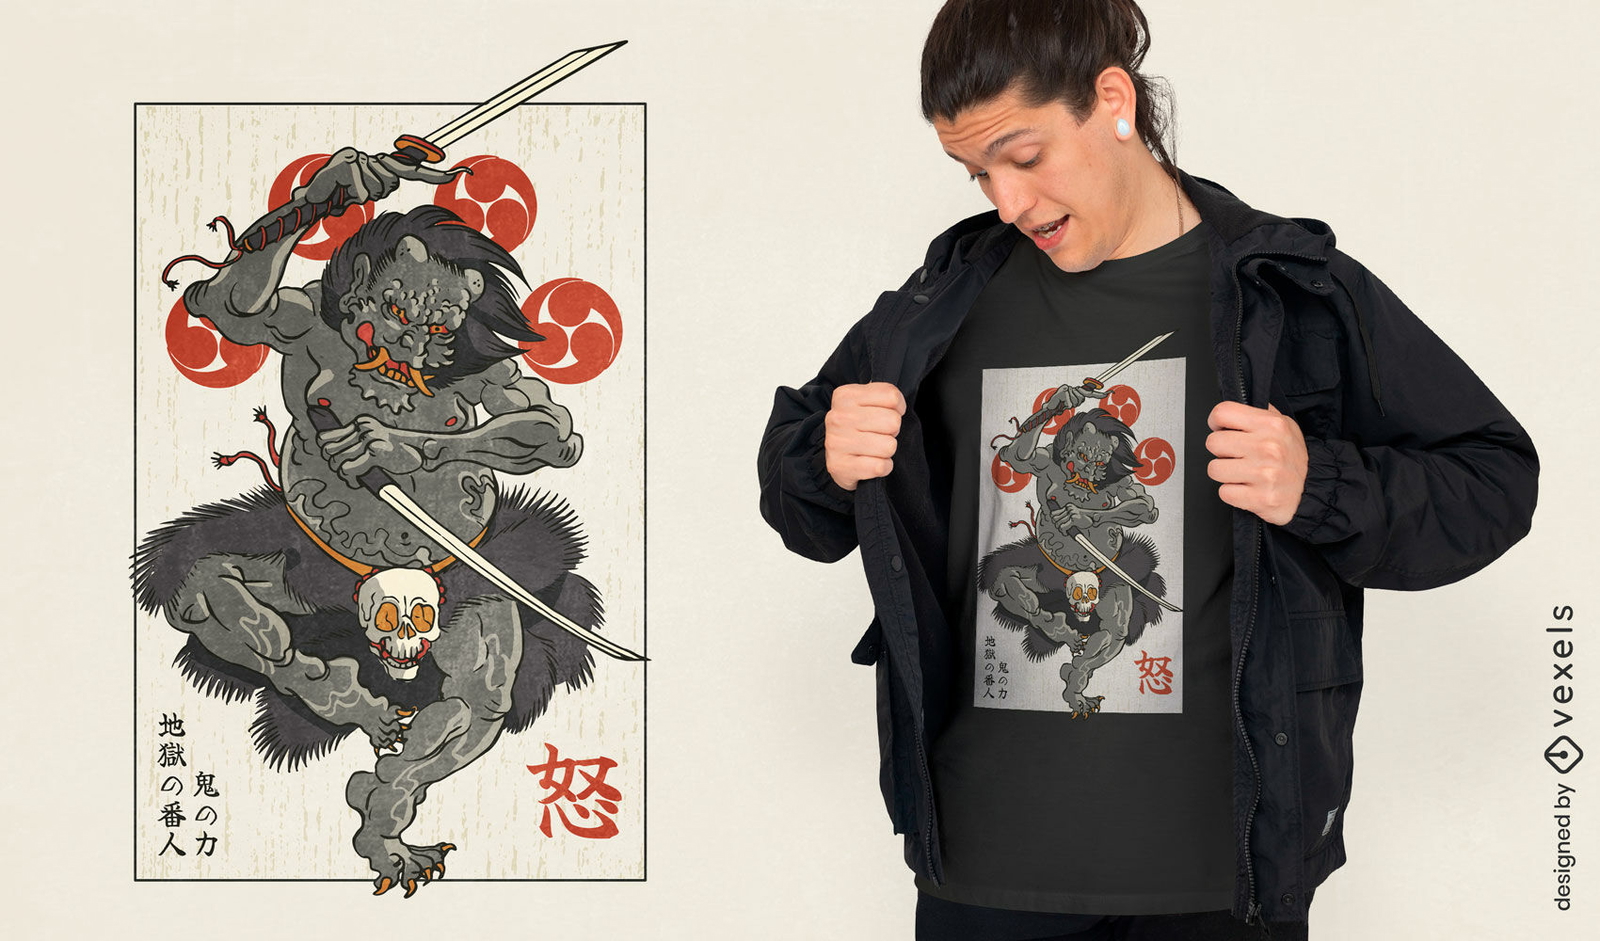
Japanese oni warrior t-shirt design
Choose a folder
All favorites
Create new
Save
Japanese oni warrior t-shirt design
Editable text
Print ready
for Merch
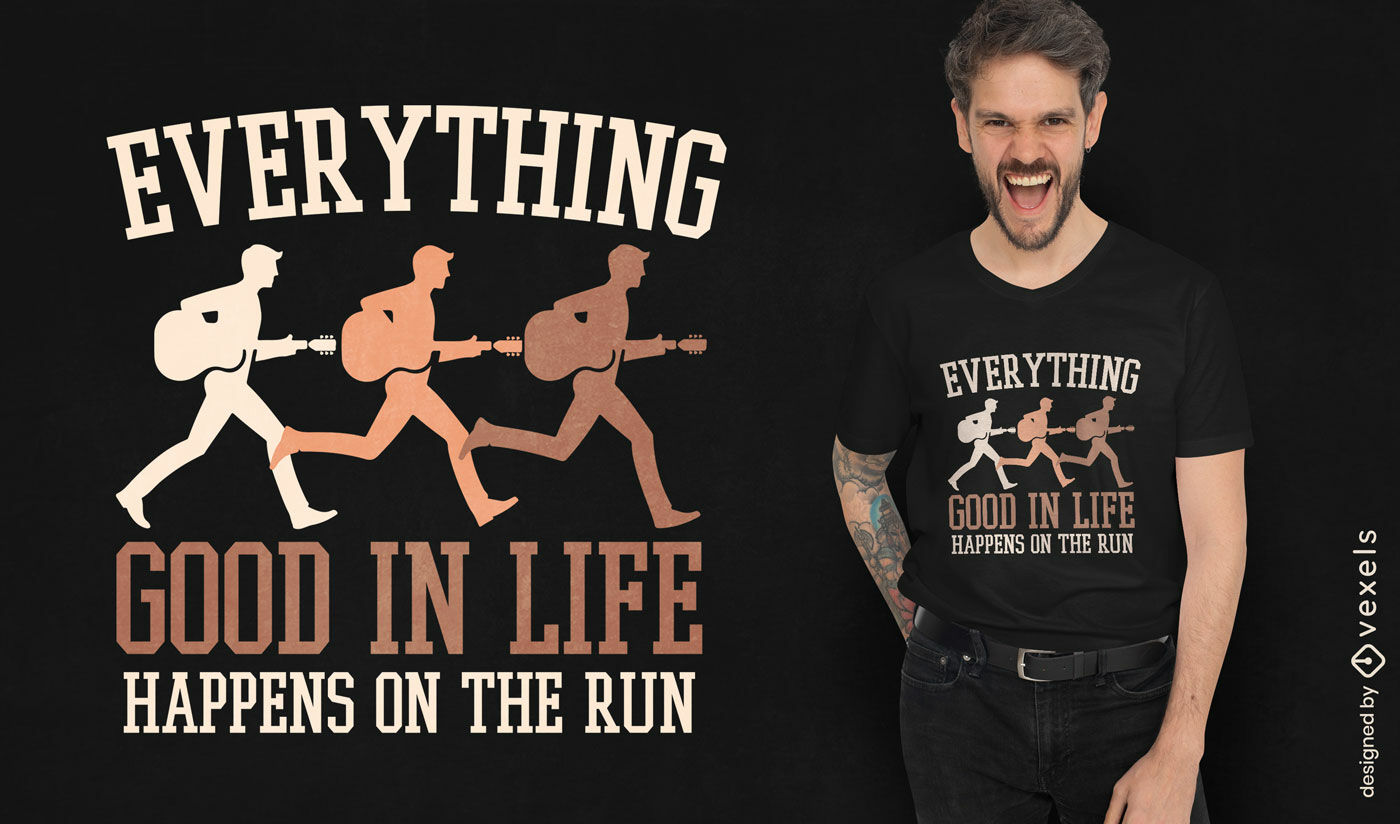
Runner motivation t-shirt design
Choose a folder
All favorites
Create new
Save
Runner motivation t-shirt design
Editable text
Print ready
for Merch
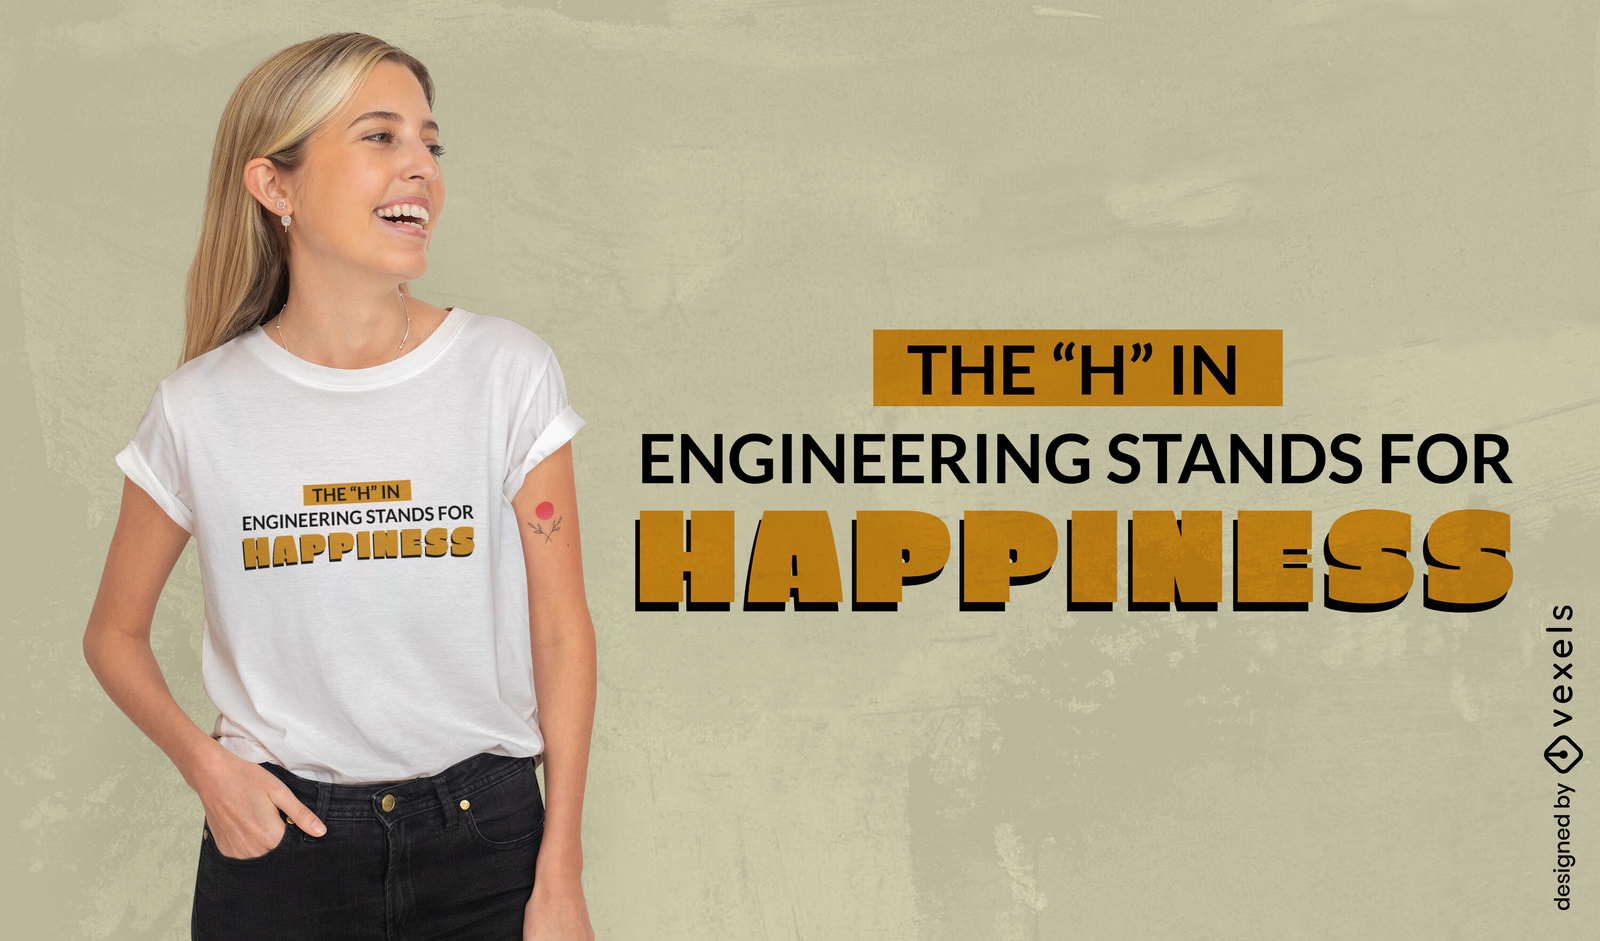
Engineering happiness quote t-shirt design
Choose a folder
All favorites
Create new
Save
Engineering happiness quote t-shirt design
Print ready
for Merch
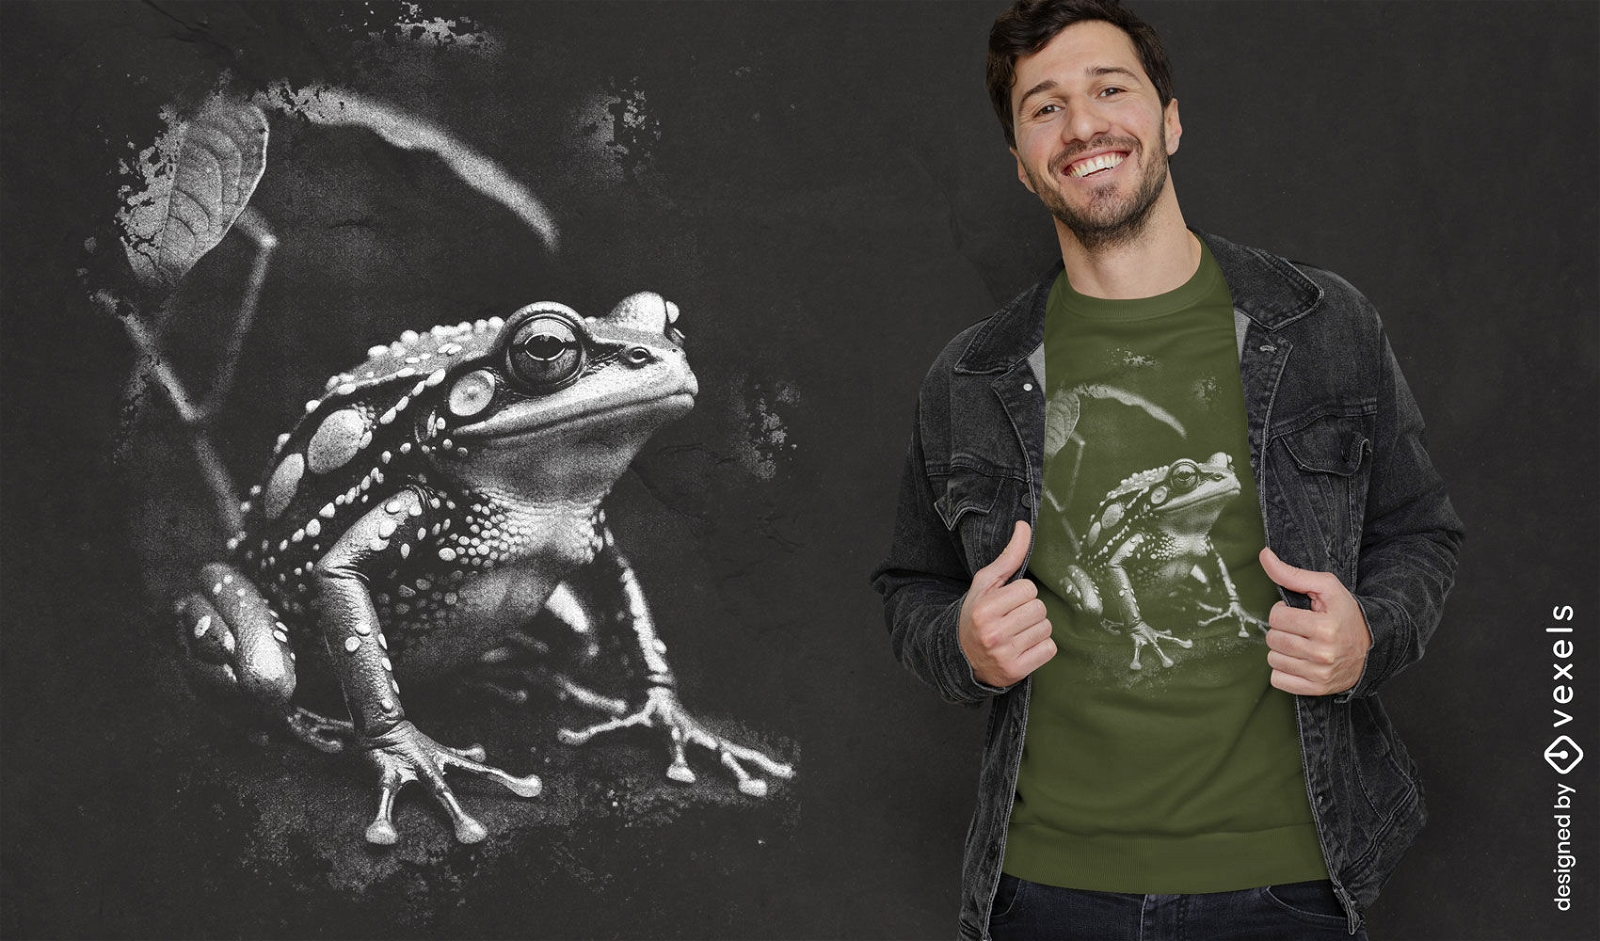
Nature-inspired frog t-shirt design
Choose a folder
All favorites
Create new
Save
Nature-inspired frog t-shirt design
Print ready
for Merch
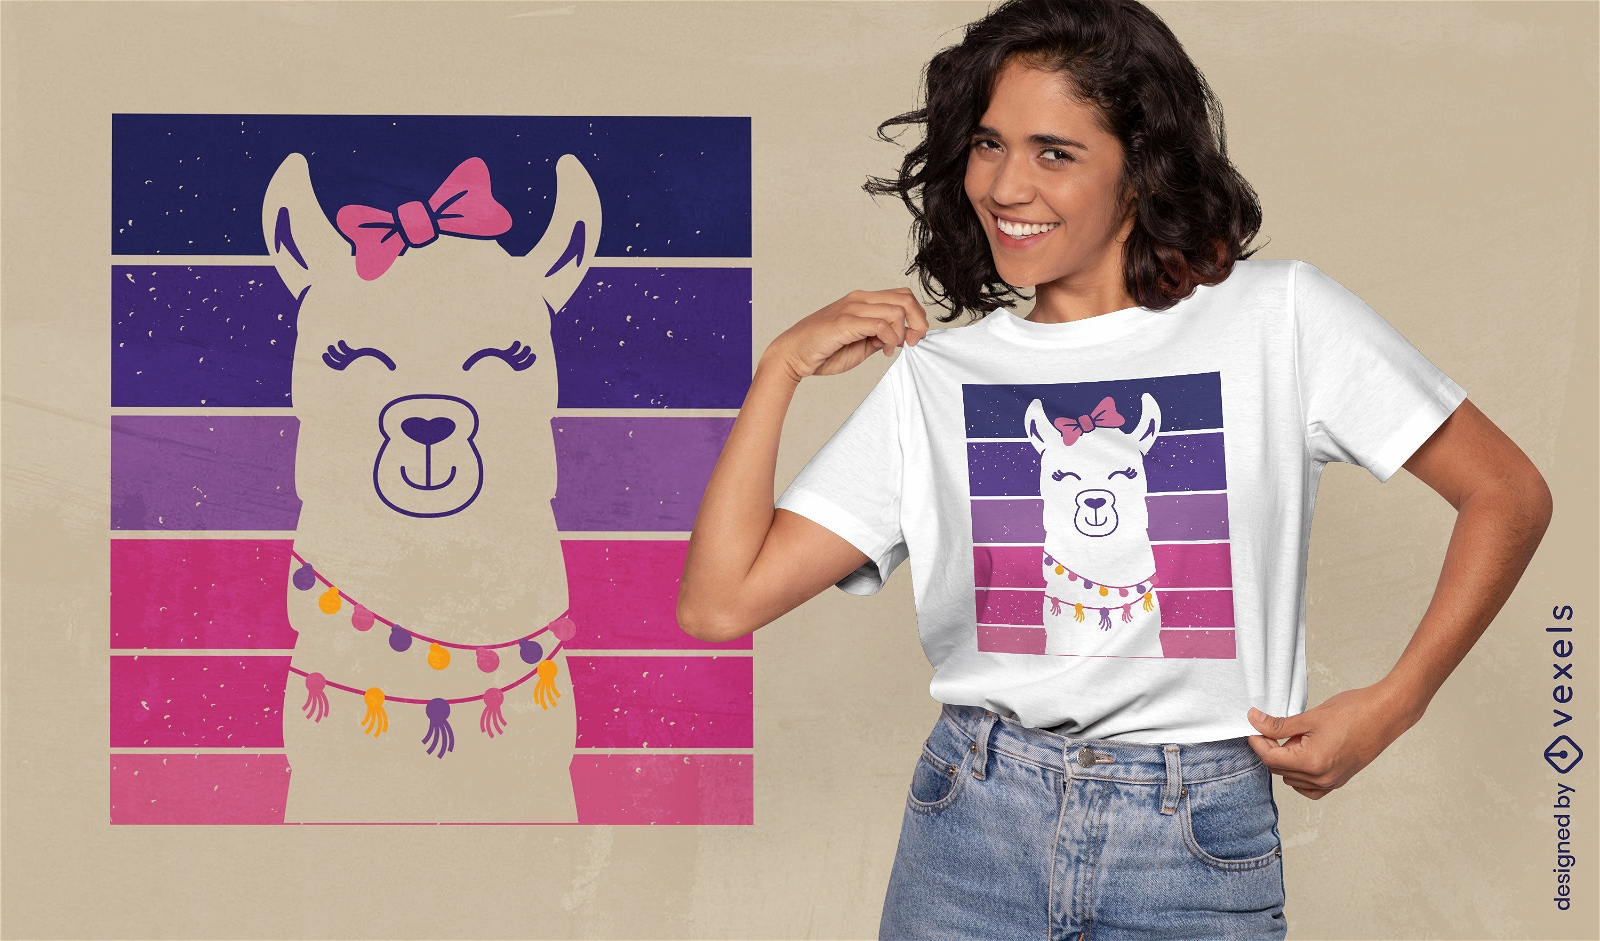
Llama girl t-shirt design
Choose a folder
All favorites
Create new
Save
Llama girl t-shirt design
Print ready
for Merch
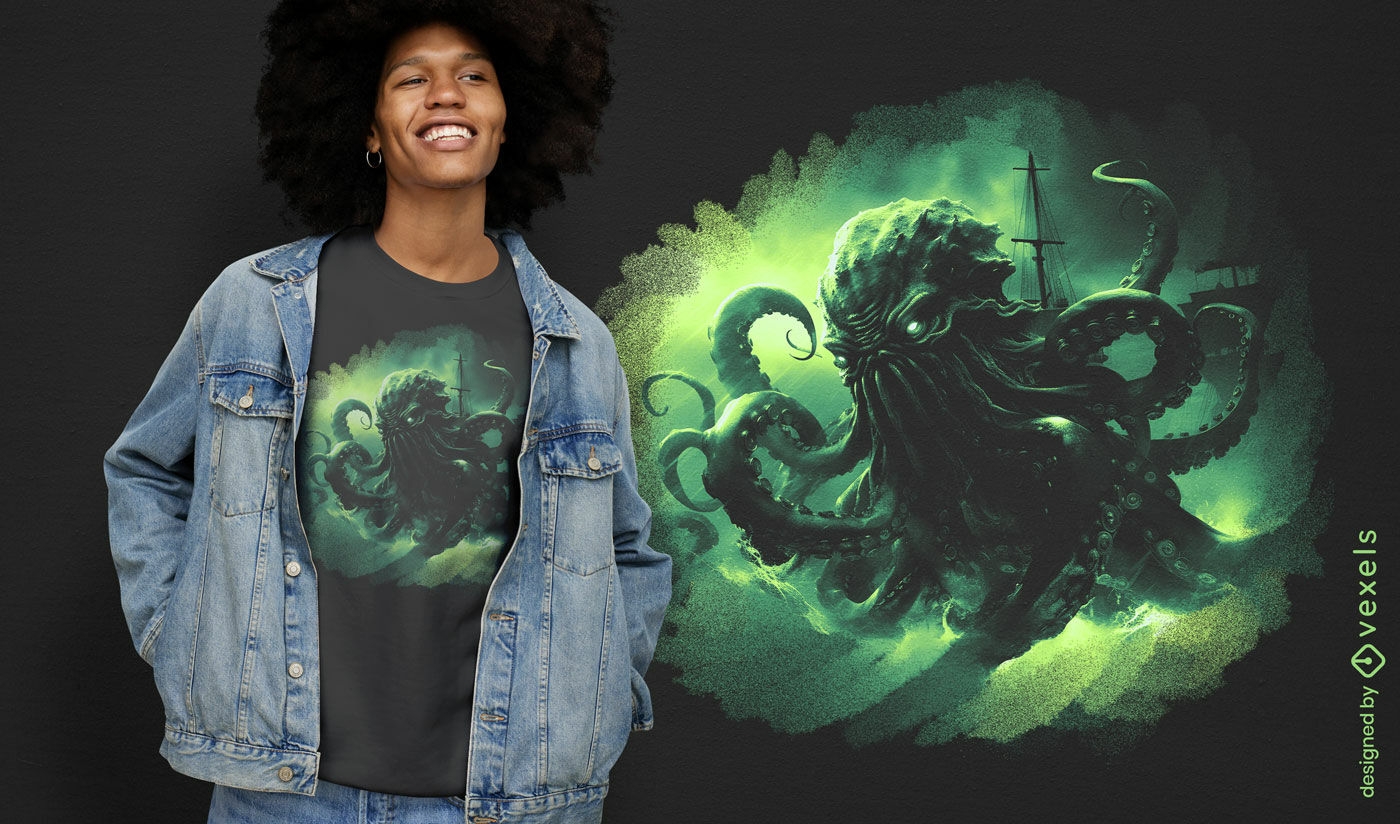
Kraken monster t-shirt design
Choose a folder
All favorites
Create new
Save
Kraken monster t-shirt design
Print ready
for Merch
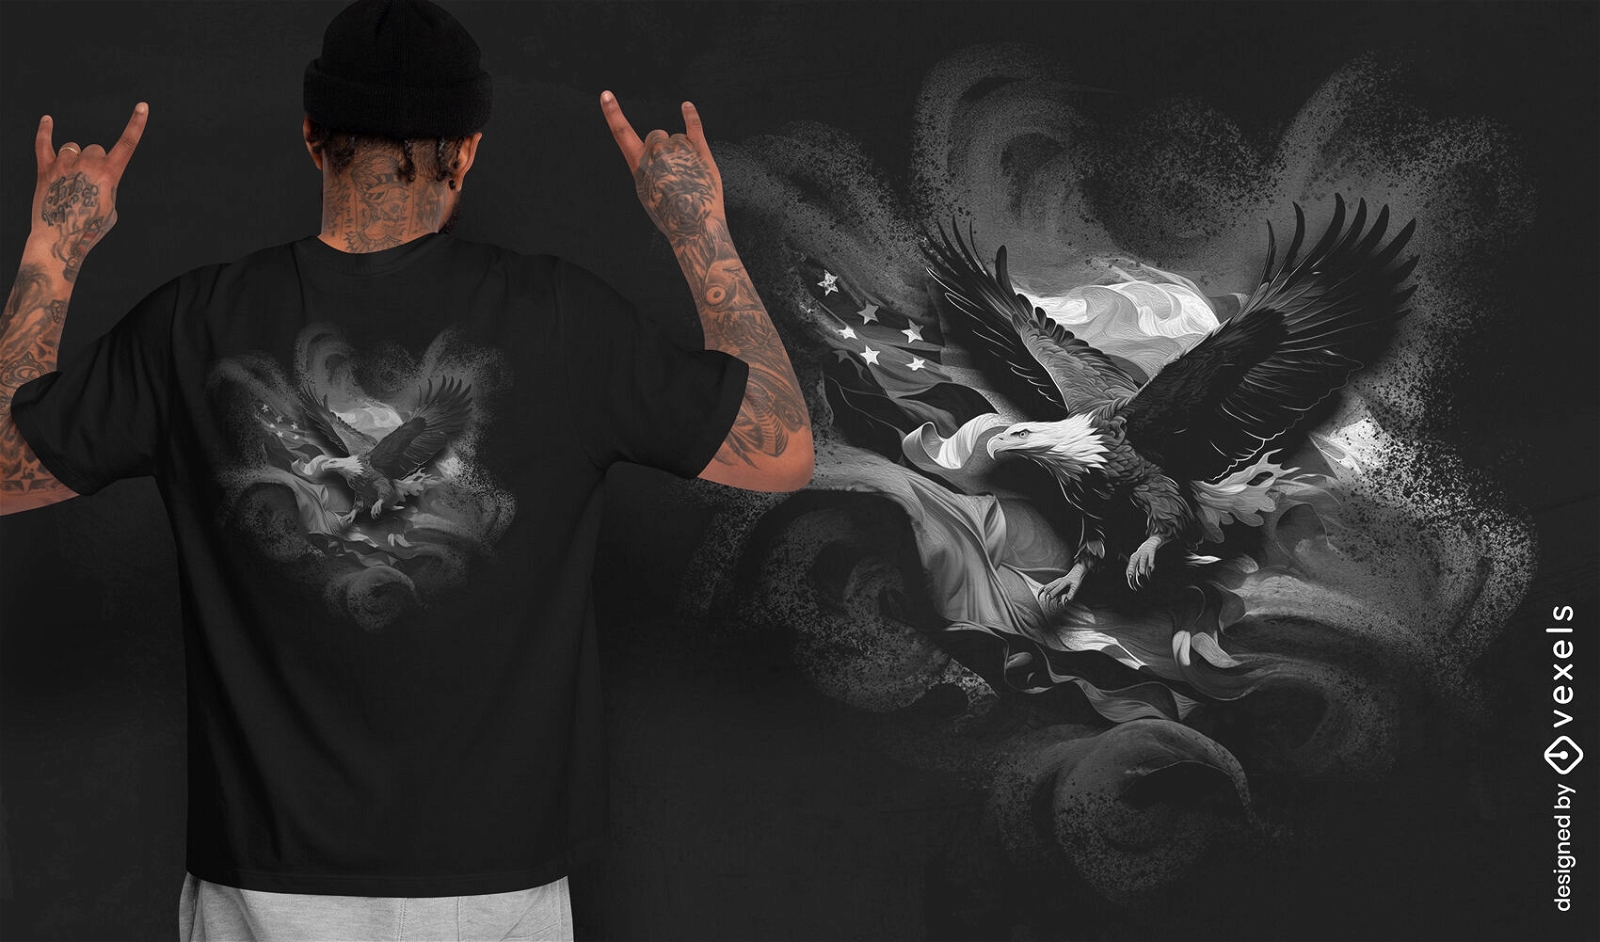
Eagle in flight t-shirt design
Choose a folder
All favorites
Create new
Save
Eagle in flight t-shirt design
Editable text
Print ready
for Merch
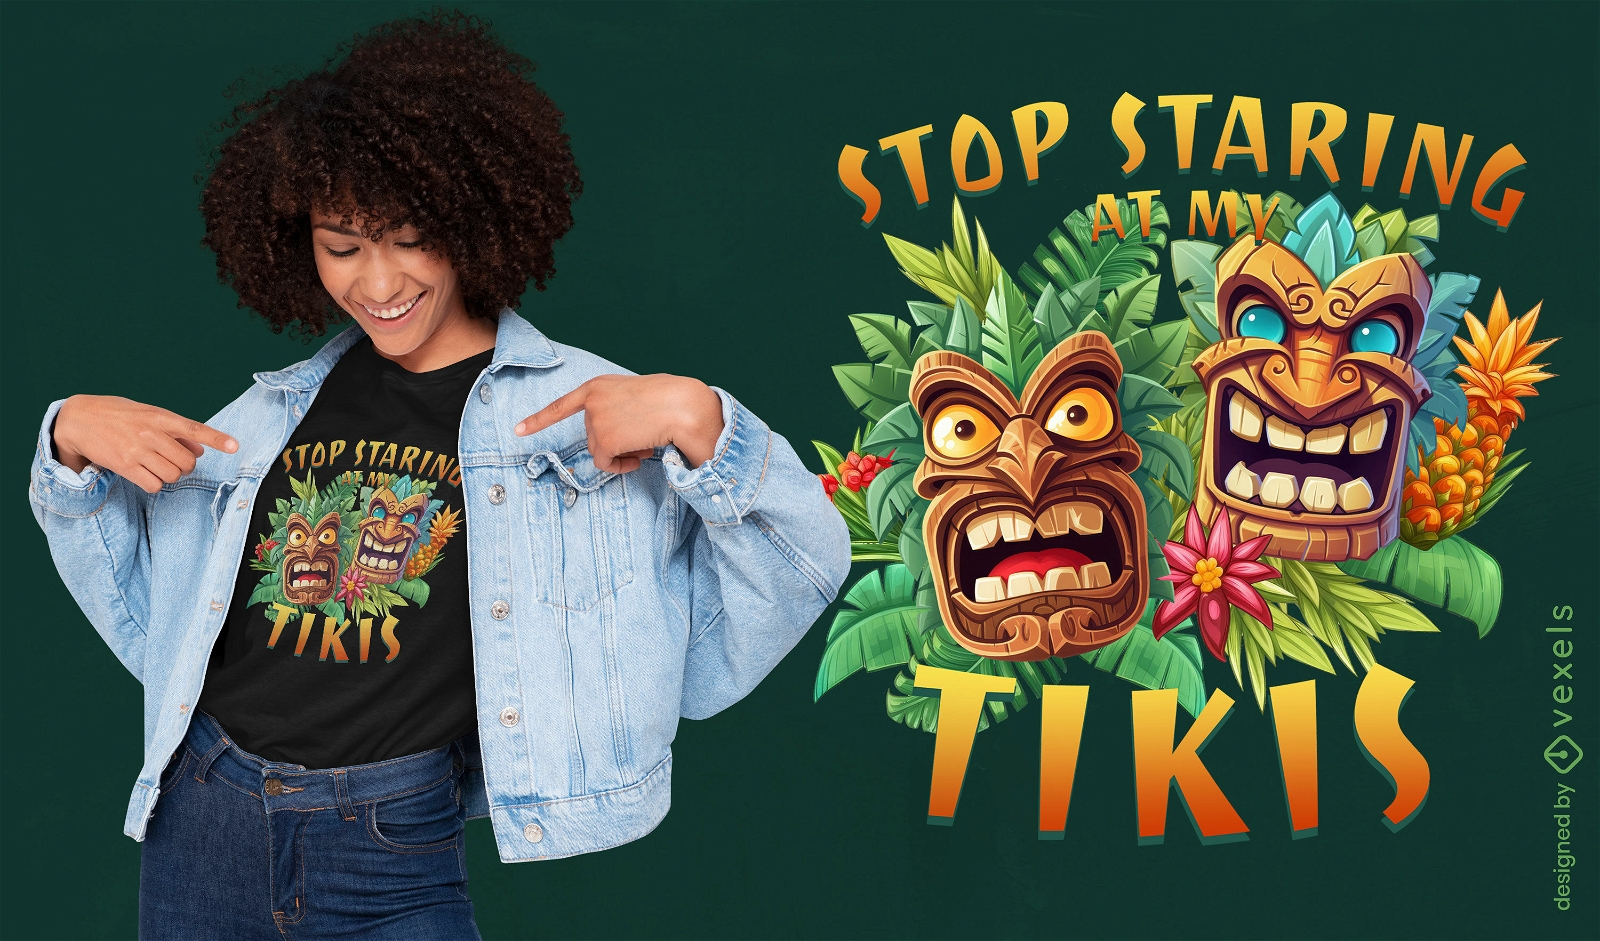
Tropical tikis humor t-shirt design
Choose a folder
All favorites
Create new
Save
Tropical tikis humor t-shirt design
Print ready
for Merch
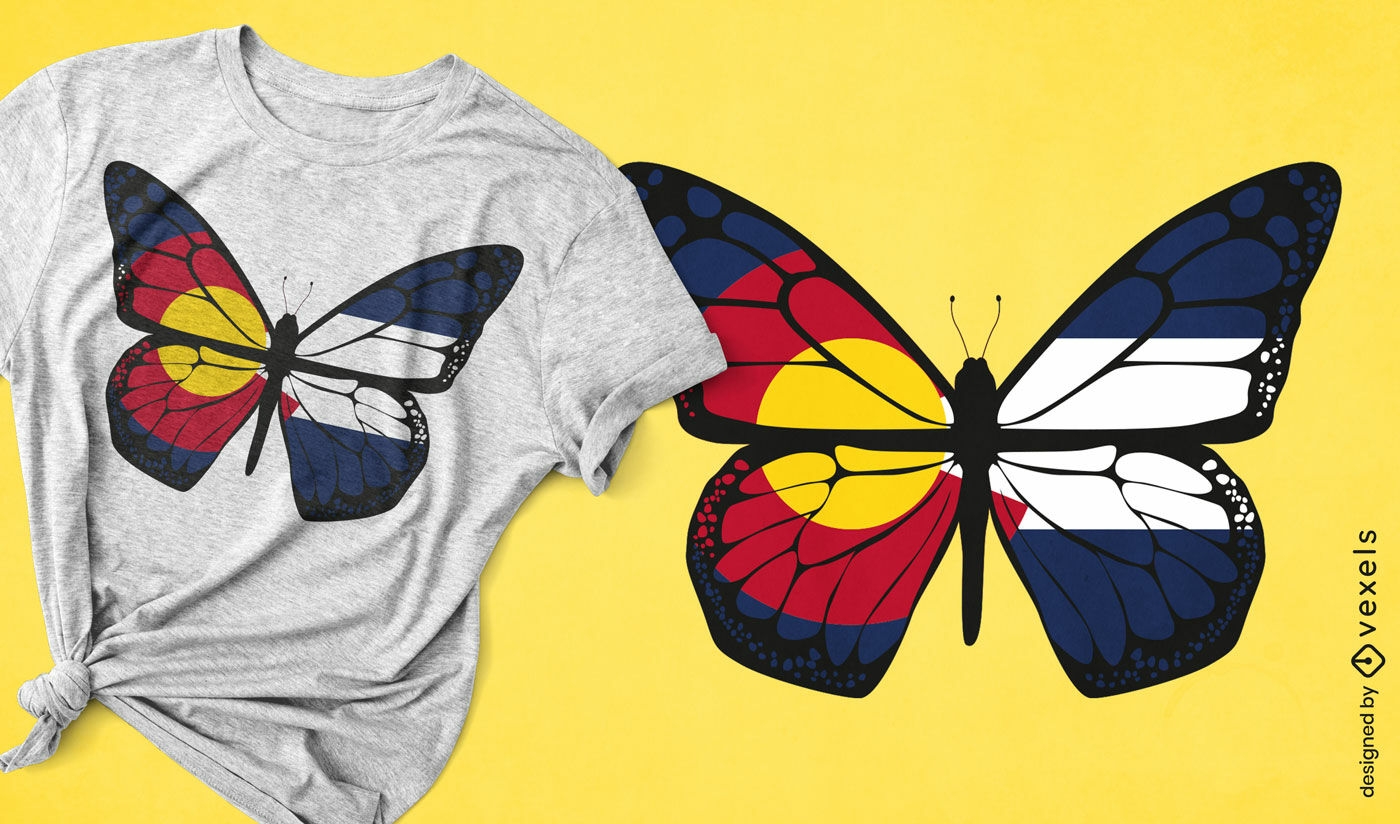
Colorado butterfly t-shirt design
Choose a folder
All favorites
Create new
Save
Colorado butterfly t-shirt design
Print ready
for Merch
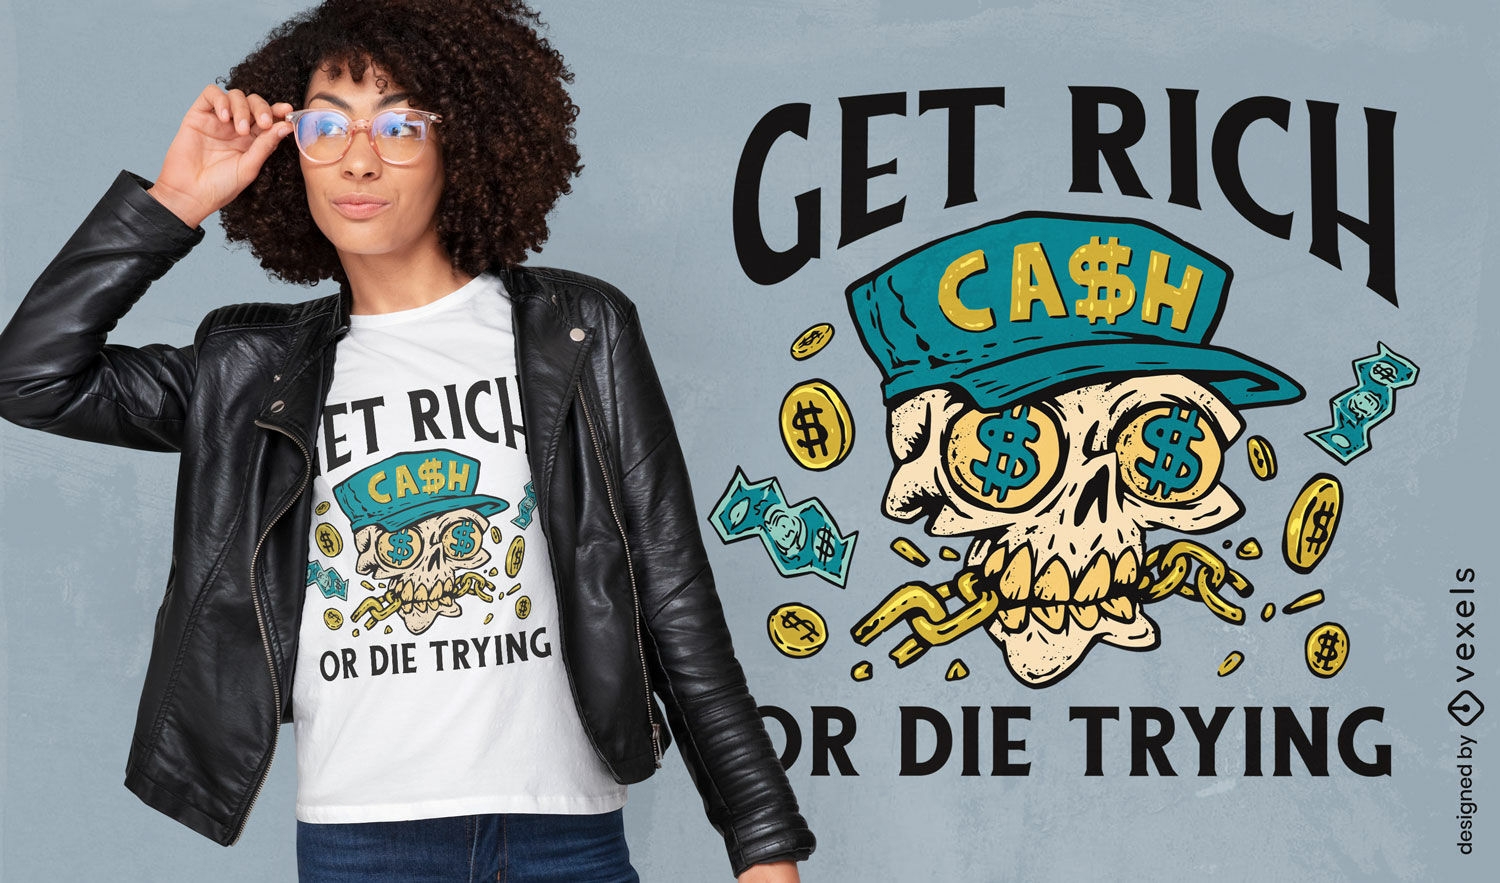
Funny skull quote t-shirt design
Choose a folder
All favorites
Create new
Save
Funny skull quote t-shirt design
Print ready
for Merch
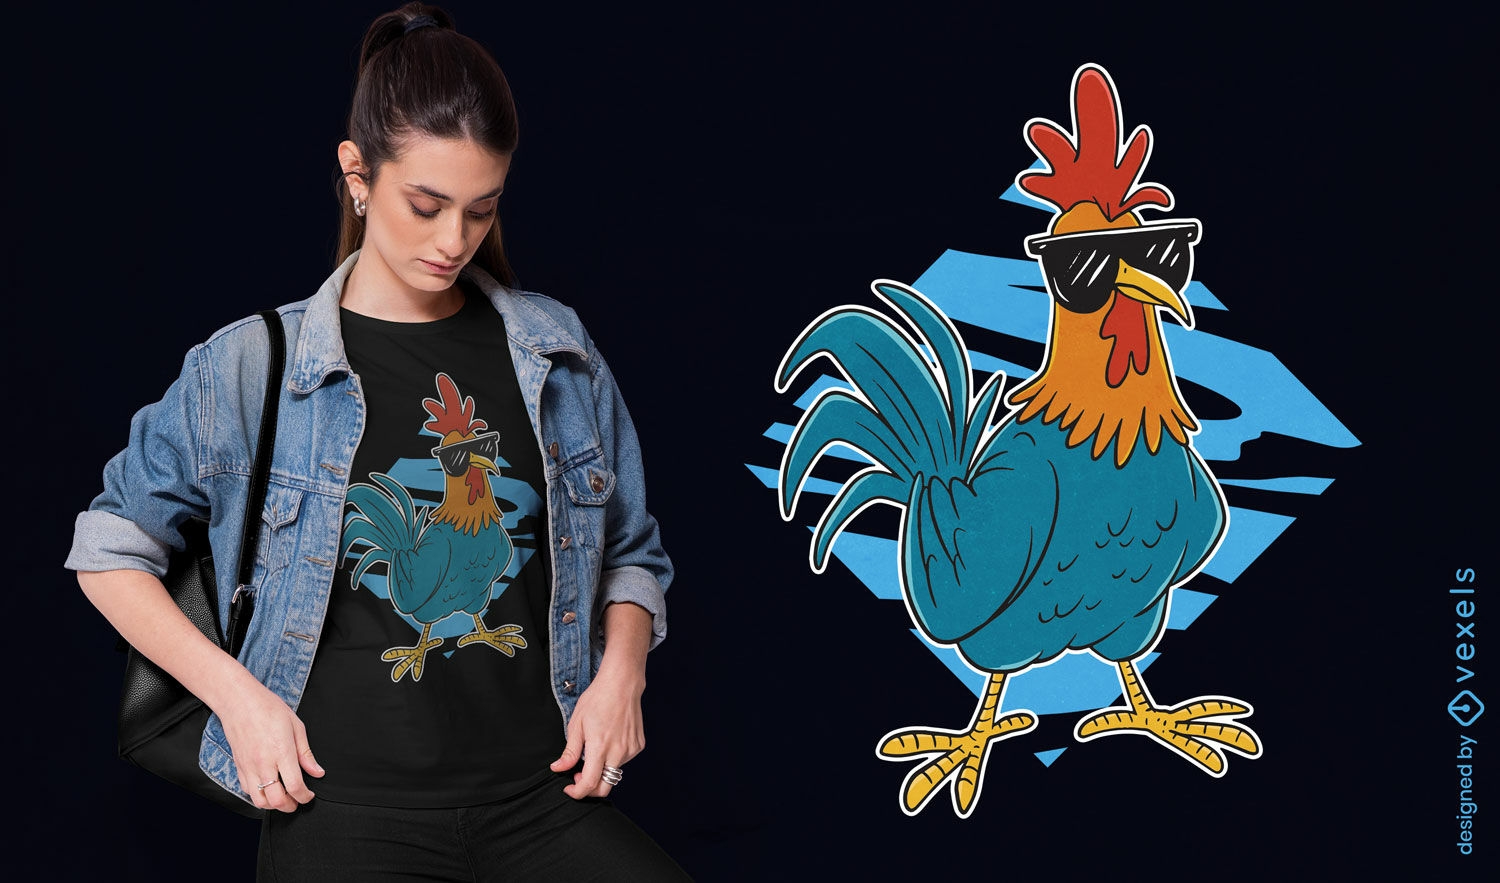
Cool rooster t-shirt design
Choose a folder
All favorites
Create new
Save
Cool rooster t-shirt design
Print ready
for Merch
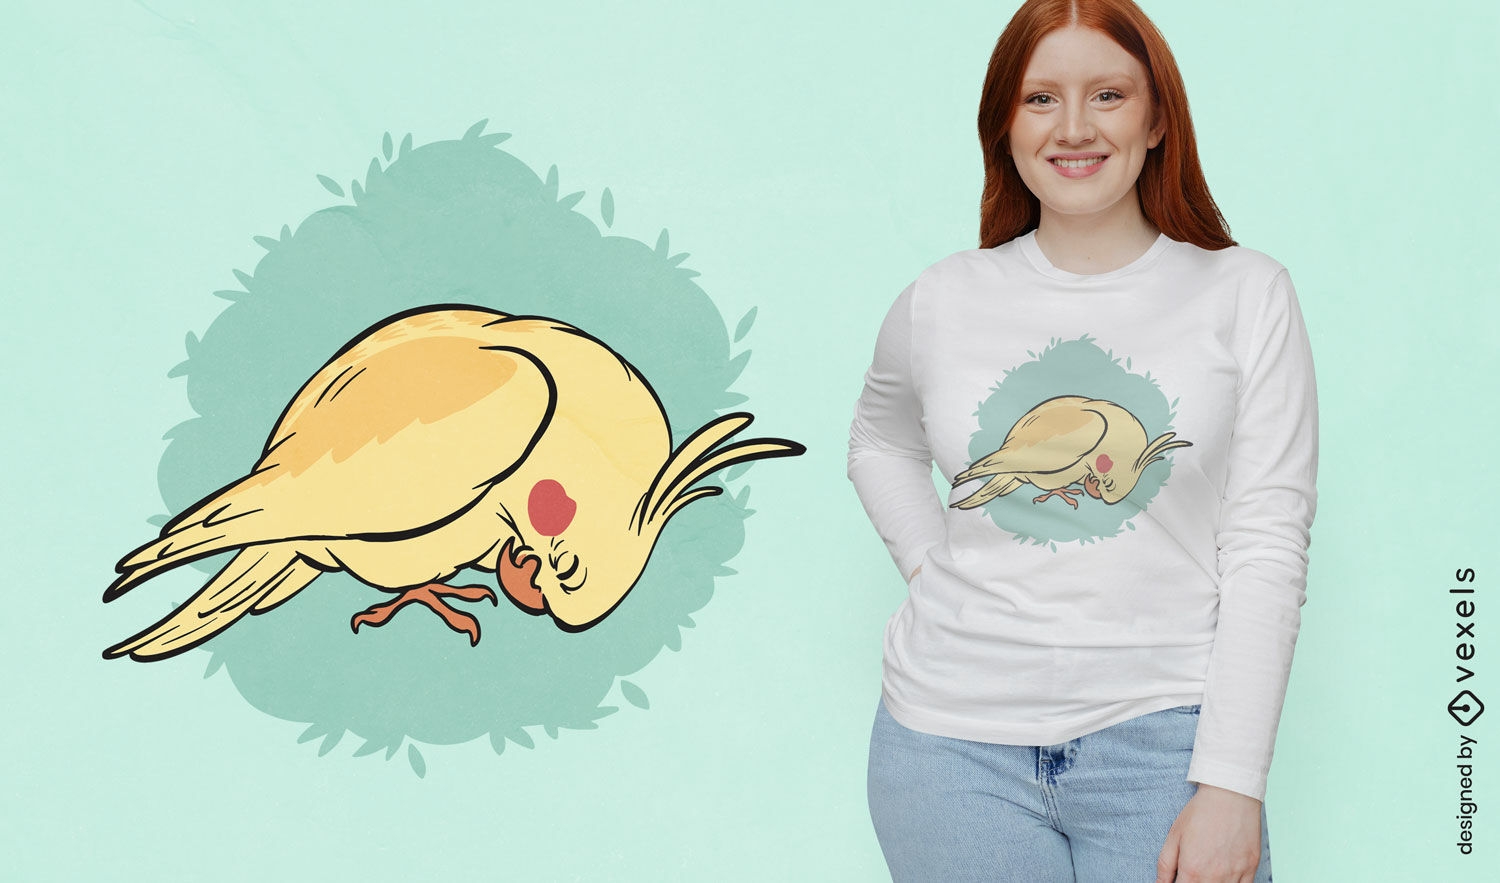
Cockatiel illustration t-shirt design
Choose a folder
All favorites
Create new
Save
Cockatiel illustration t-shirt design
Editable text
Print ready
for Merch
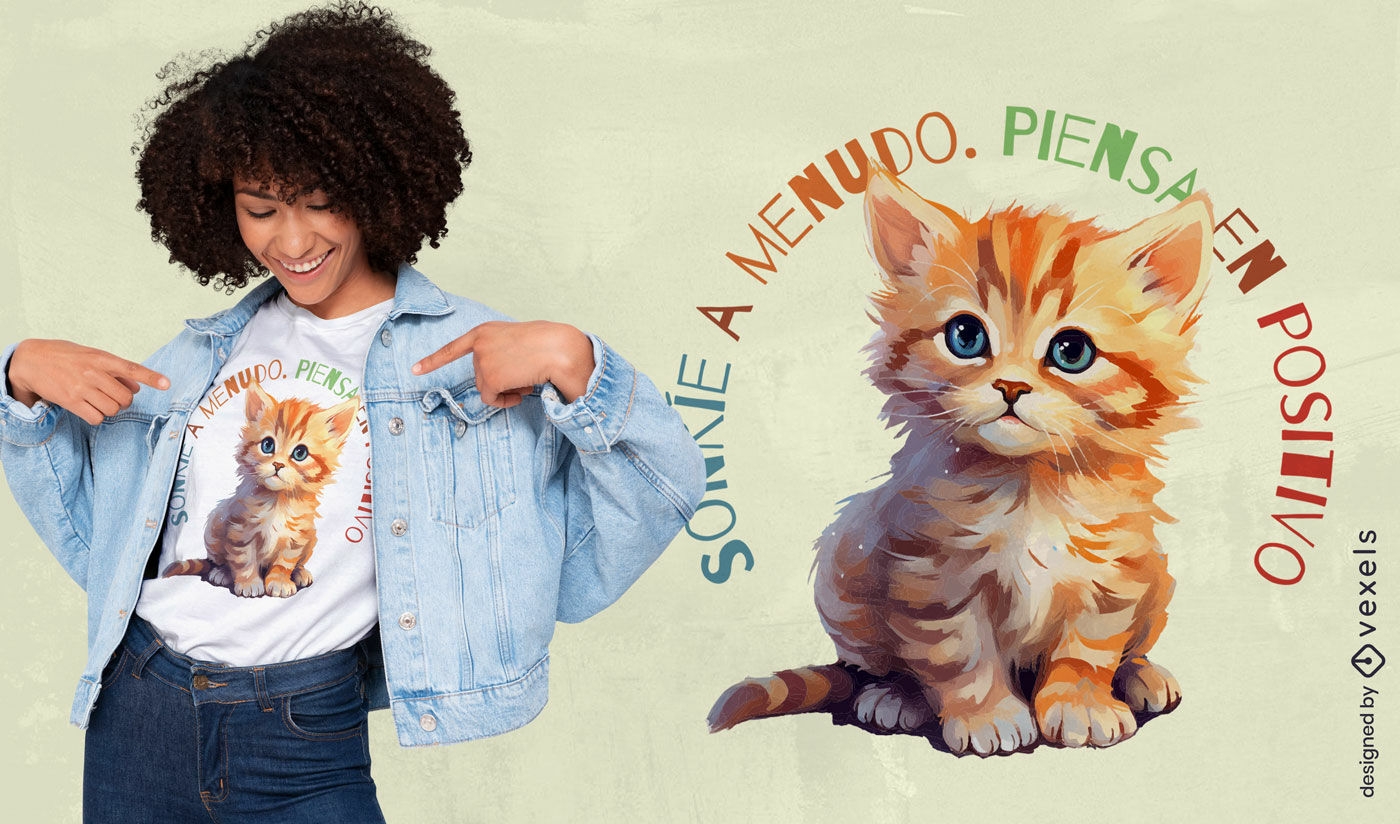
Positive thinking kitten t-shirt design
Choose a folder
All favorites
Create new
Save
Positive thinking kitten t-shirt design
Print ready
for Merch
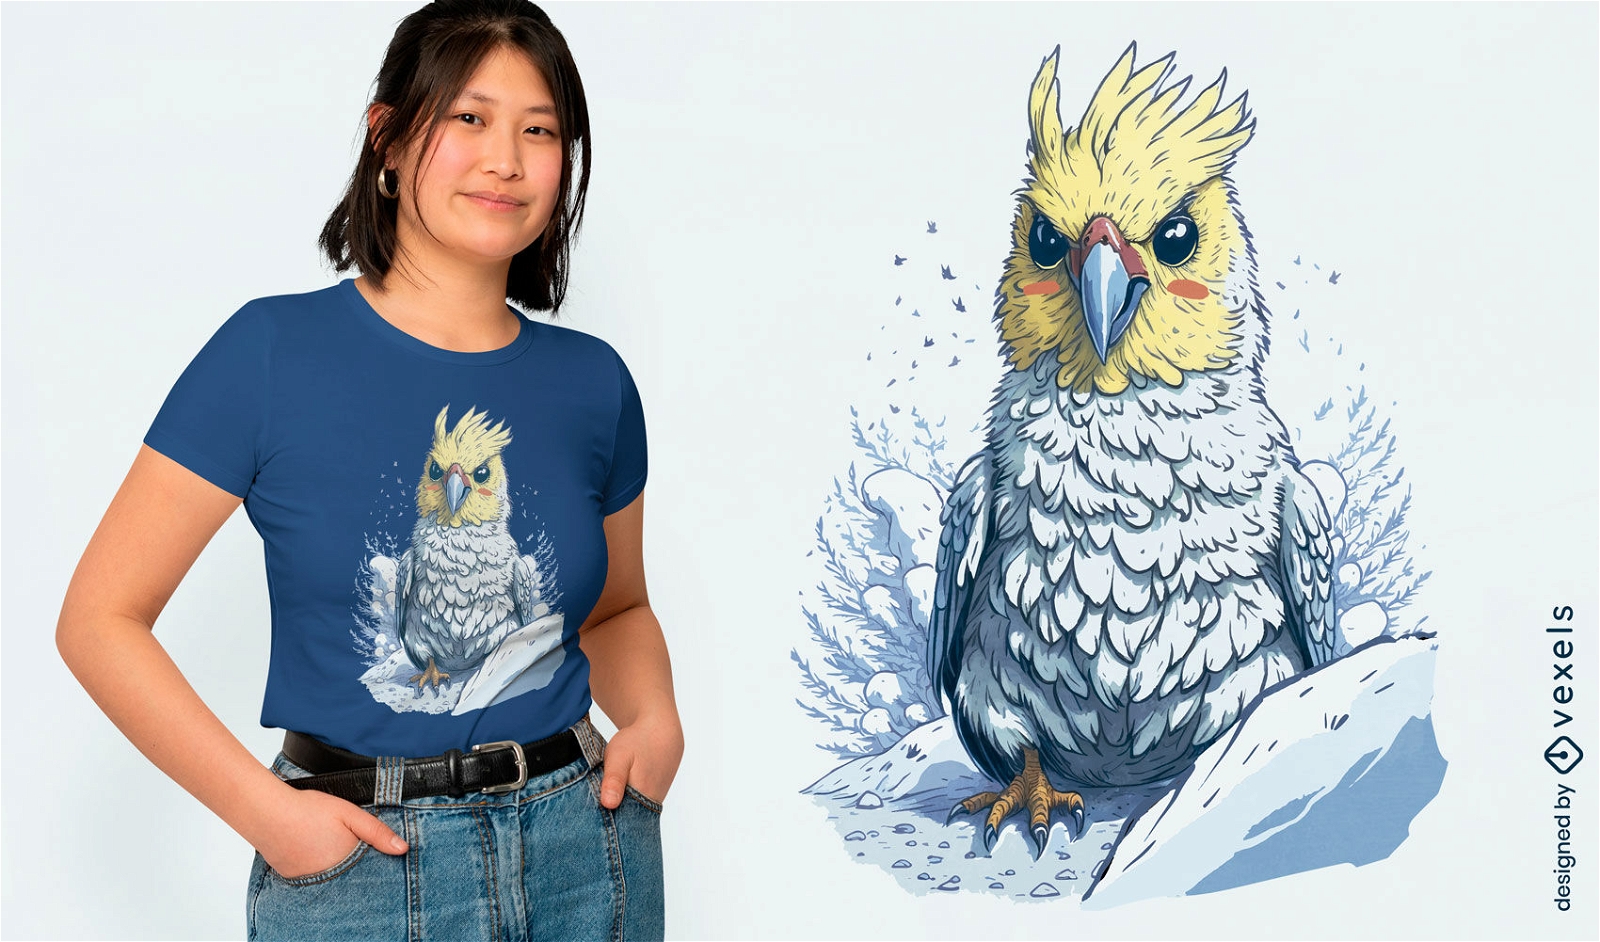
Cockatoo in snow t-shirt design
Choose a folder
All favorites
Create new
Save
Cockatoo in snow t-shirt design
Print ready
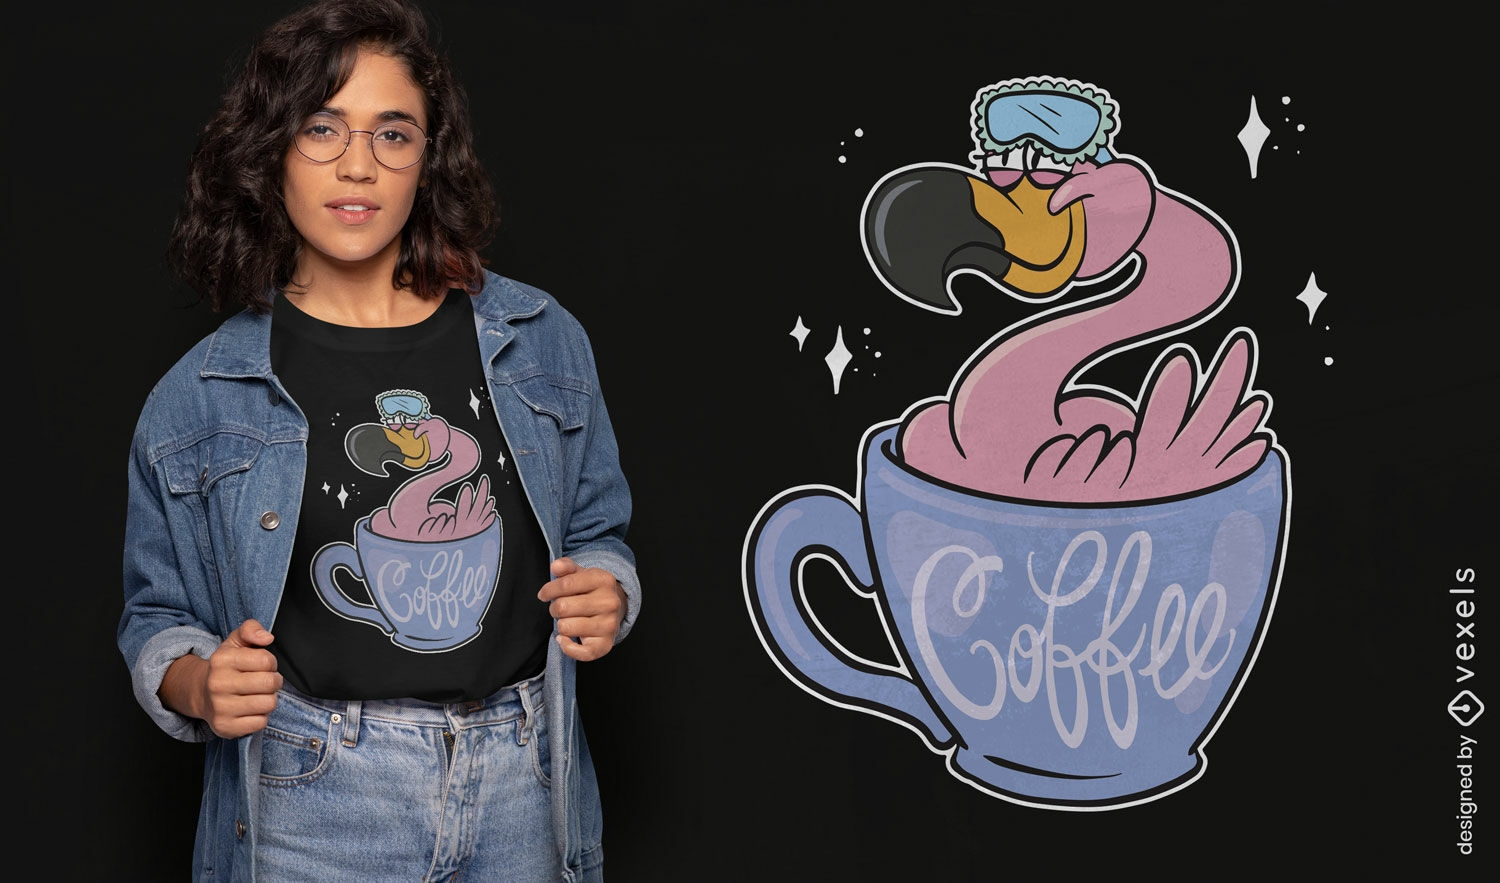
for Merch
Flamingo coffee t-shirt design
Choose a folder
All favorites
Create new
Save
Flamingo coffee t-shirt design
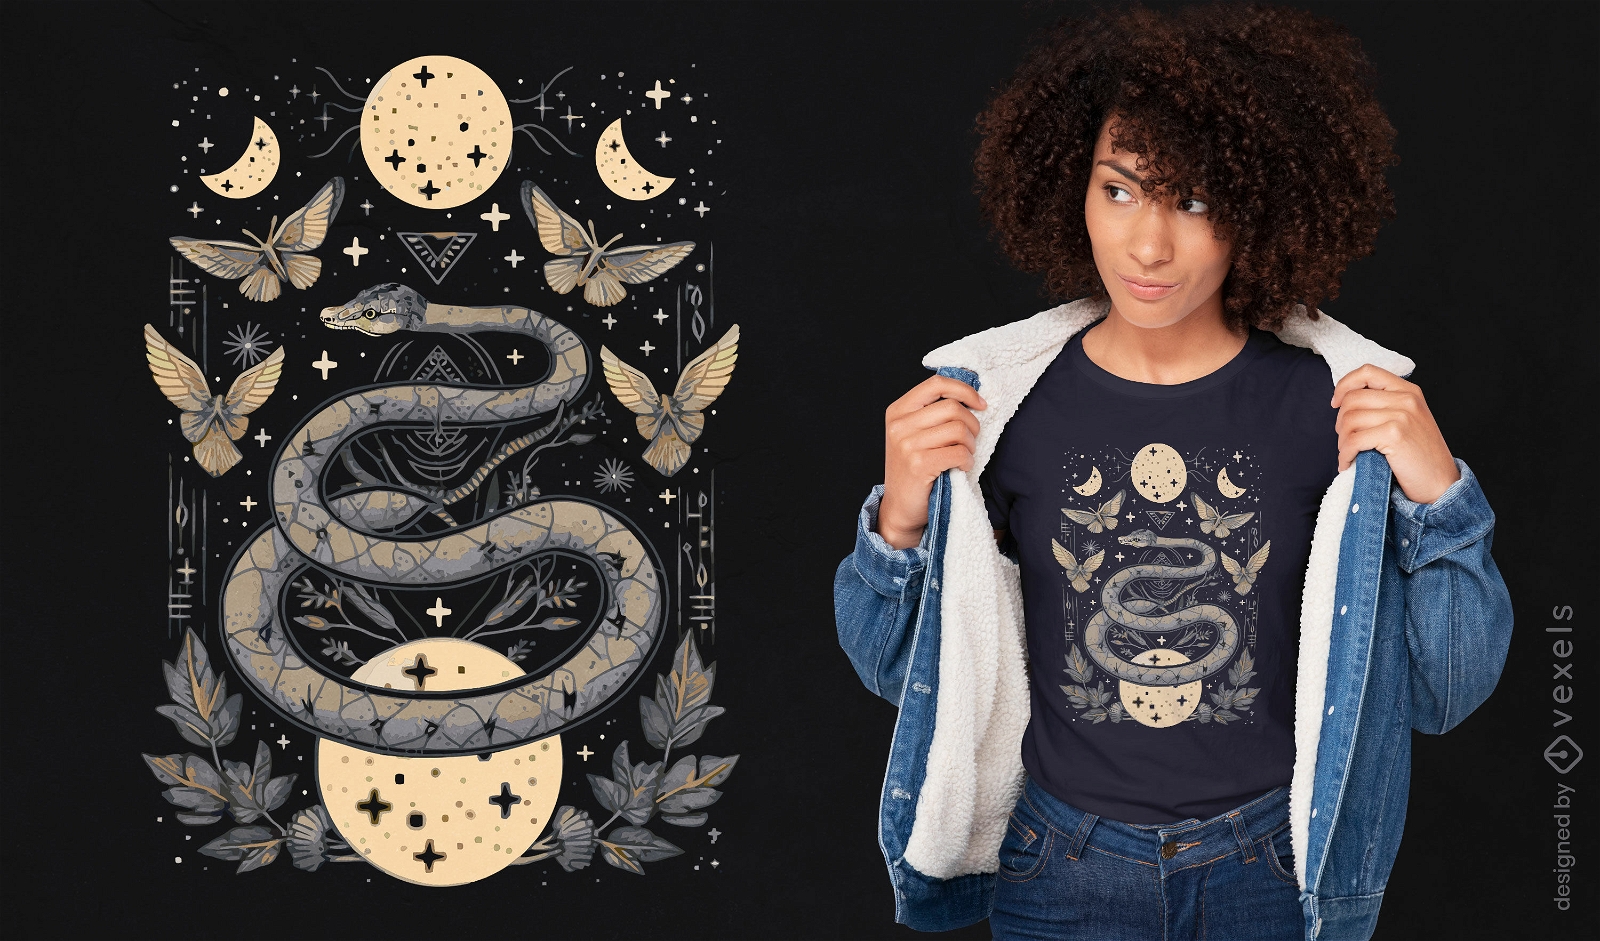
Print ready
for Merch
Celestial snake and stars t-shirt design
Choose a folder
All favorites
Create new
Save
Celestial snake and stars t-shirt design
Editable text
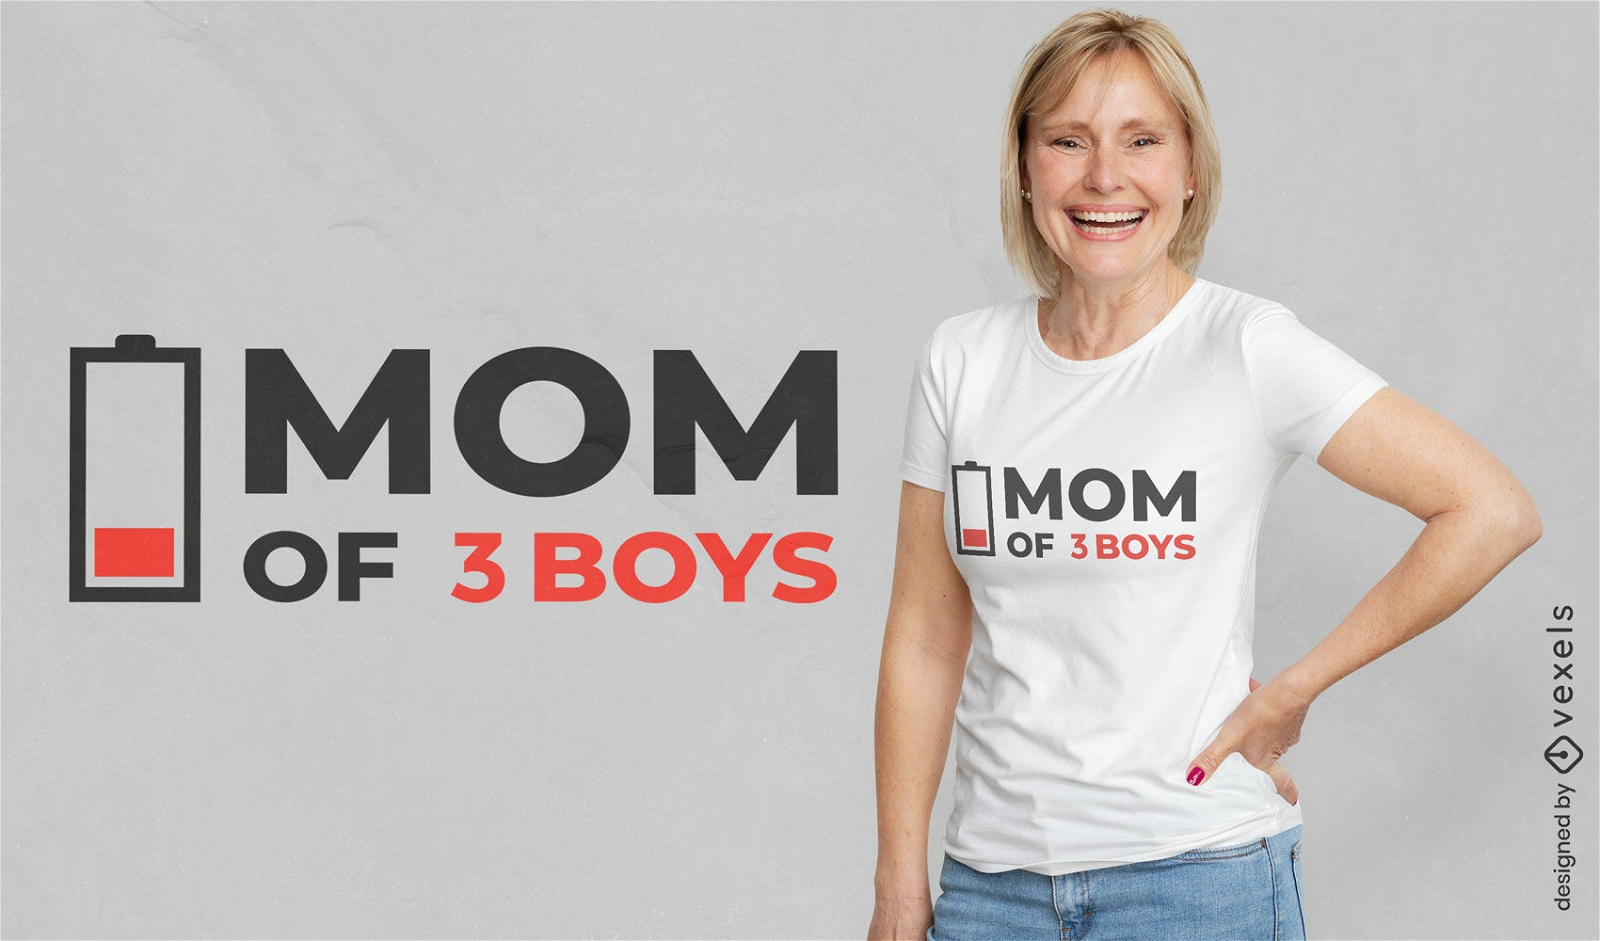
Print ready
for Merch
Mom of three boys quote t-shirt design
Choose a folder
All favorites
Create new
Save
Mom of three boys quote t-shirt design
Editable text
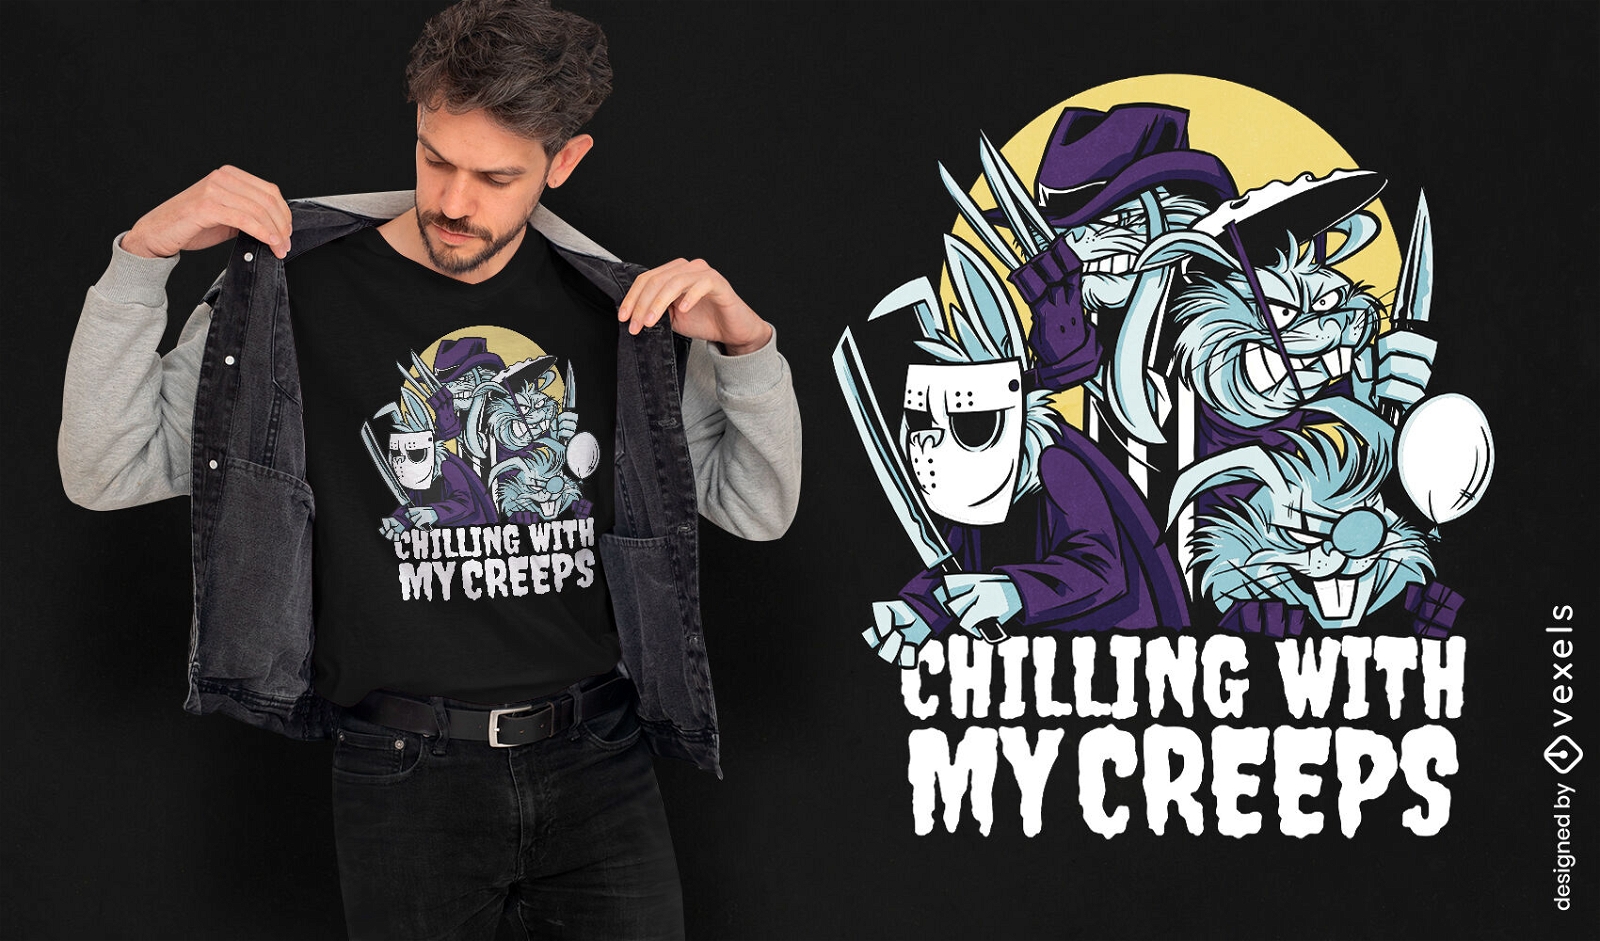
Print ready
for Merch
Halloween horror bunnies t-shirt design
Choose a folder
All favorites
Create new
Save
Halloween horror bunnies t-shirt design
Print ready
for Merch
Welder man on fire working t-shirt design
Choose a folder
All favorites
Create new
Save
Welder man on fire working t-shirt design
Boost Your Business
With The Leading Graphic Platform For Merch.
SEE PLANS
Next
of 817
prev page
next page