Design Library
Explore Designs
New Merch Designs
Trending Merch Designs
Vectors
PNGs & SVGs
Mockups
T-Shirts
T-Shirt PSD Templates
KDP Designs
Phone Cases
Pillows
Tote Bags
Posters
Mugs
Design Tools
Designer
New!
T-shirt Maker
Mockup Generator
Quote Generator
Logo Maker
Resources
Merch Digest
Blog
Help Center
Creators Program
Learn About Merch
Changelog
API Access
Pricing
Loading...
Sign Up
Login
All
grafico
Design Library
Explore Designs
New Merch Designs
Trending Merch Designs
Vectors
PNGs & SVGs
Mockups
T-Shirts
T-Shirt PSD Templates
KDP Designs
Phone Cases
Pillows
Tote Bags
Posters
Mugs
Design Tools
Designer
New!
T-shirt Maker
Mockup Generator
Quote Generator
Logo Maker
Resources
Merch Digest
Blog
Help Center
Creators Program
Learn About Merch
Changelog
API Access
PLANS
All
grafico
40815 grafico designs graphics for t-shirt and print on demand merch
Download grafico t-shirt designs and other merch graphics like book covers, phone cases, tote bags and more.
Sort by
Most relevant
Sponsored results by
Get 15% off with code: VEXELS15
Show more
Print ready
for Merch
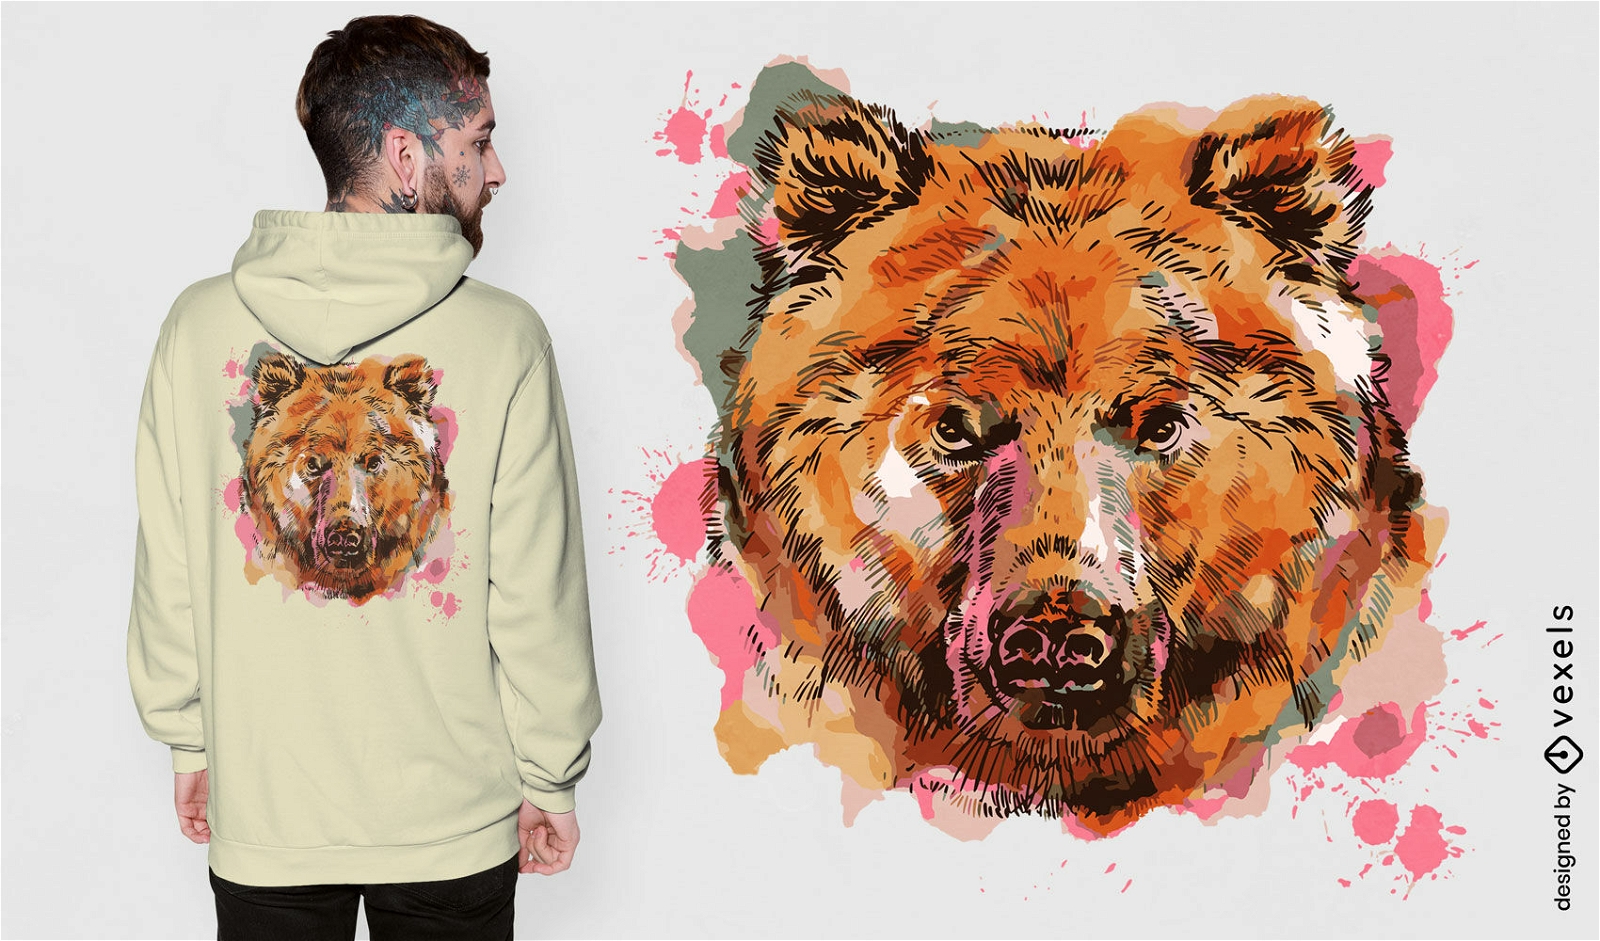
Bear wild animal watercolor t-shirt design
Choose a folder
All favorites
Create new
Save
Bear wild animal watercolor t-shirt design
Print ready
for Merch
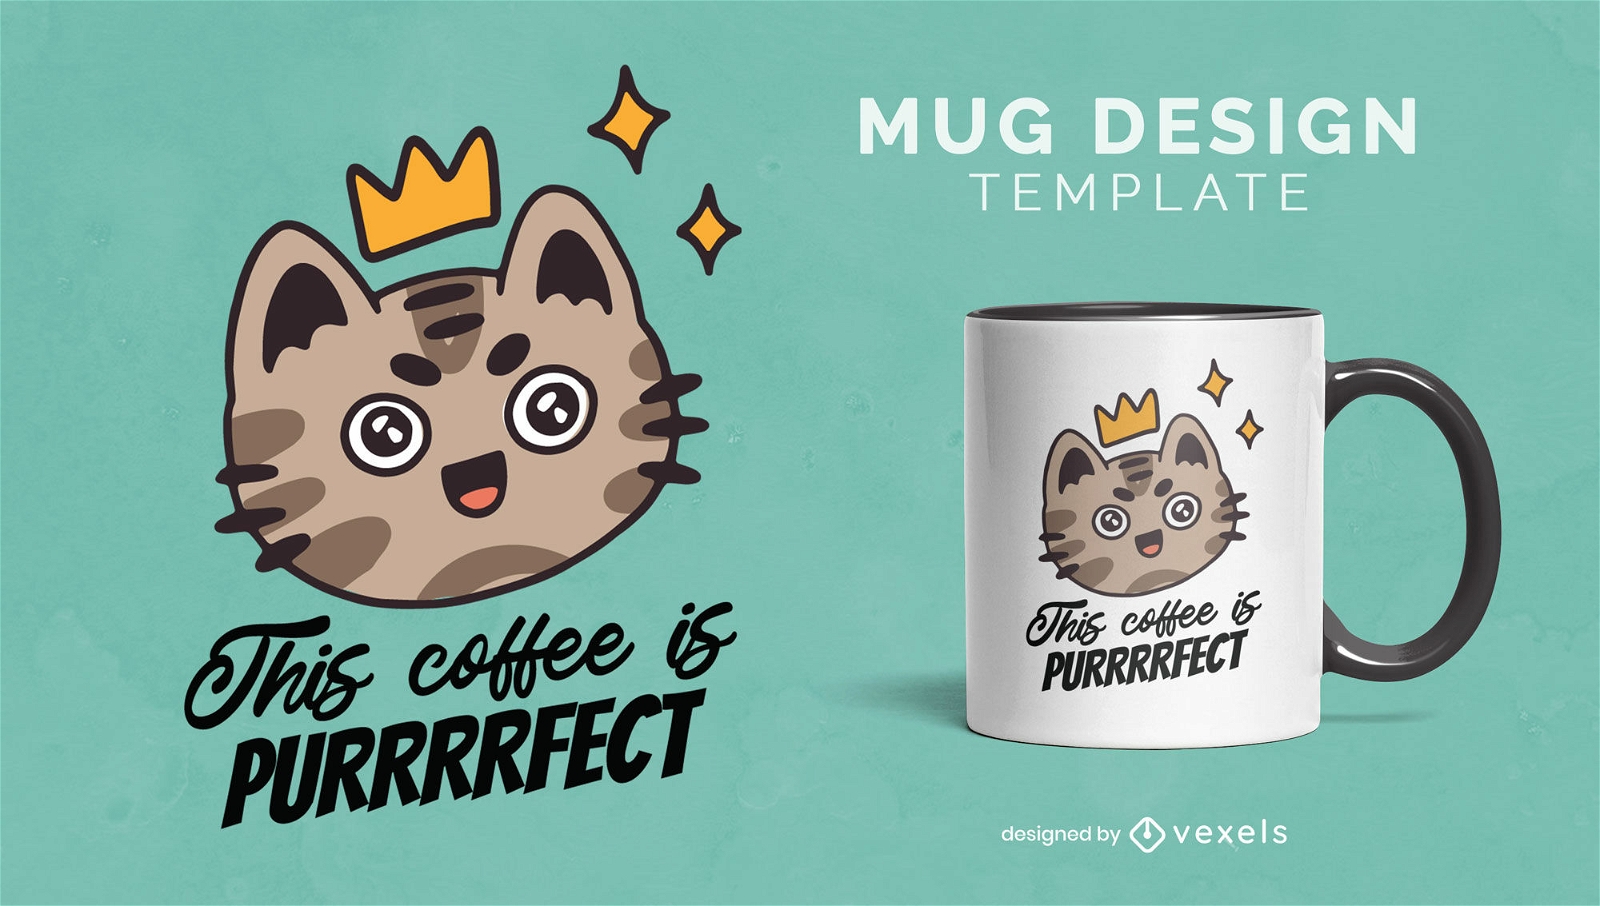
Coffee lover cat mug design
Choose a folder
All favorites
Create new
Save
Coffee lover cat mug design
Print ready
for Merch
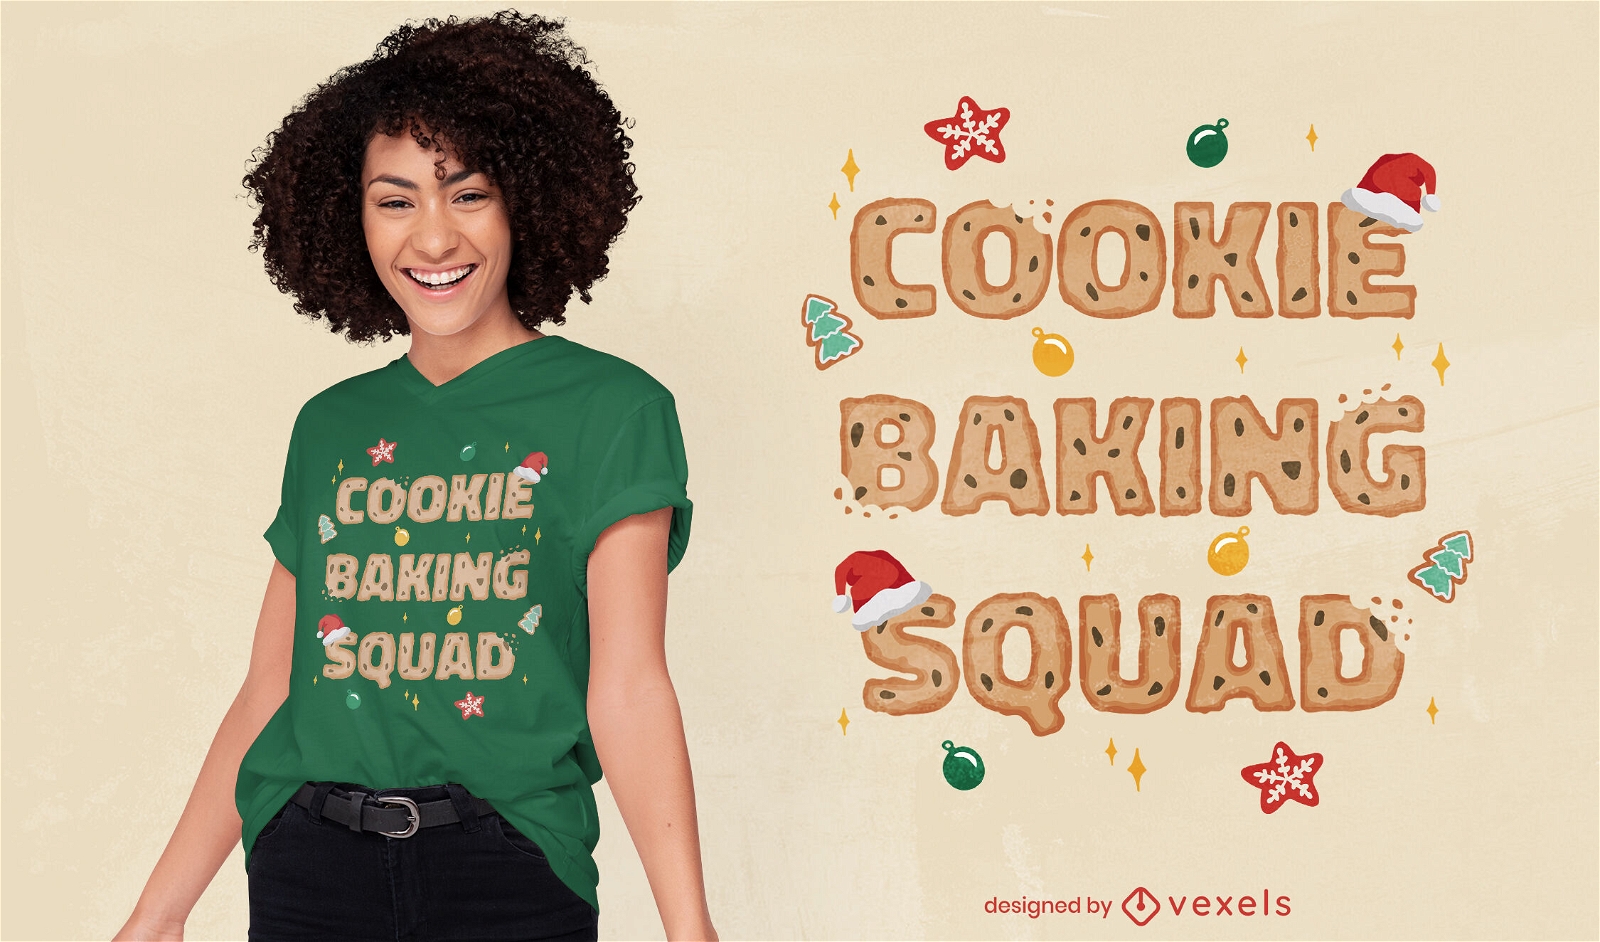
Cookie baking squad Christmas t-shirt design
Choose a folder
All favorites
Create new
Save
Cookie baking squad Christmas t-shirt design
Print ready
for Merch
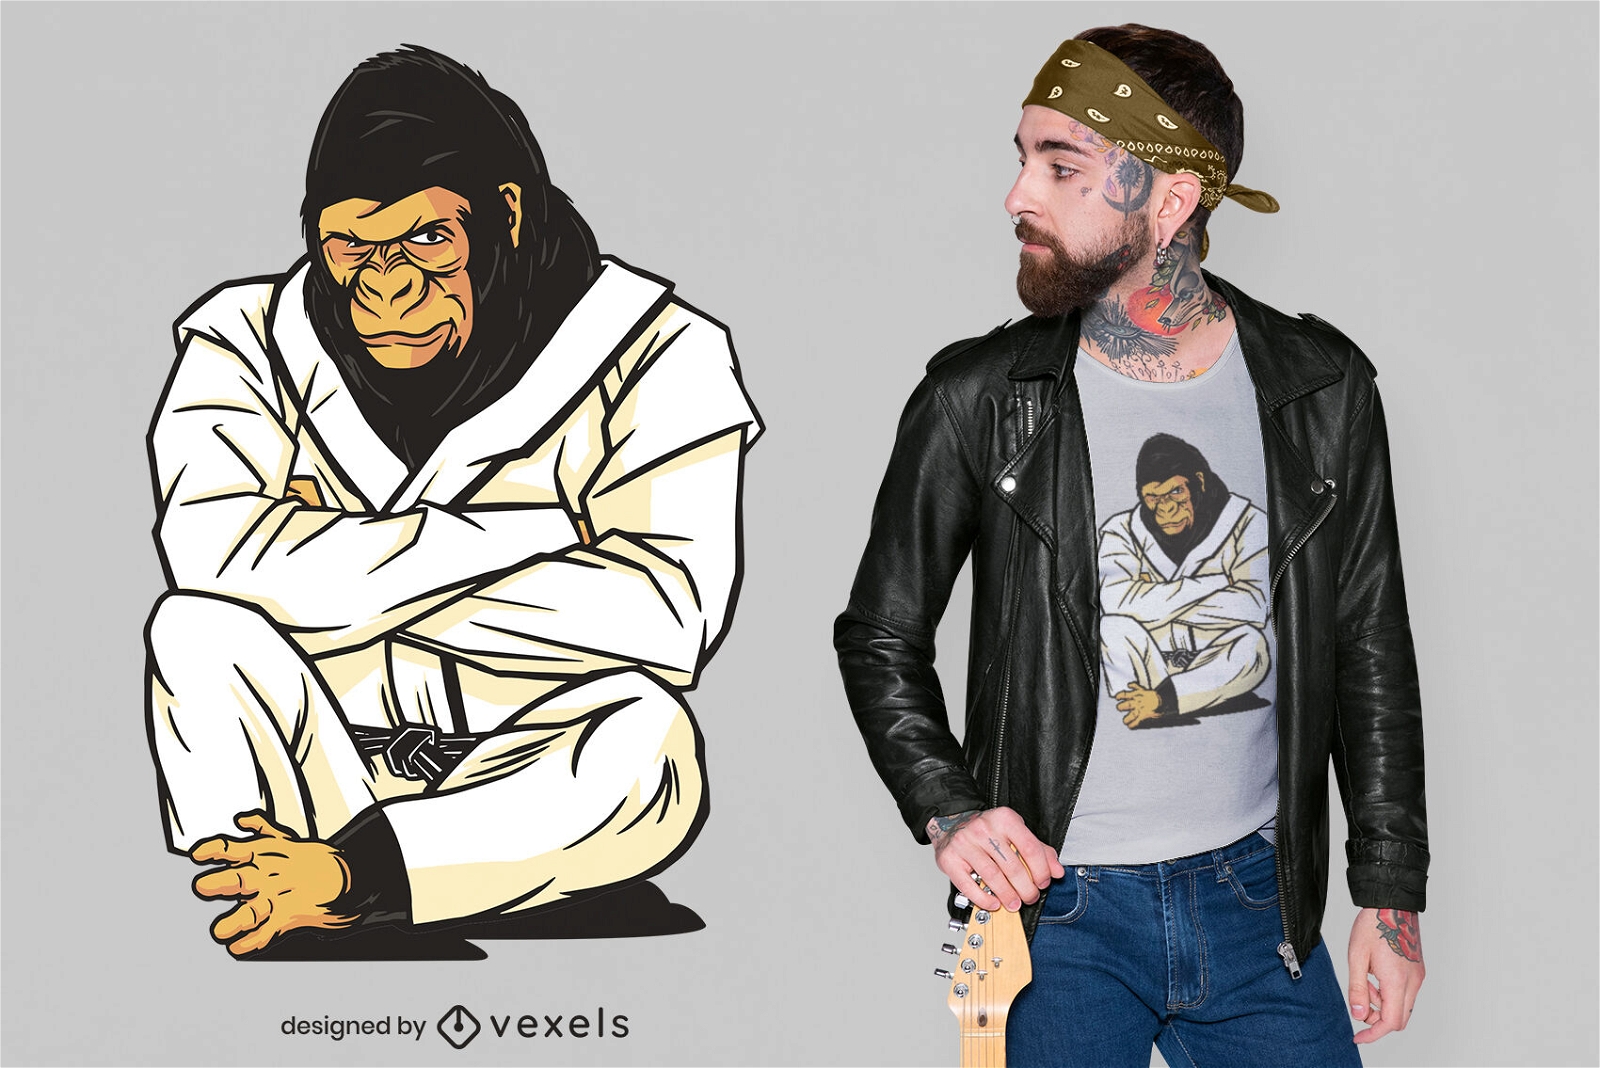
Cool karate gorilla t-shirt design
Choose a folder
All favorites
Create new
Save
Cool karate gorilla t-shirt design
Print ready
for Merch
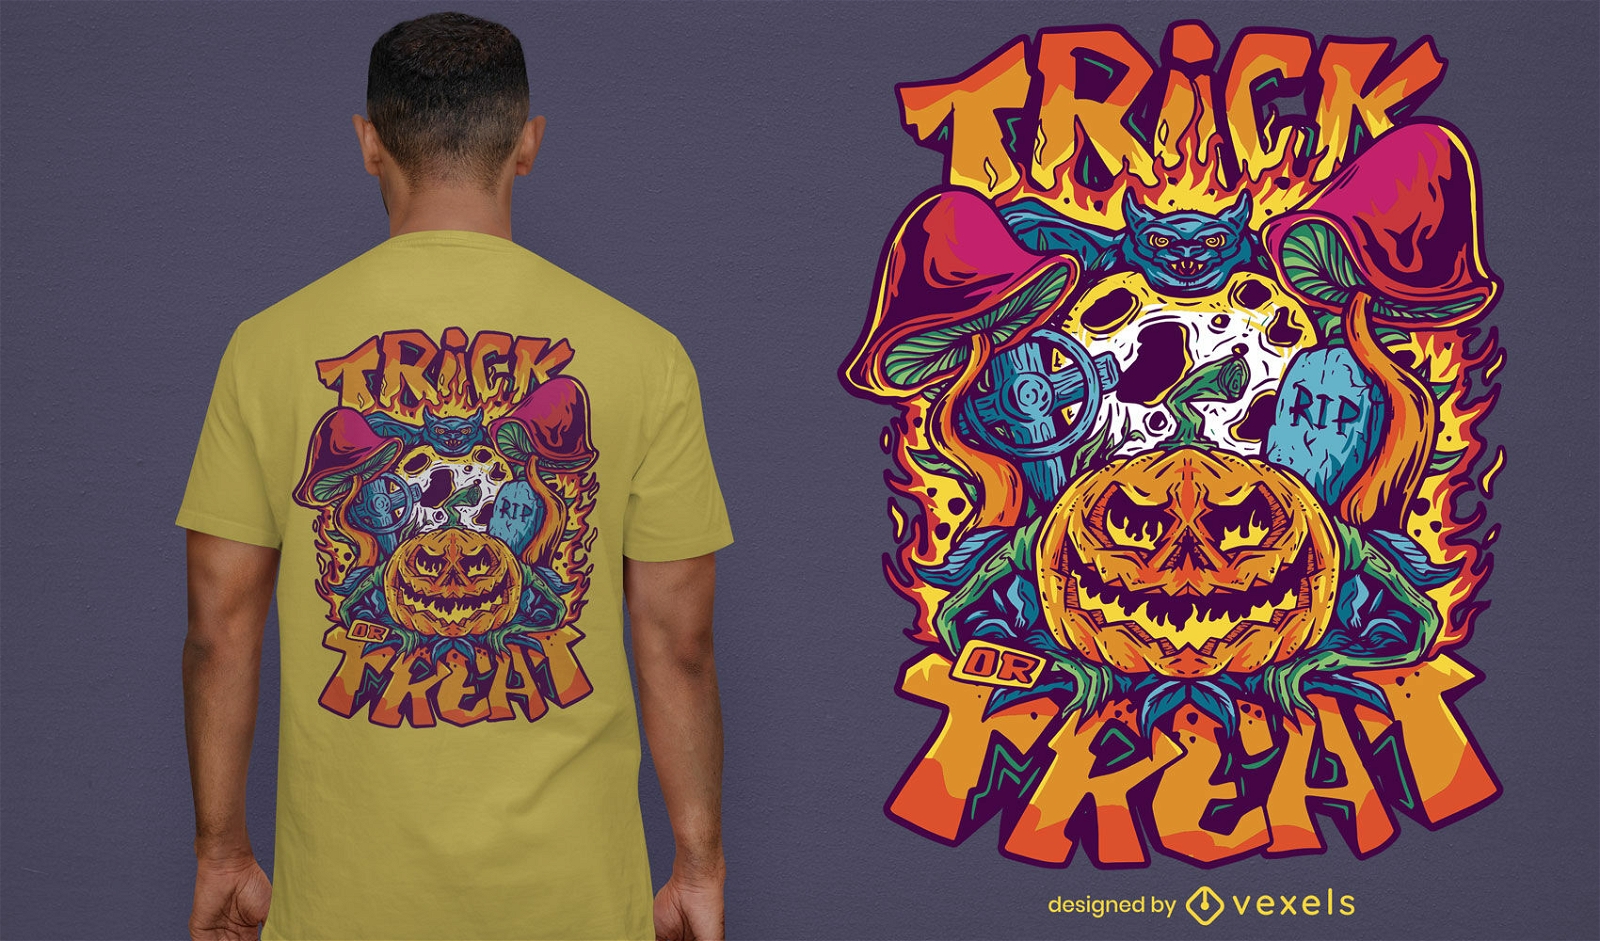
Trippy trick or treat Halloween t-shirt design
Choose a folder
All favorites
Create new
Save
Trippy trick or treat Halloween t-shirt design
Print ready
for Merch
Tribal owl t-shirt design
Choose a folder
All favorites
Create new
Save
Tribal owl t-shirt design
Print ready
for Merch
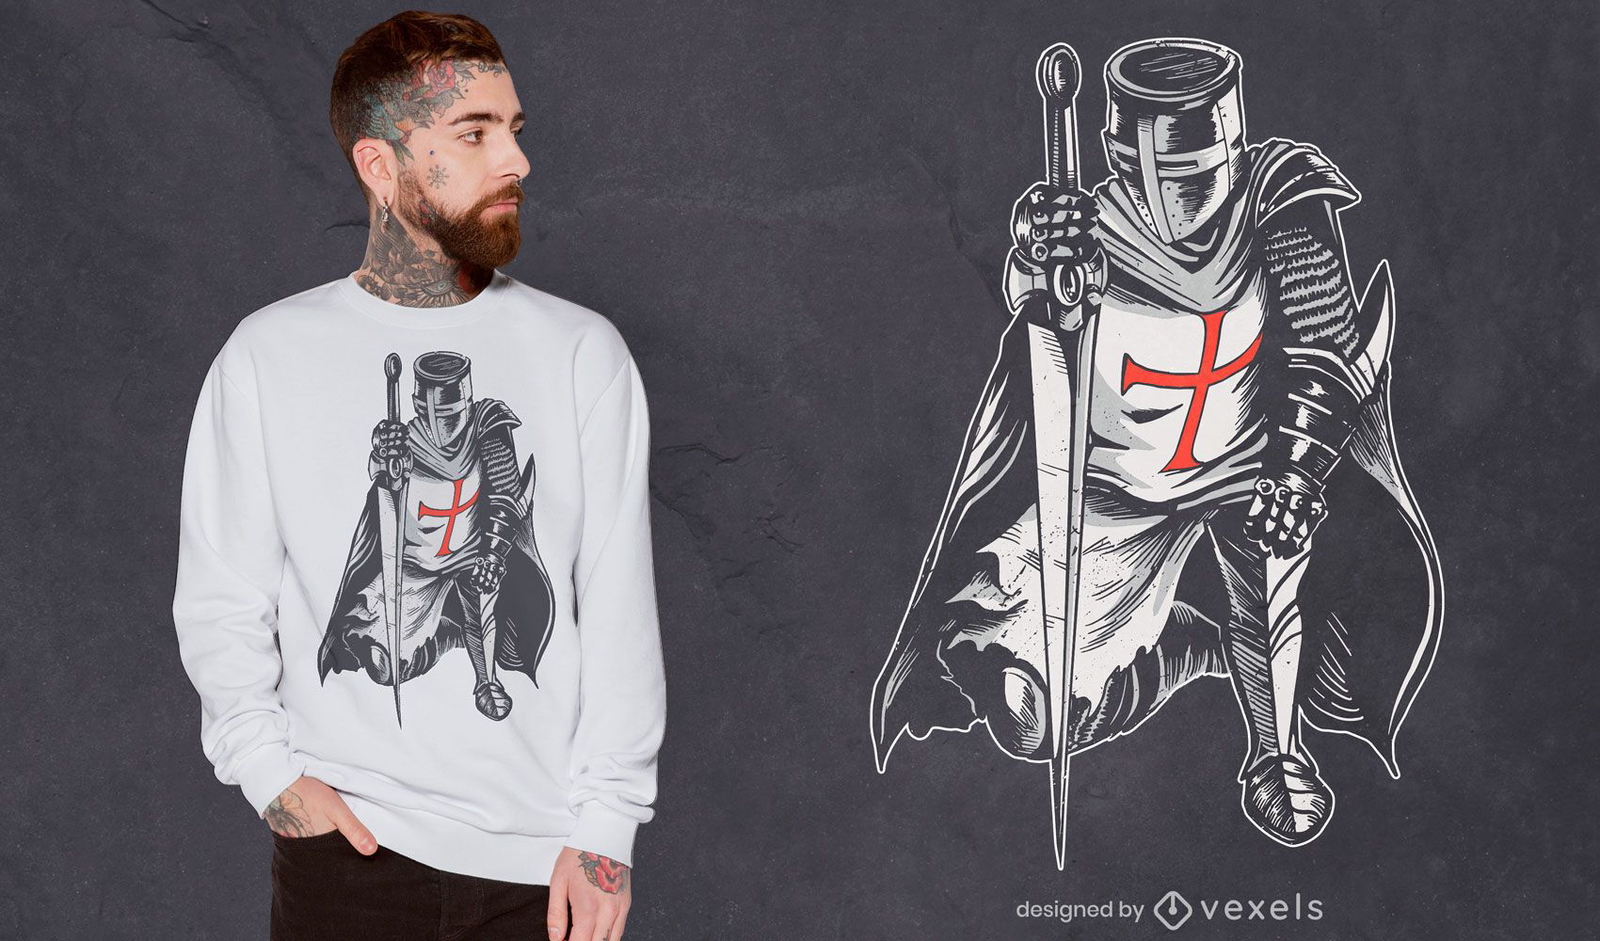
Warrior knight in armour t-shirt design
Choose a folder
All favorites
Create new
Save
Warrior knight in armour t-shirt design
Print ready
for Merch
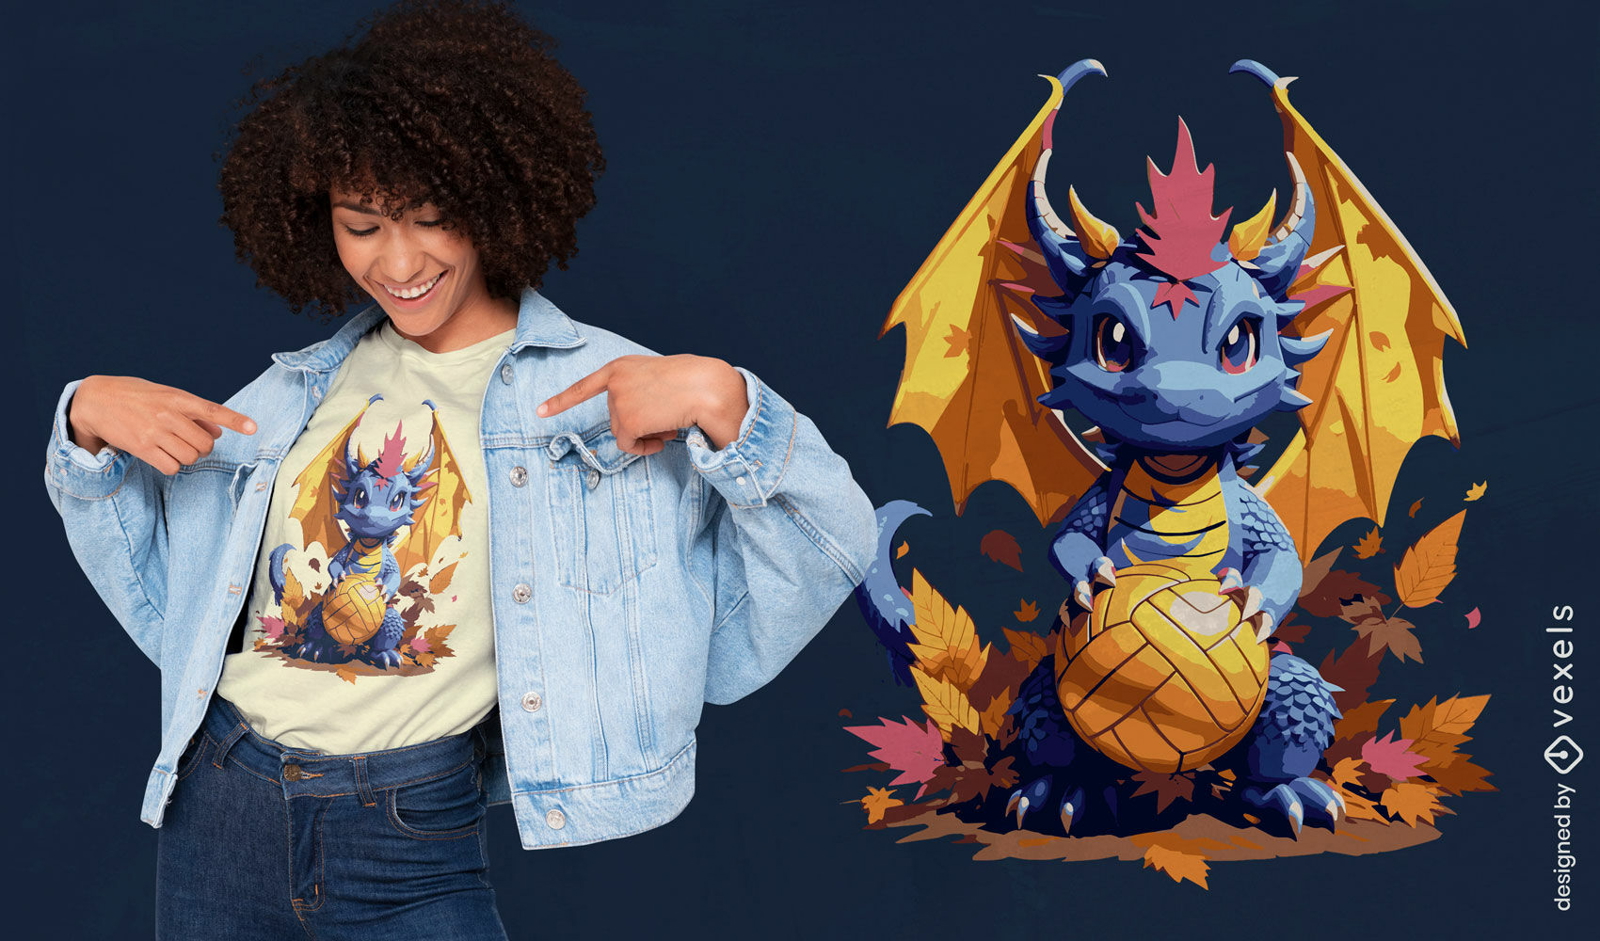
Autumn dragon volleyball t-shirt design
Choose a folder
All favorites
Create new
Save
Autumn dragon volleyball t-shirt design
Print ready
for Merch
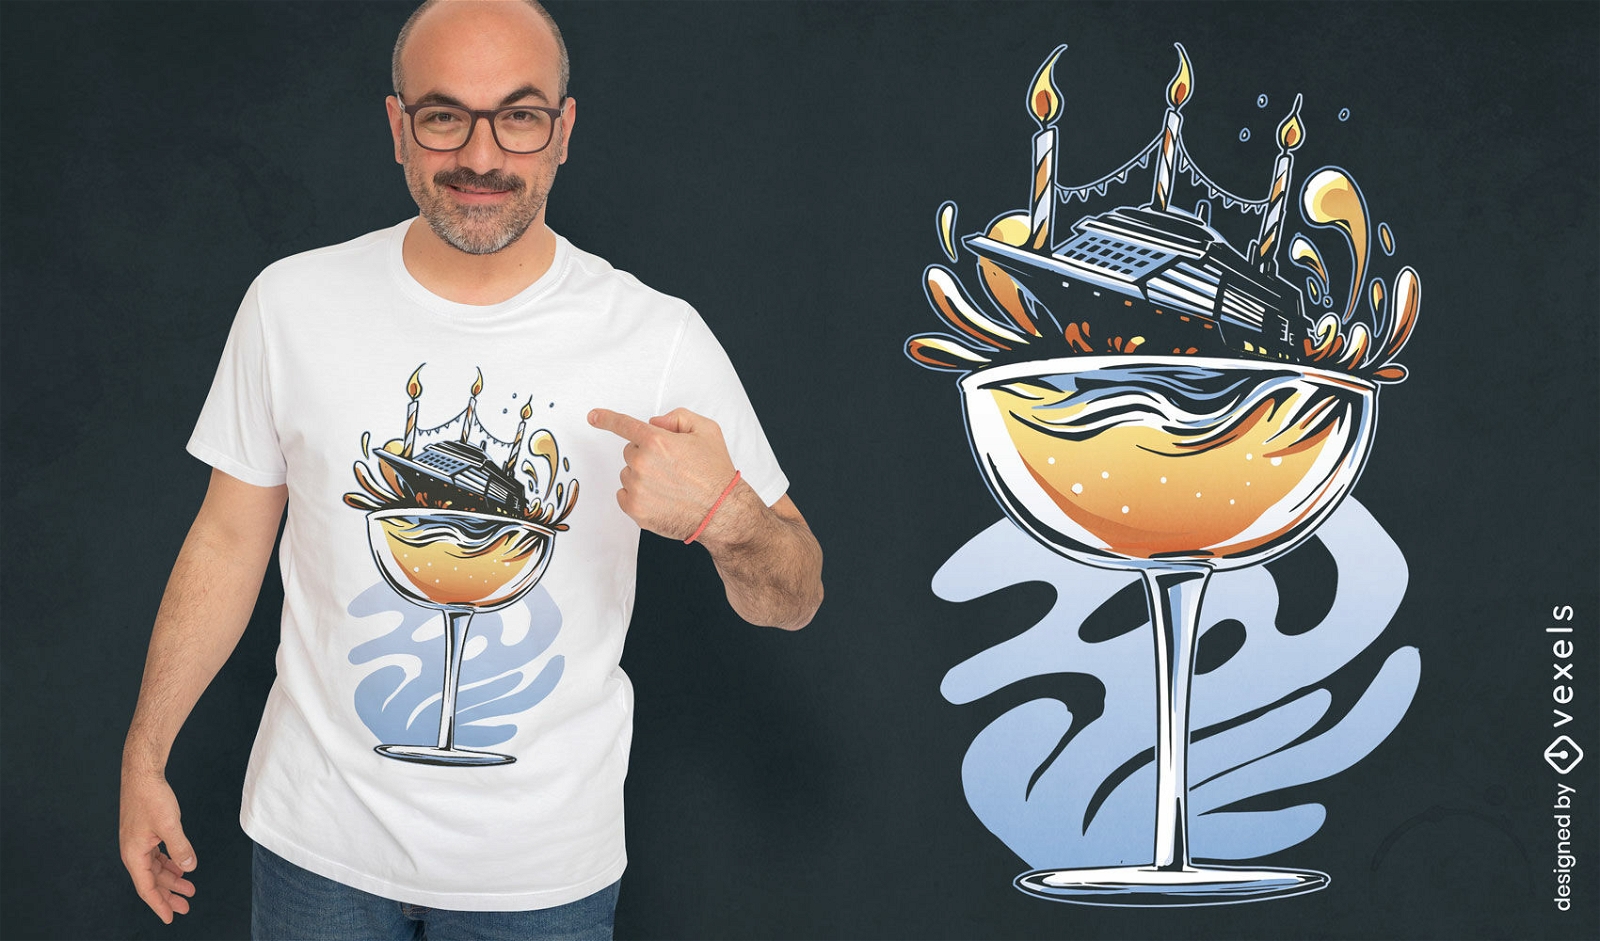
Cruise ship on cocktail glass t-shirt design
Choose a folder
All favorites
Create new
Save
Cruise ship on cocktail glass t-shirt design
Print ready
for Merch
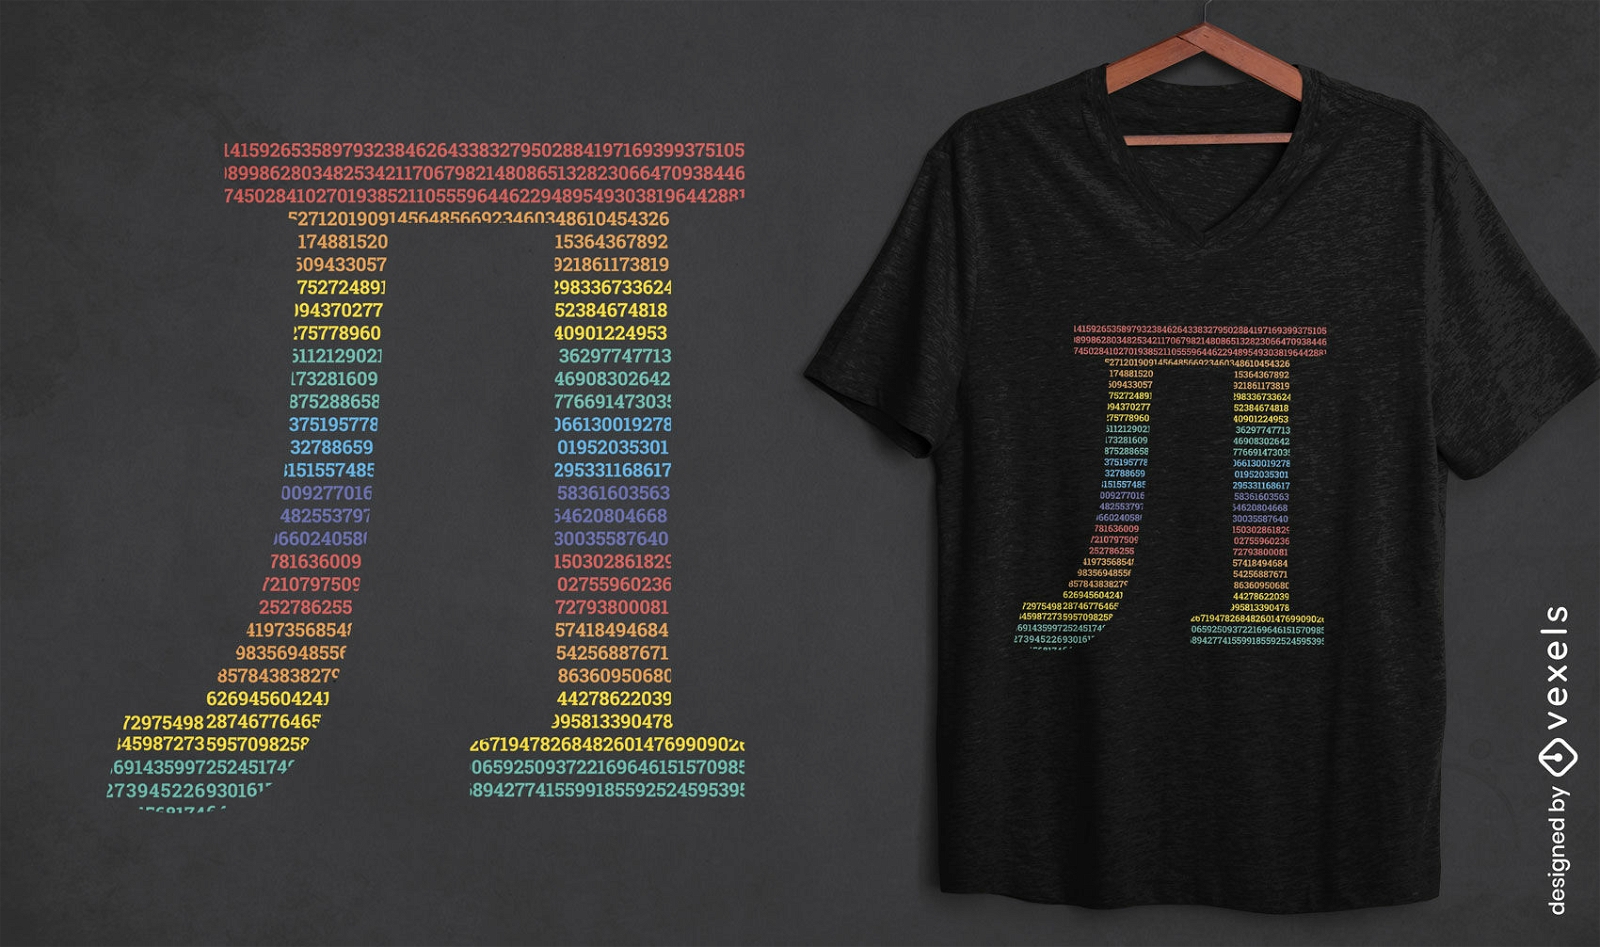
Rainbow color pi sign t-shirt design
Choose a folder
All favorites
Create new
Save
Rainbow color pi sign t-shirt design
Print ready
for Merch
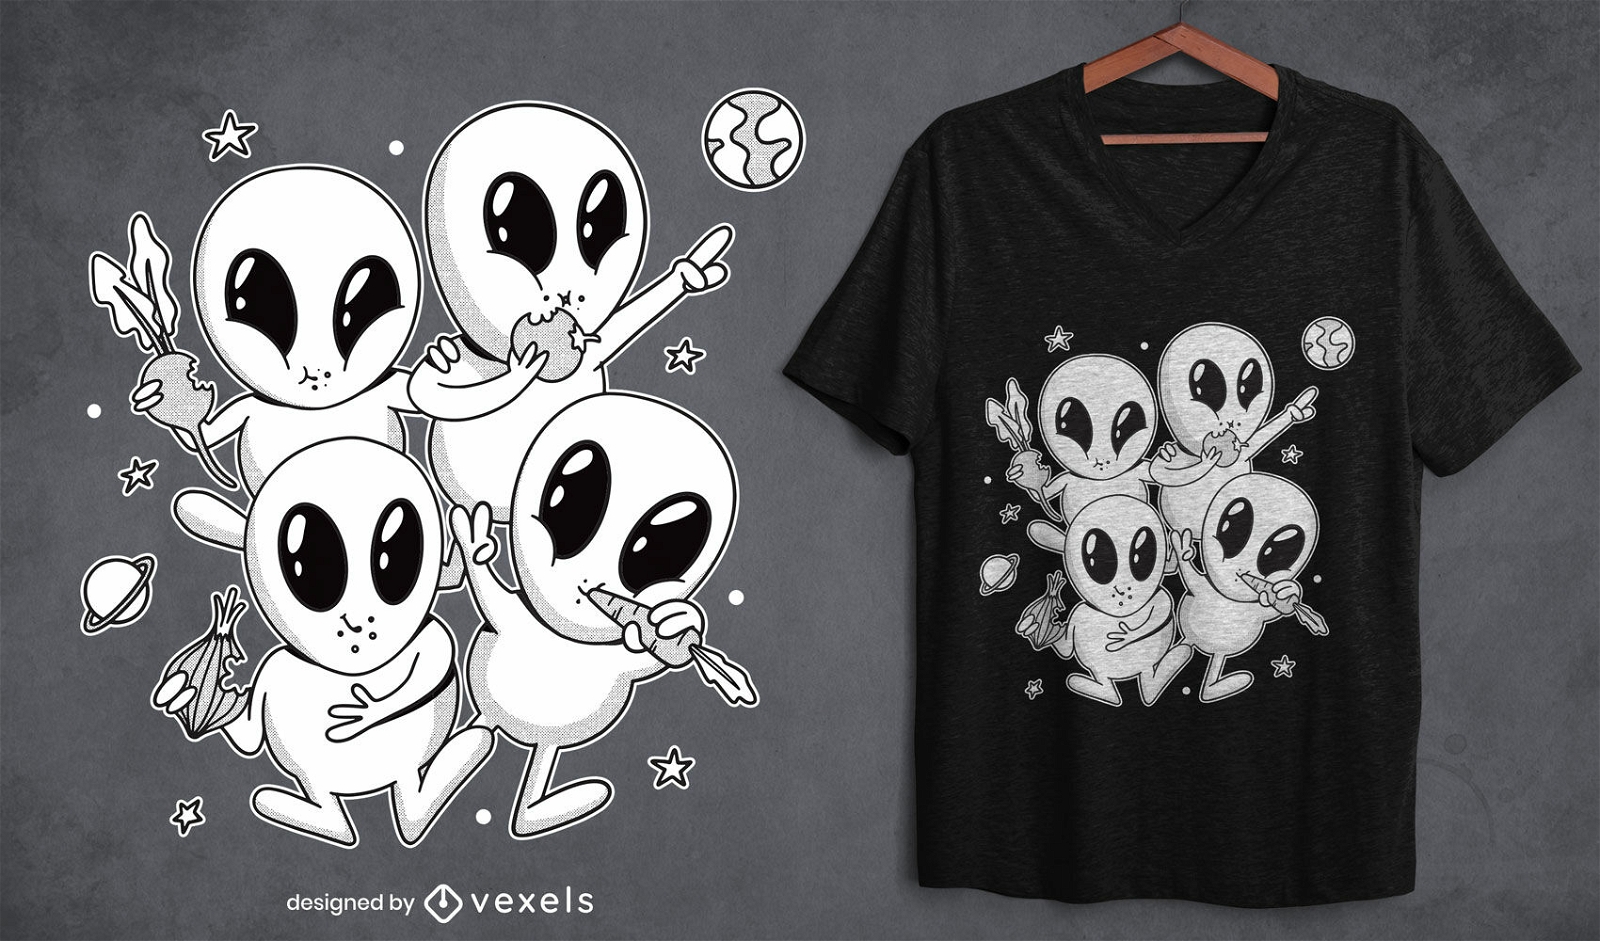
Vegetable aliens t-shirt design
Choose a folder
All favorites
Create new
Save
Vegetable aliens t-shirt design
Print ready
for Merch
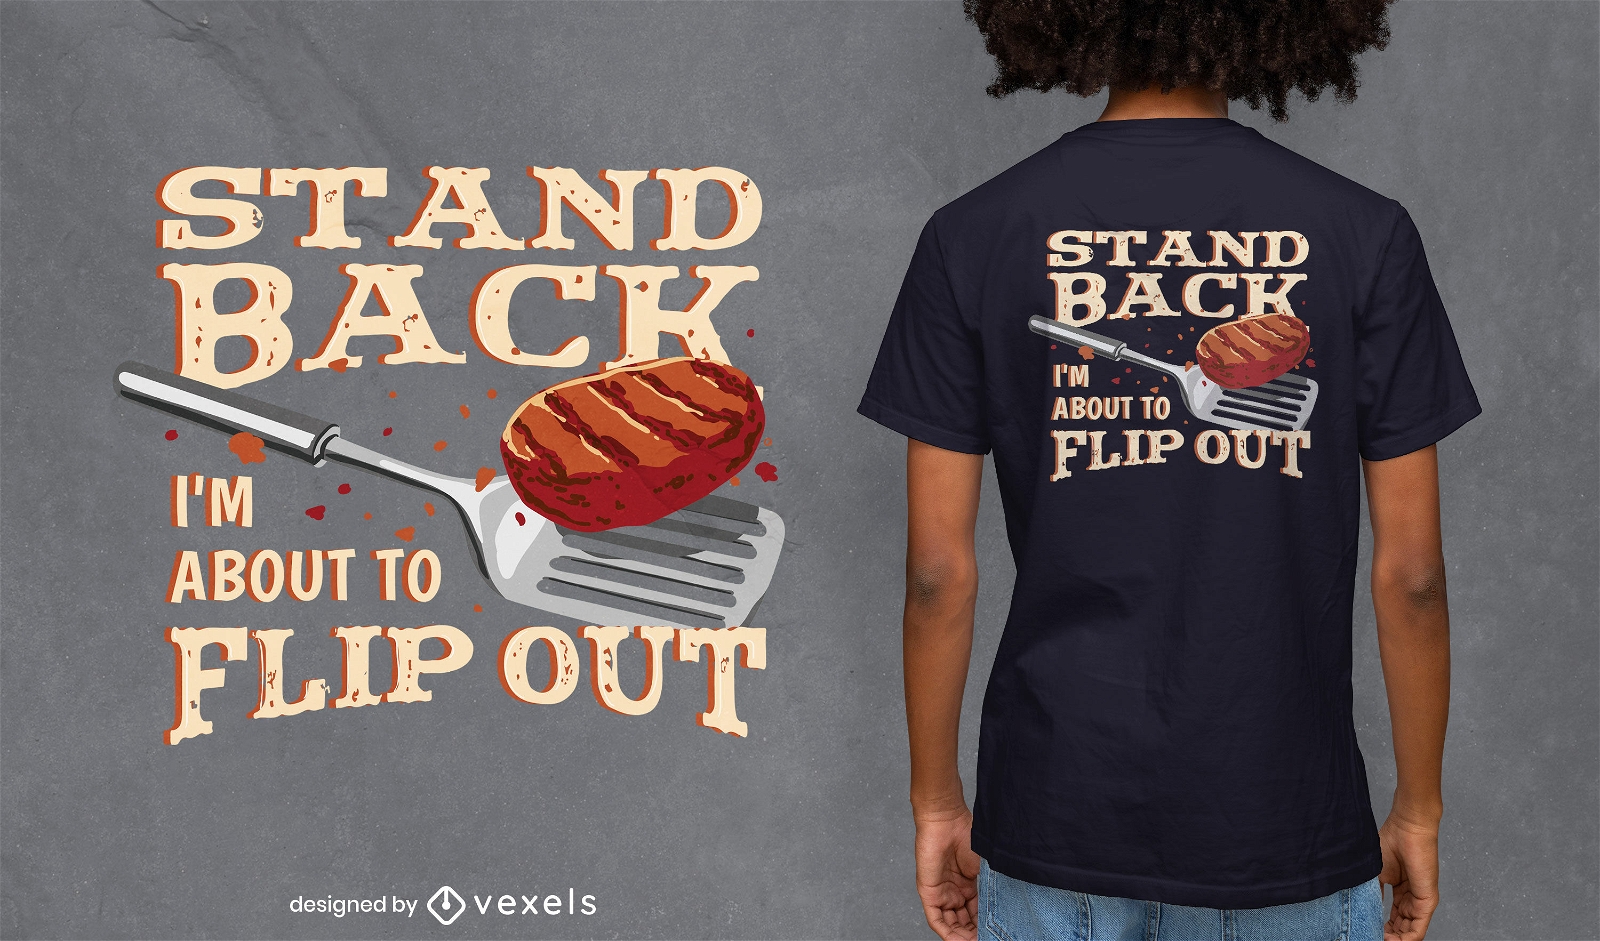
Grilling quote t-shirt design
Choose a folder
All favorites
Create new
Save
Grilling quote t-shirt design
Print ready
for Merch
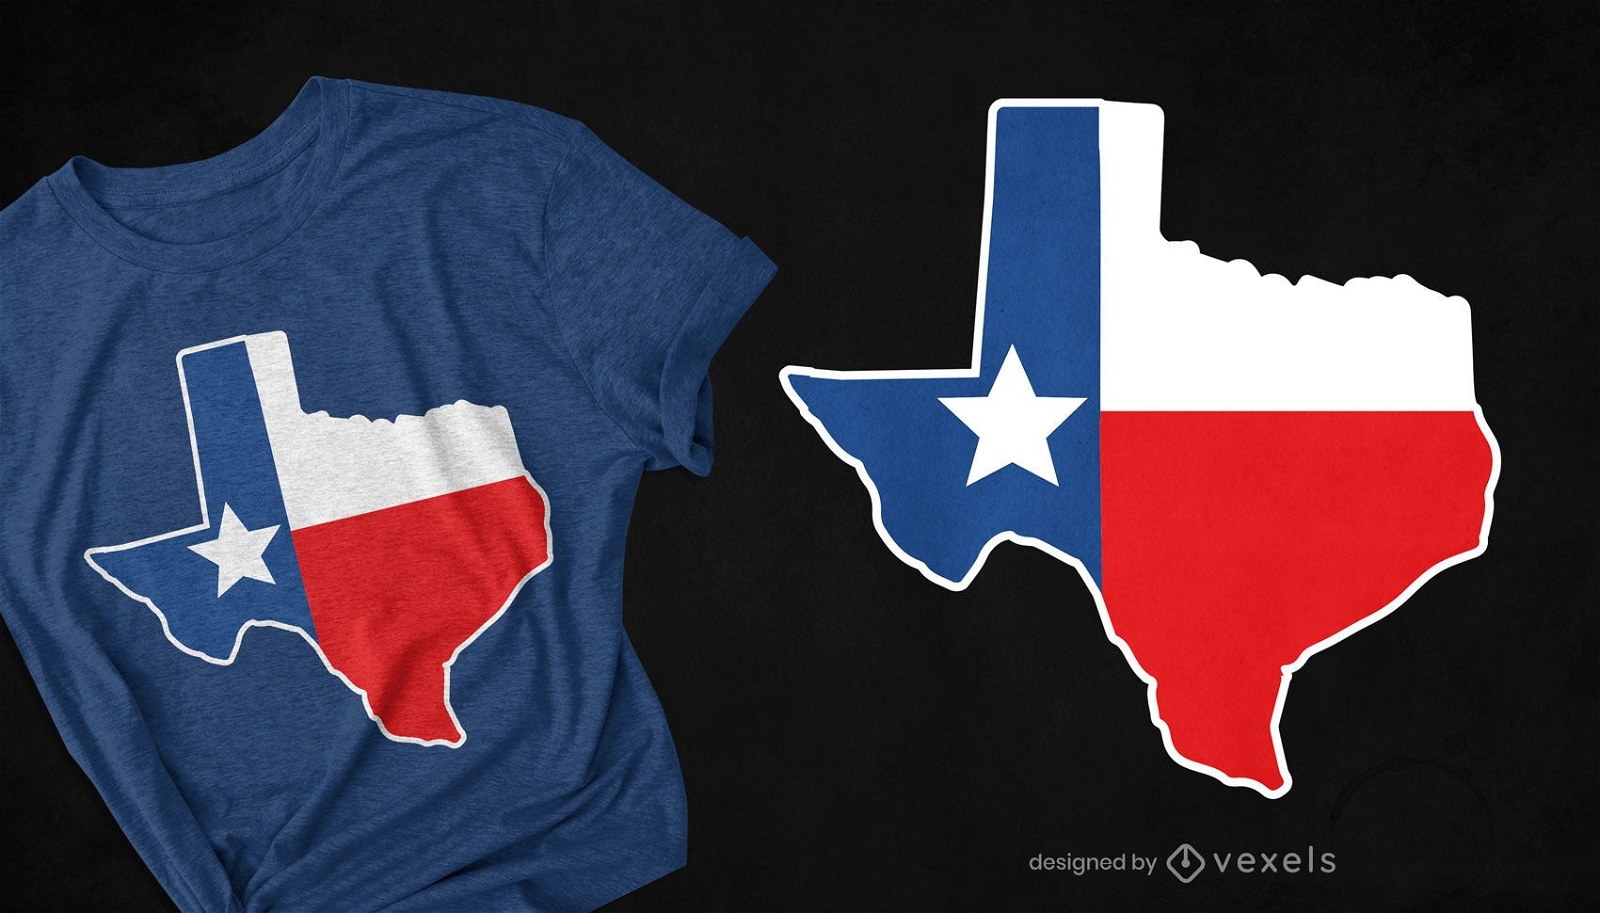
Texas map flag t-shirt design
Choose a folder
All favorites
Create new
Save
Texas map flag t-shirt design
Print ready
for Merch
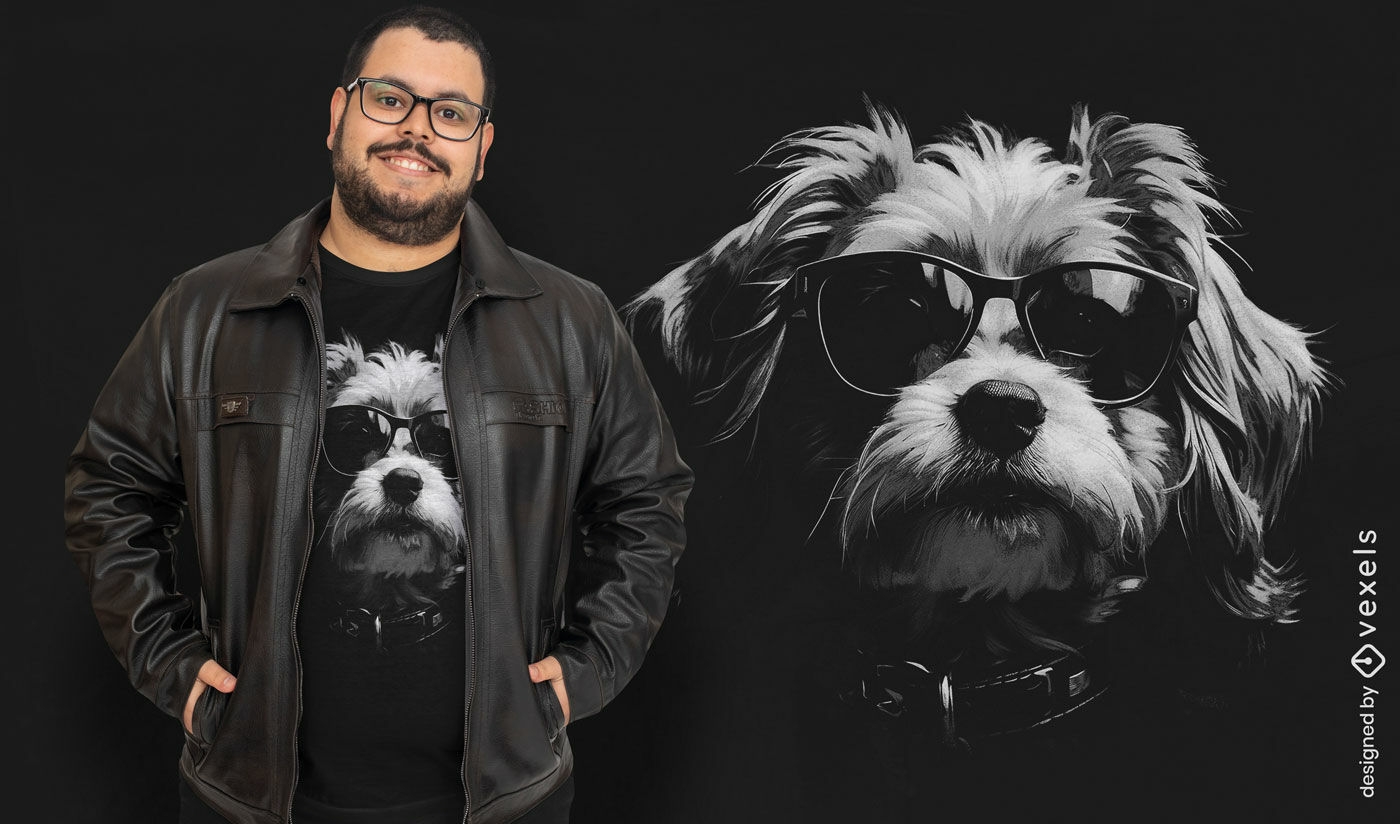
Fashion dog with sunglasses t-shirt design
Choose a folder
All favorites
Create new
Save
Fashion dog with sunglasses t-shirt design
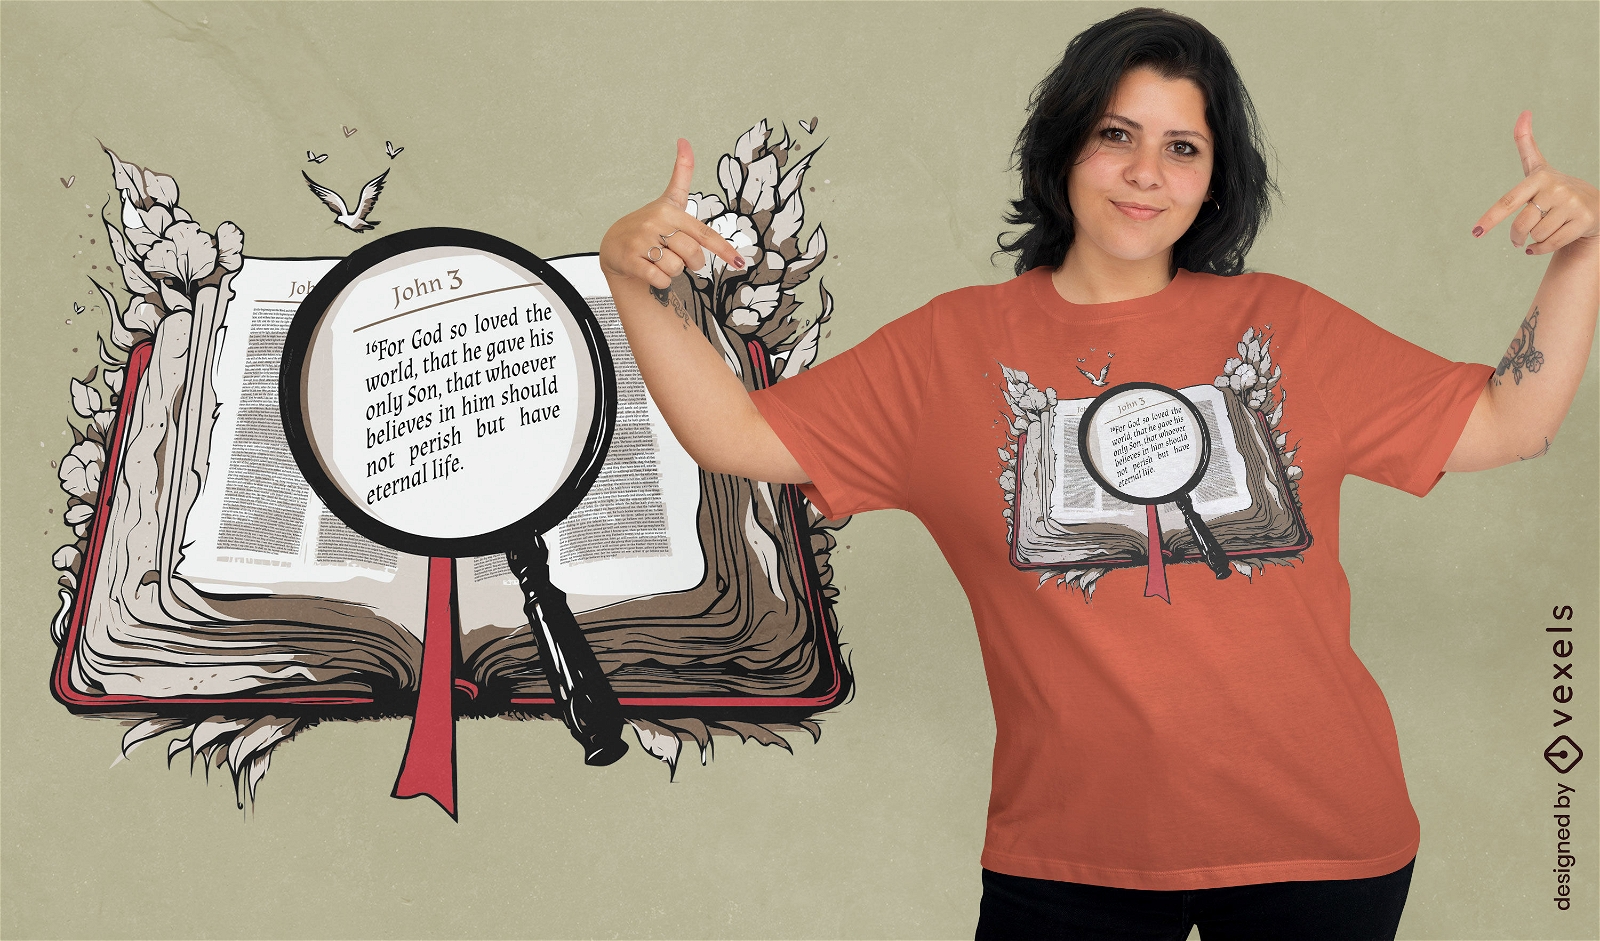
Editable text
Print ready
for Merch
Biblical quote t-shirt design
Choose a folder
All favorites
Create new
Save
Biblical quote t-shirt design
Print ready
for Merch
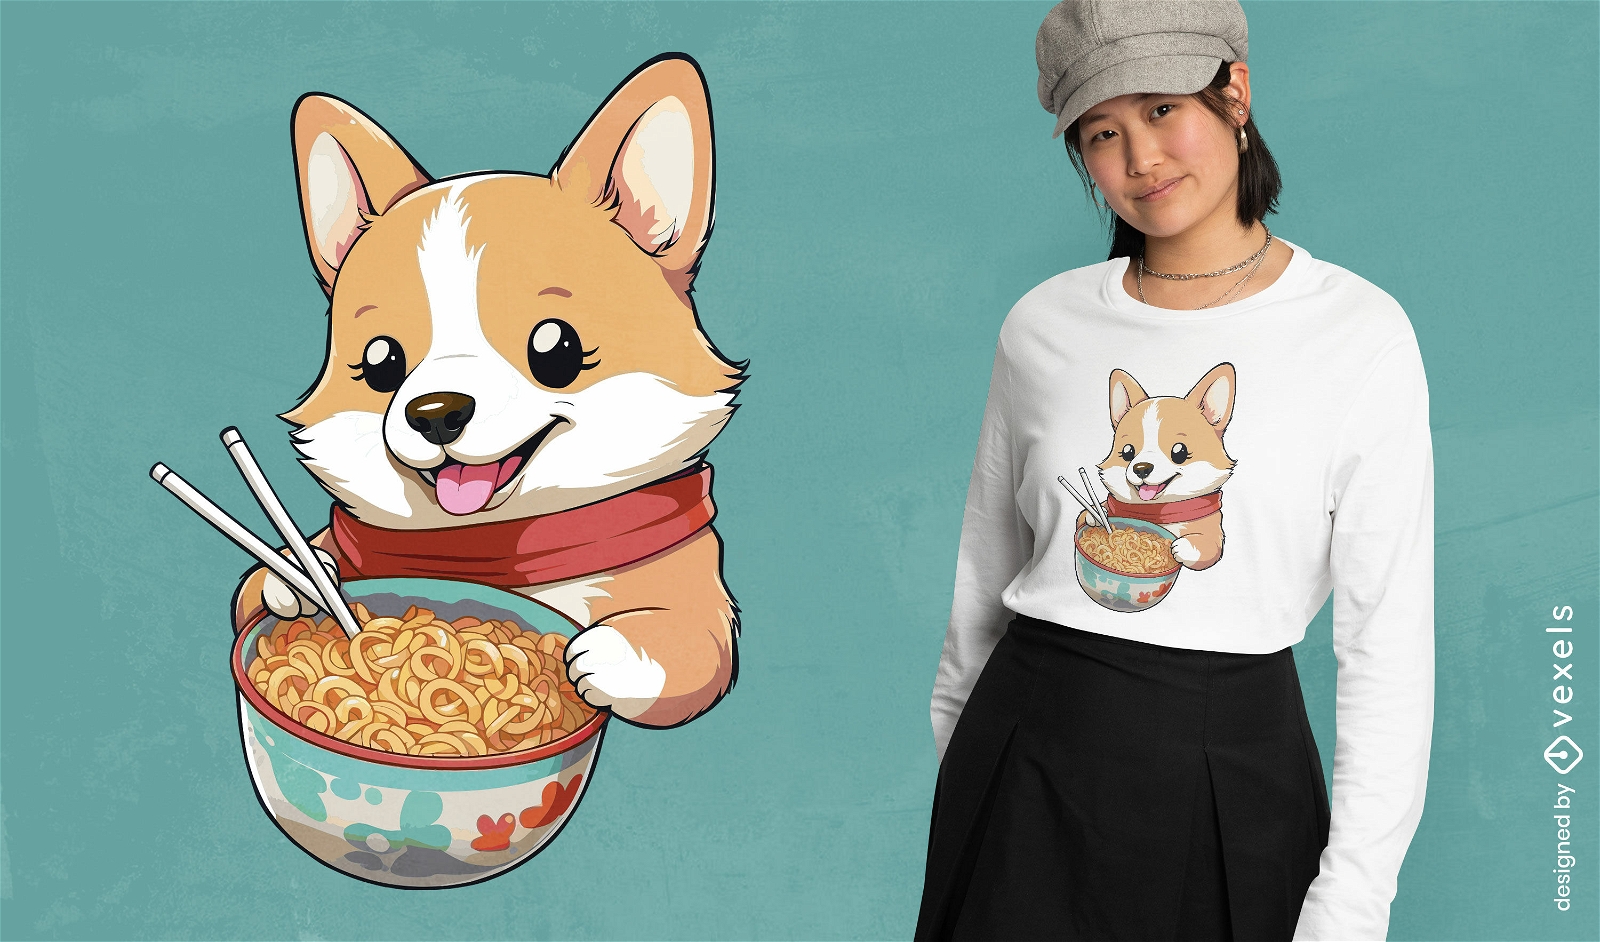
Corgi eating ramen noodles t-shirt design
Choose a folder
All favorites
Create new
Save
Corgi eating ramen noodles t-shirt design
Editable text
Print ready
for Merch
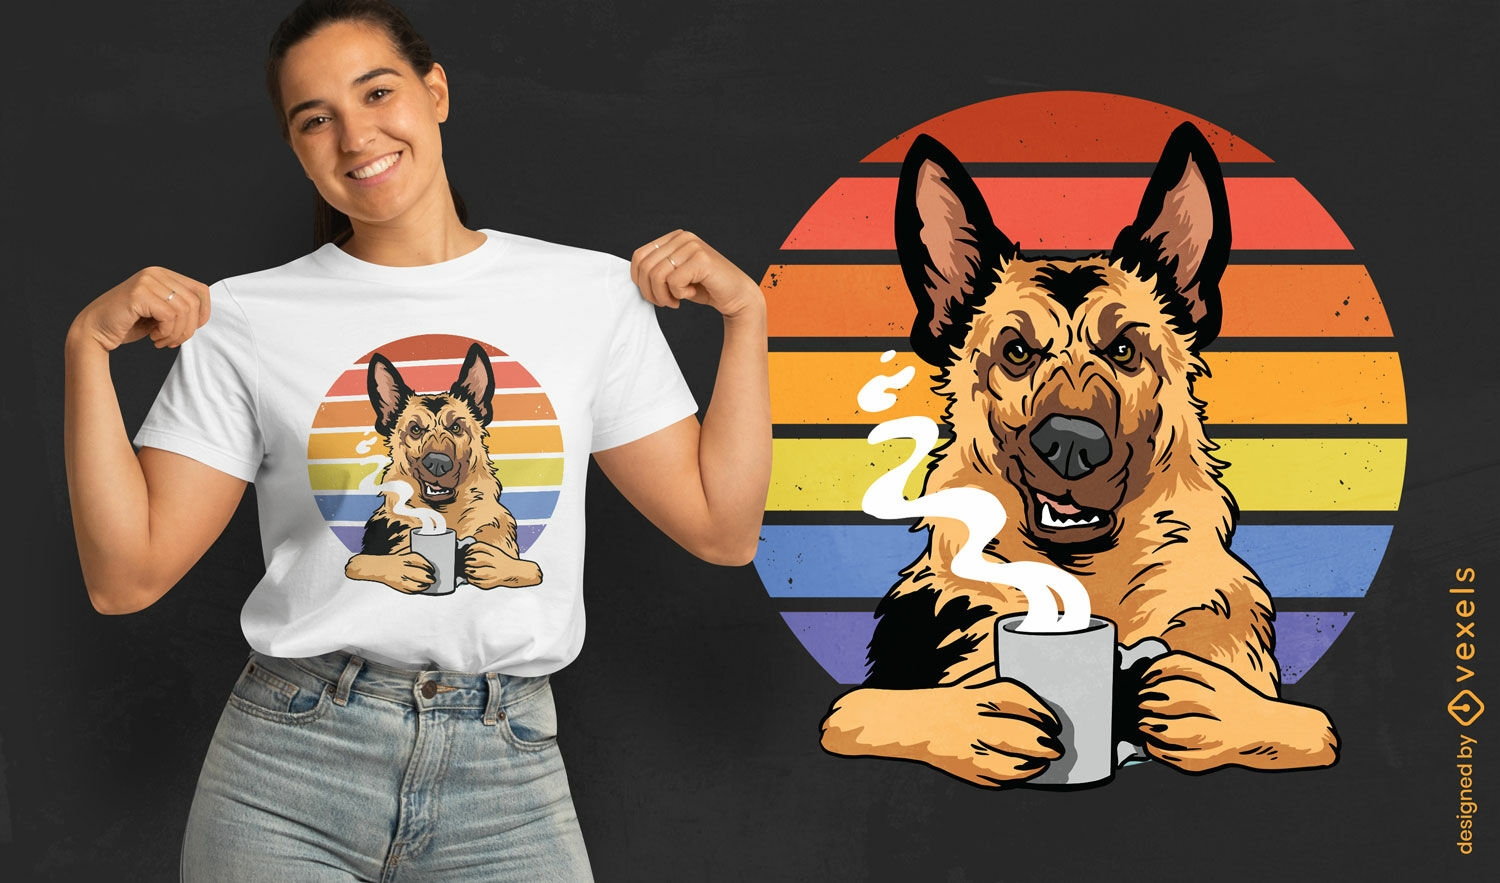
German shepherd dog coffee t-shirt design
Choose a folder
All favorites
Create new
Save
German shepherd dog coffee t-shirt design
Print ready
for Merch
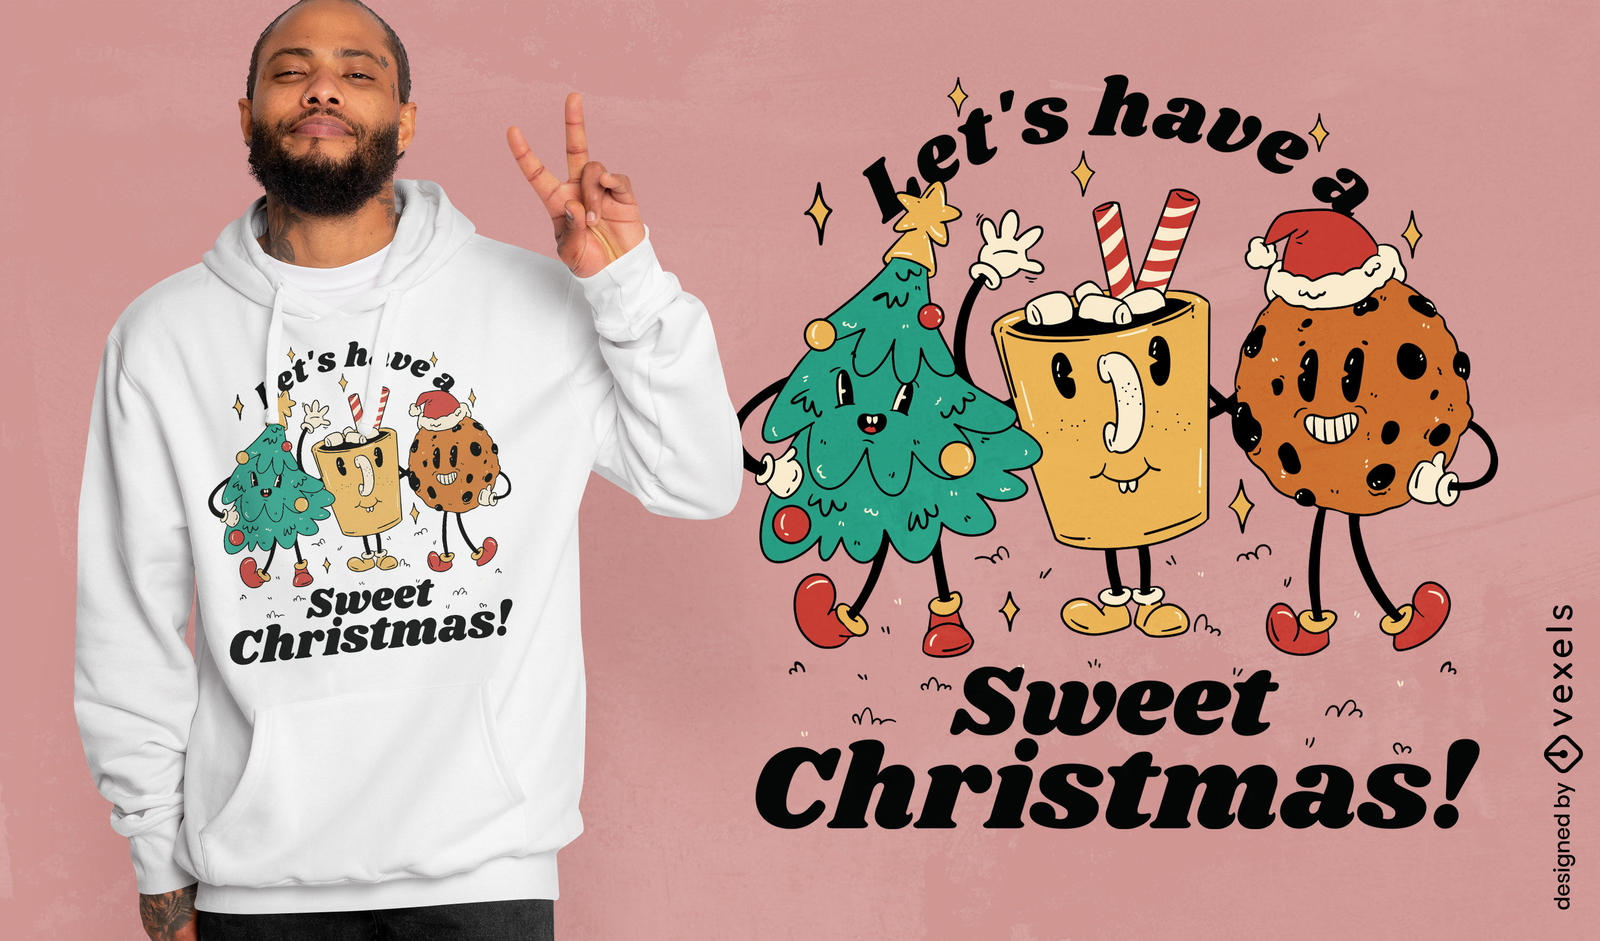
Sweet christmas retro cartoon t-shirt design
Choose a folder
All favorites
Create new
Save
Sweet christmas retro cartoon t-shirt design
Print ready
for Merch
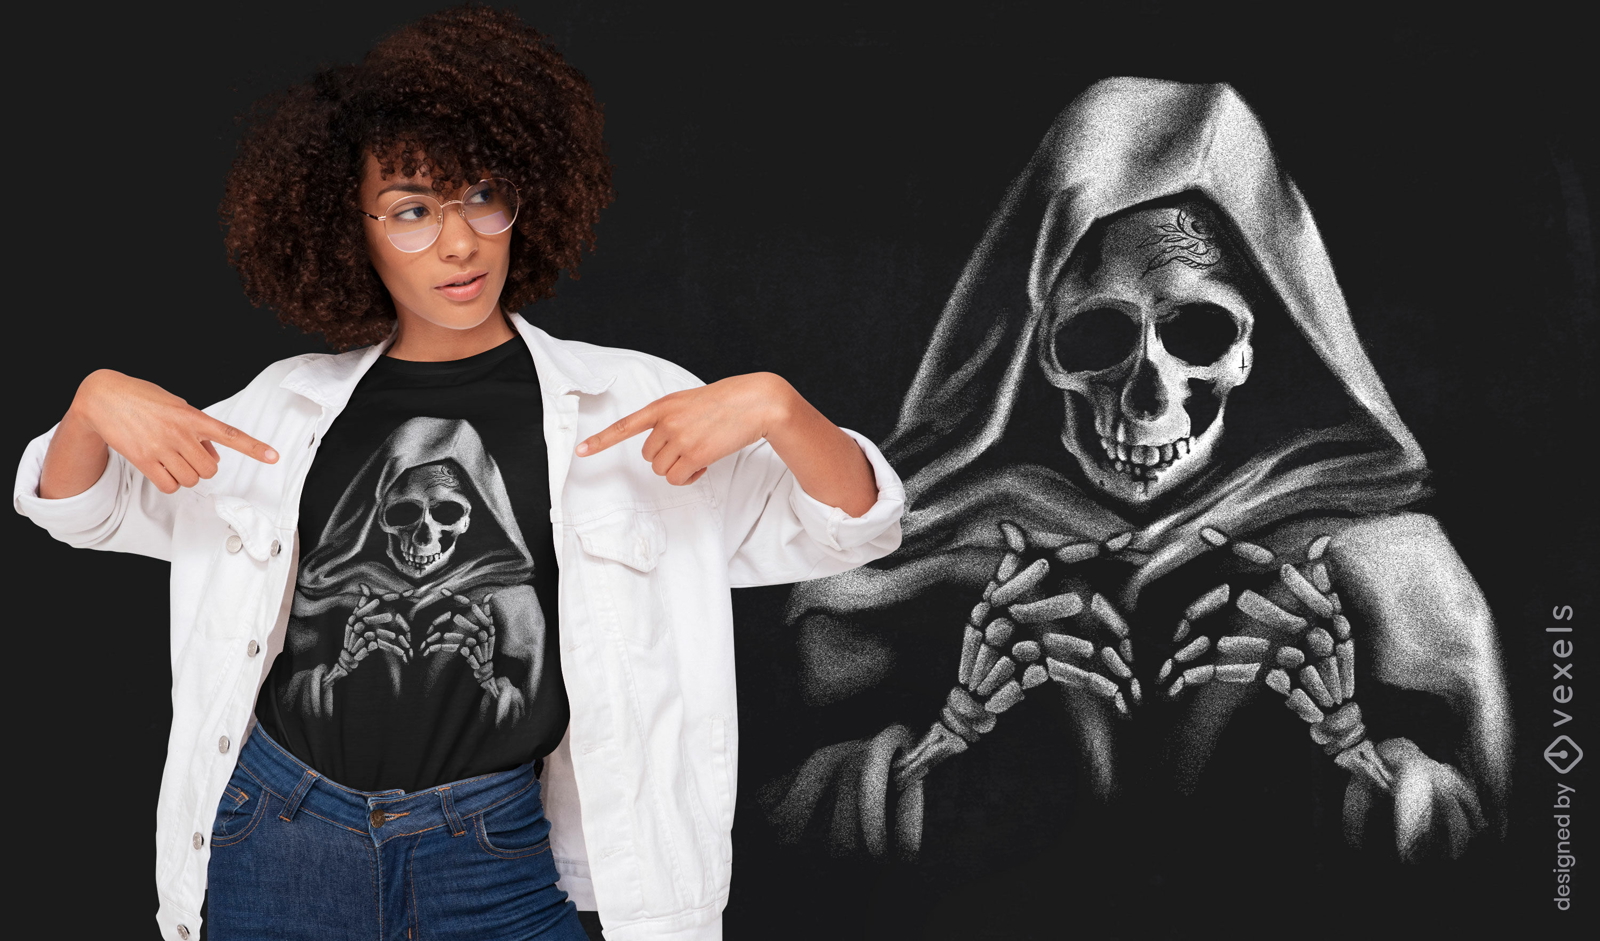
Realistic skeleton with cape t-shirt design
Choose a folder
All favorites
Create new
Save
Realistic skeleton with cape t-shirt design
Print ready
for Merch
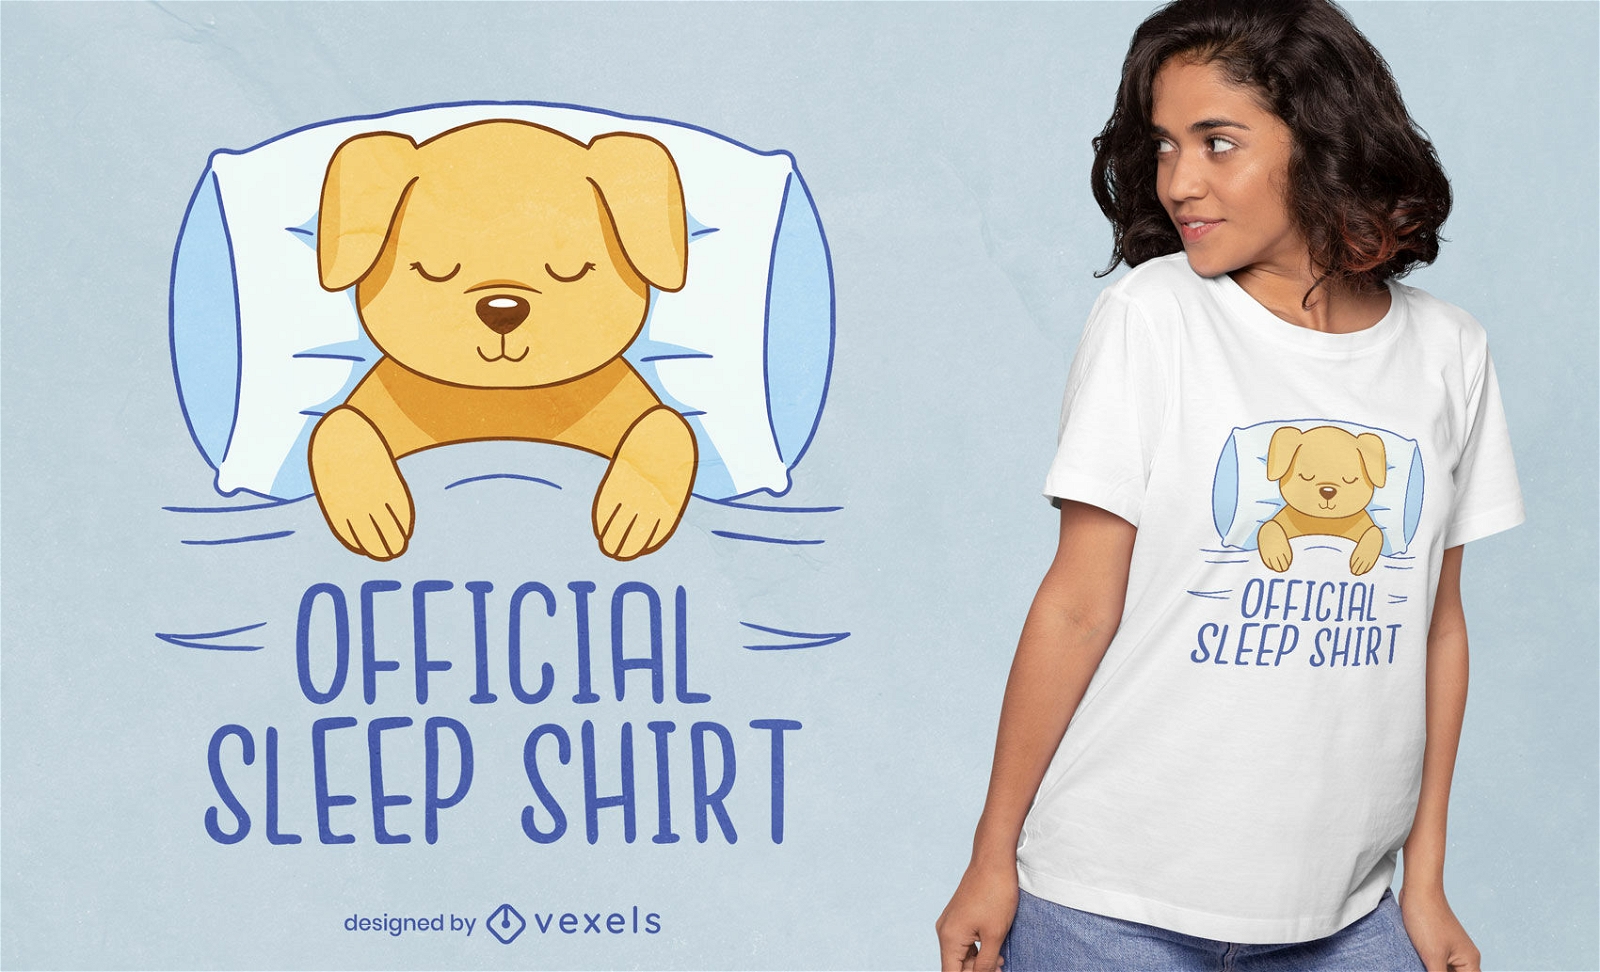
Official sleep shirt dog t-shirt design
Choose a folder
All favorites
Create new
Save
Official sleep shirt dog t-shirt design
Print ready
for Merch
Skeleton holding rose t-shirt design
Choose a folder
All favorites
Create new
Save
Skeleton holding rose t-shirt design
Print ready
for Merch
Funny anti-thanksgiving quote t-shirt design
Choose a folder
All favorites
Create new
Save
Funny anti-thanksgiving quote t-shirt design
Print ready
for Merch
Woman in yoga pose tree t-shirt design
Choose a folder
All favorites
Create new
Save
Woman in yoga pose tree t-shirt design
Editable text
Print ready
for Merch
Join us skeleton t-shirt design
Choose a folder
All favorites
Create new
Save
Join us skeleton t-shirt design
Print ready
for Merch
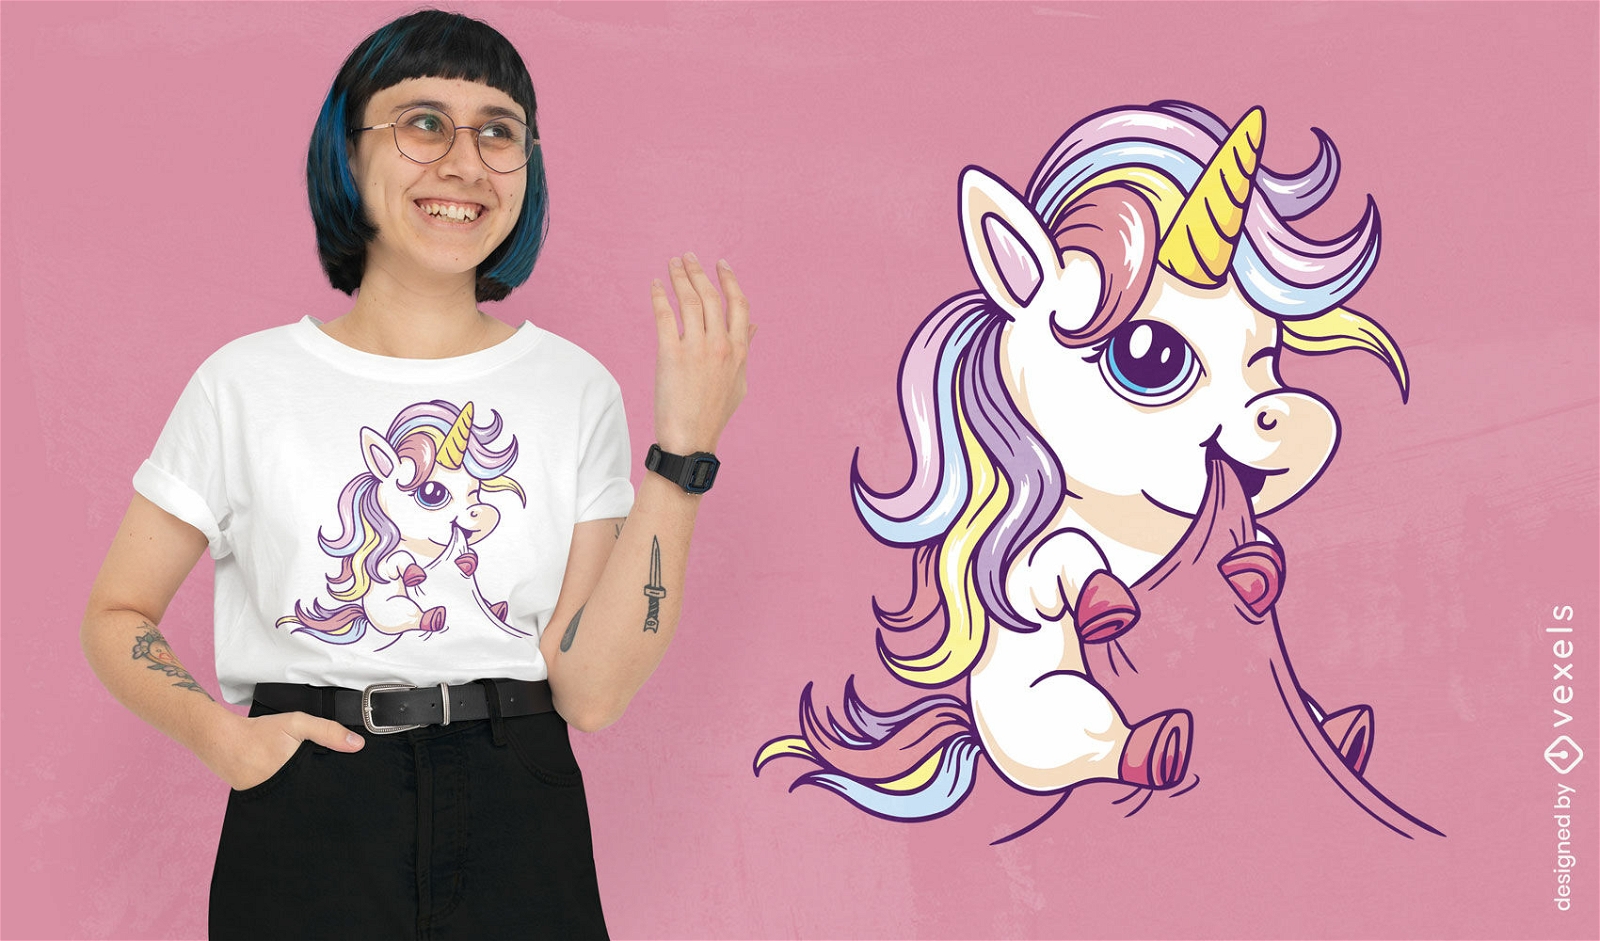
Adorable unicorn eating t-shirt design
Choose a folder
All favorites
Create new
Save
Adorable unicorn eating t-shirt design
Print ready
for Merch
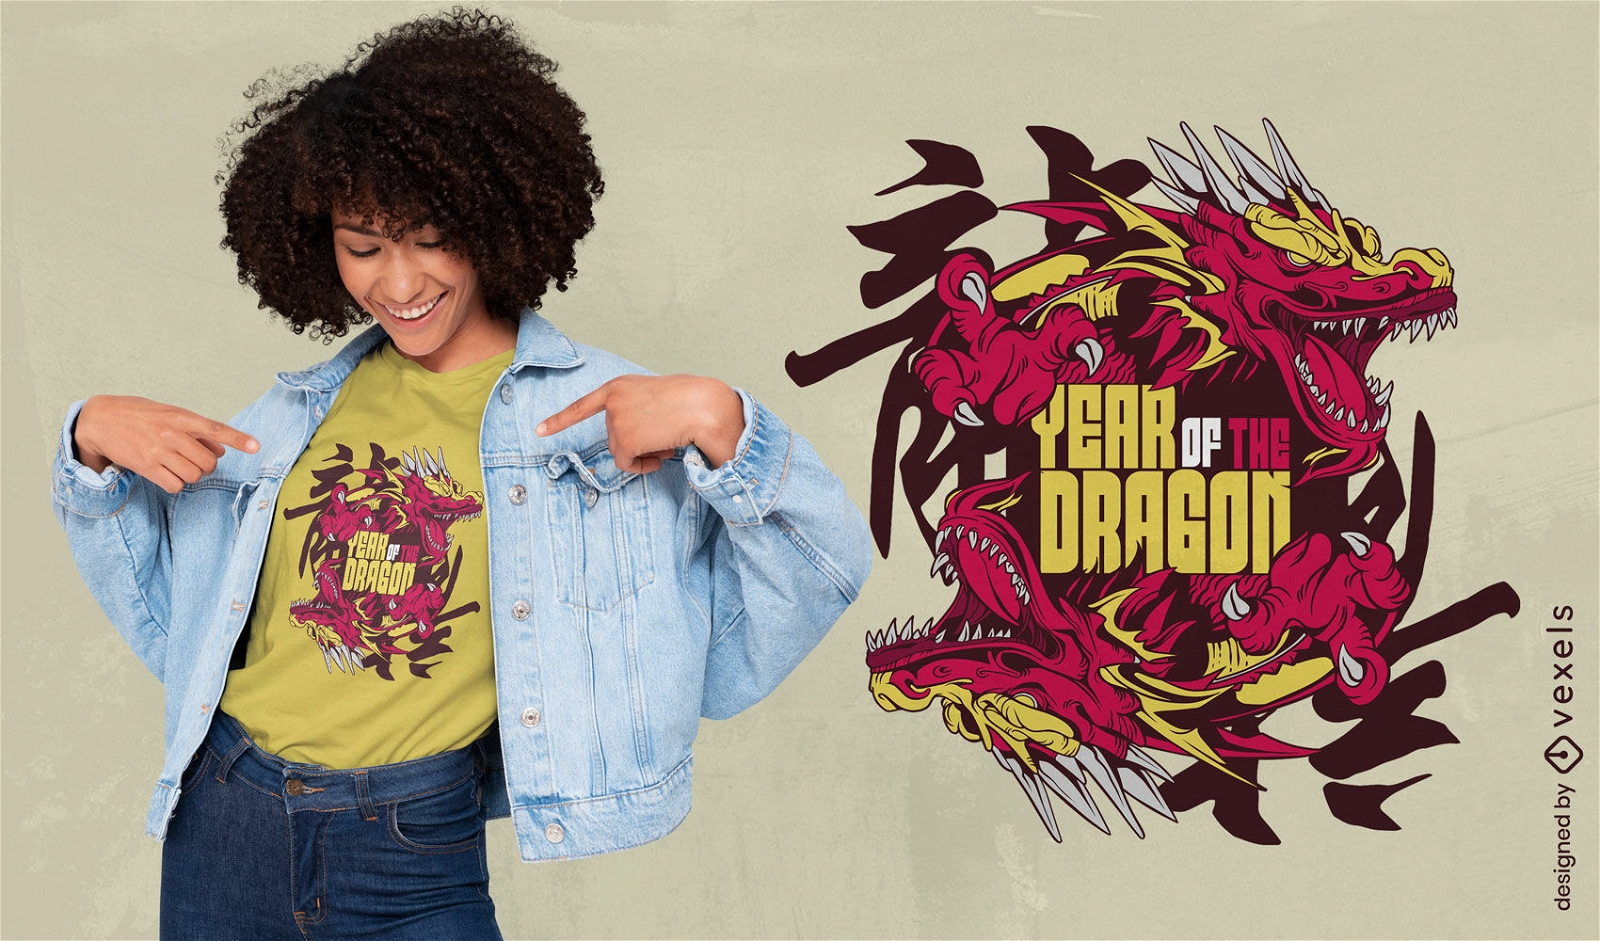
Year of the dragon chinese t-shirt design
Choose a folder
All favorites
Create new
Save
Year of the dragon chinese t-shirt design
Print ready
for Merch
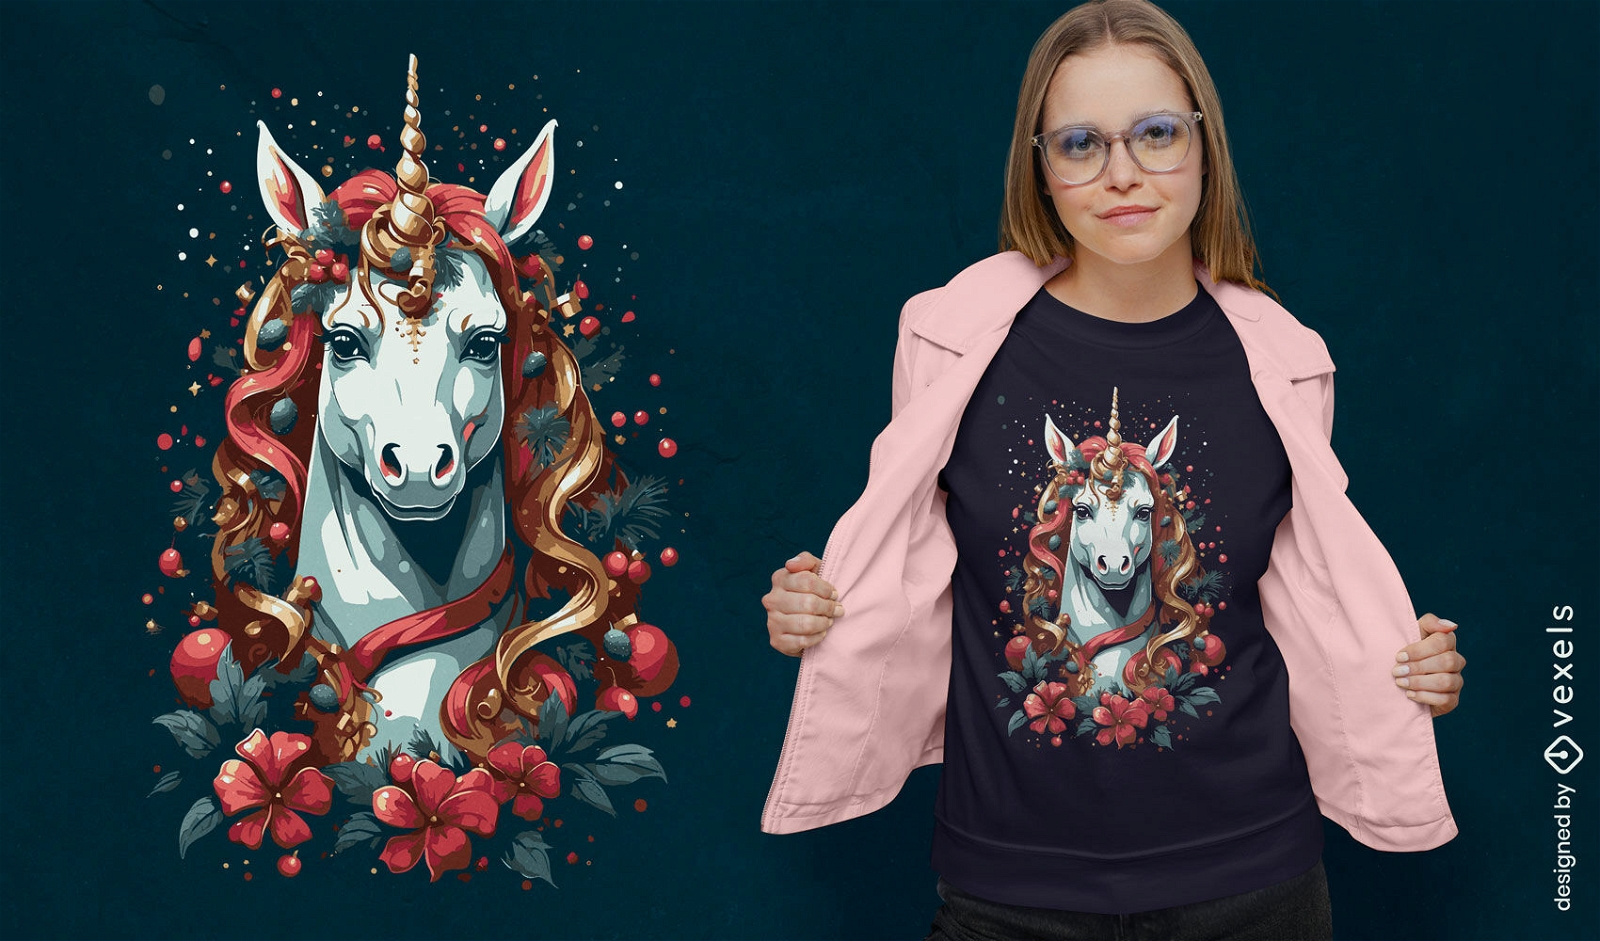
Christmas unicorn holiday t-shirt design
Choose a folder
All favorites
Create new
Save
Christmas unicorn holiday t-shirt design
Print ready
for Merch
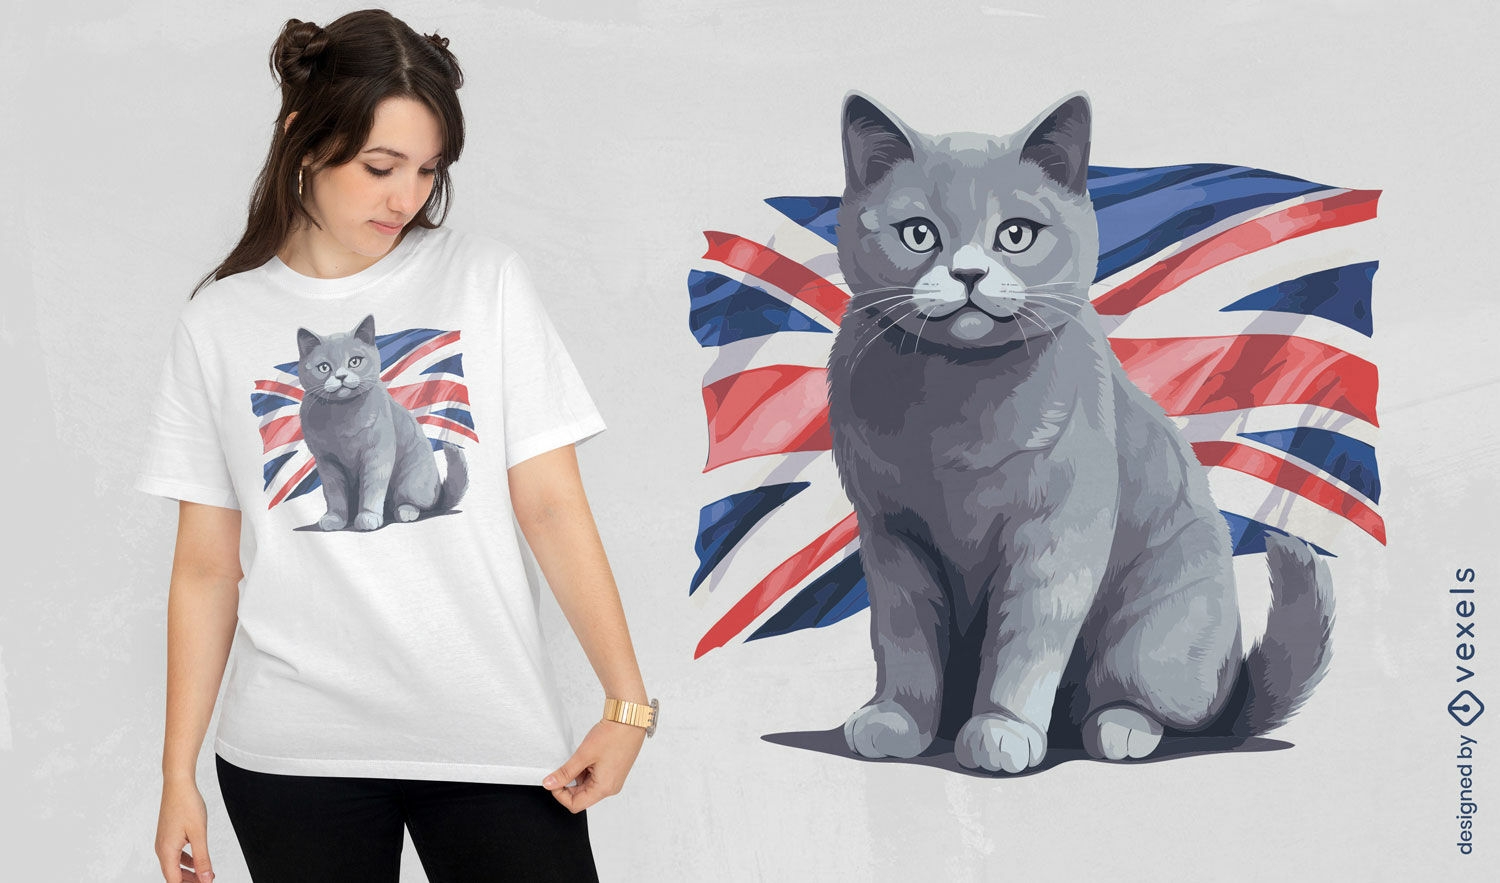
Patriotic British Shorthair t-shirt design
Choose a folder
All favorites
Create new
Save
Patriotic British Shorthair t-shirt design
Print ready
for Merch
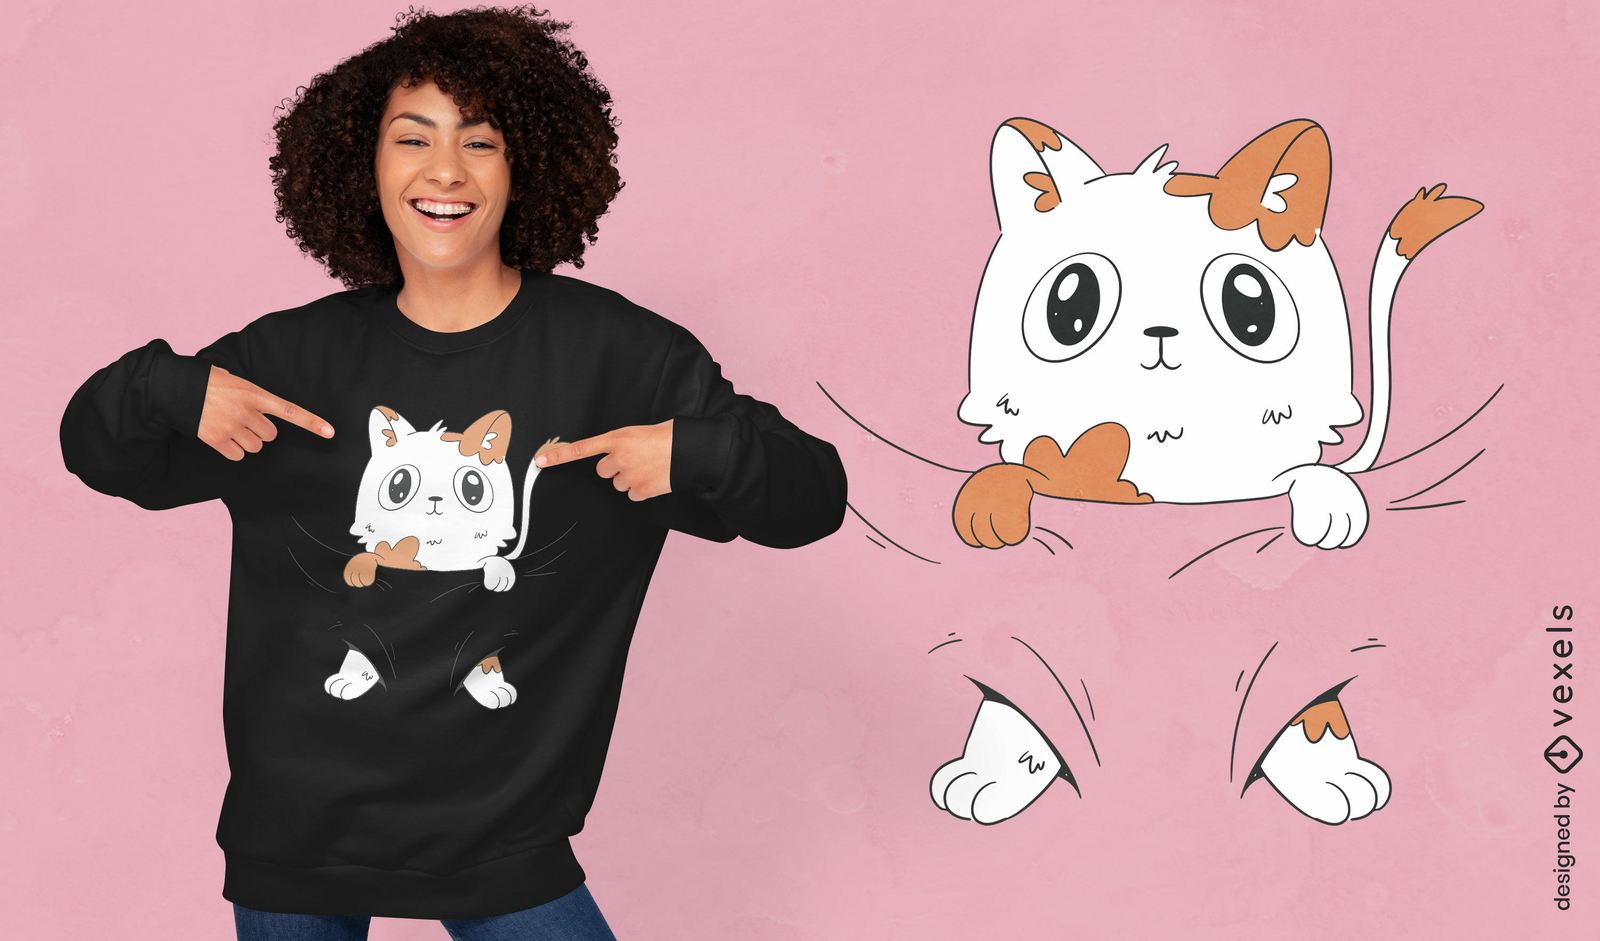
Cat baby animal cartoon t-shirt design
Choose a folder
All favorites
Create new
Save
Cat baby animal cartoon t-shirt design
Print ready
for Merch
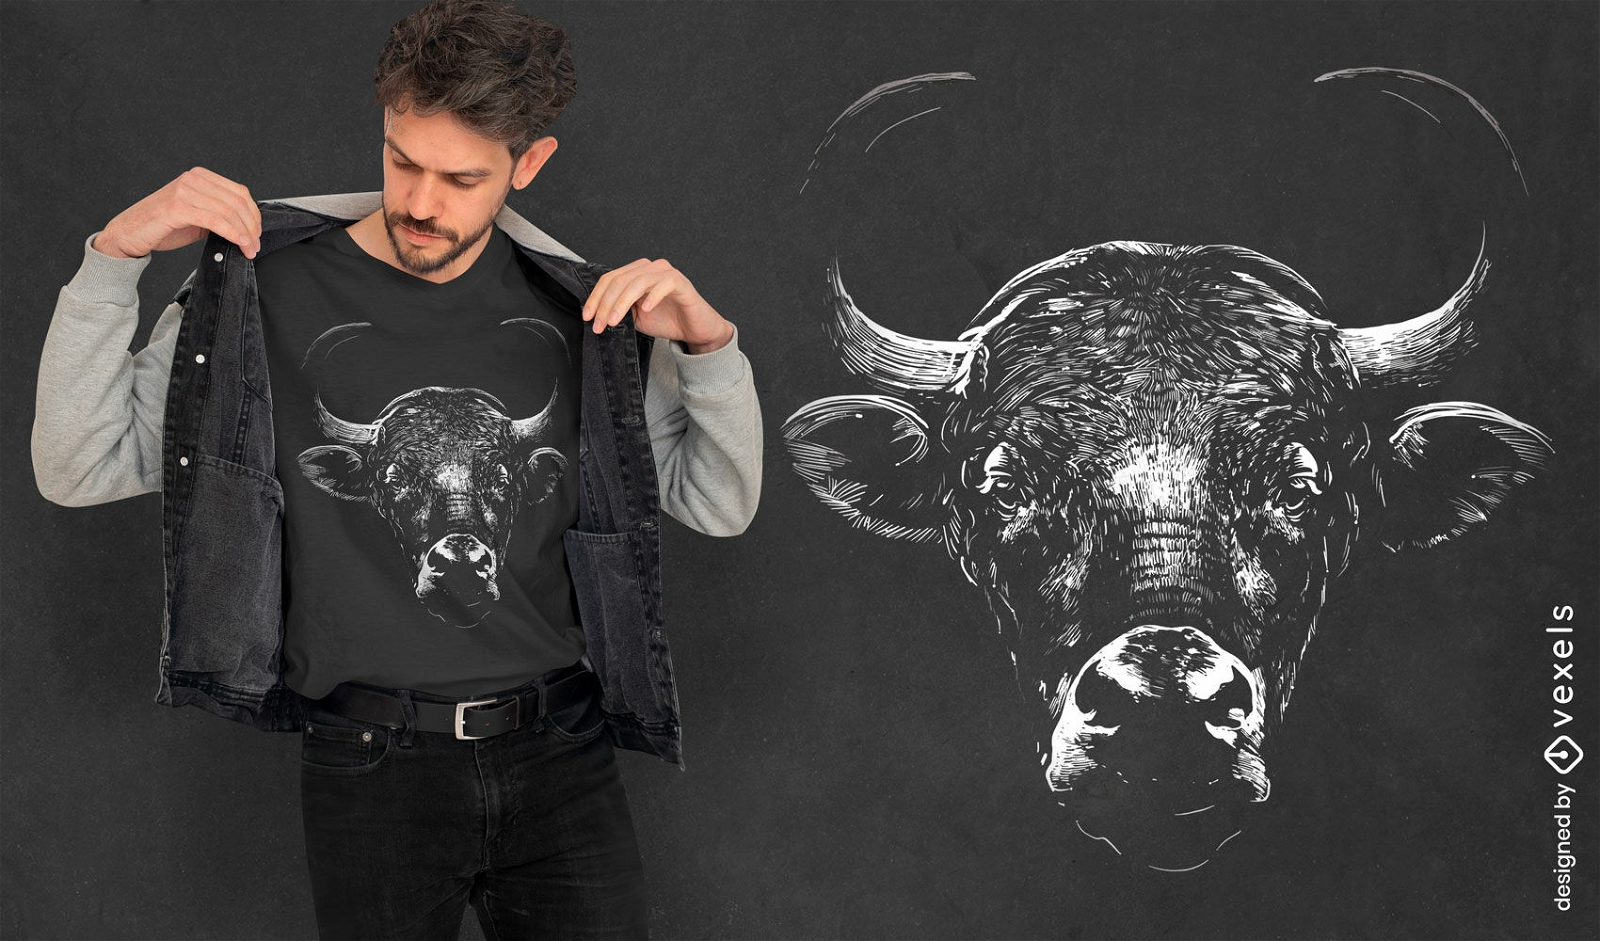
Bull wild animal realistic t-shirt design
Choose a folder
All favorites
Create new
Save
Bull wild animal realistic t-shirt design
Print ready
for Merch
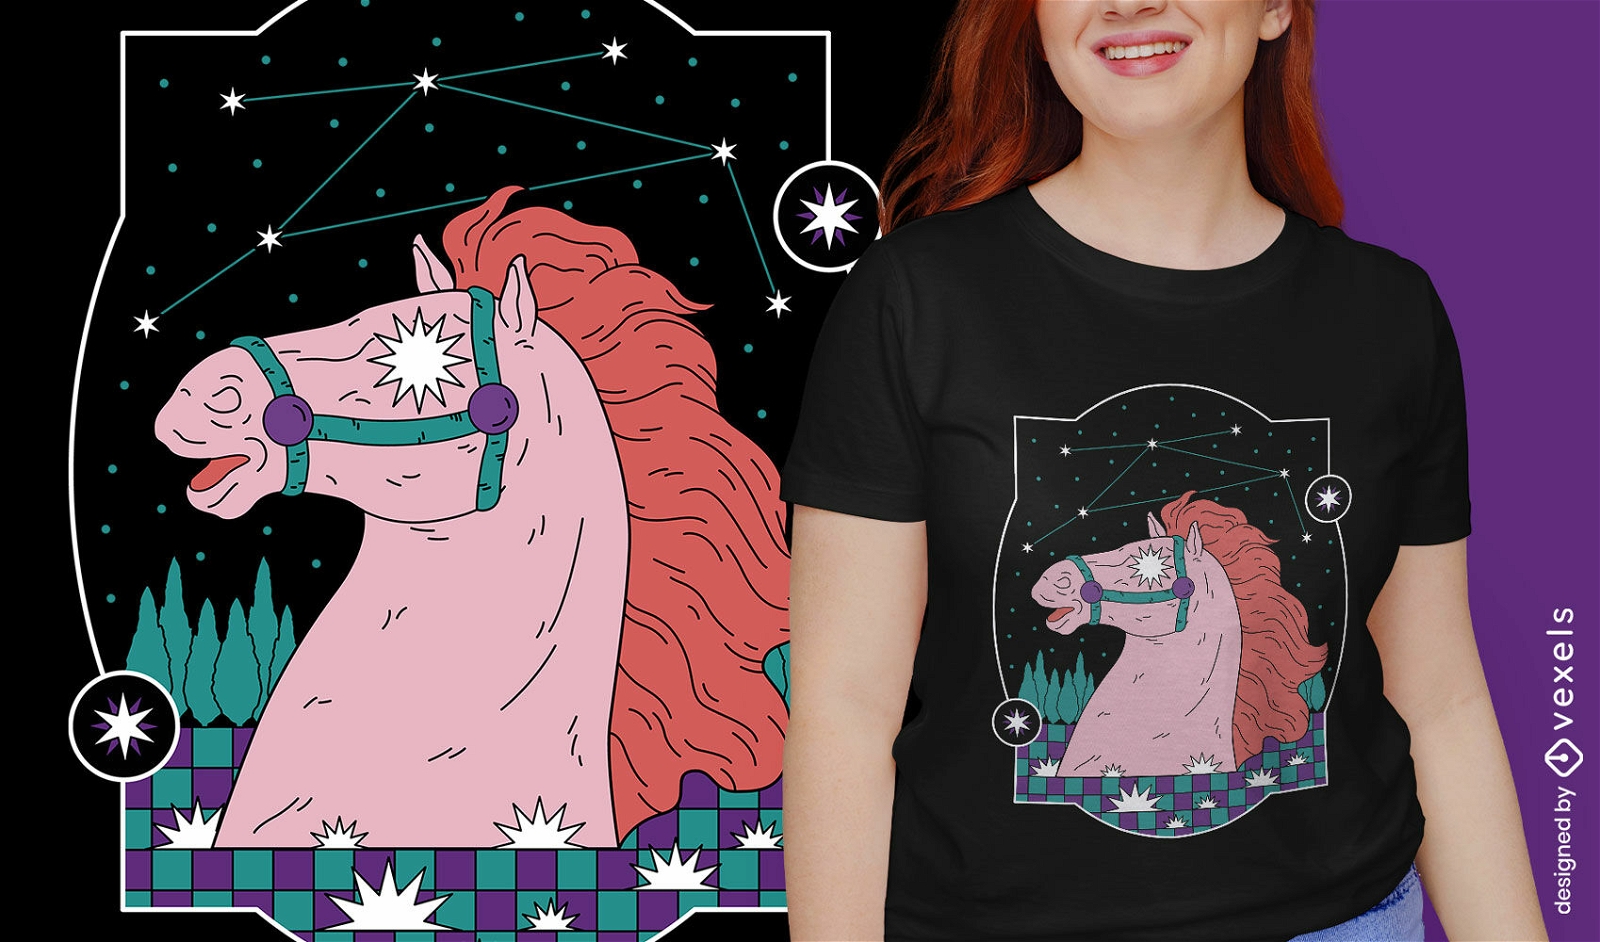
Mystic constellations horse t-shirt design
Choose a folder
All favorites
Create new
Save
Mystic constellations horse t-shirt design
Print ready
for Merch
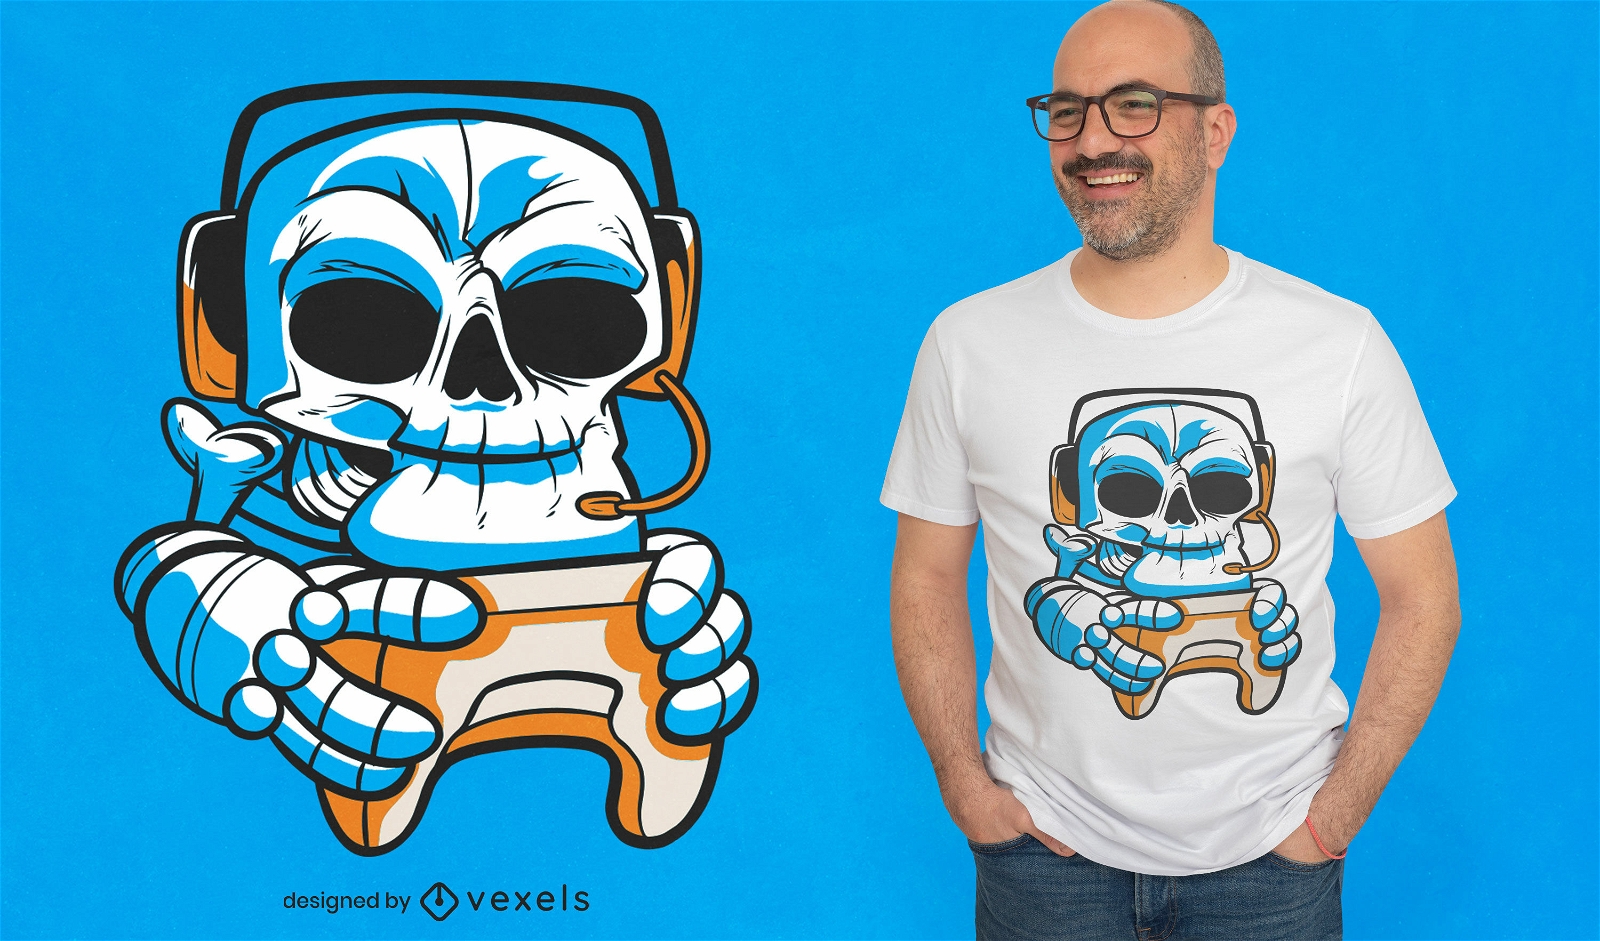
Skull gamer with joystick t-shirt design
Choose a folder
All favorites
Create new
Save
Skull gamer with joystick t-shirt design
Print ready
for Merch
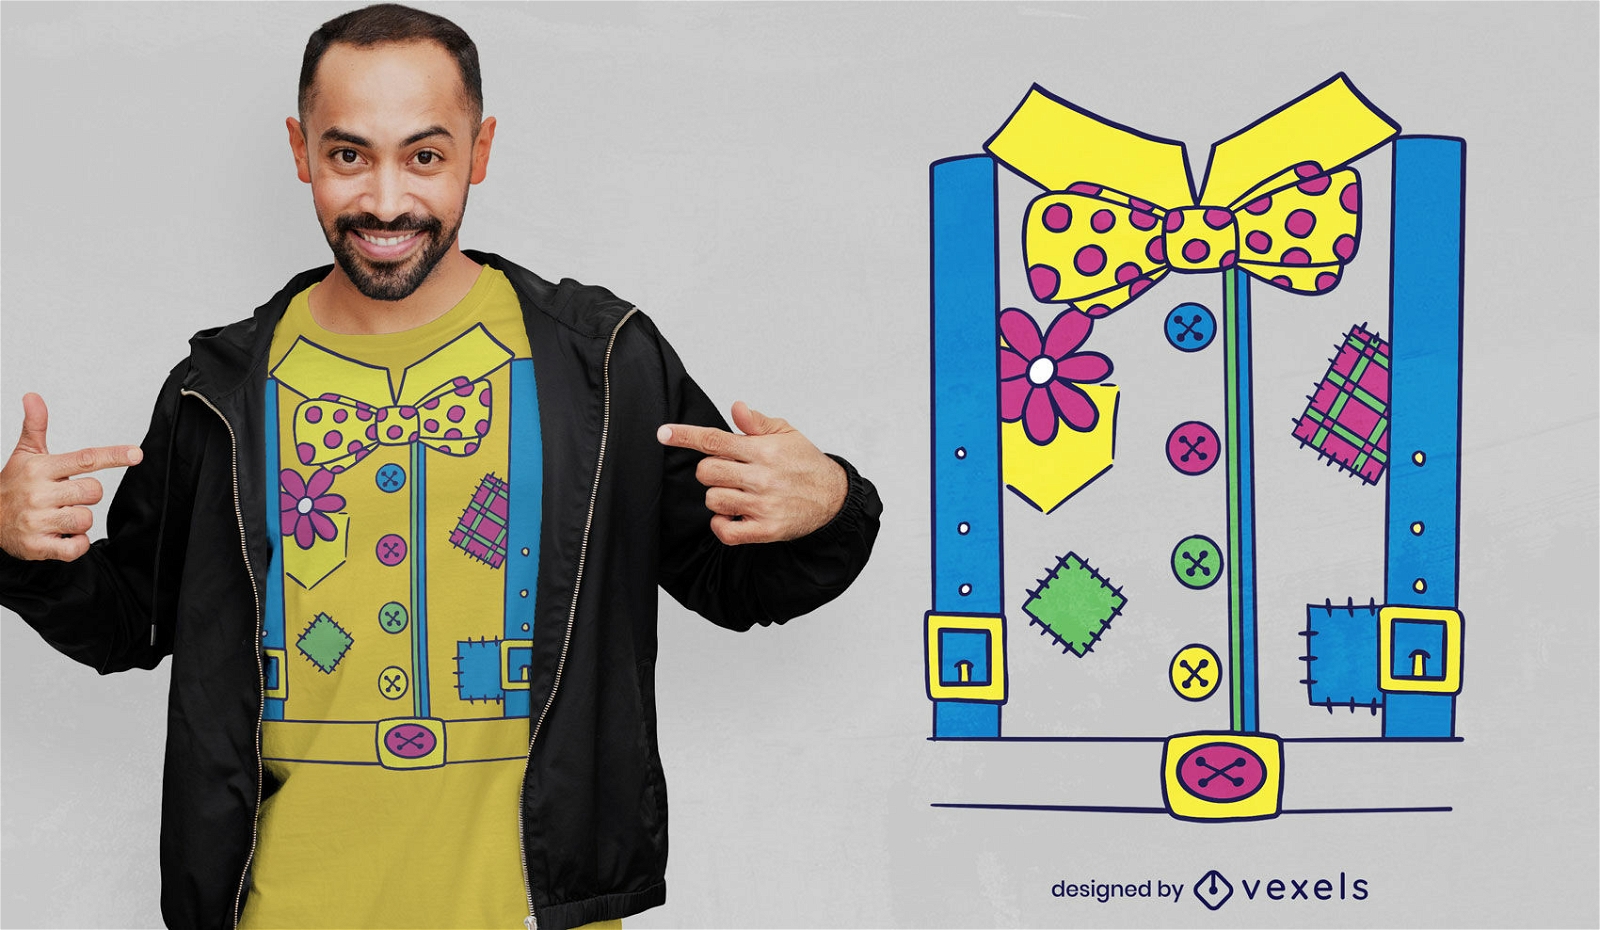
Colorful circus clown costume t-shirt design
Choose a folder
All favorites
Create new
Save
Colorful circus clown costume t-shirt design
Print ready
for Merch
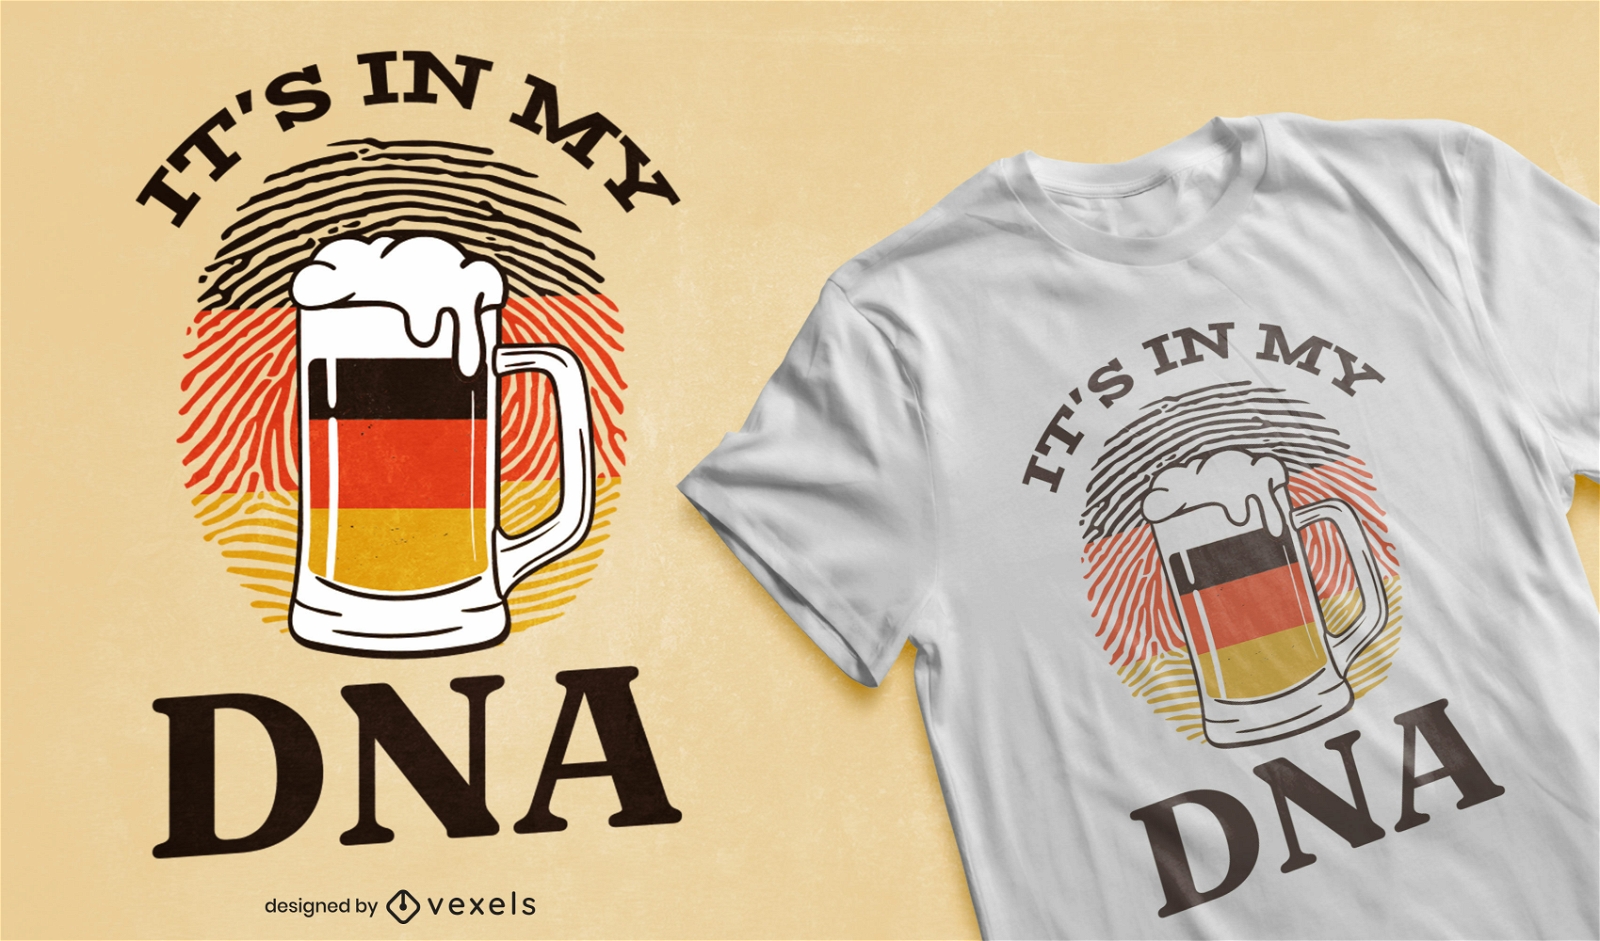
Beer german dna t-shirt design
Choose a folder
All favorites
Create new
Save
Beer german dna t-shirt design
Print ready
for Merch
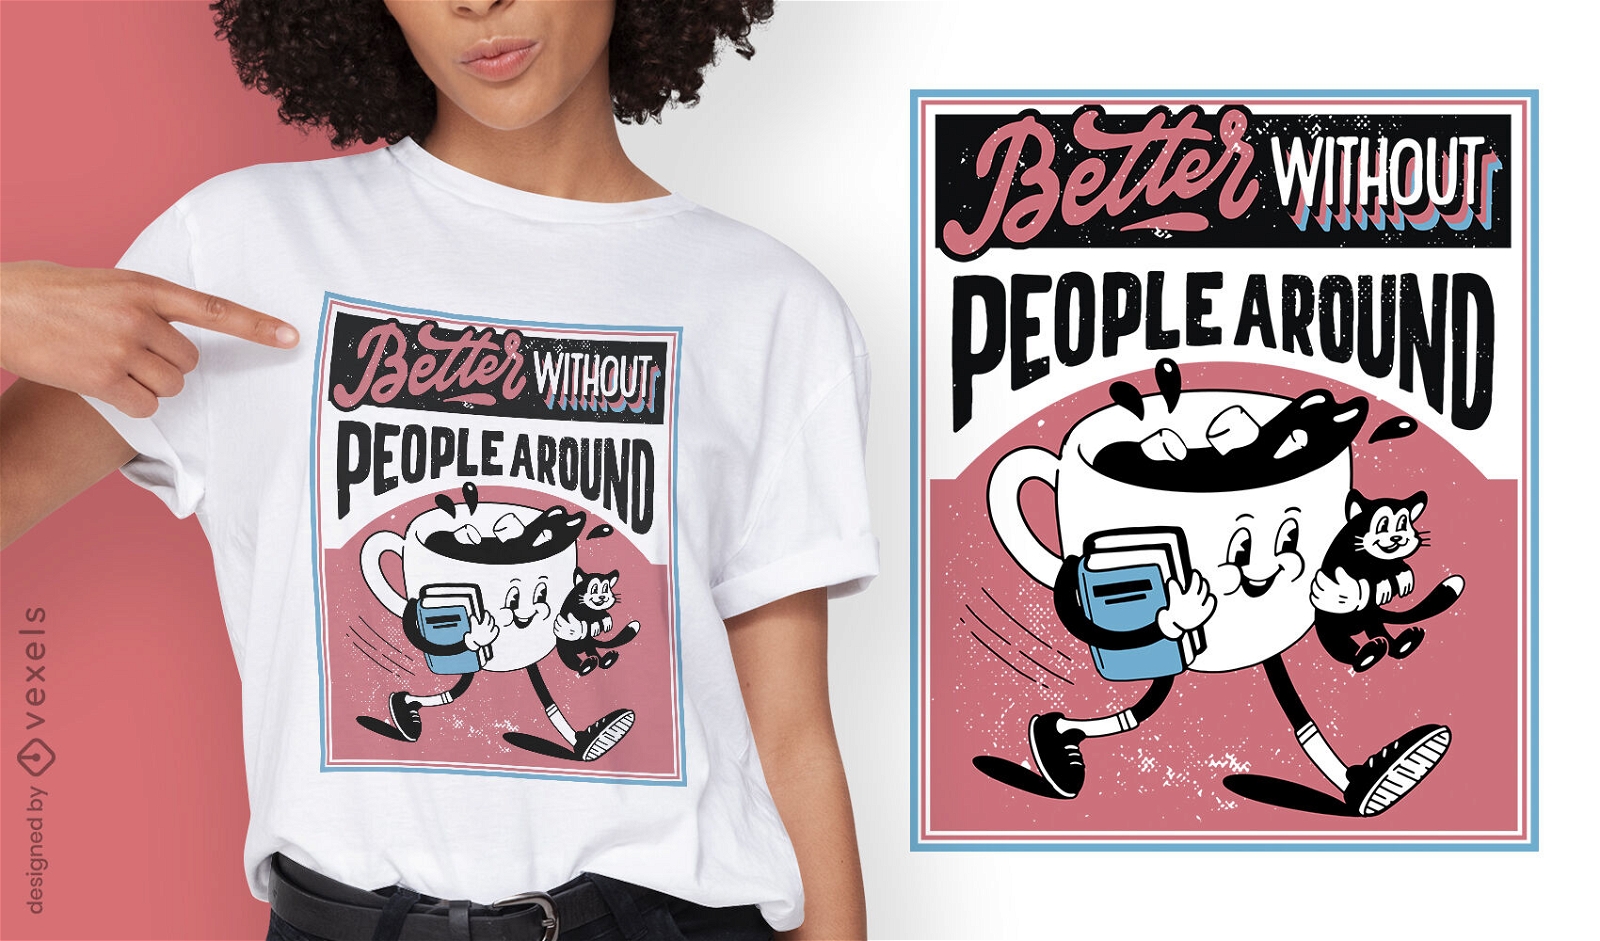
Antisocial coffee cup poster t-shirt design
Choose a folder
All favorites
Create new
Save
Antisocial coffee cup poster t-shirt design
Print ready
for Merch
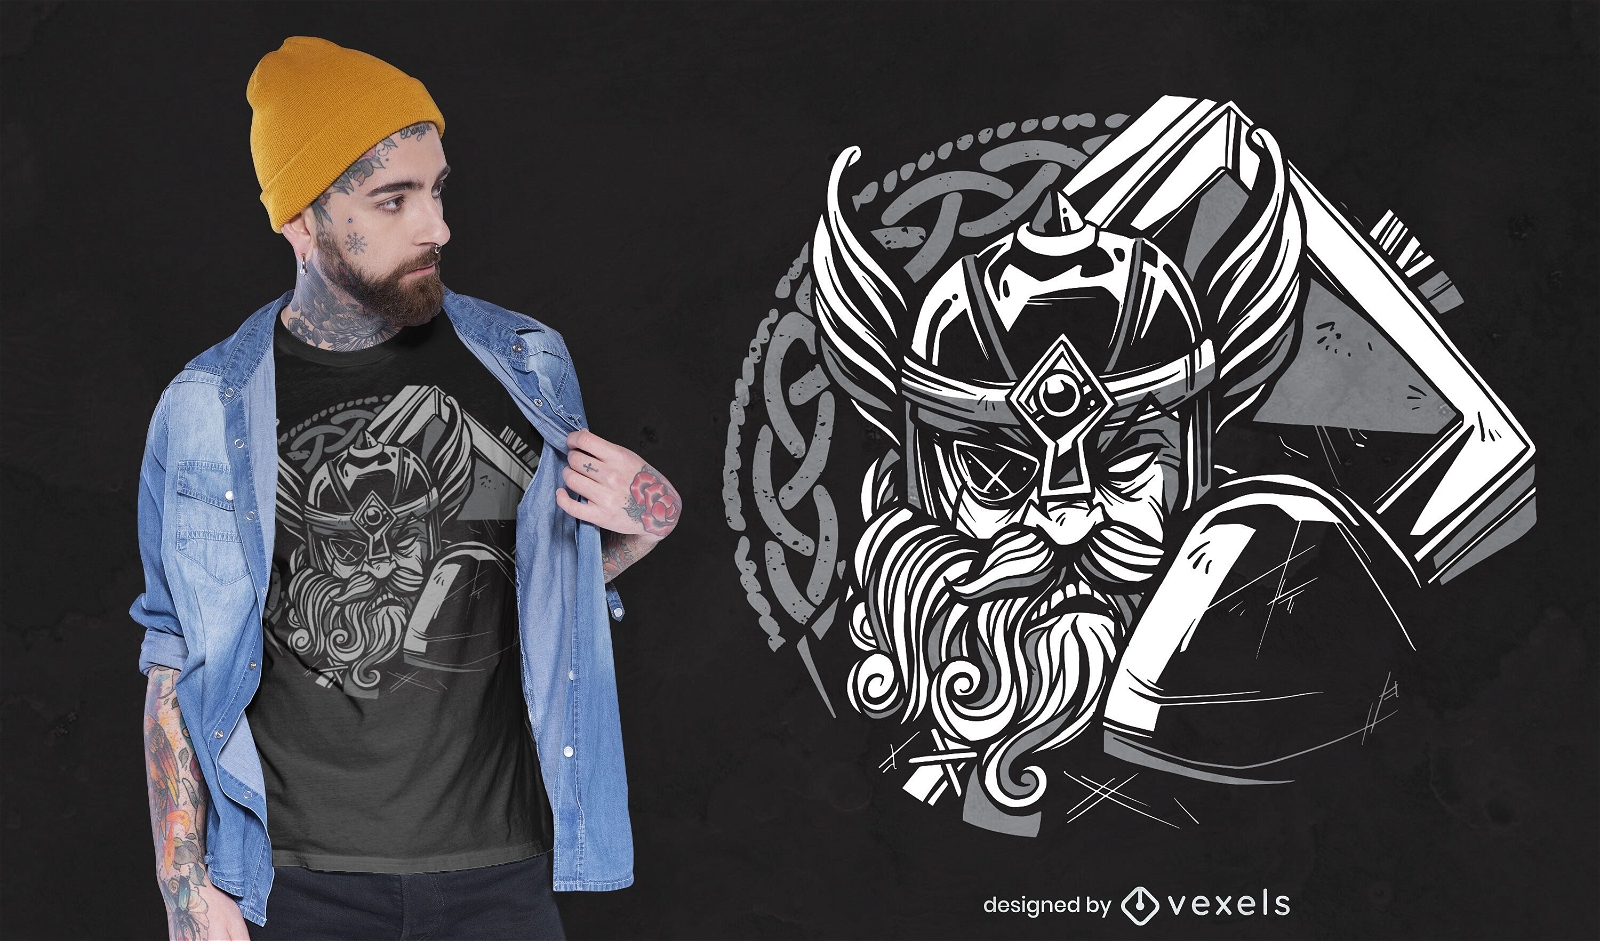
Viking character with hammer t-shirt design
Choose a folder
All favorites
Create new
Save
Viking character with hammer t-shirt design
Print ready
for Merch
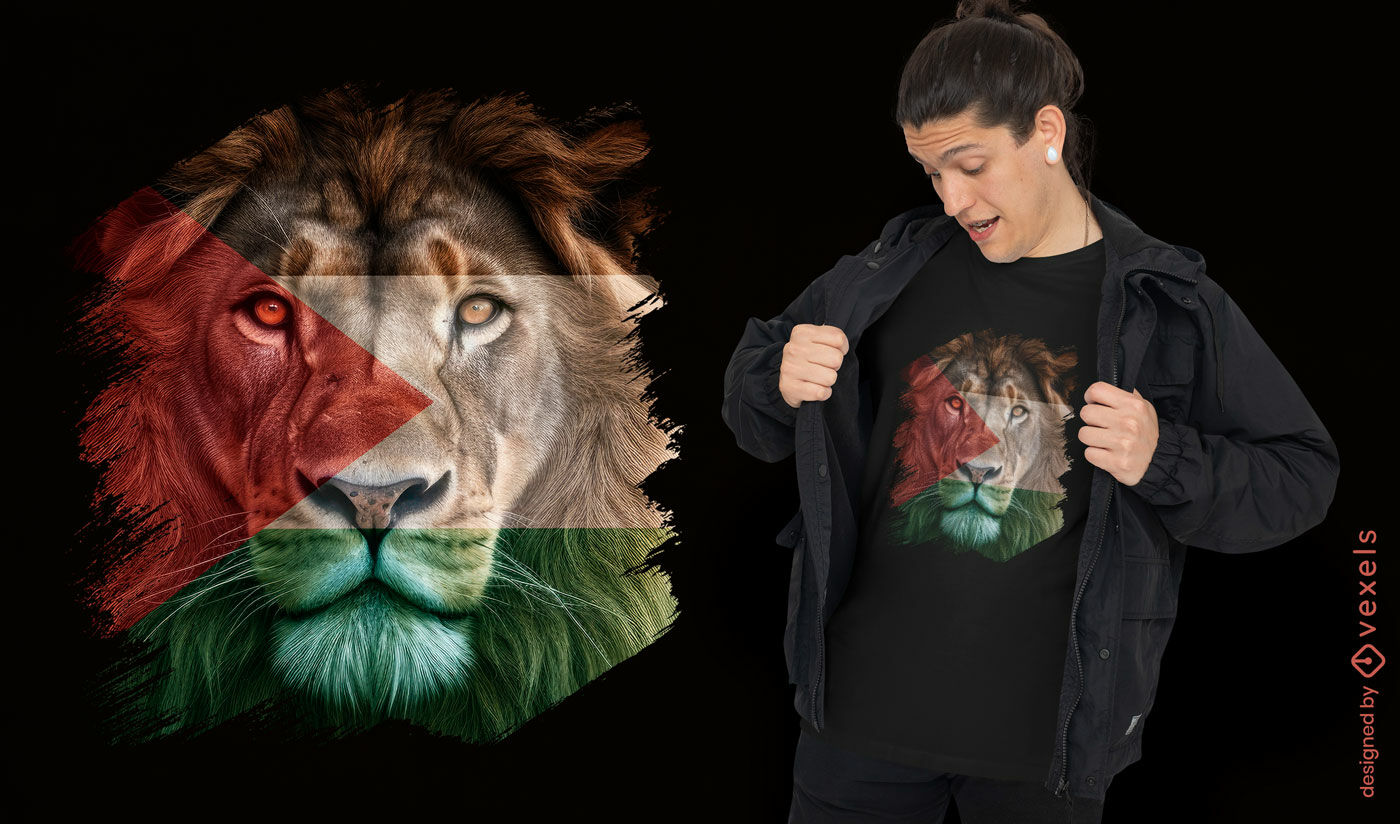
Majestic lion t-shirt design
Choose a folder
All favorites
Create new
Save
Majestic lion t-shirt design
Editable text
Print ready
for Merch
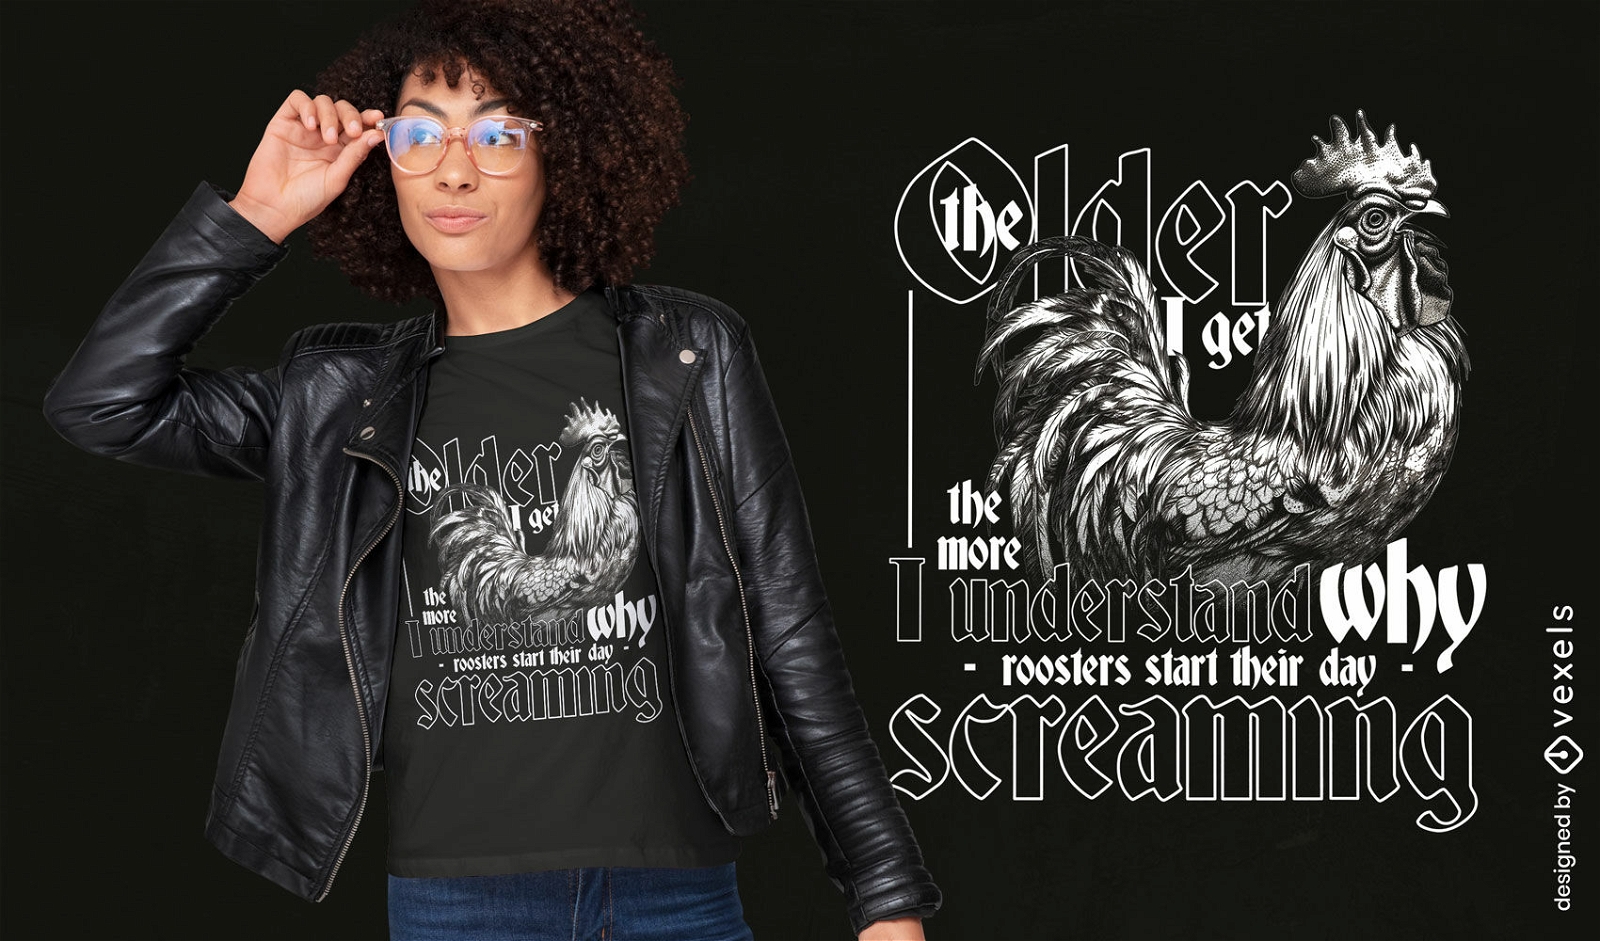
Rooster quote t-shirt design
Choose a folder
All favorites
Create new
Save
Rooster quote t-shirt design
Print ready
for Merch
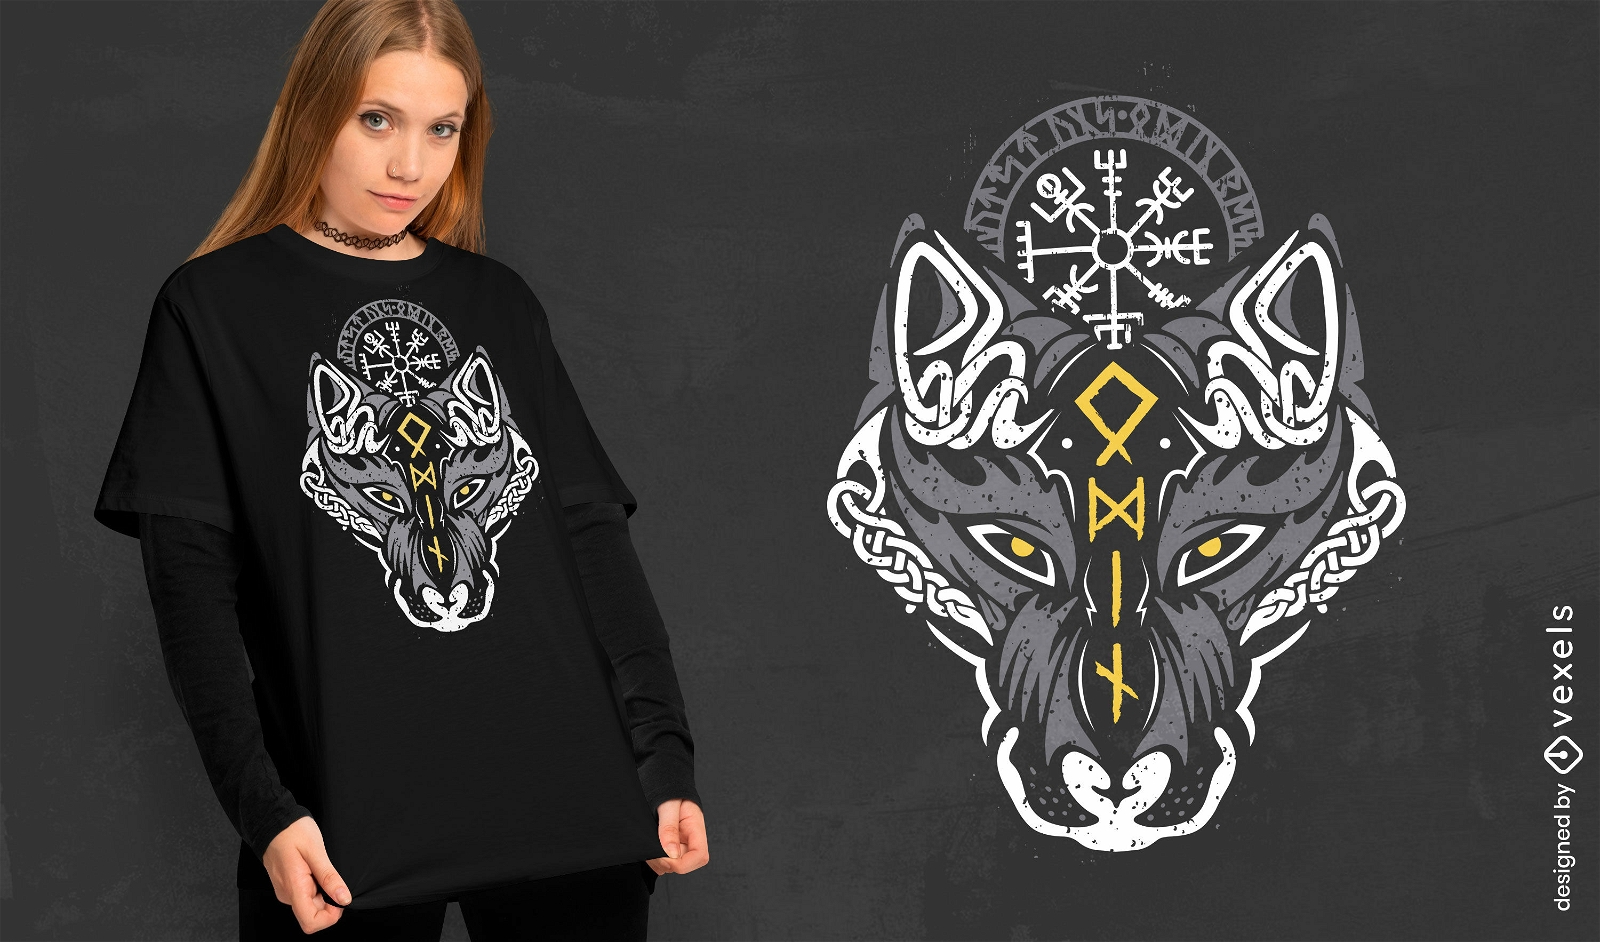
Norse Viking wolf t-shirt design
Choose a folder
All favorites
Create new
Save
Norse Viking wolf t-shirt design
Print ready
for Merch
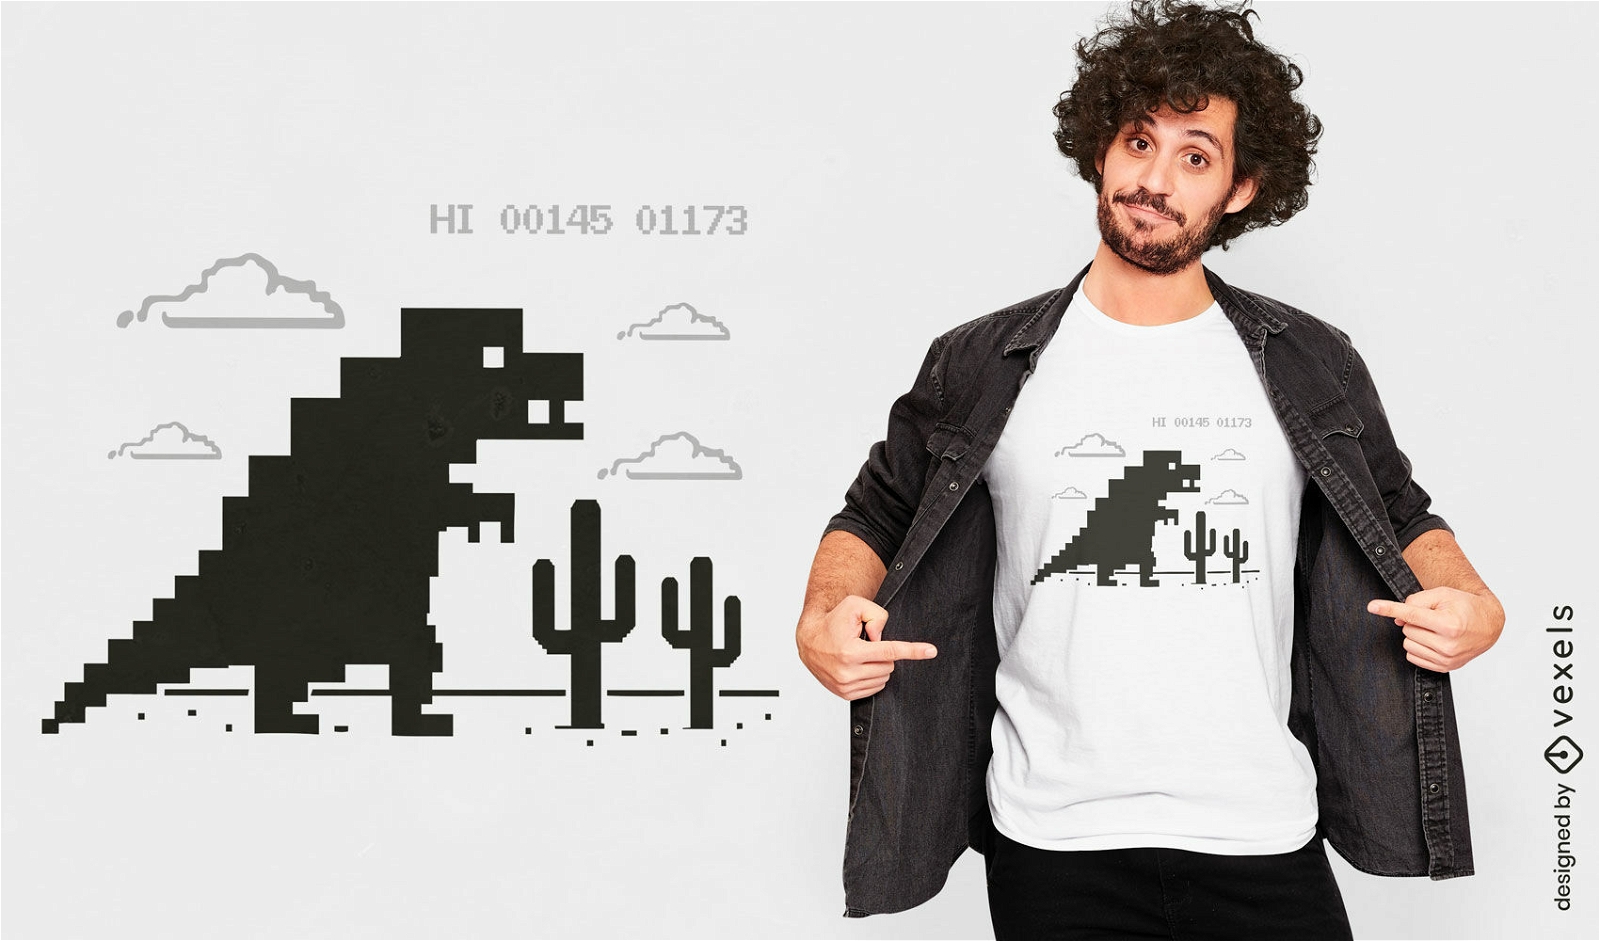
Dinosaur offline game t-shirt design
Choose a folder
All favorites
Create new
Save
Dinosaur offline game t-shirt design
Print ready
for Merch
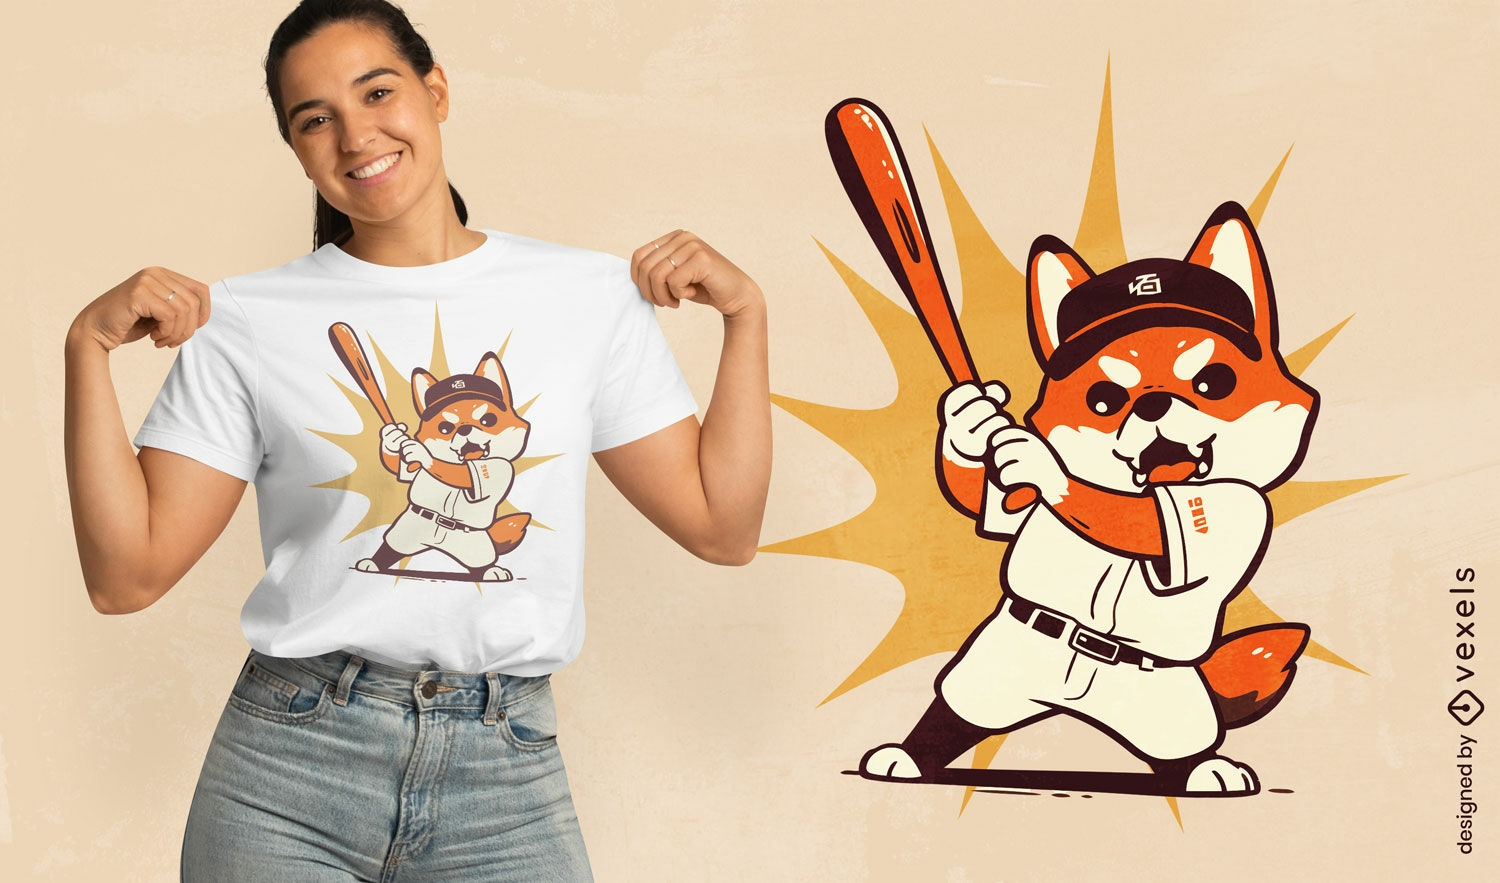
Baseball Shiba Inu t-shirt design
Choose a folder
All favorites
Create new
Save
Baseball Shiba Inu t-shirt design
Print ready
for Merch
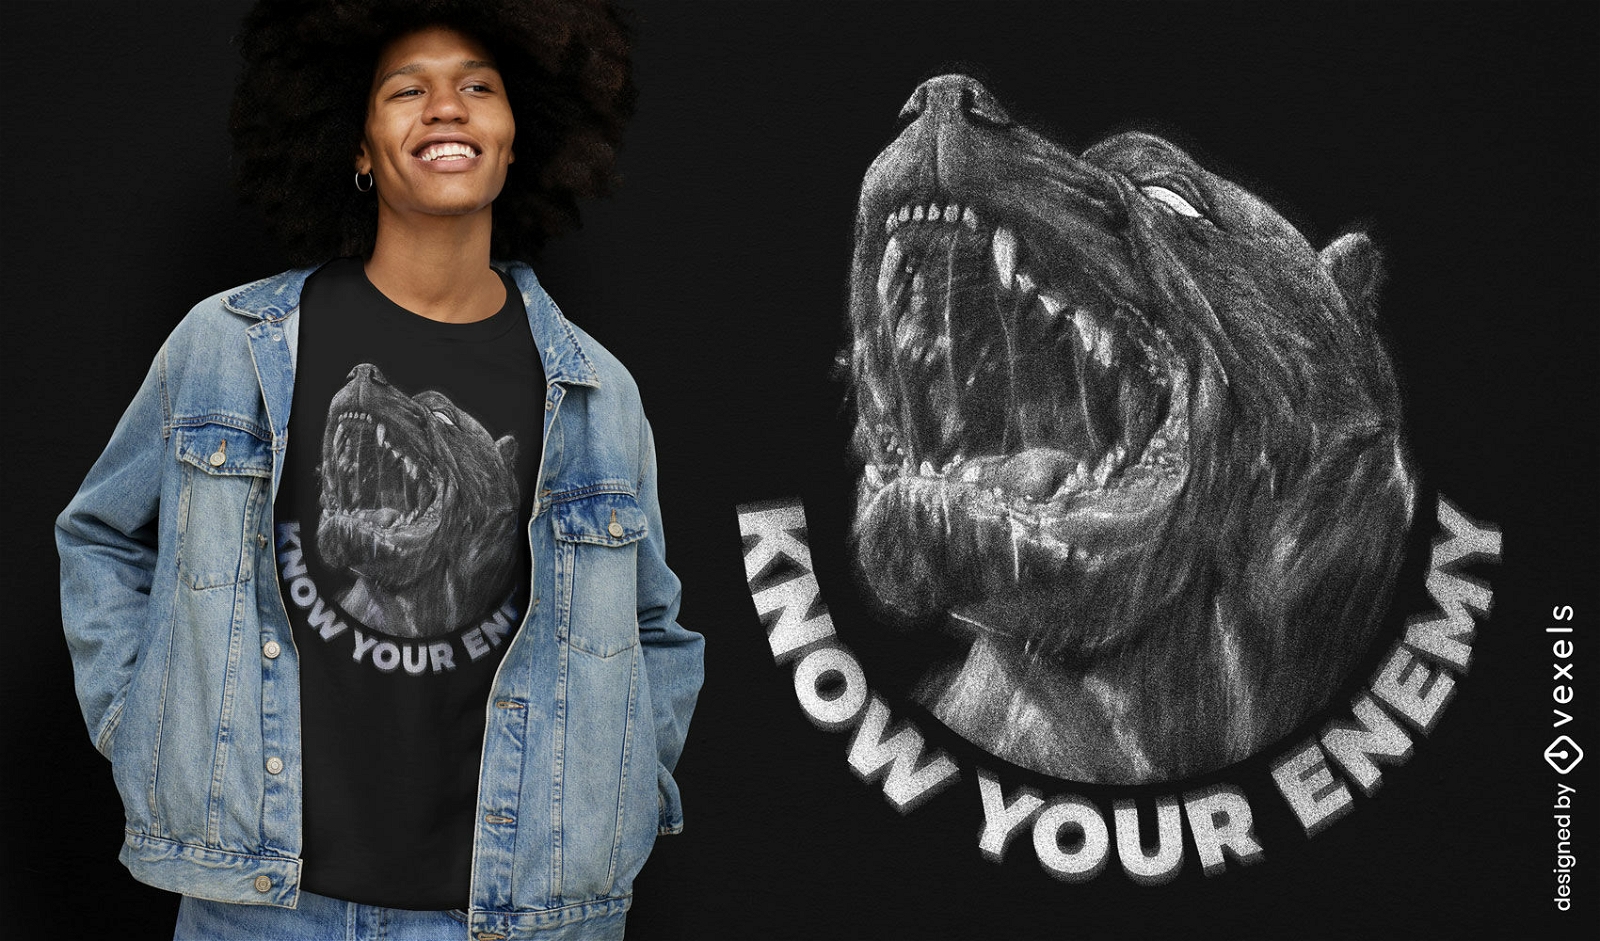
Realistic pitbull dog t-shirt design
Choose a folder
All favorites
Create new
Save
Realistic pitbull dog t-shirt design
Print ready
for Merch
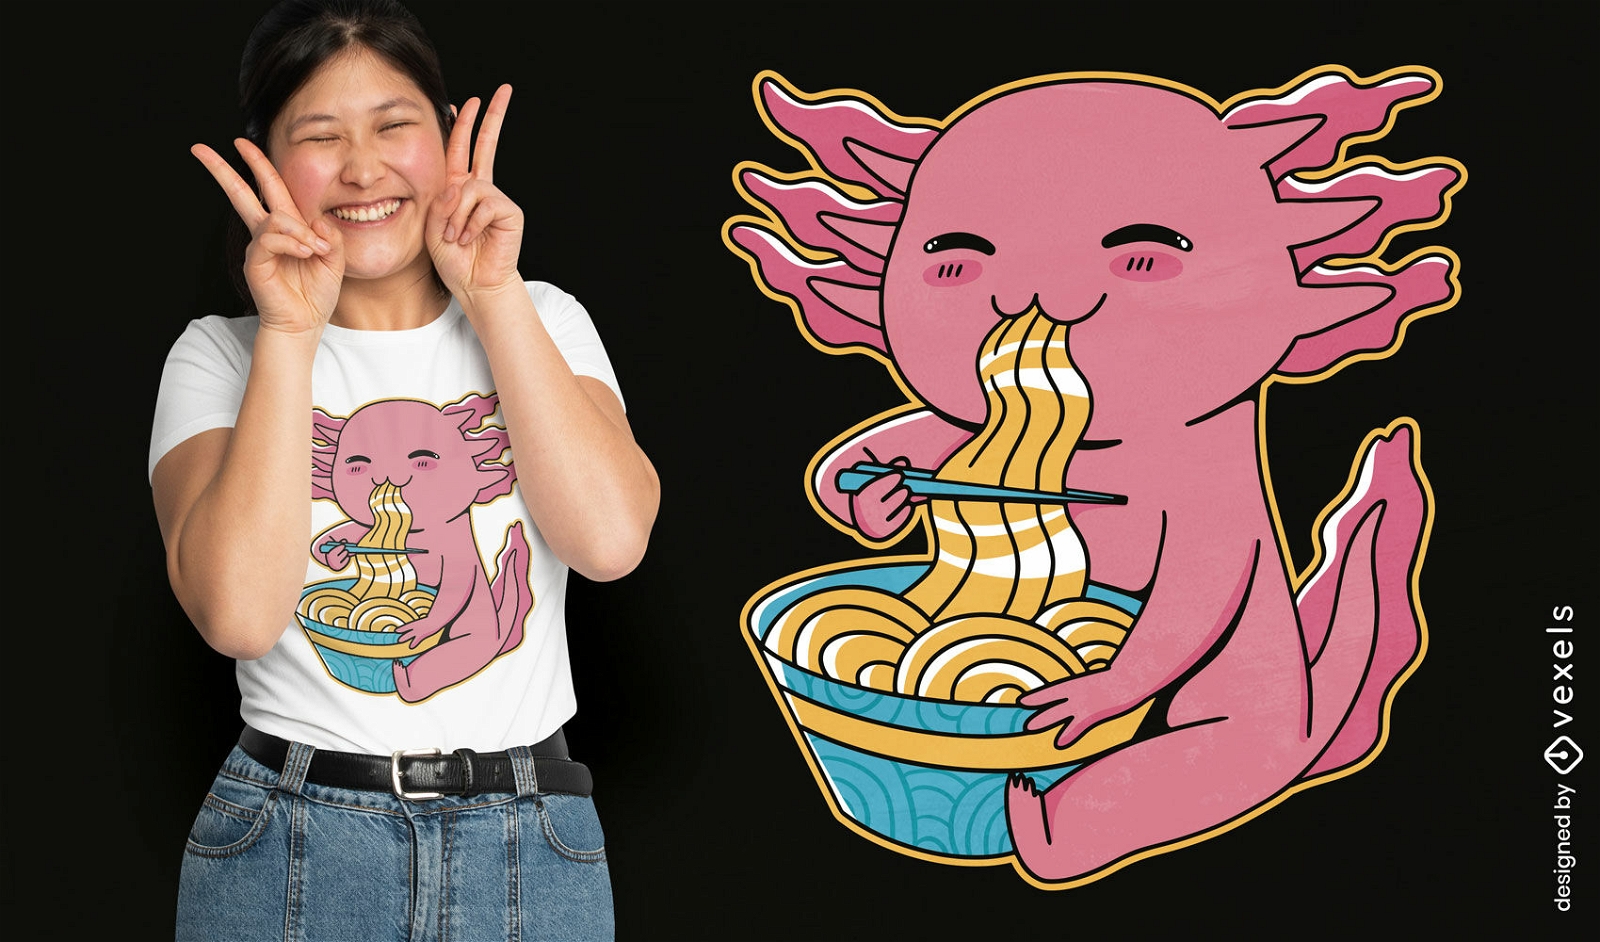
Cute axolotl animal eating ramen t-shirt design
Choose a folder
All favorites
Create new
Save
Cute axolotl animal eating ramen t-shirt design
Print ready
for Merch
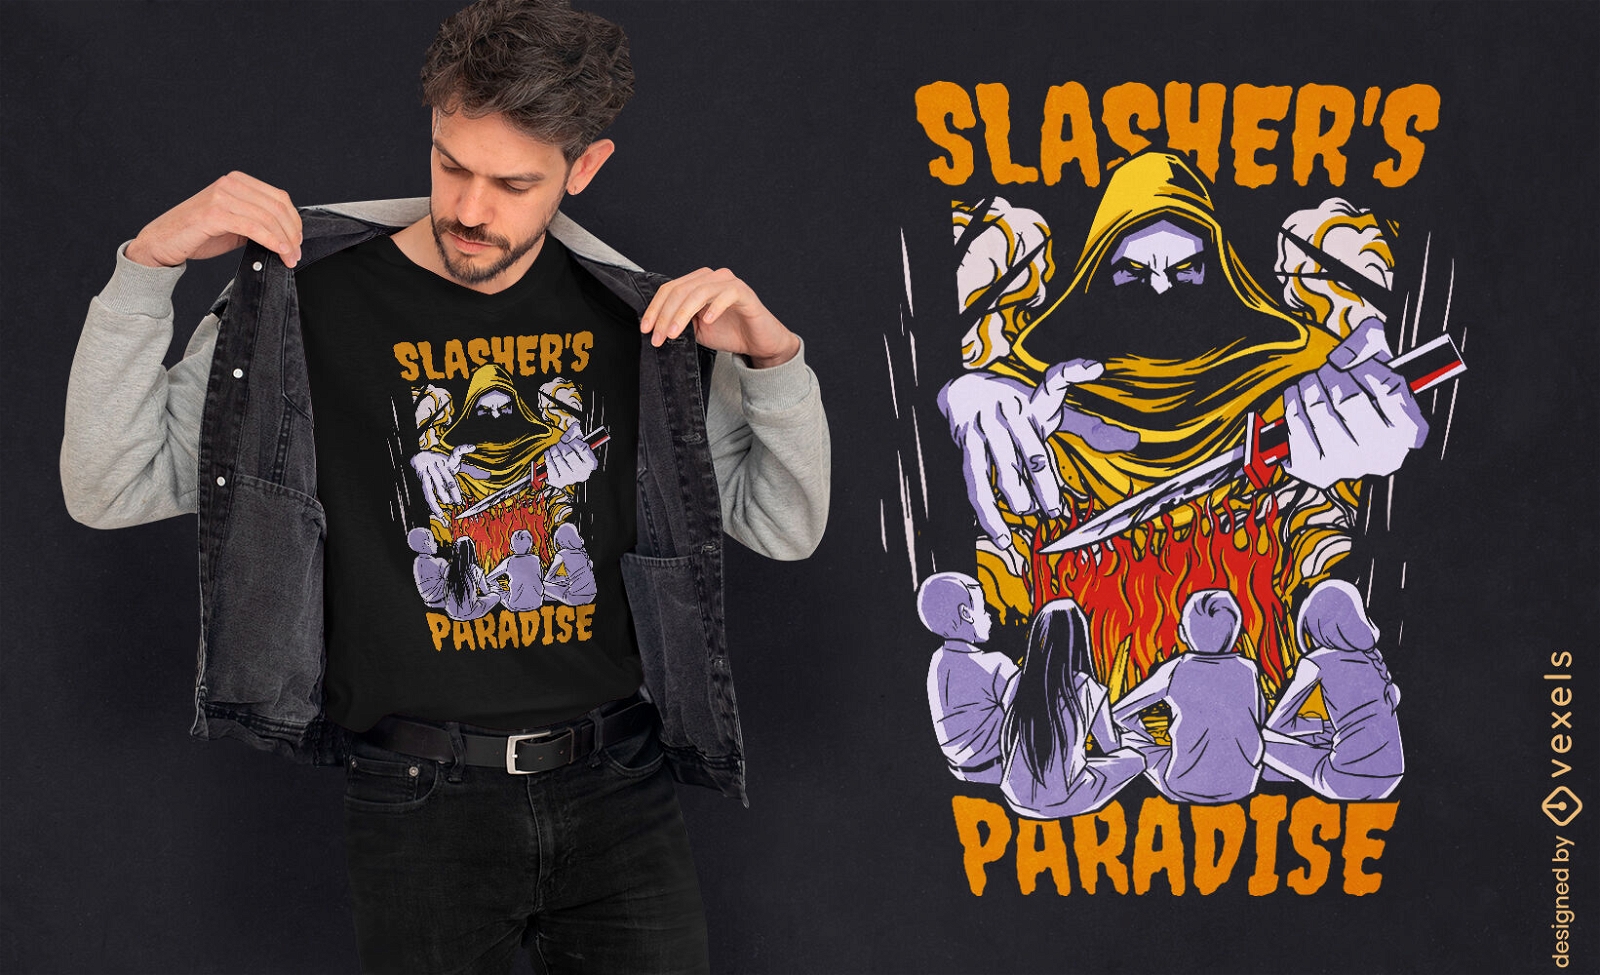
Children camping and killer t-shirt design
Choose a folder
All favorites
Create new
Save
Children camping and killer t-shirt design
Print ready
for Merch
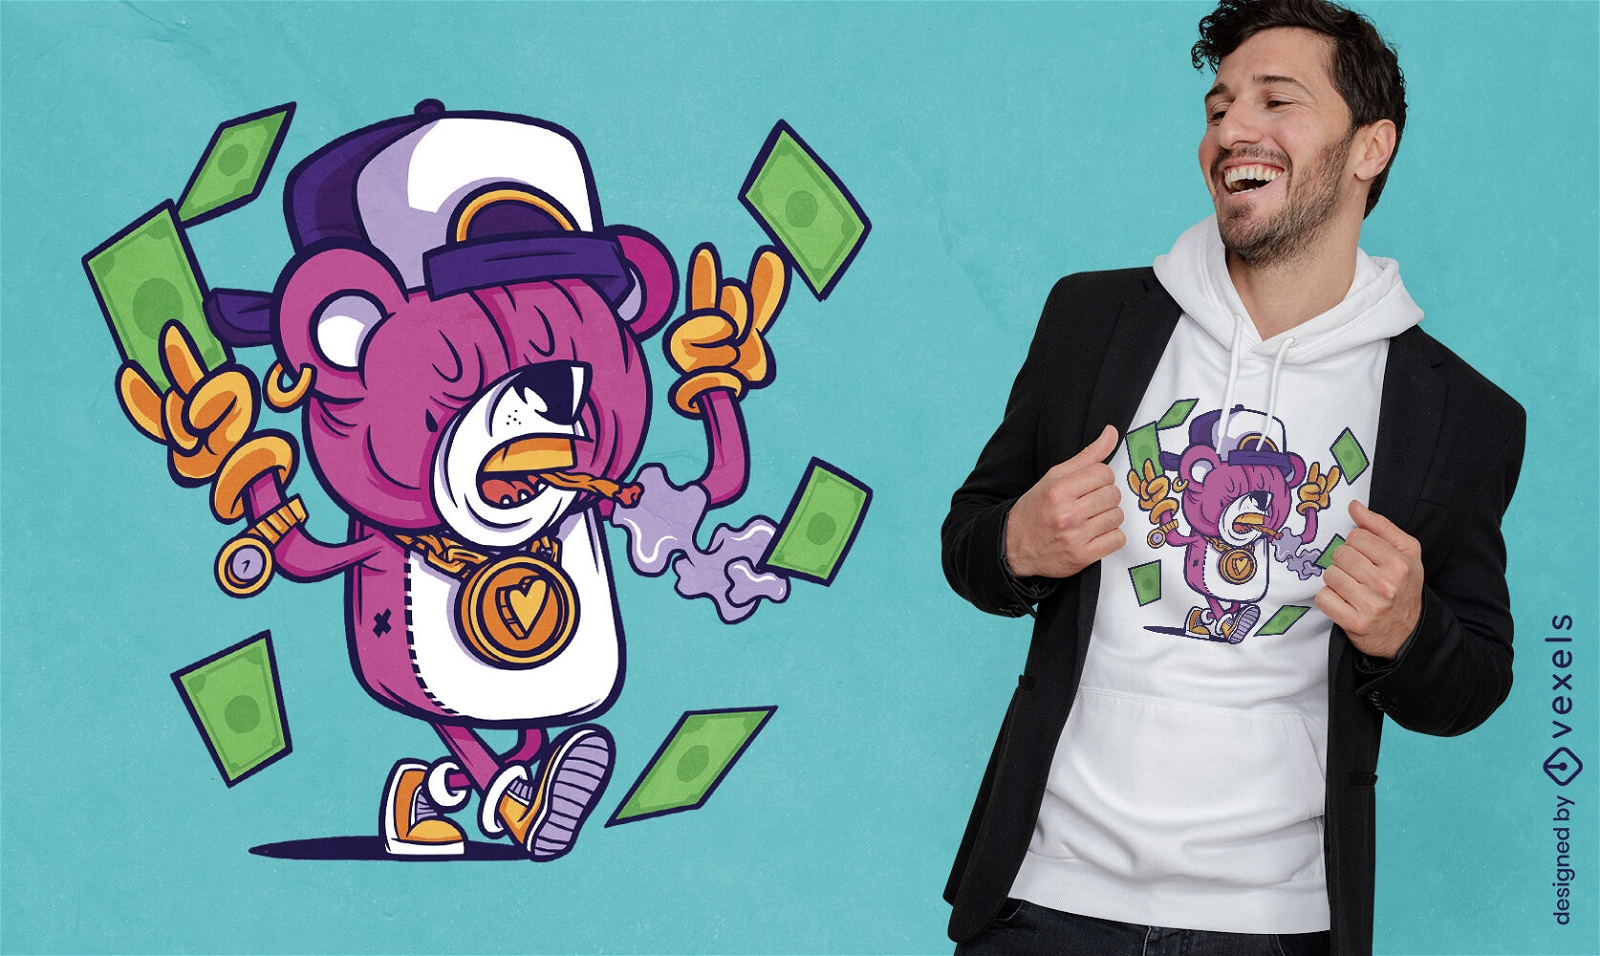
Gangster teddy bear cartoon t-shirt design
Choose a folder
All favorites
Create new
Save
Gangster teddy bear cartoon t-shirt design
Print ready
for Merch
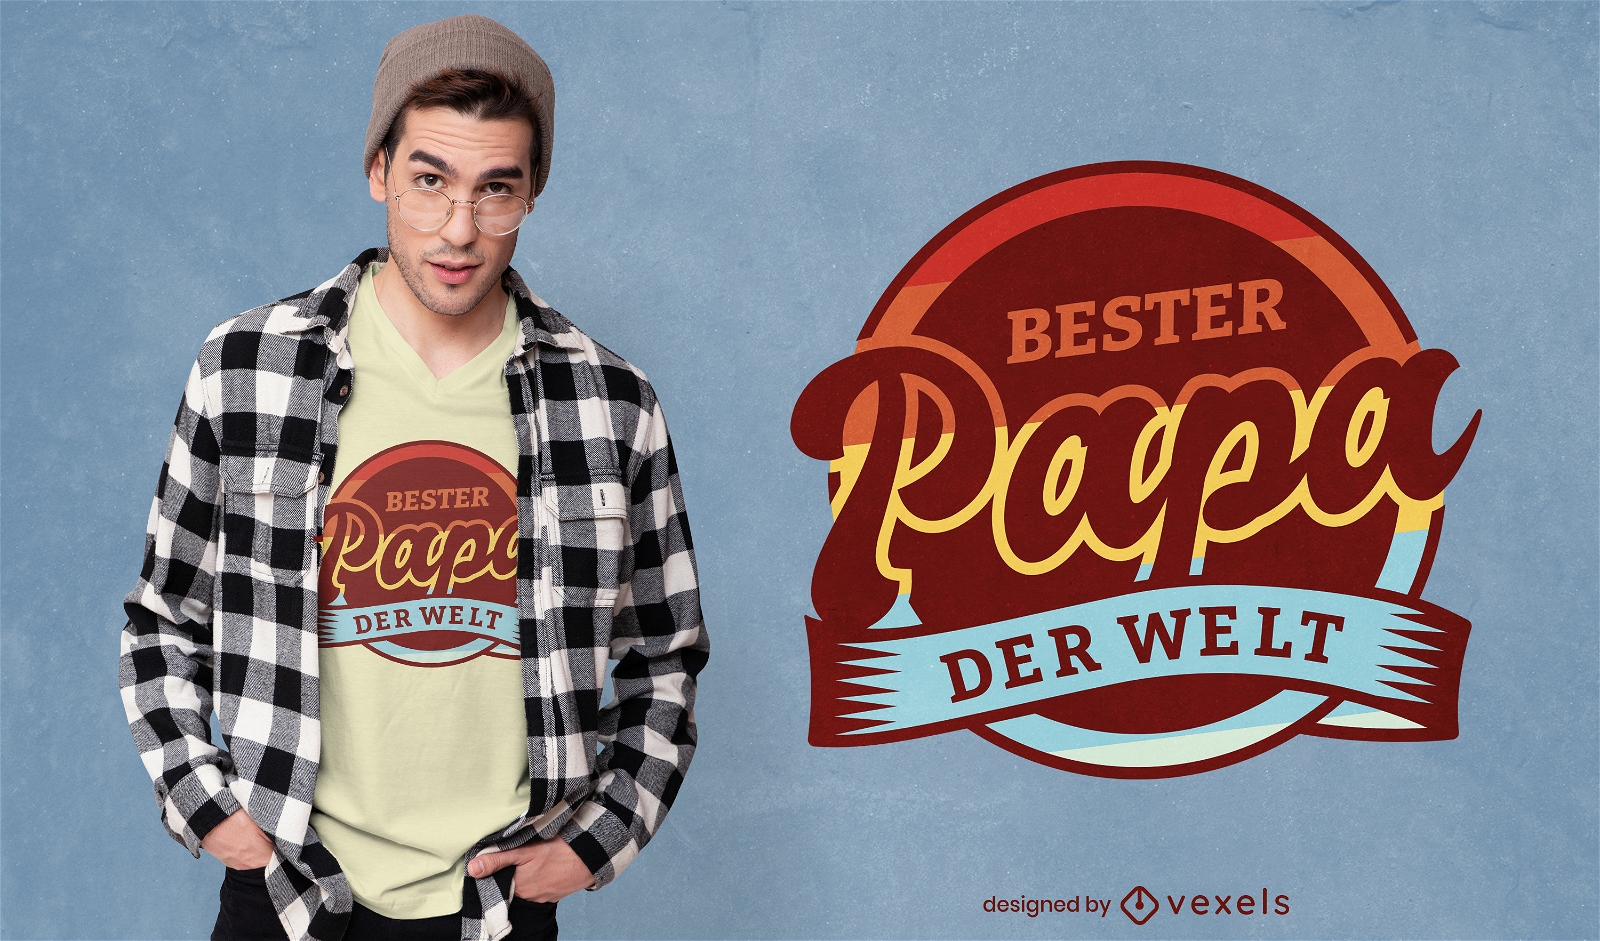
German dad quote retro t-shirt design
Choose a folder
All favorites
Create new
Save
German dad quote retro t-shirt design
Print ready
for Merch
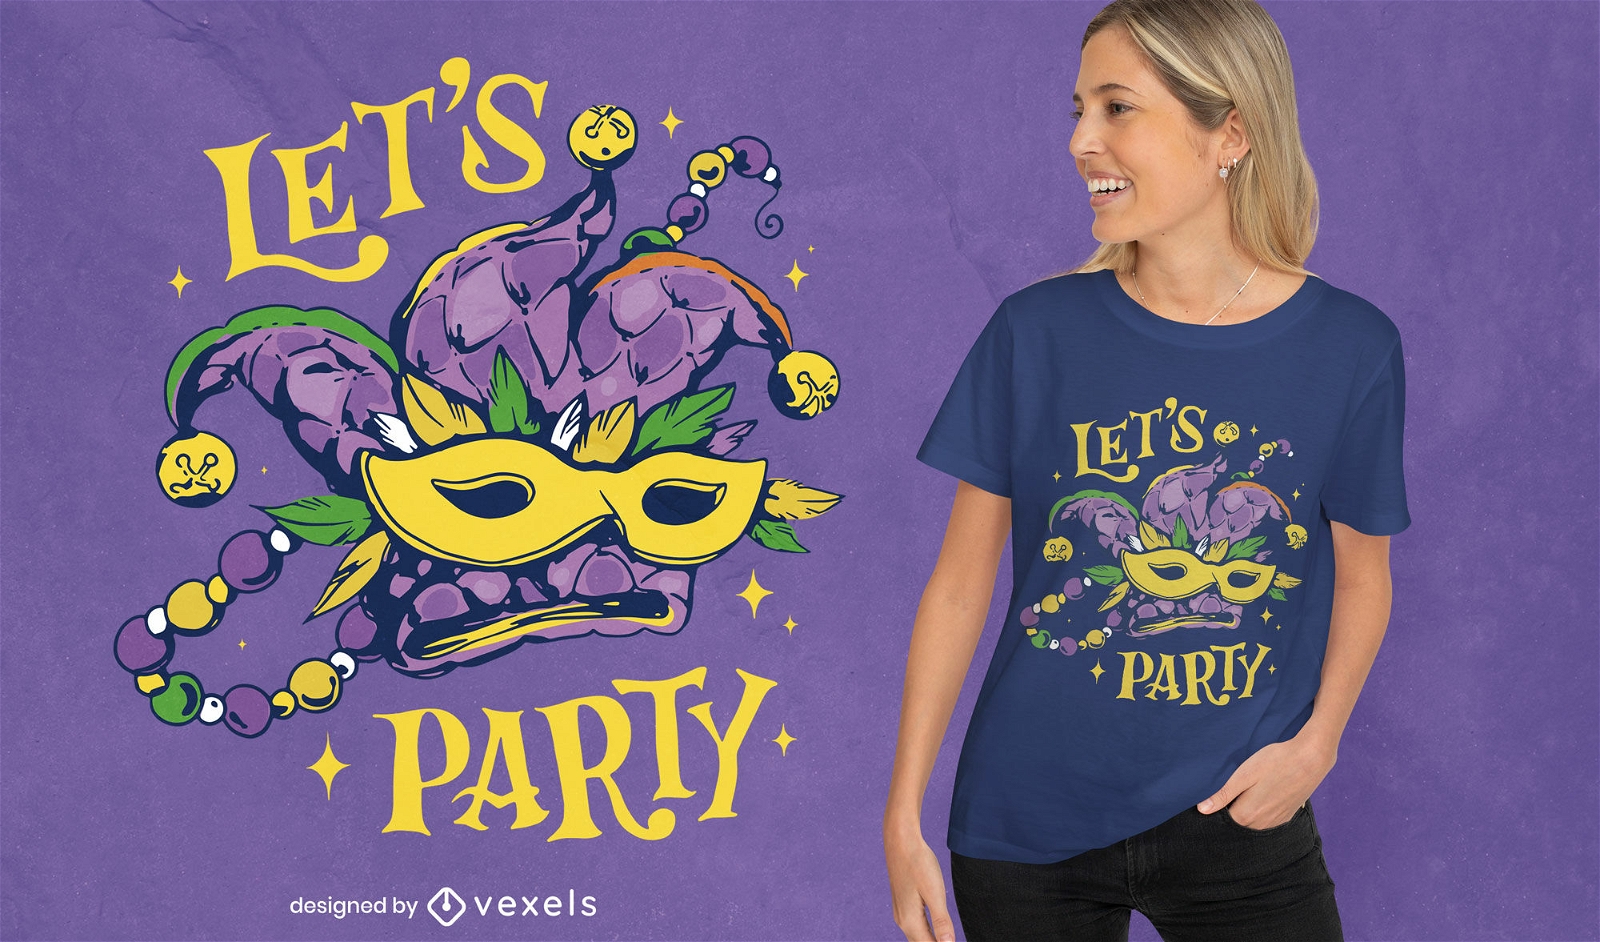
Mardi Gras party quote t-shirt design
Choose a folder
All favorites
Create new
Save
Mardi Gras party quote t-shirt design
Print ready
for Merch
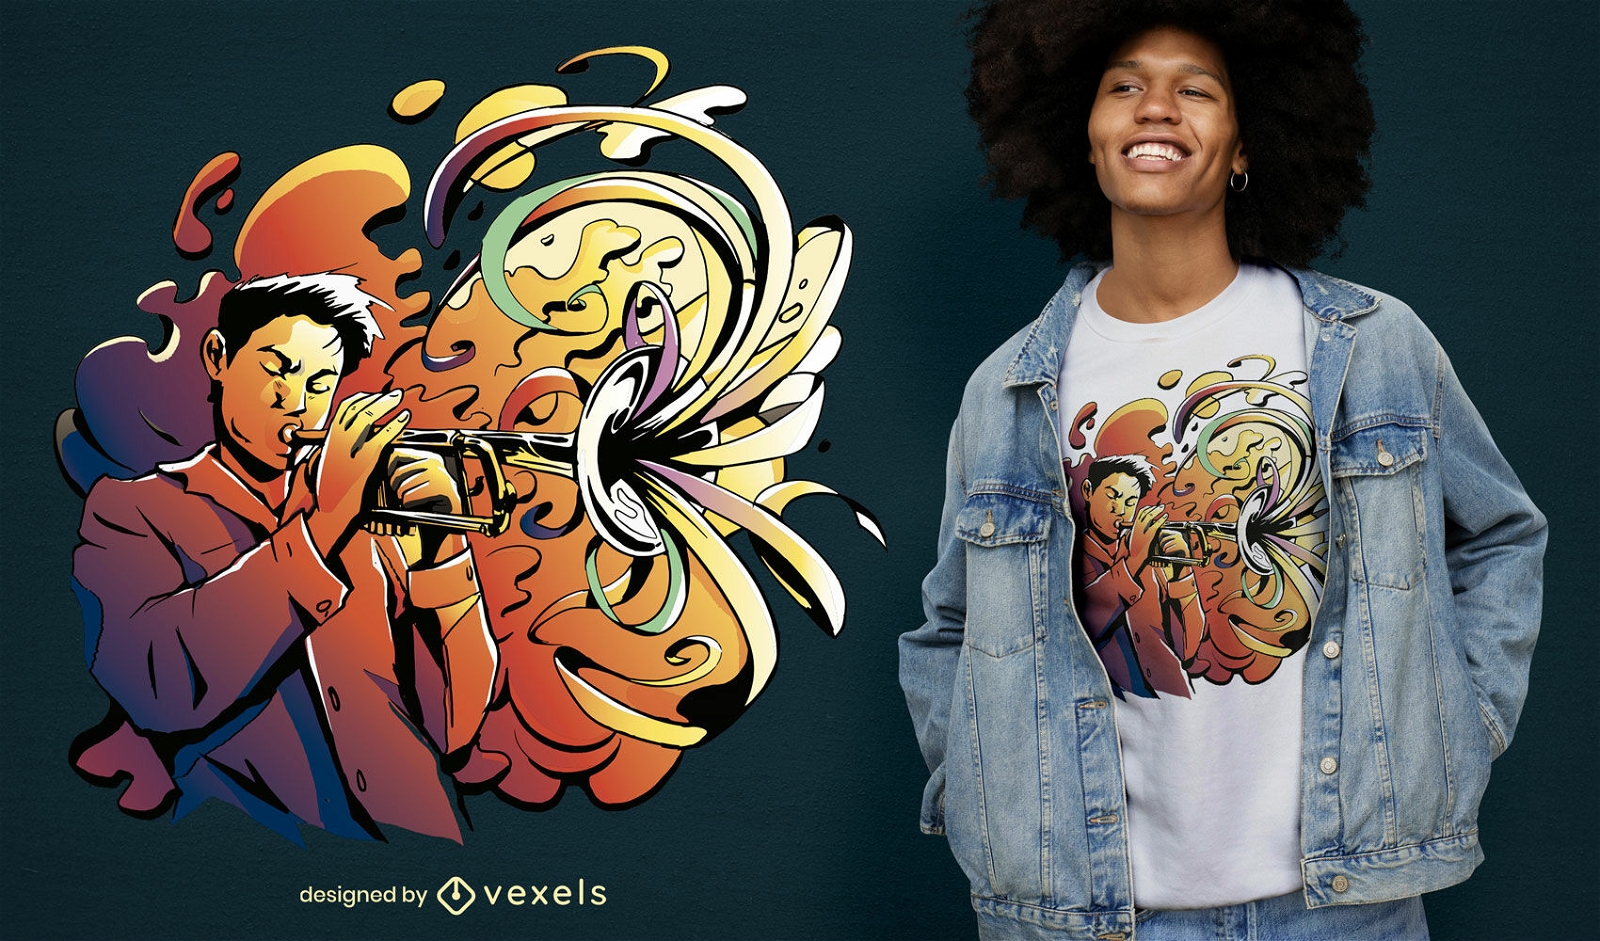
Man playing trumpet t-shirt design
Choose a folder
All favorites
Create new
Save
Man playing trumpet t-shirt design
Print ready
for Merch
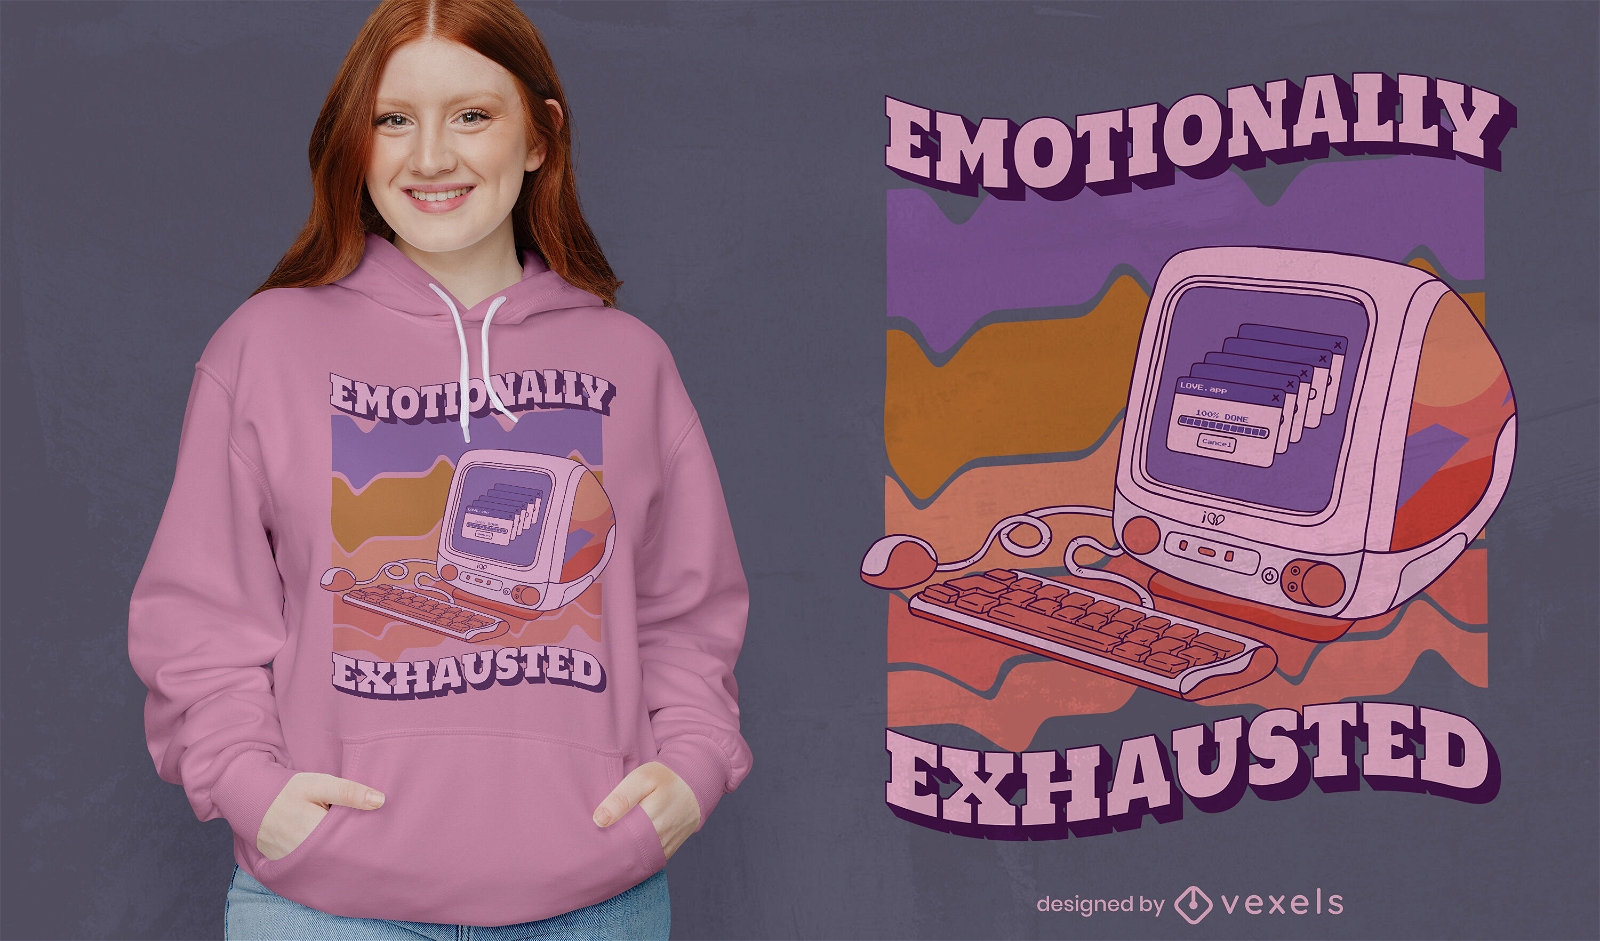
Retro computer anti-valentines t-shirt design
Choose a folder
All favorites
Create new
Save
Retro computer anti-valentines t-shirt design
Print ready
for Merch
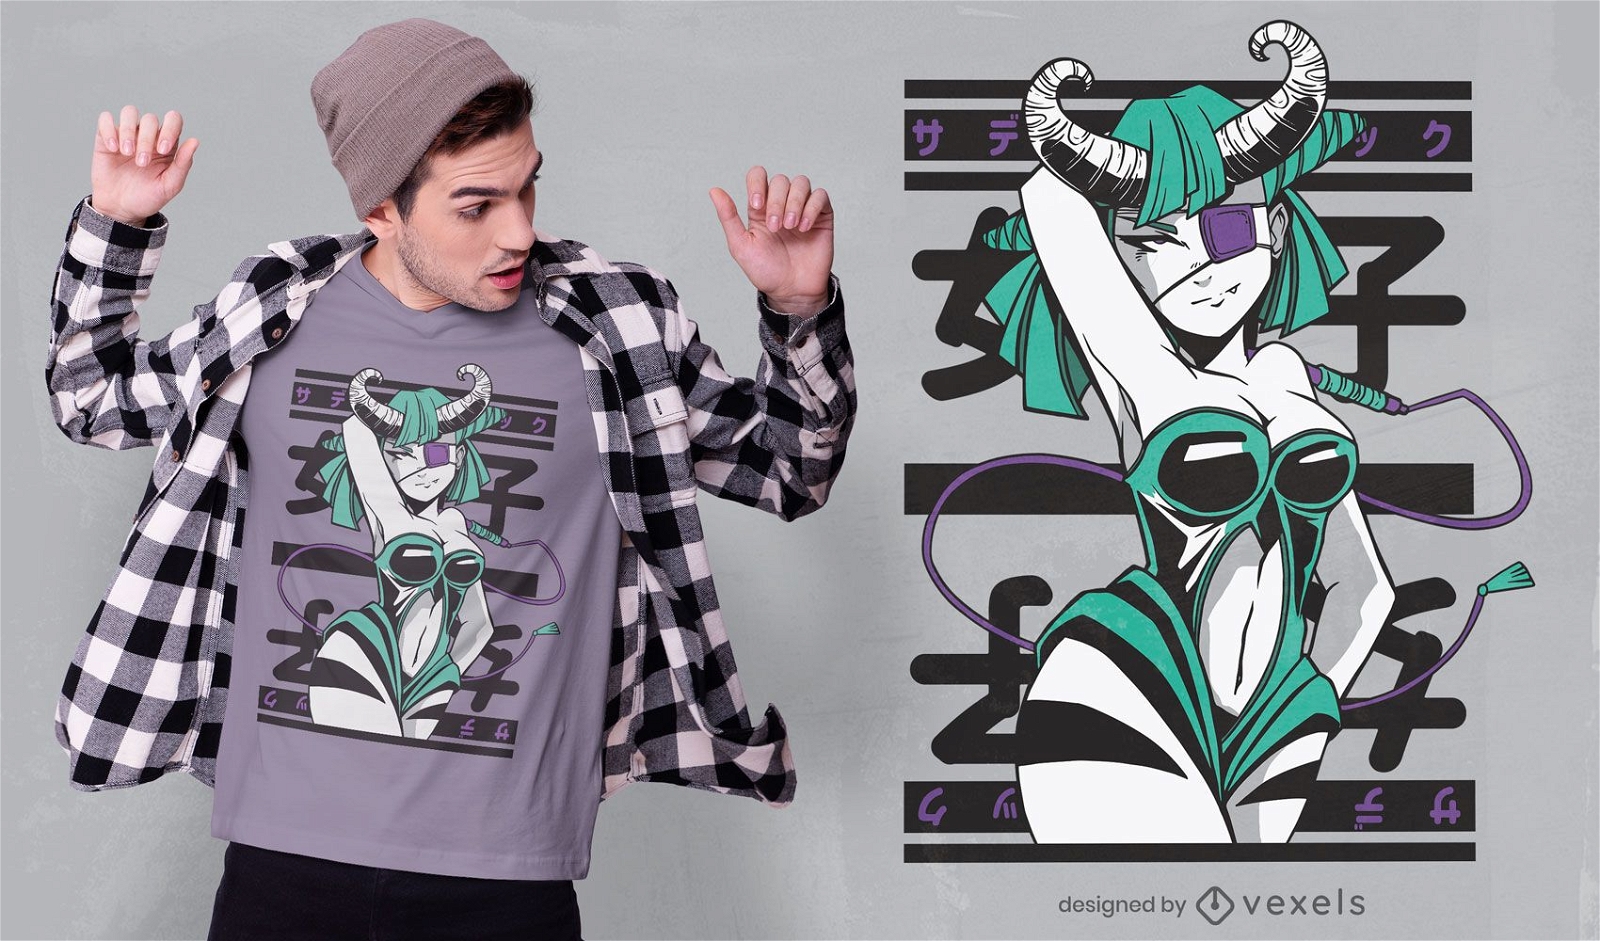
Anime girl character horns t-shirt design
Choose a folder
All favorites
Create new
Save
Anime girl character horns t-shirt design
Boost Your Business
With The Leading Graphic Platform For Merch.
SEE PLANS
Next
of 817
prev page
next page