Design Library
Explore Designs
New Merch Designs
Trending Merch Designs
Vectors
PNGs & SVGs
Mockups
T-Shirts
T-Shirt PSD Templates
KDP Designs
Phone Cases
Pillows
Tote Bags
Posters
Mugs
Design Tools
Designer
New!
T-shirt Maker
Mockup Generator
Quote Generator
Logo Maker
Resources
Merch Digest
Blog
Help Center
Creators Program
Learn About Merch
Changelog
API Access
Pricing
Loading...
Sign Up
Login
All
grafico
Design Library
Explore Designs
New Merch Designs
Trending Merch Designs
Vectors
PNGs & SVGs
Mockups
T-Shirts
T-Shirt PSD Templates
KDP Designs
Phone Cases
Pillows
Tote Bags
Posters
Mugs
Design Tools
Designer
New!
T-shirt Maker
Mockup Generator
Quote Generator
Logo Maker
Resources
Merch Digest
Blog
Help Center
Creators Program
Learn About Merch
Changelog
API Access
PLANS
All
grafico
40815 grafico designs graphics for t-shirt and print on demand merch
Download grafico t-shirt designs and other merch graphics like book covers, phone cases, tote bags and more.
Sort by
Most relevant
Sponsored results by
Get 15% off with code: VEXELS15
Show more
Editable text
Print ready
for Merch
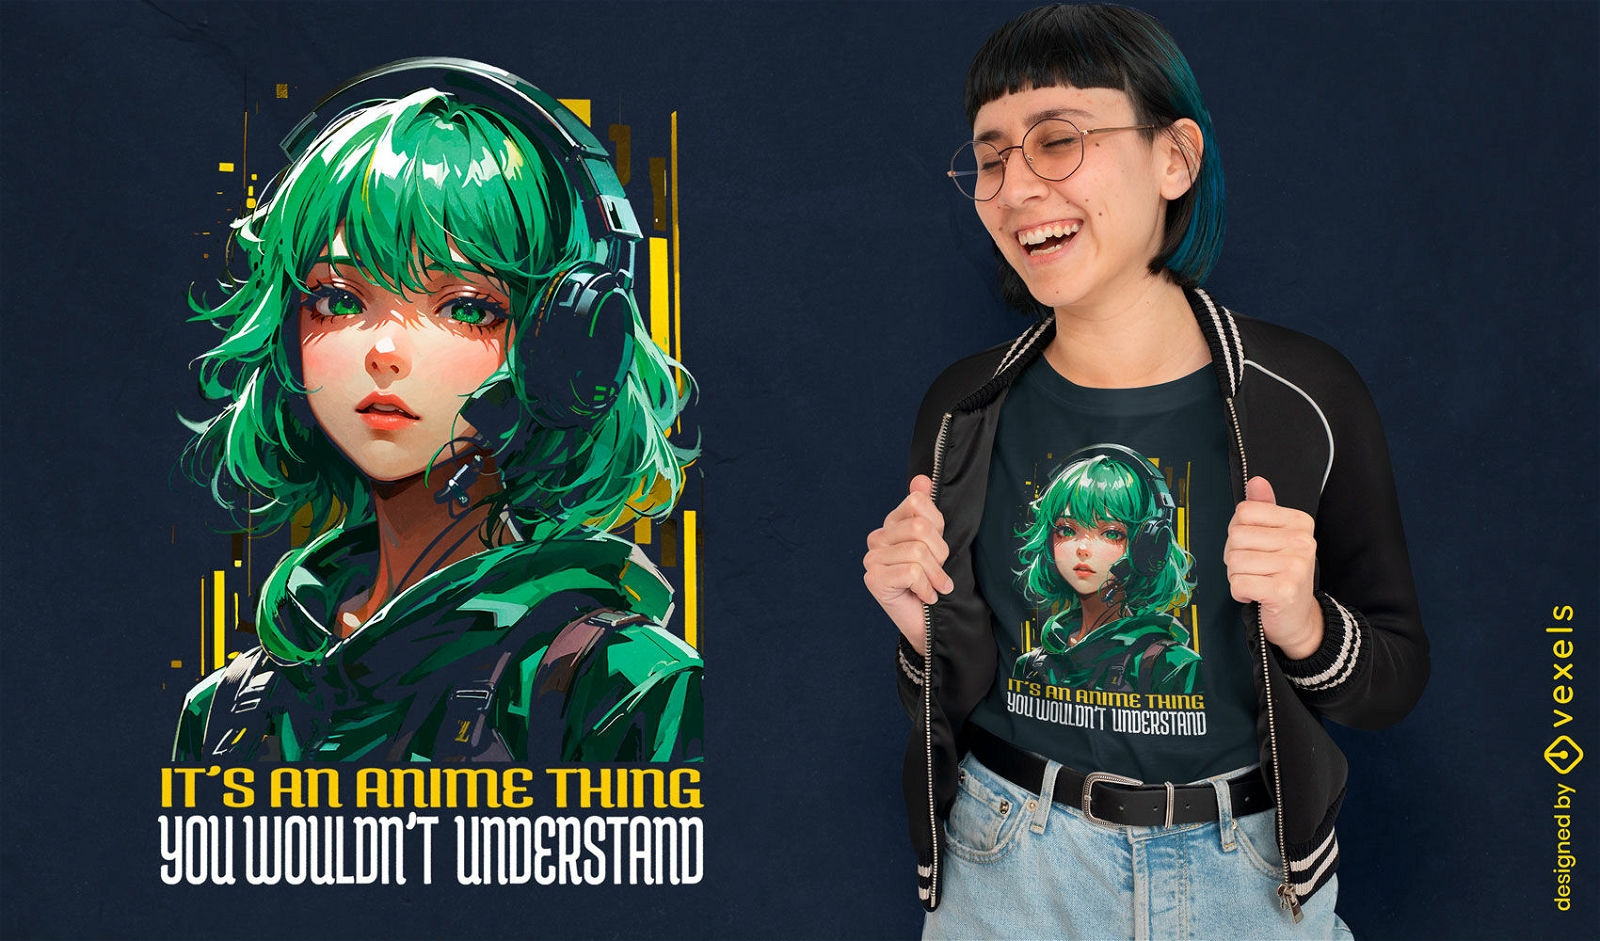
Anime inspired girl t-shirt design
Choose a folder
All favorites
Create new
Save
Anime inspired girl t-shirt design
Print ready
for Merch
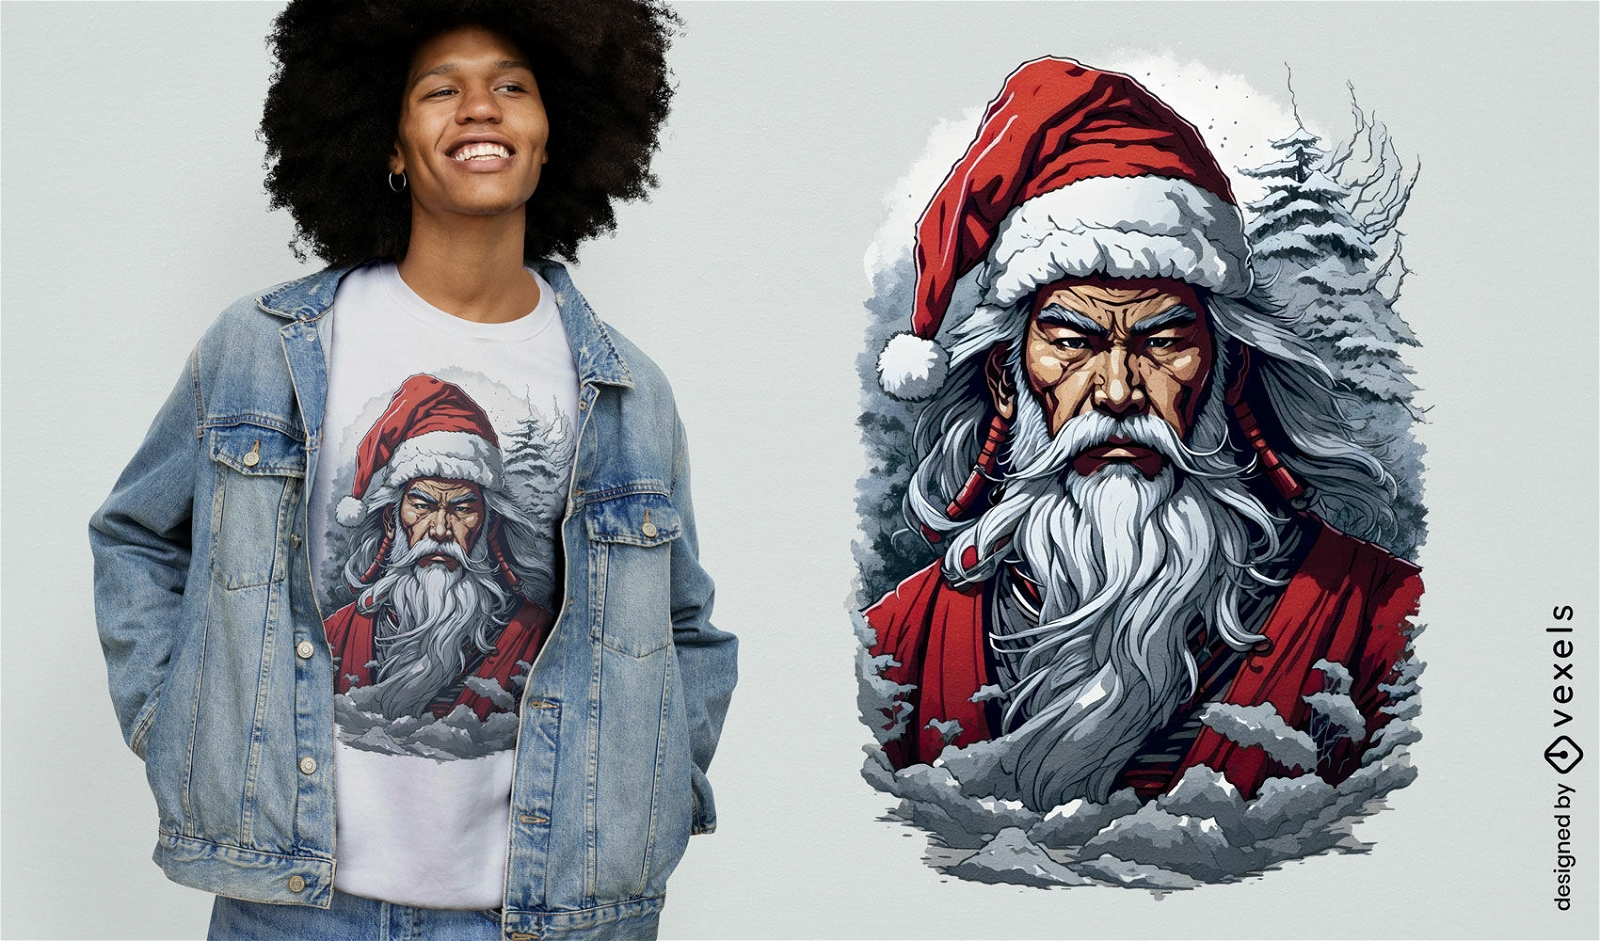
Samurai Santa Claus t-shirt design
Choose a folder
All favorites
Create new
Save
Samurai Santa Claus t-shirt design
Print ready
for Merch
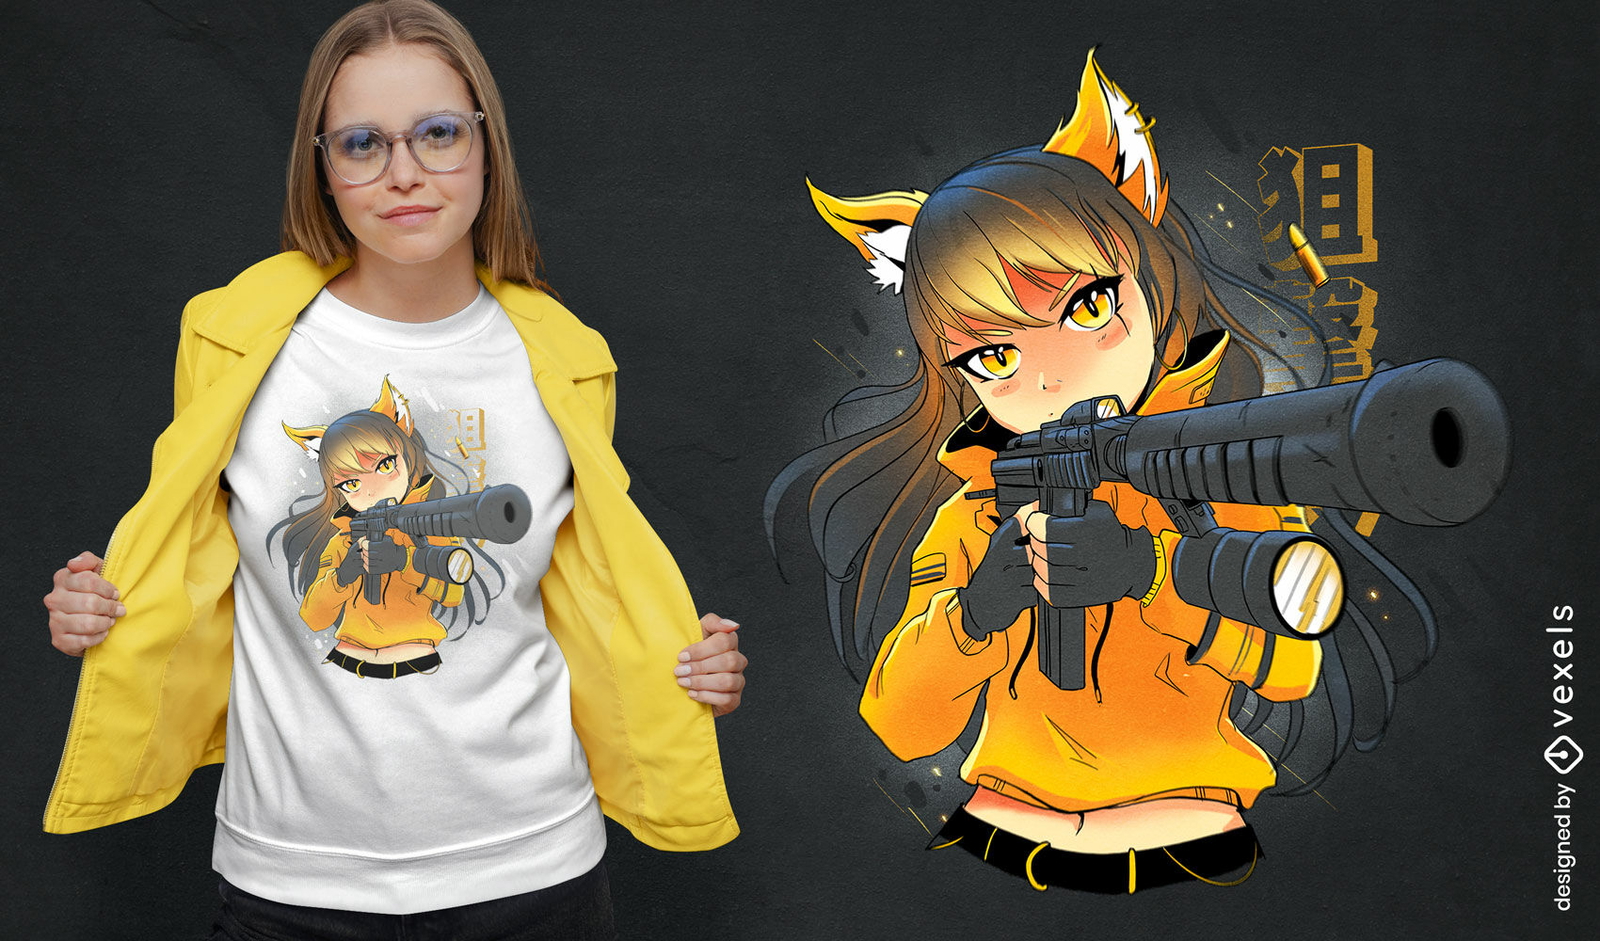
Anime army fox girl t-shirt design
Choose a folder
All favorites
Create new
Save
Anime army fox girl t-shirt design
Editable text
Print ready
for Merch
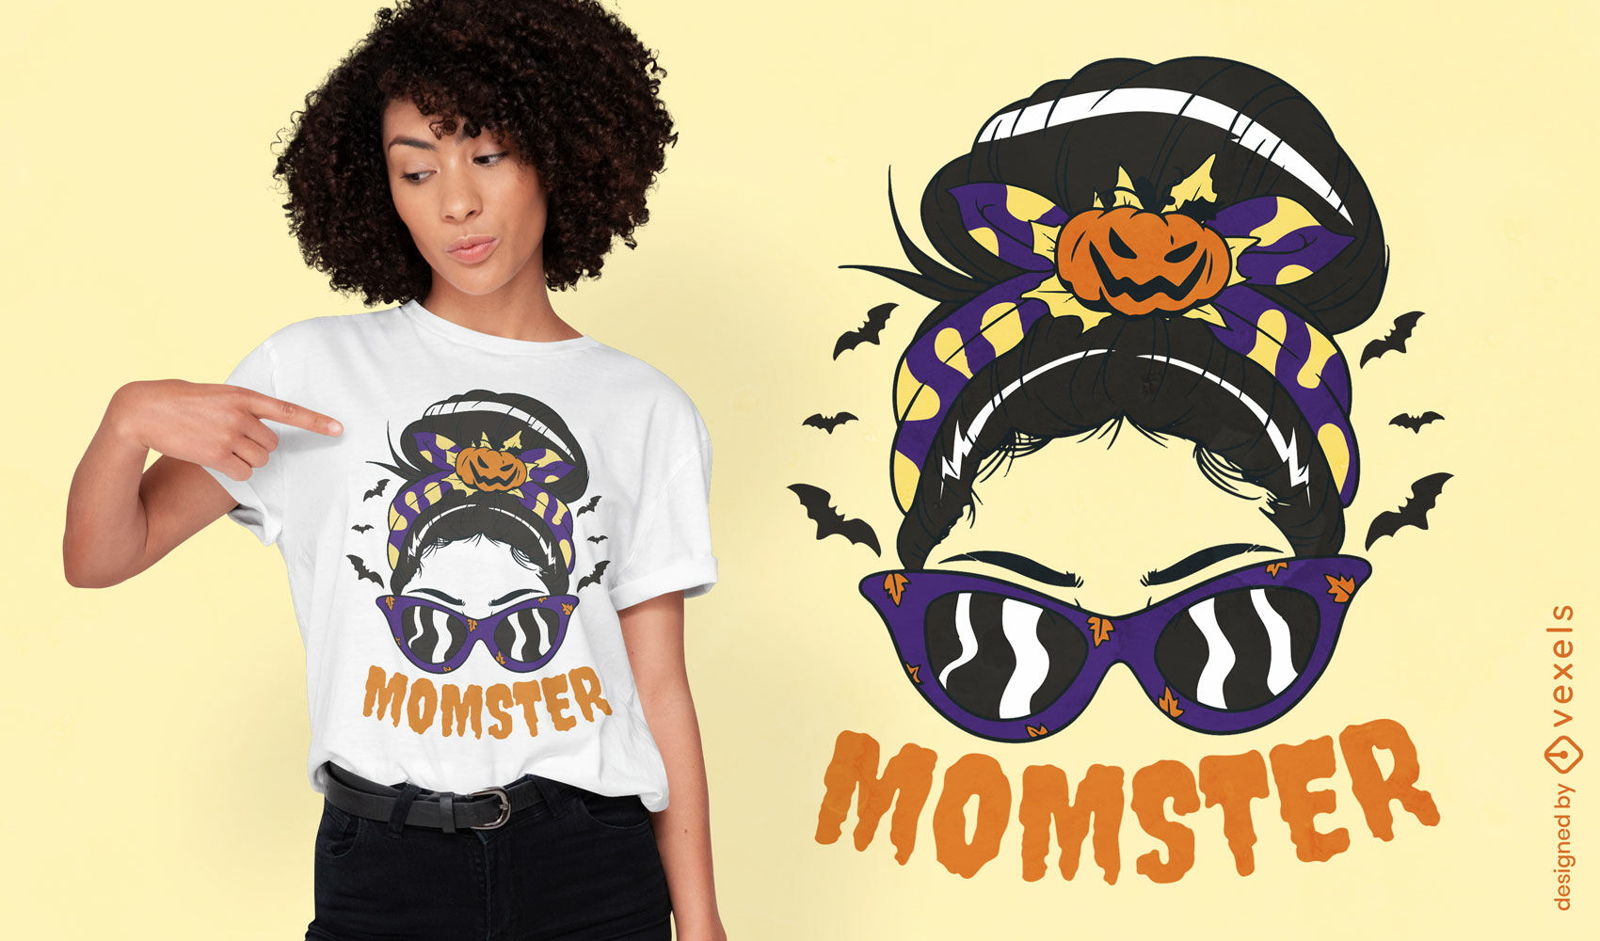
Woman with halloween headband t-shirt design
Choose a folder
All favorites
Create new
Save
Woman with halloween headband t-shirt design
Print ready
for Merch
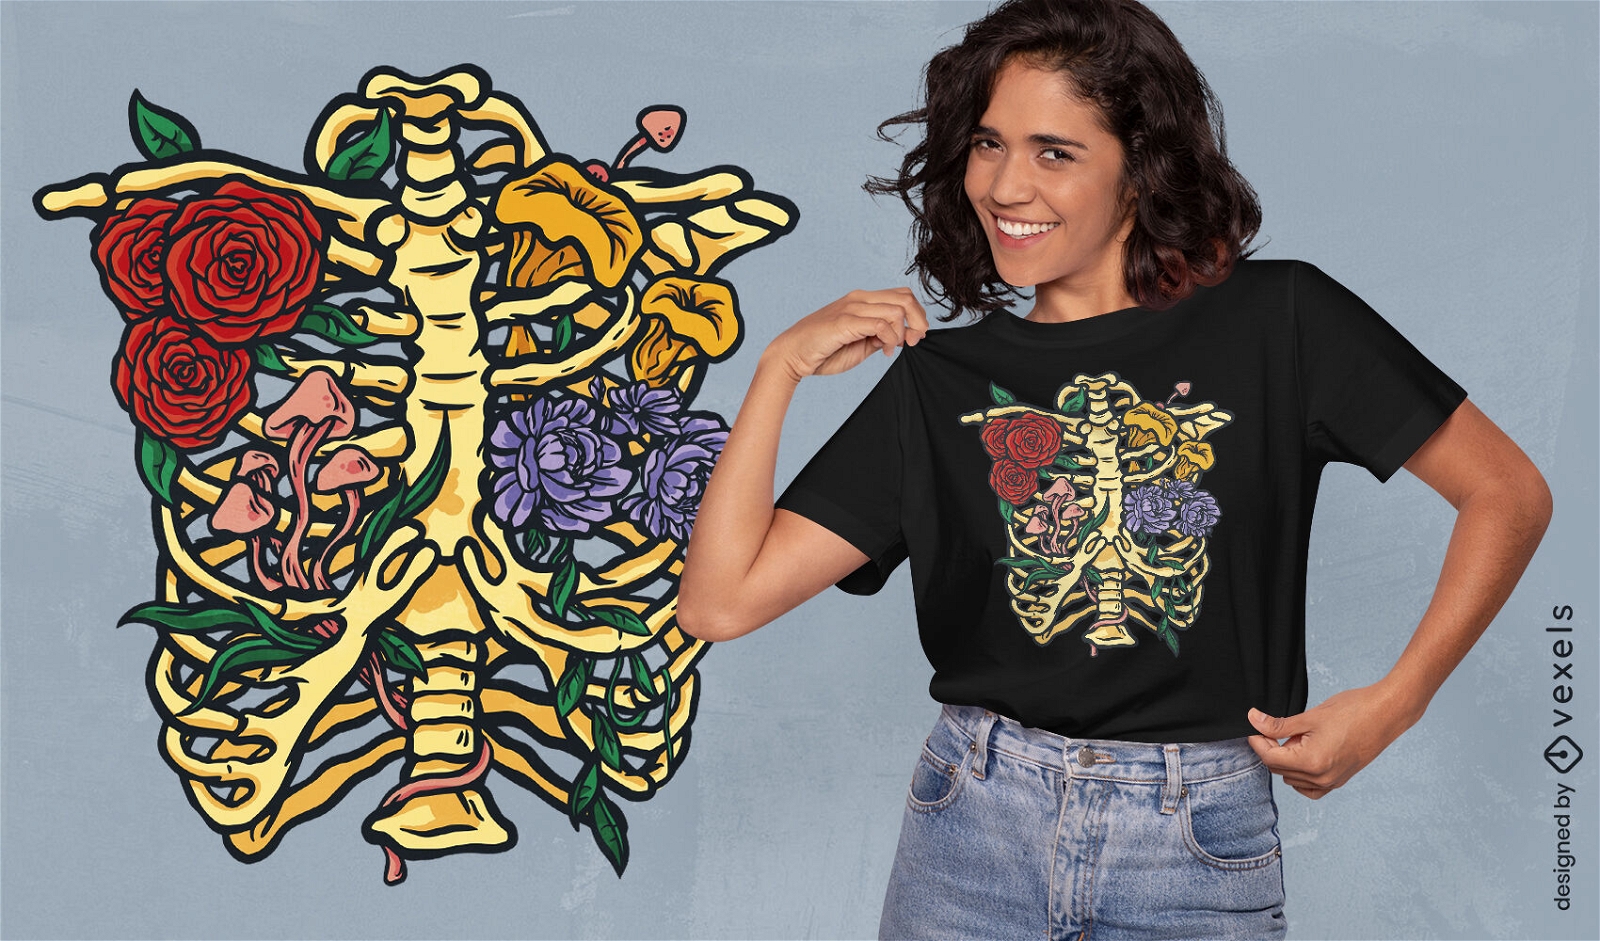
Flowers and mushrooms in skeleton t-shirt design
Choose a folder
All favorites
Create new
Save
Flowers and mushrooms in skeleton t-shirt design
Print ready
for Merch
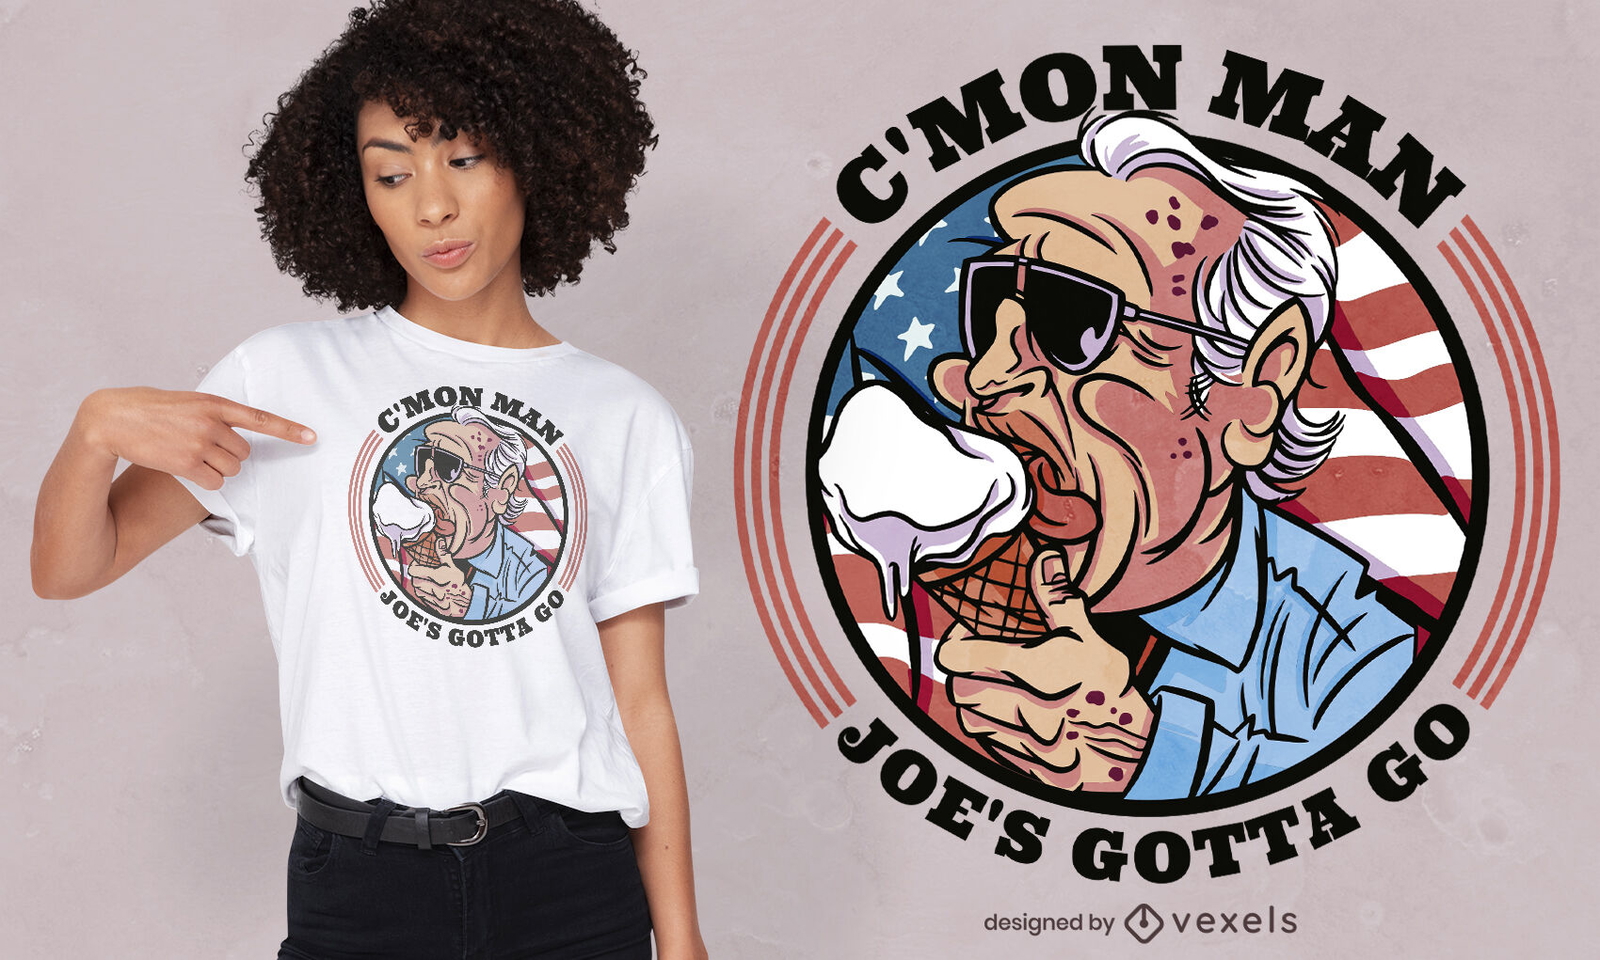
Funny Biden t-shirt design
Choose a folder
All favorites
Create new
Save
Funny Biden t-shirt design
Editable text
Print ready
for Merch
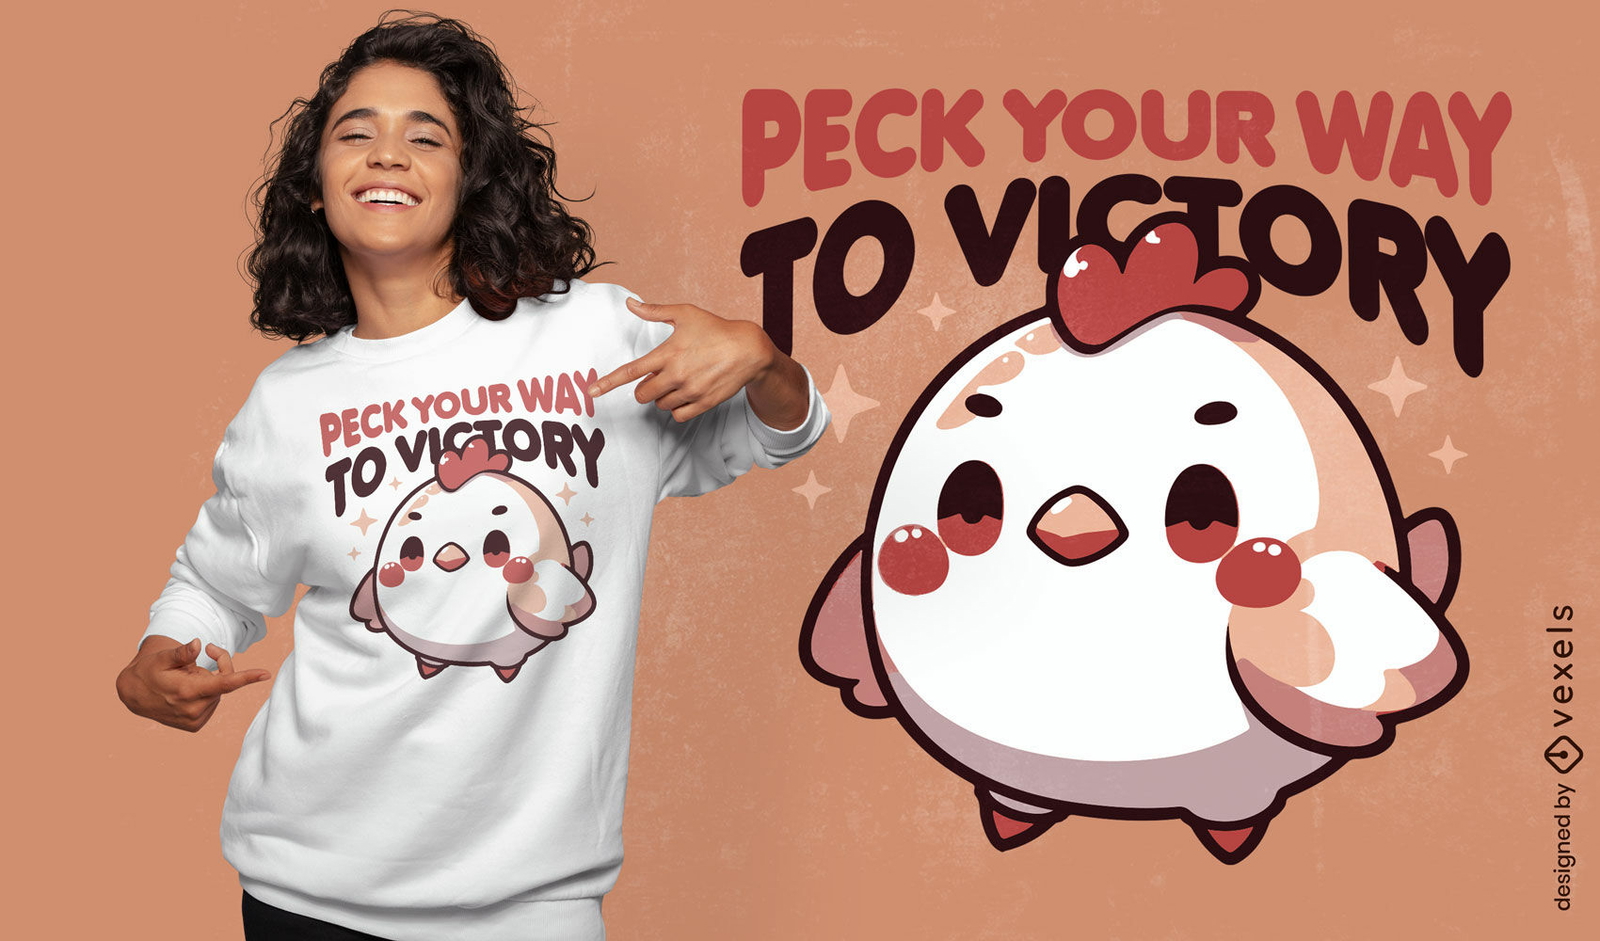
Motivational chicken t-shirt design
Choose a folder
All favorites
Create new
Save
Motivational chicken t-shirt design
Print ready
for Merch
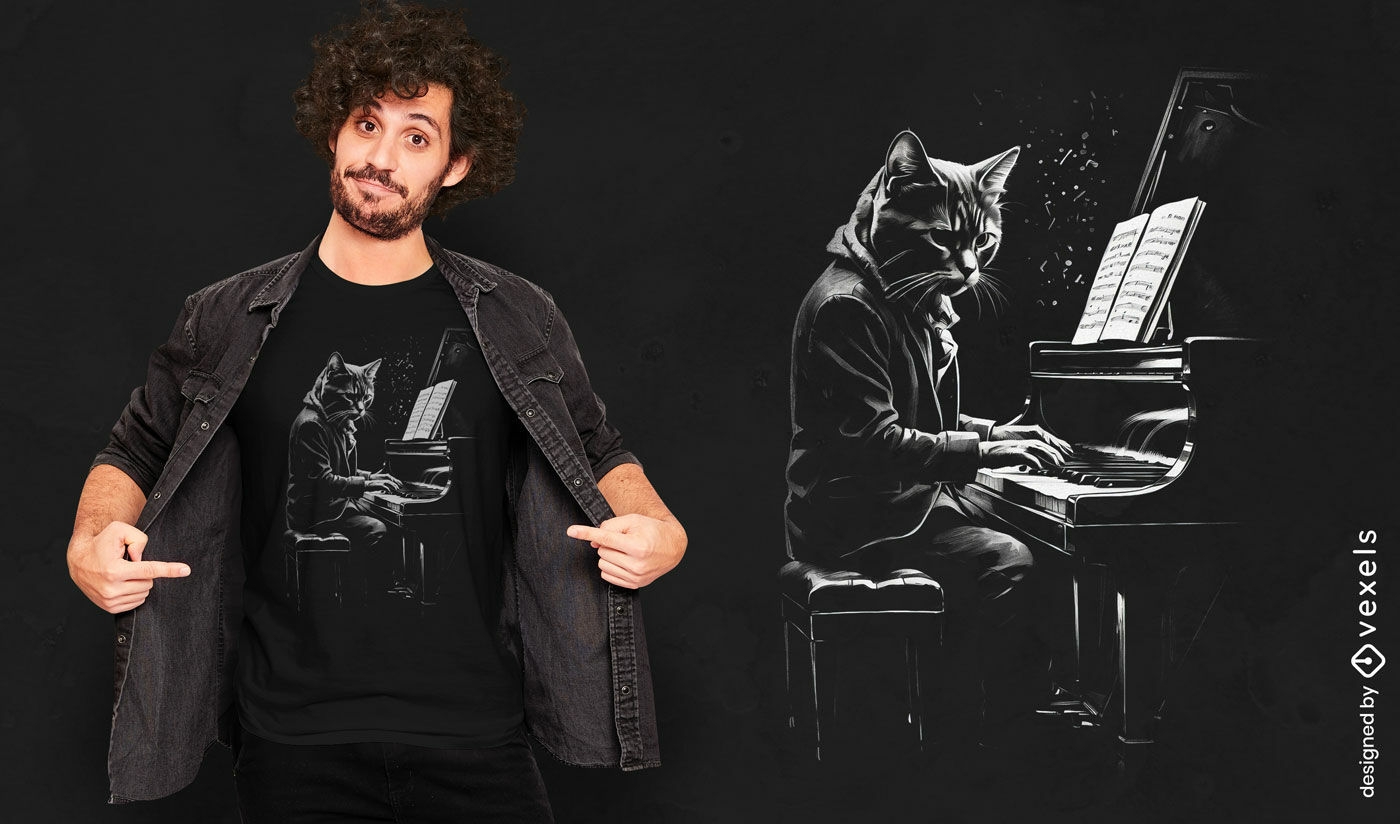
Cat playing piano t-shirt design
Choose a folder
All favorites
Create new
Save
Cat playing piano t-shirt design
Print ready
for Merch
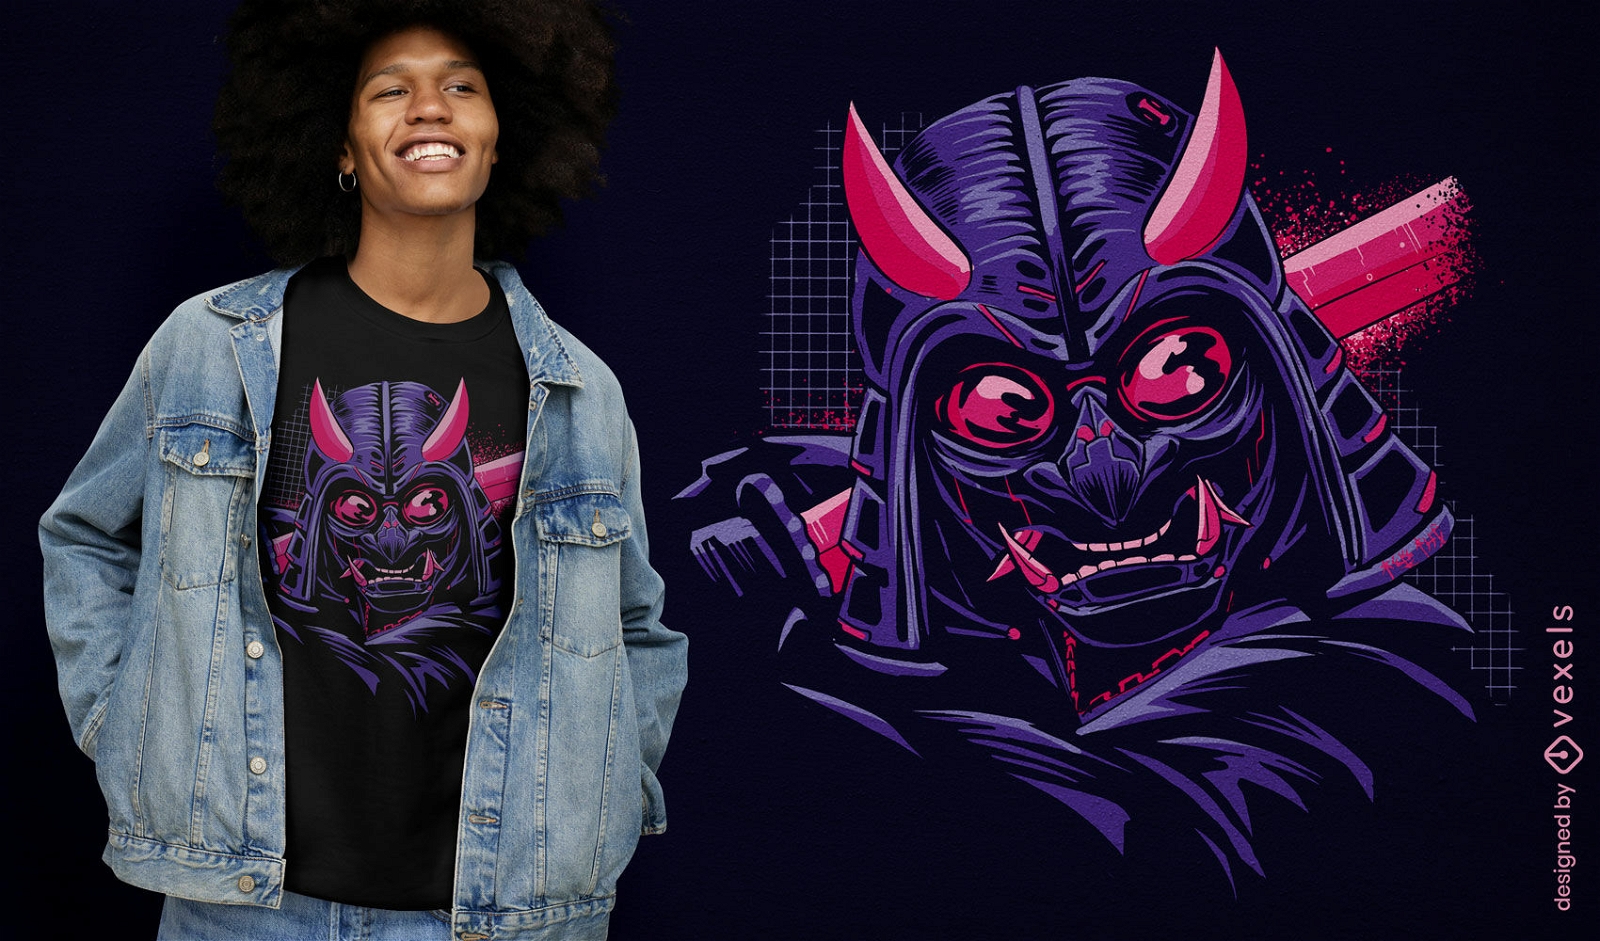
Vaporwave samurai t-shirt design
Choose a folder
All favorites
Create new
Save
Vaporwave samurai t-shirt design
Editable text
Print ready
for Merch
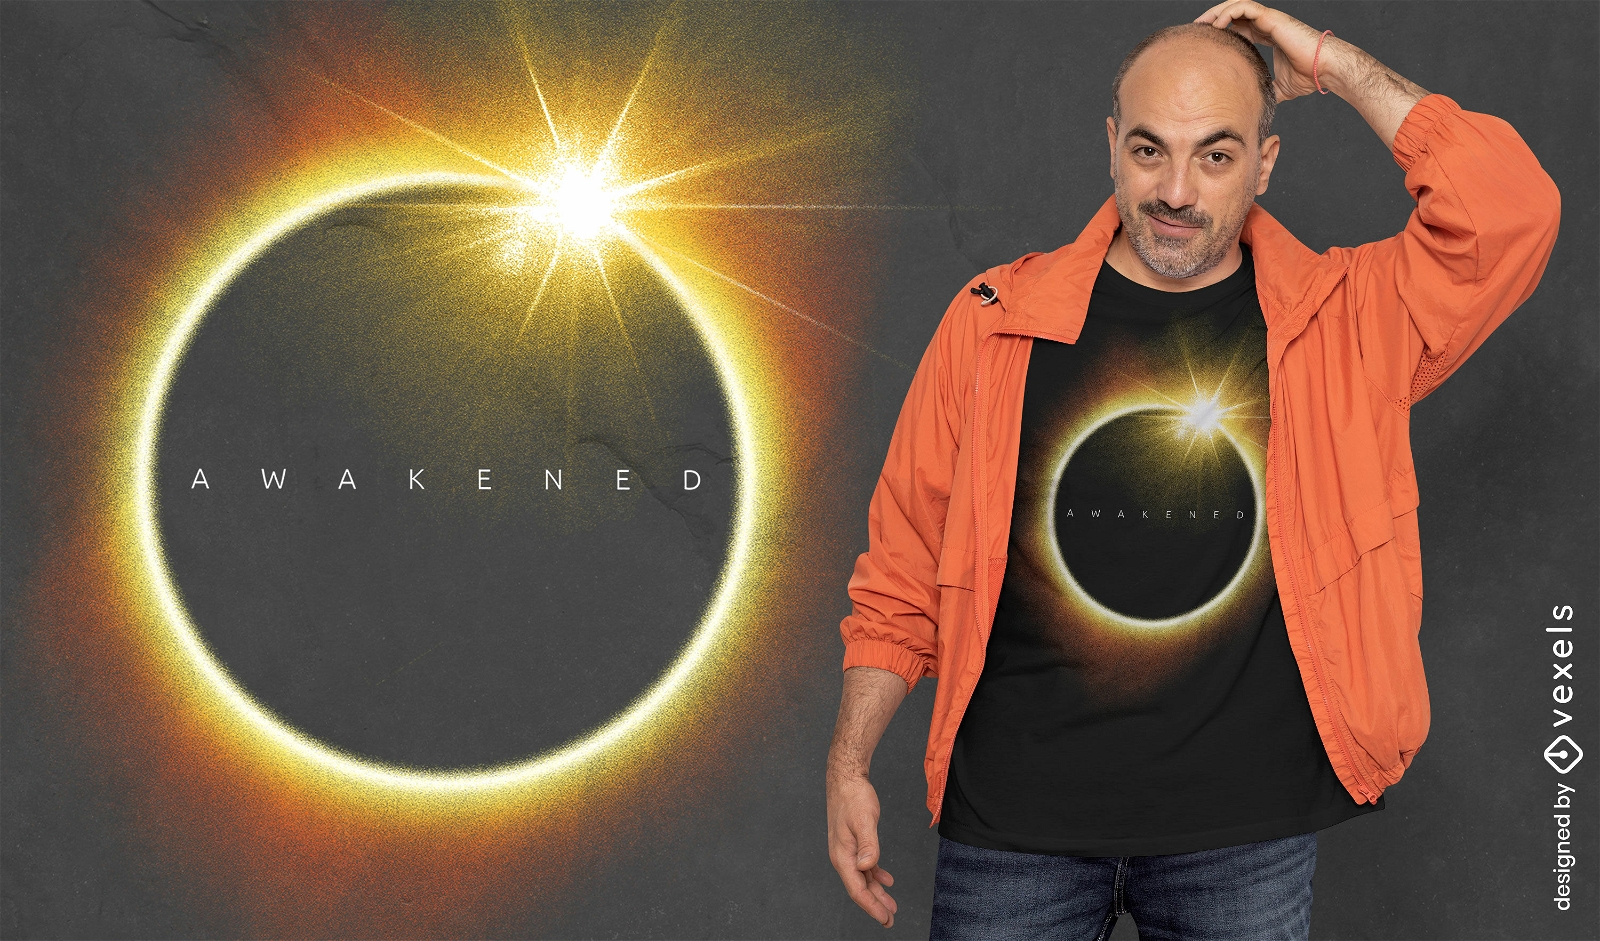
Eclipse against the sun t-shirt design
Choose a folder
All favorites
Create new
Save
Eclipse against the sun t-shirt design
Print ready
for Merch
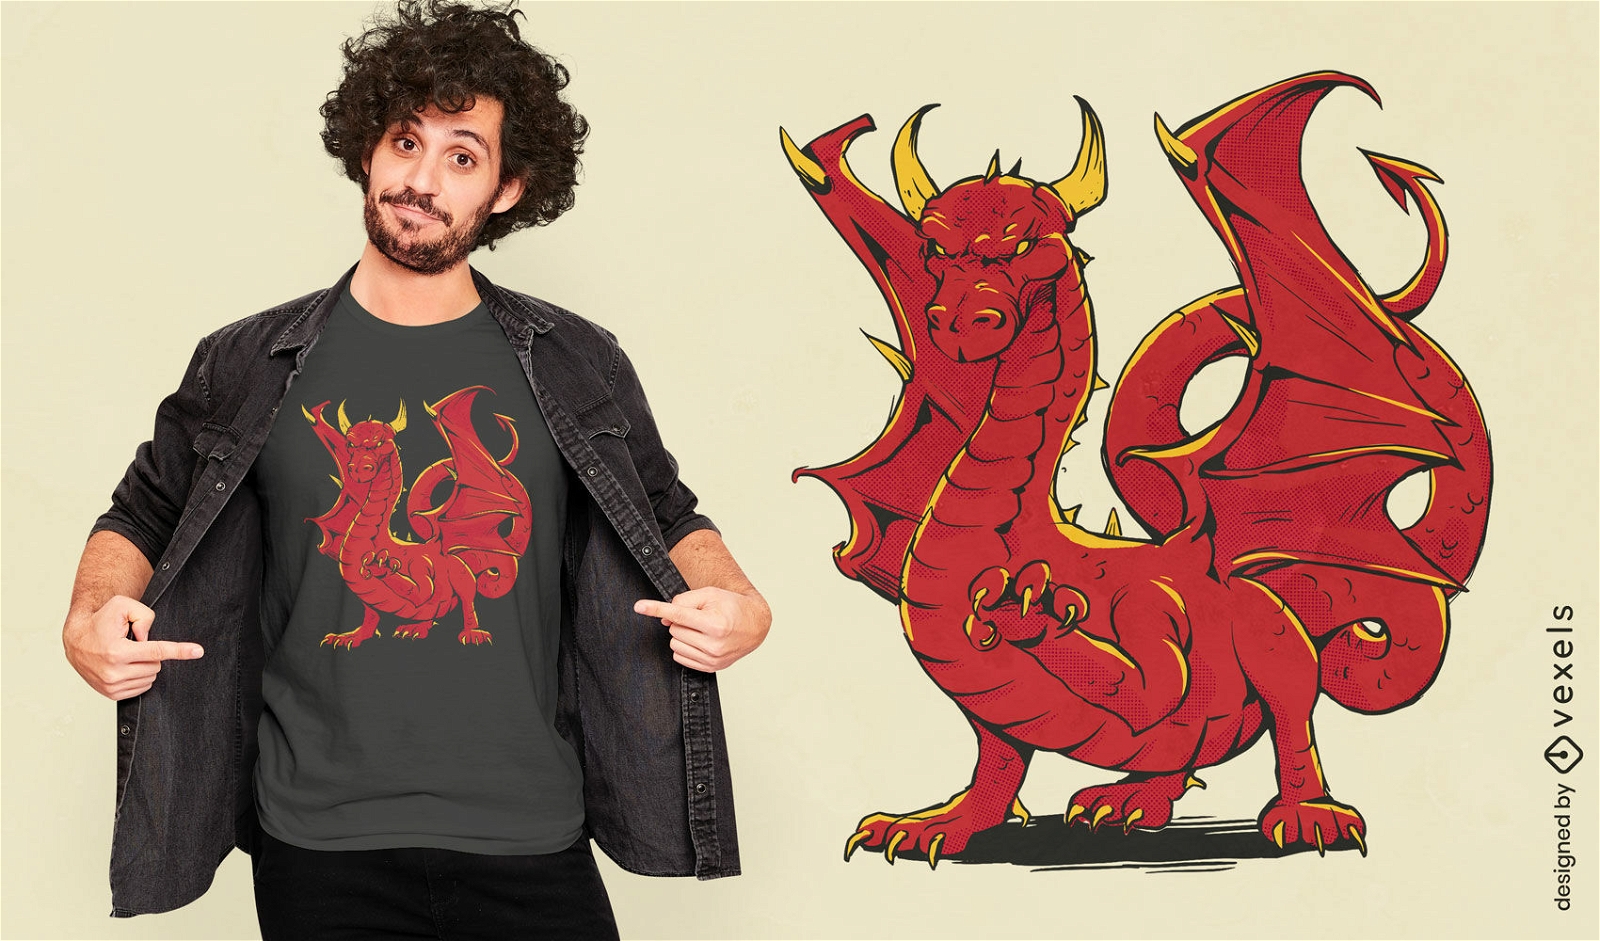
Red dragon fantasy t-shirt design
Choose a folder
All favorites
Create new
Save
Red dragon fantasy t-shirt design
Print ready
for Merch
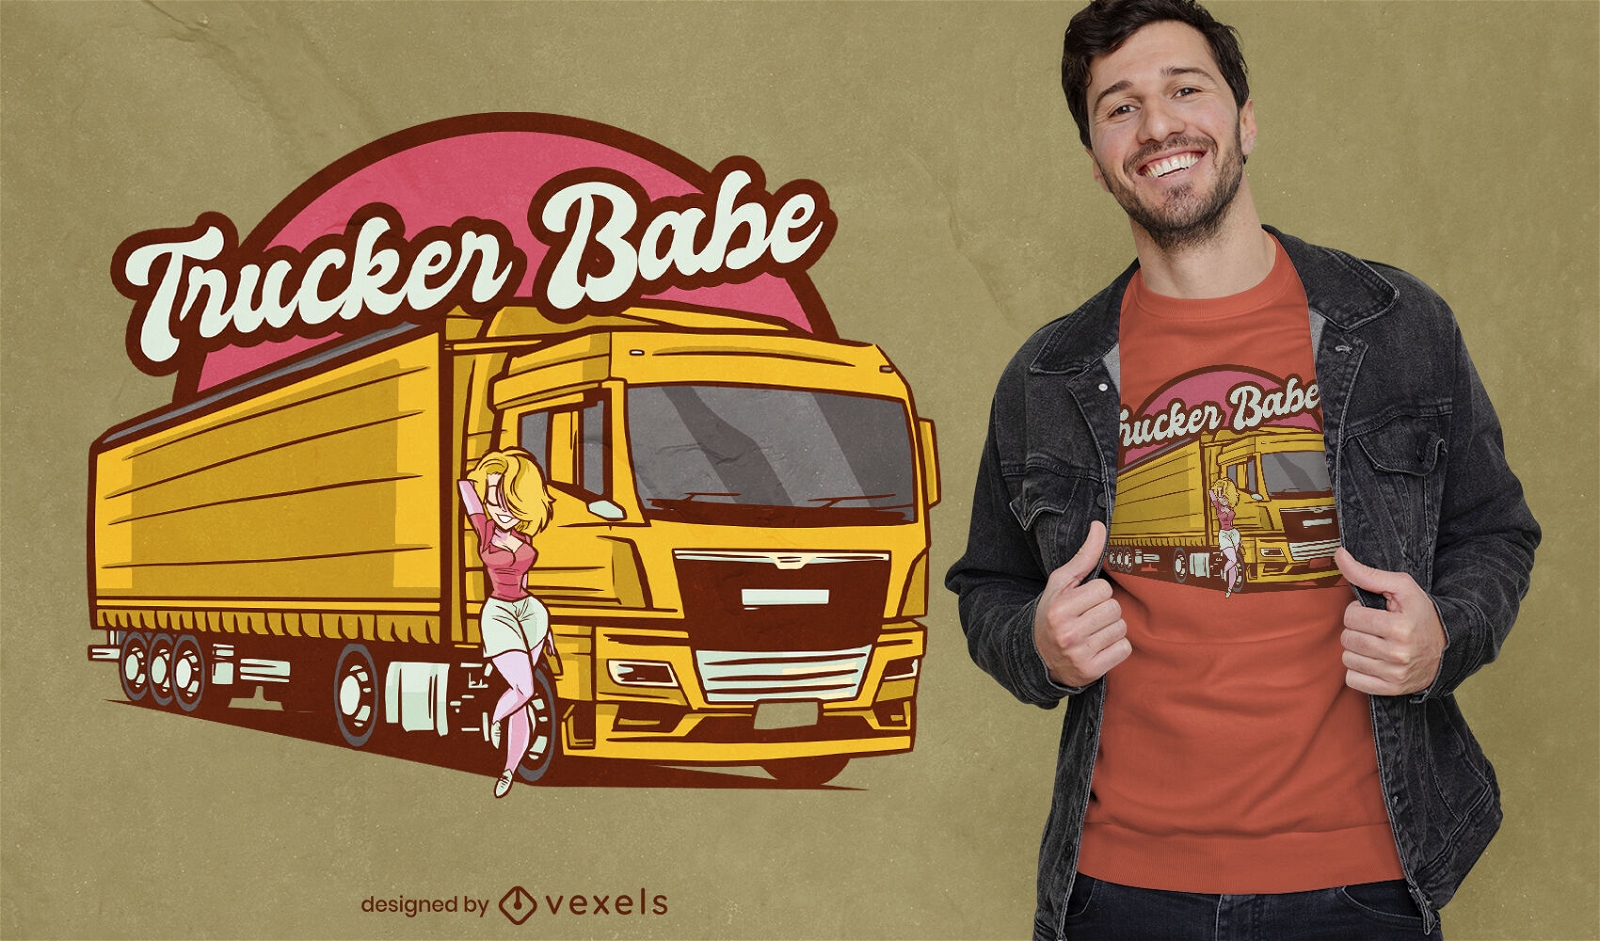
Woman with truck transport t-shirt design
Choose a folder
All favorites
Create new
Save
Woman with truck transport t-shirt design
Print ready
for Merch
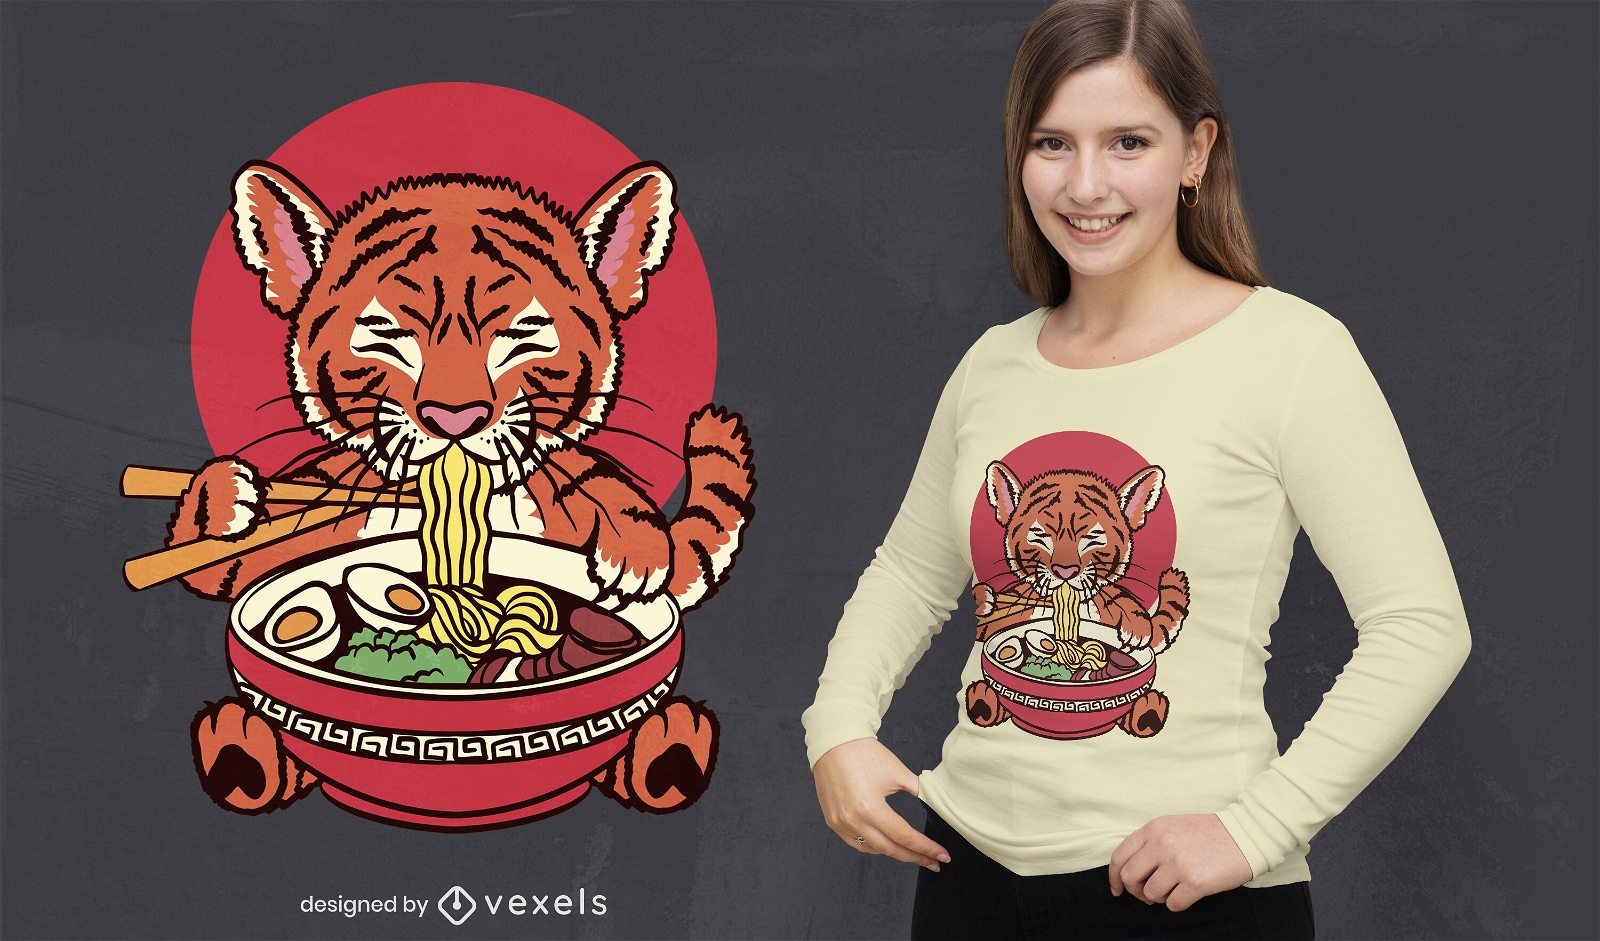
Baby tiger eating ramen food t-shirt design
Choose a folder
All favorites
Create new
Save
Baby tiger eating ramen food t-shirt design
Print ready
for Merch
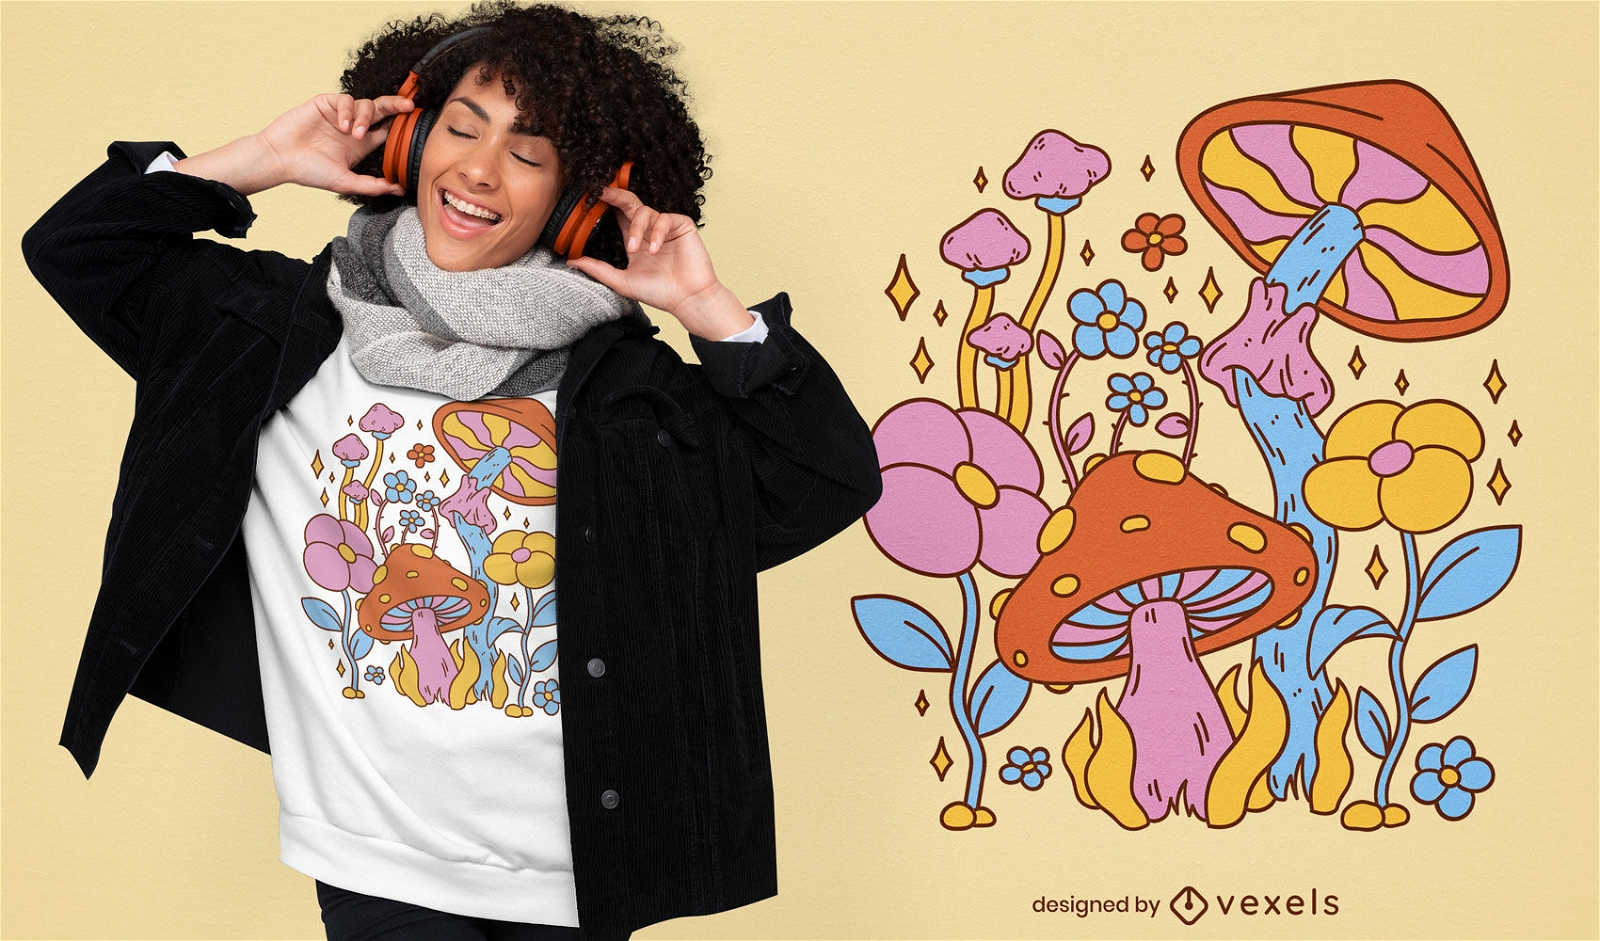
Mushrooms and flowers hippie t-shirt design
Choose a folder
All favorites
Create new
Save
Mushrooms and flowers hippie t-shirt design
Print ready
for Merch
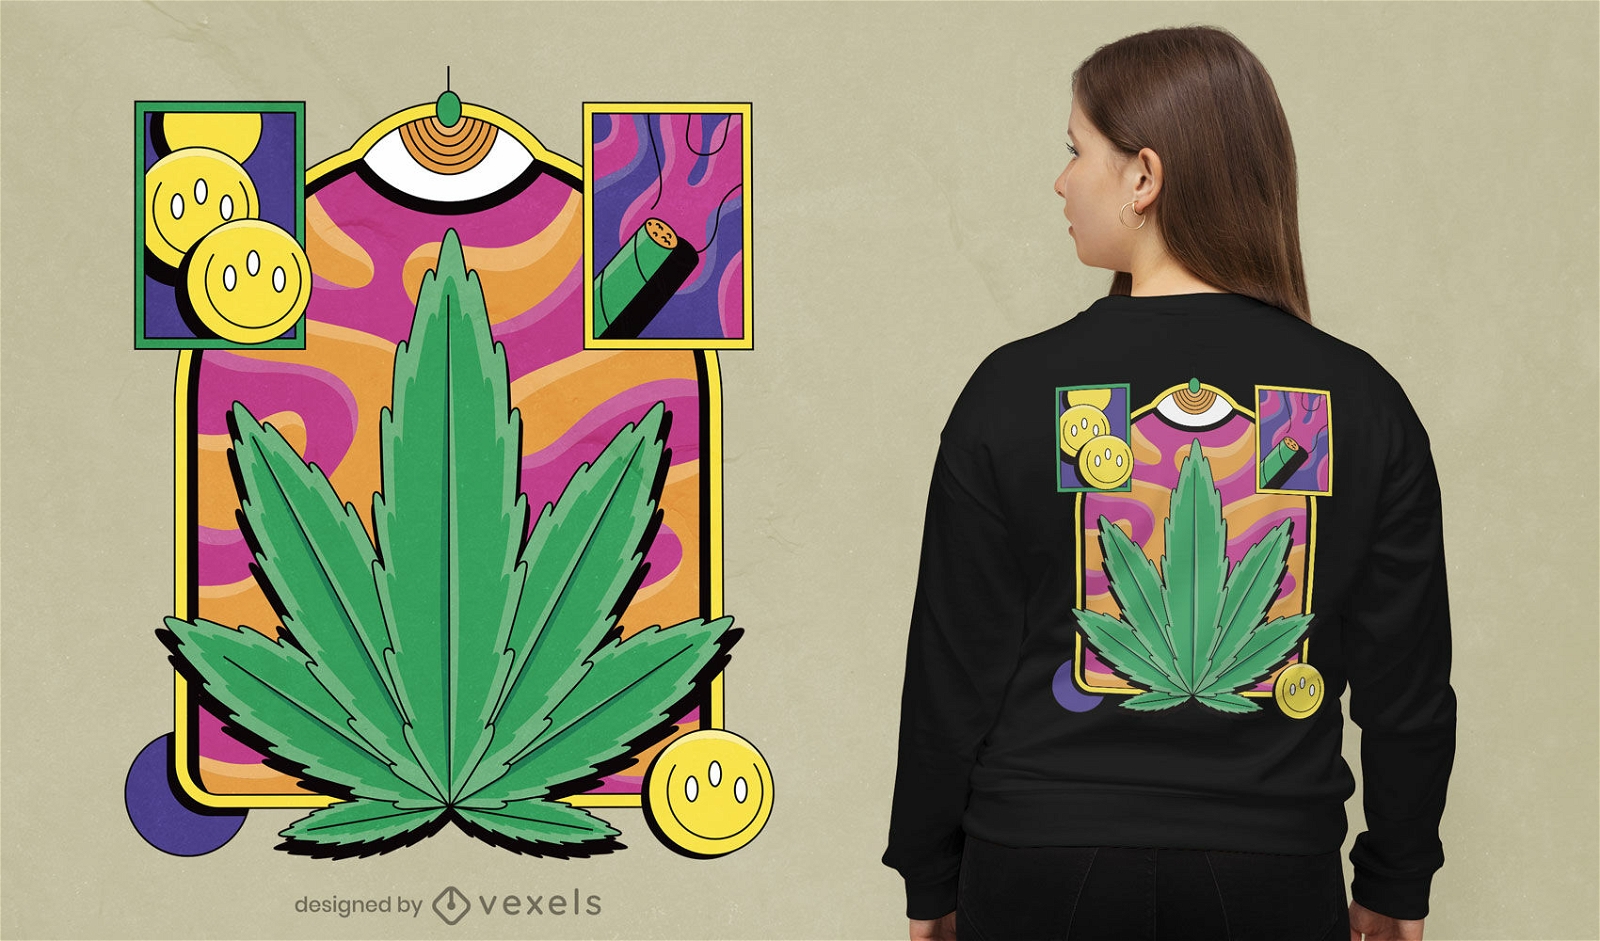
Trippy weed t-shirt design
Choose a folder
All favorites
Create new
Save
Trippy weed t-shirt design
Print ready
for Merch
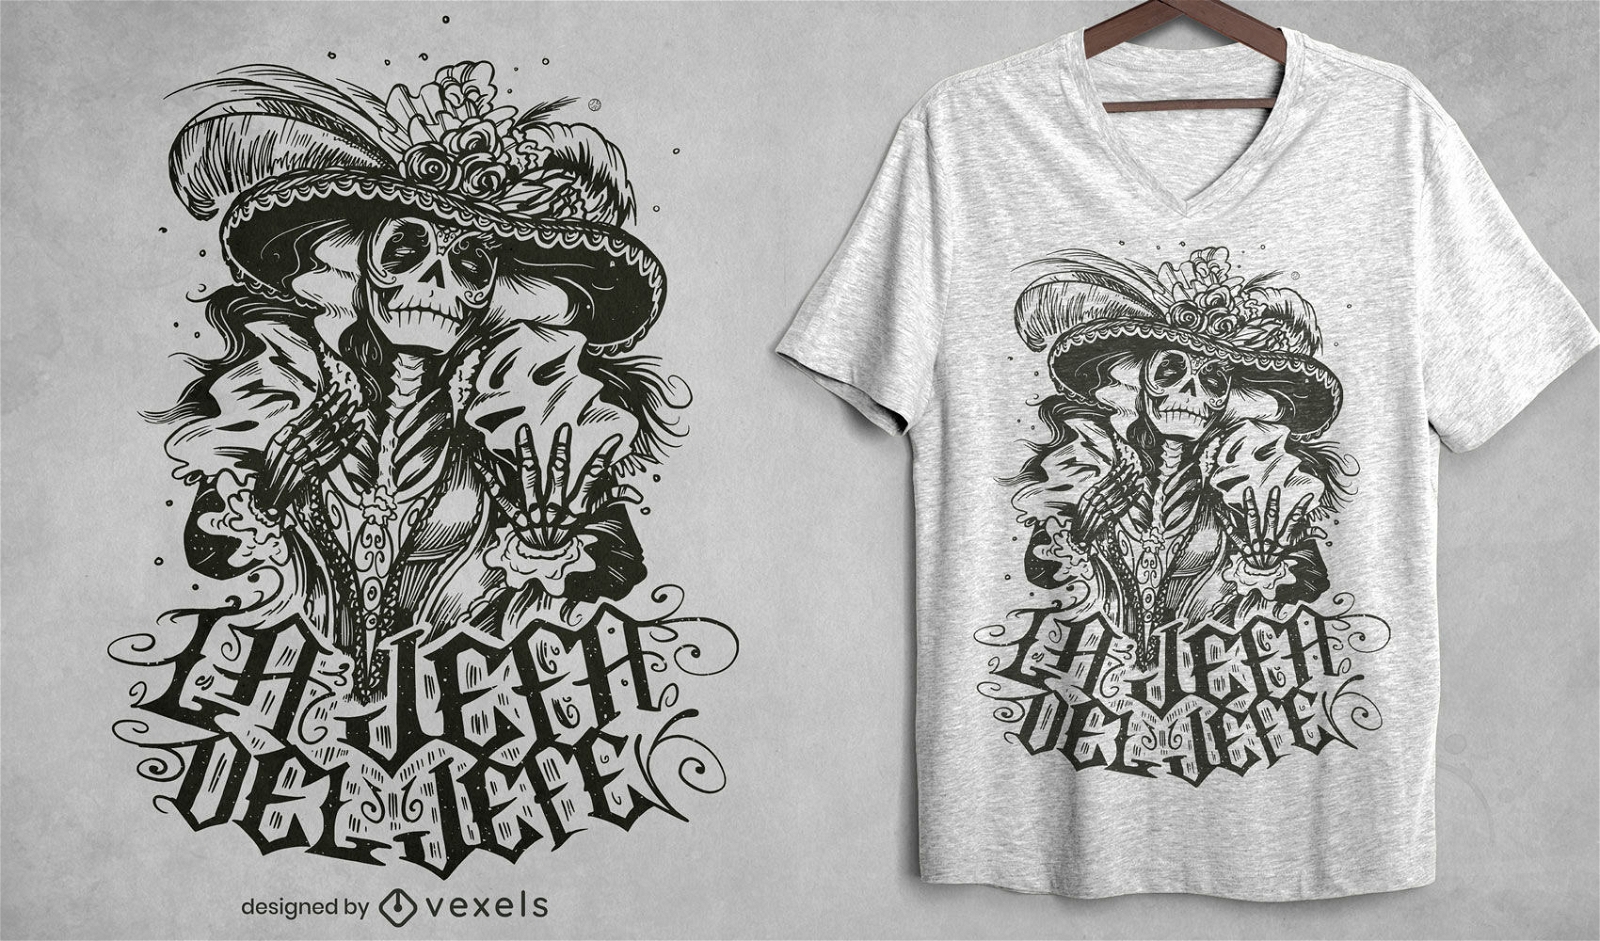
Skeleton mexican character hand drawn t-shirt design
Choose a folder
All favorites
Create new
Save
Skeleton mexican character hand drawn t-shirt design
Editable text
Print ready
for Merch
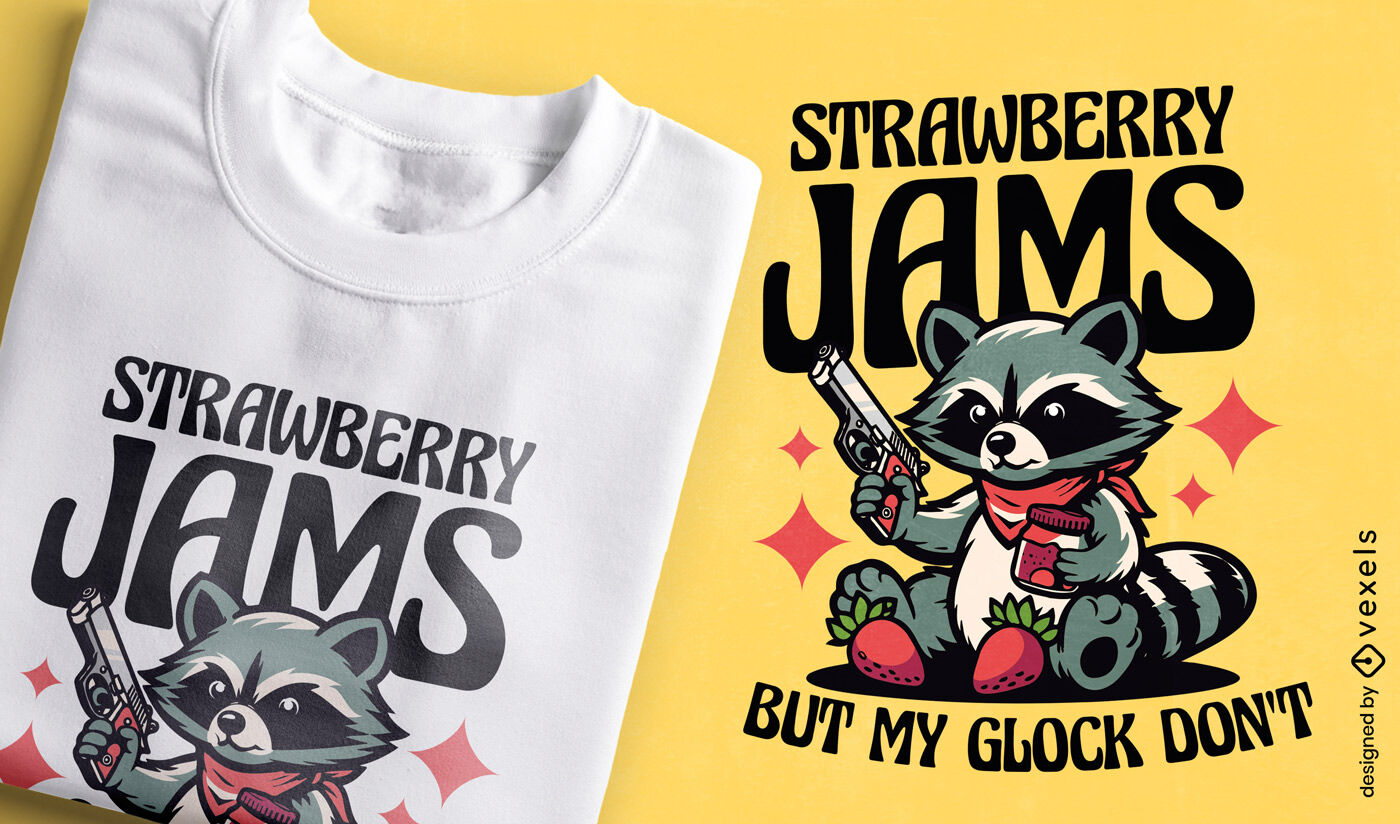
Armed raccoon jam t-shirt design
Choose a folder
All favorites
Create new
Save
Armed raccoon jam t-shirt design
Editable text
Print ready
for Merch
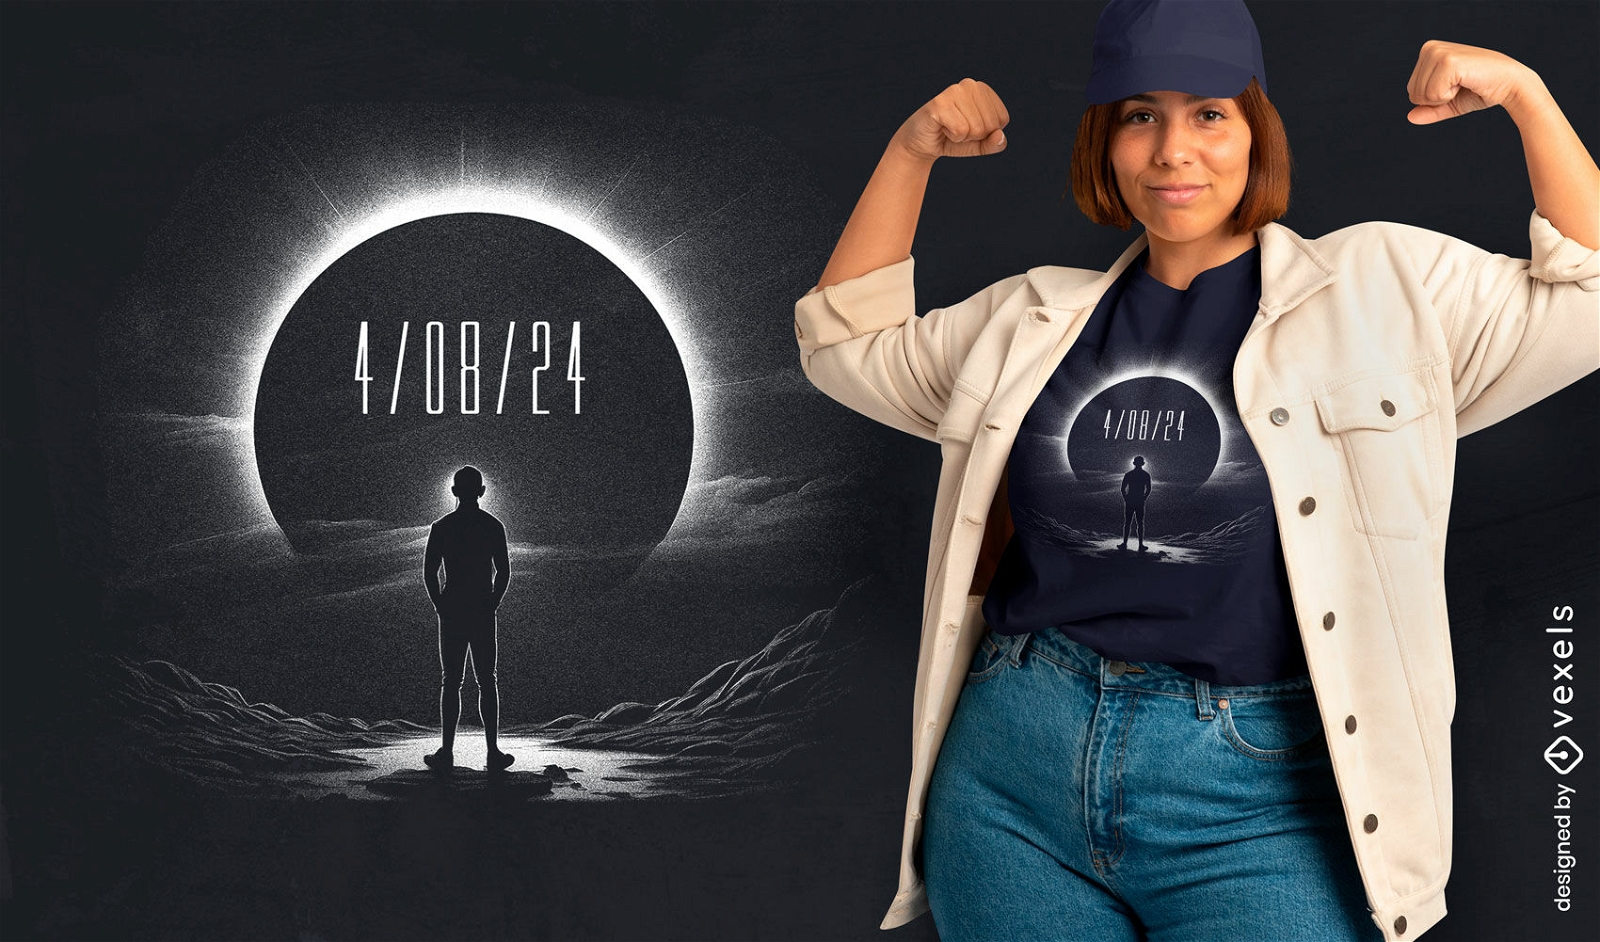
Man watching a solar eclipse t-shirt design
Choose a folder
All favorites
Create new
Save
Man watching a solar eclipse t-shirt design
Editable text
Print ready
for Merch
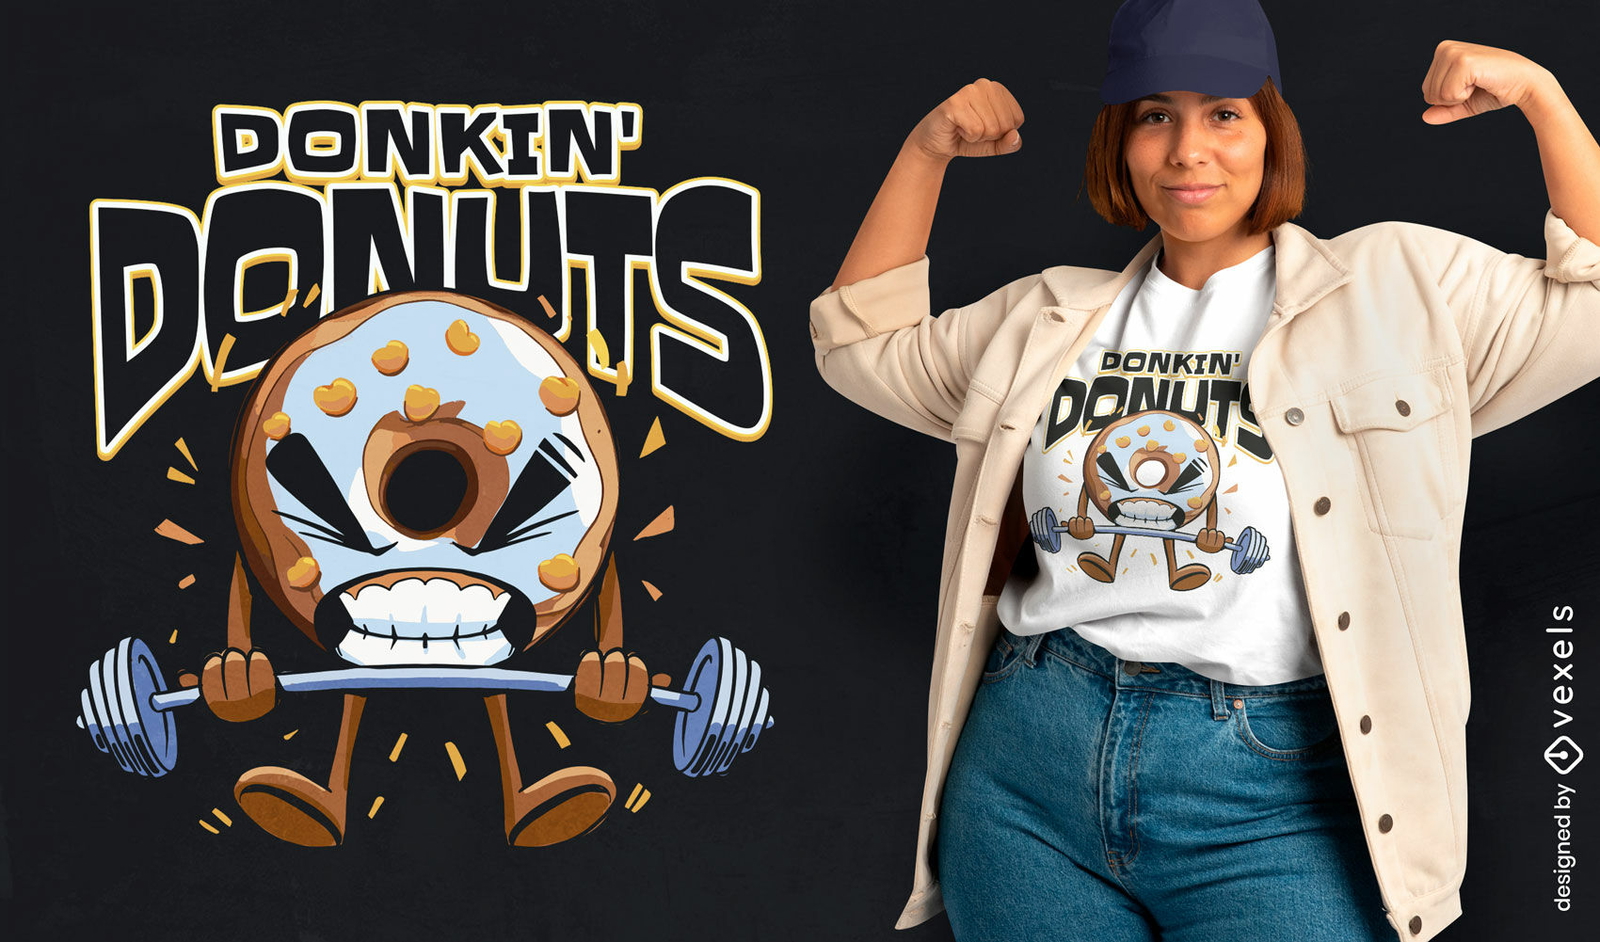
Donut lifting weights t-shirt design
Choose a folder
All favorites
Create new
Save
Donut lifting weights t-shirt design
Editable text
Print ready
for Merch
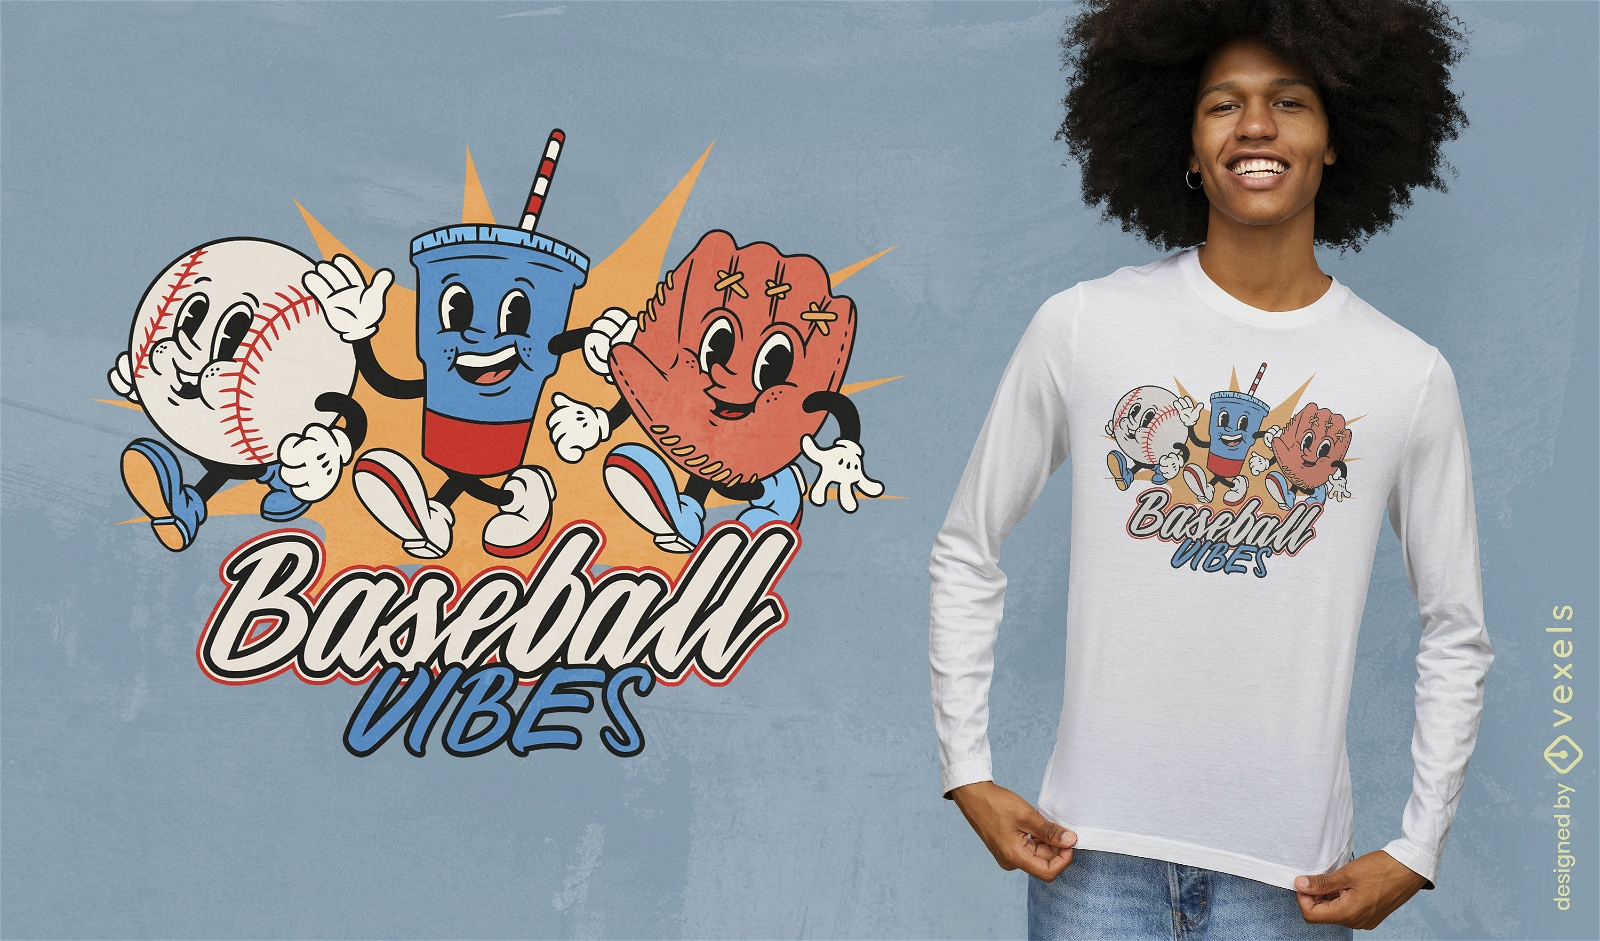
Baseball vibes t-shirt design
Choose a folder
All favorites
Create new
Save
Baseball vibes t-shirt design
Print ready
for Merch
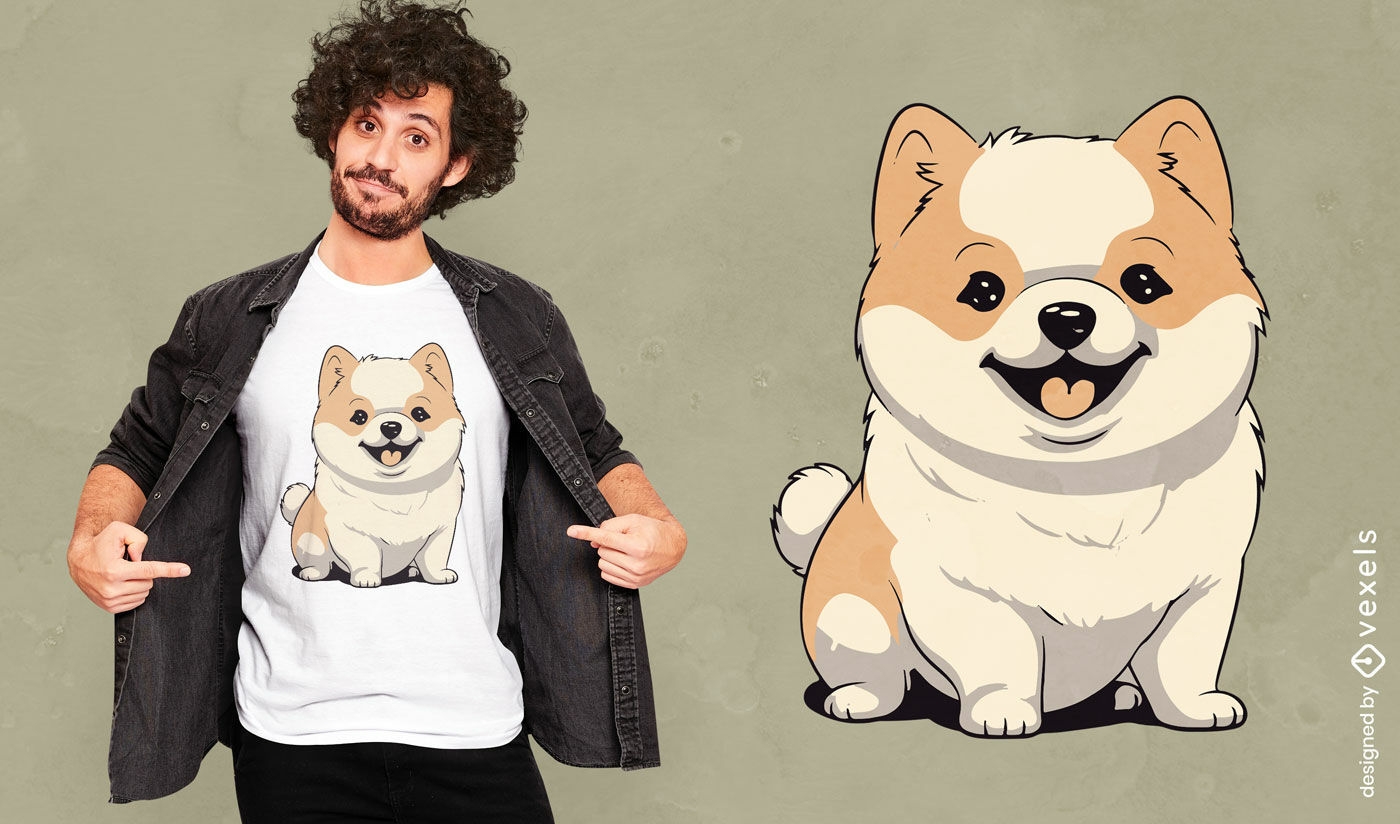
Smiling corgi t-shirt design
Choose a folder
All favorites
Create new
Save
Smiling corgi t-shirt design
Print ready
for Merch
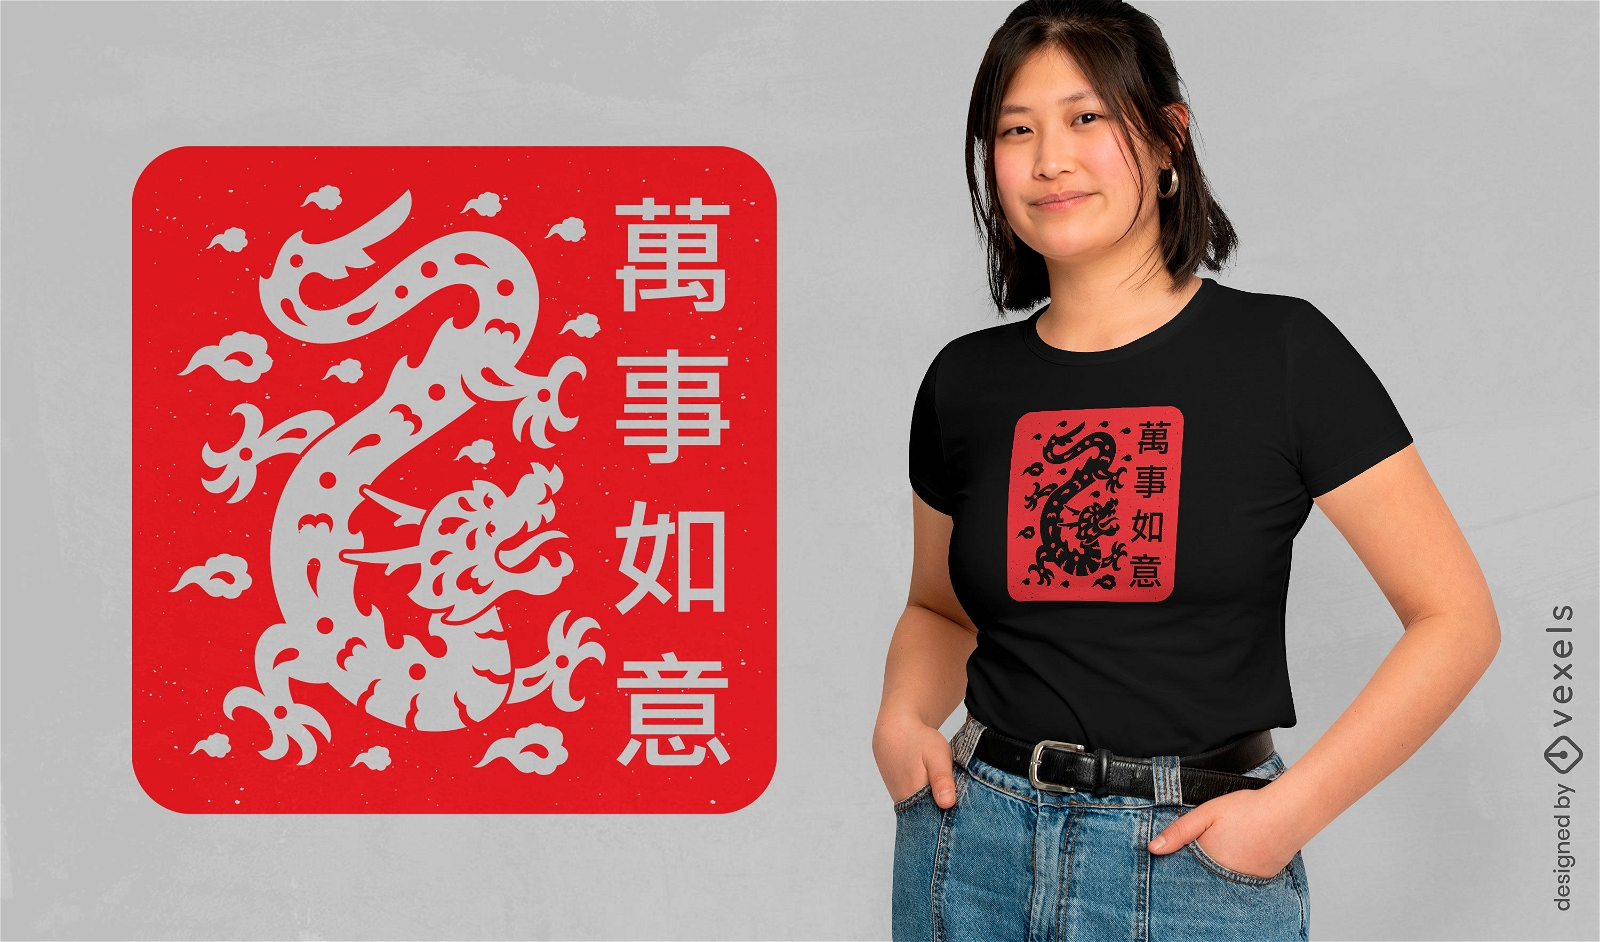
Chinese dragon silhouette t-shirt design
Choose a folder
All favorites
Create new
Save
Chinese dragon silhouette t-shirt design
Editable text
Print ready
for Merch
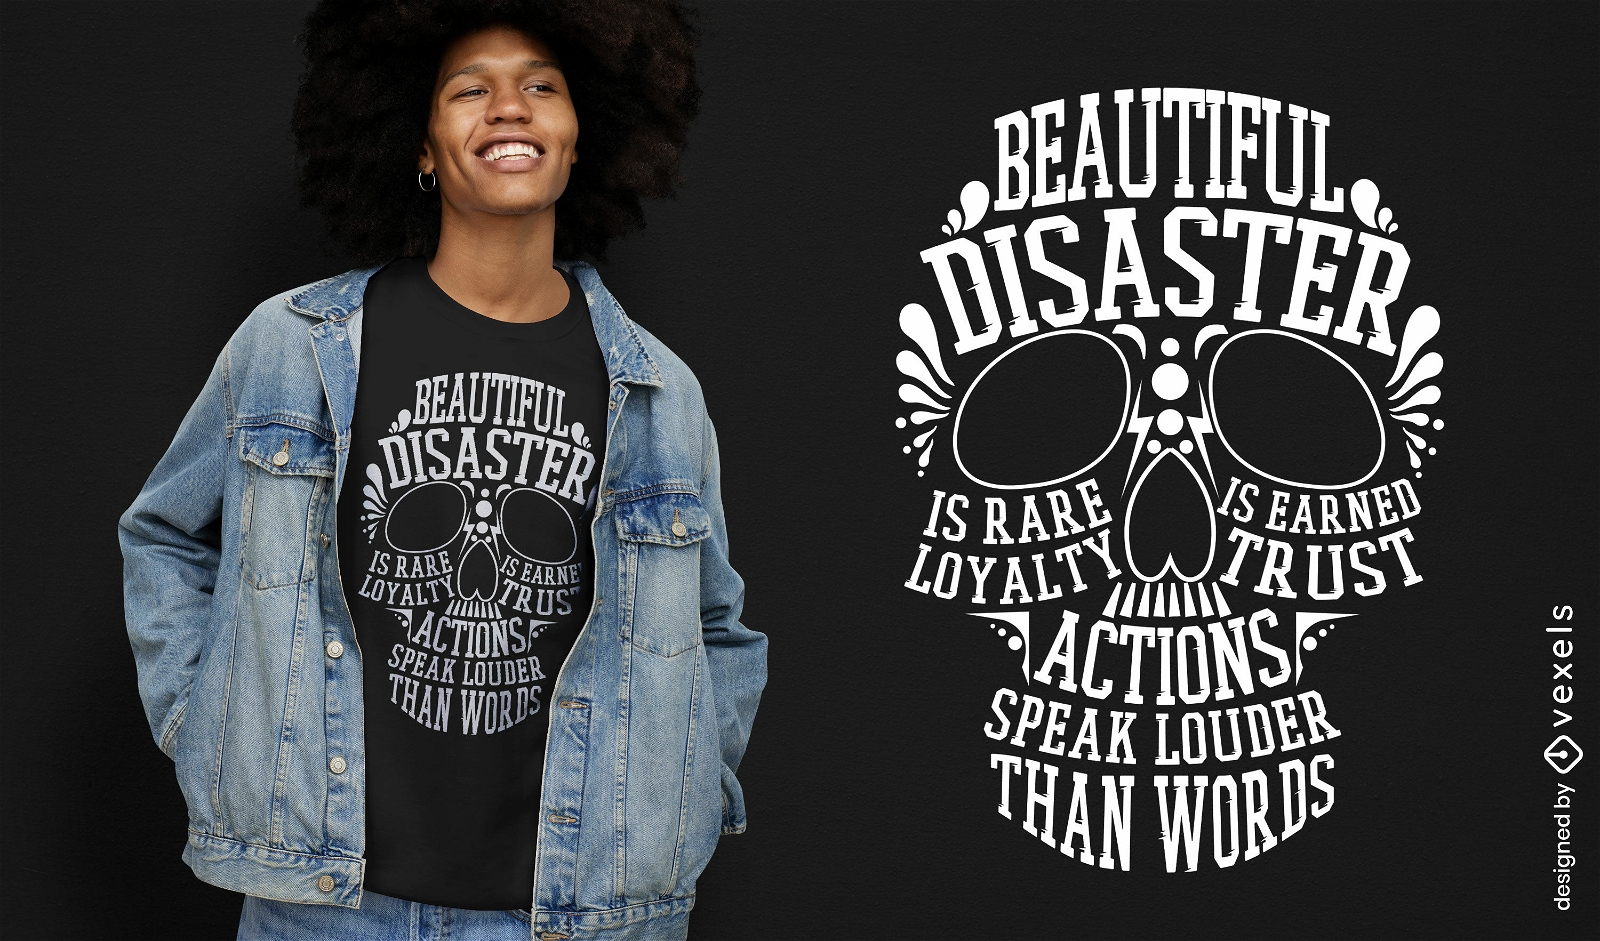
Skull with motivational quote t-shirt design
Choose a folder
All favorites
Create new
Save
Skull with motivational quote t-shirt design
Print ready
for Merch
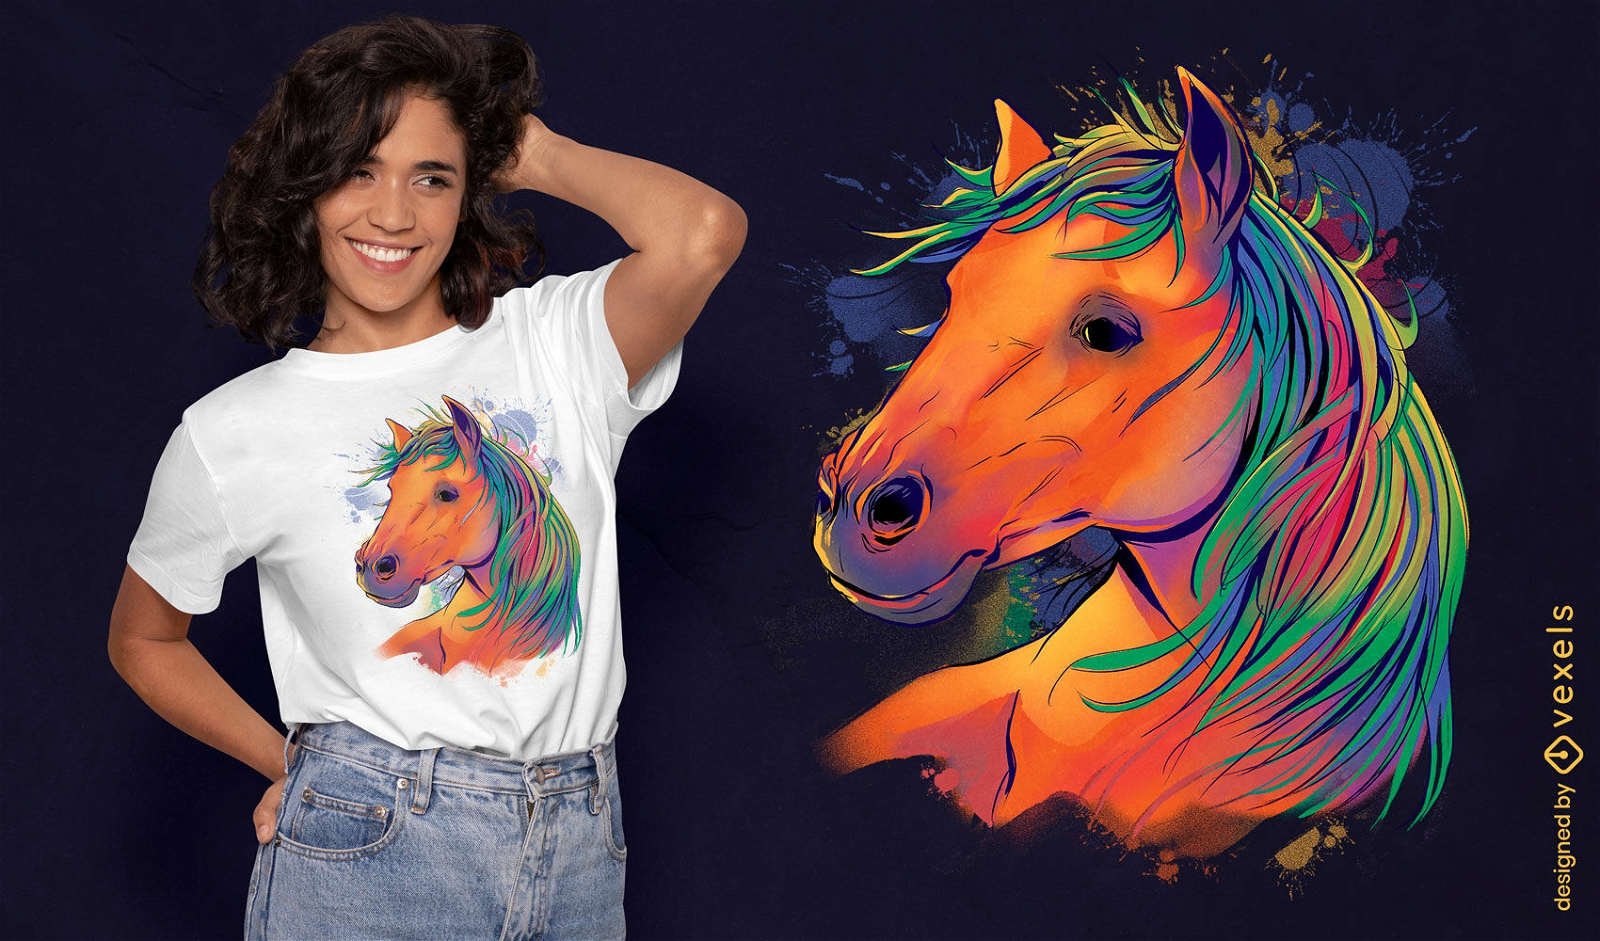
Watercolor horse realistic t-shirt design
Choose a folder
All favorites
Create new
Save
Watercolor horse realistic t-shirt design
Print ready
for Merch
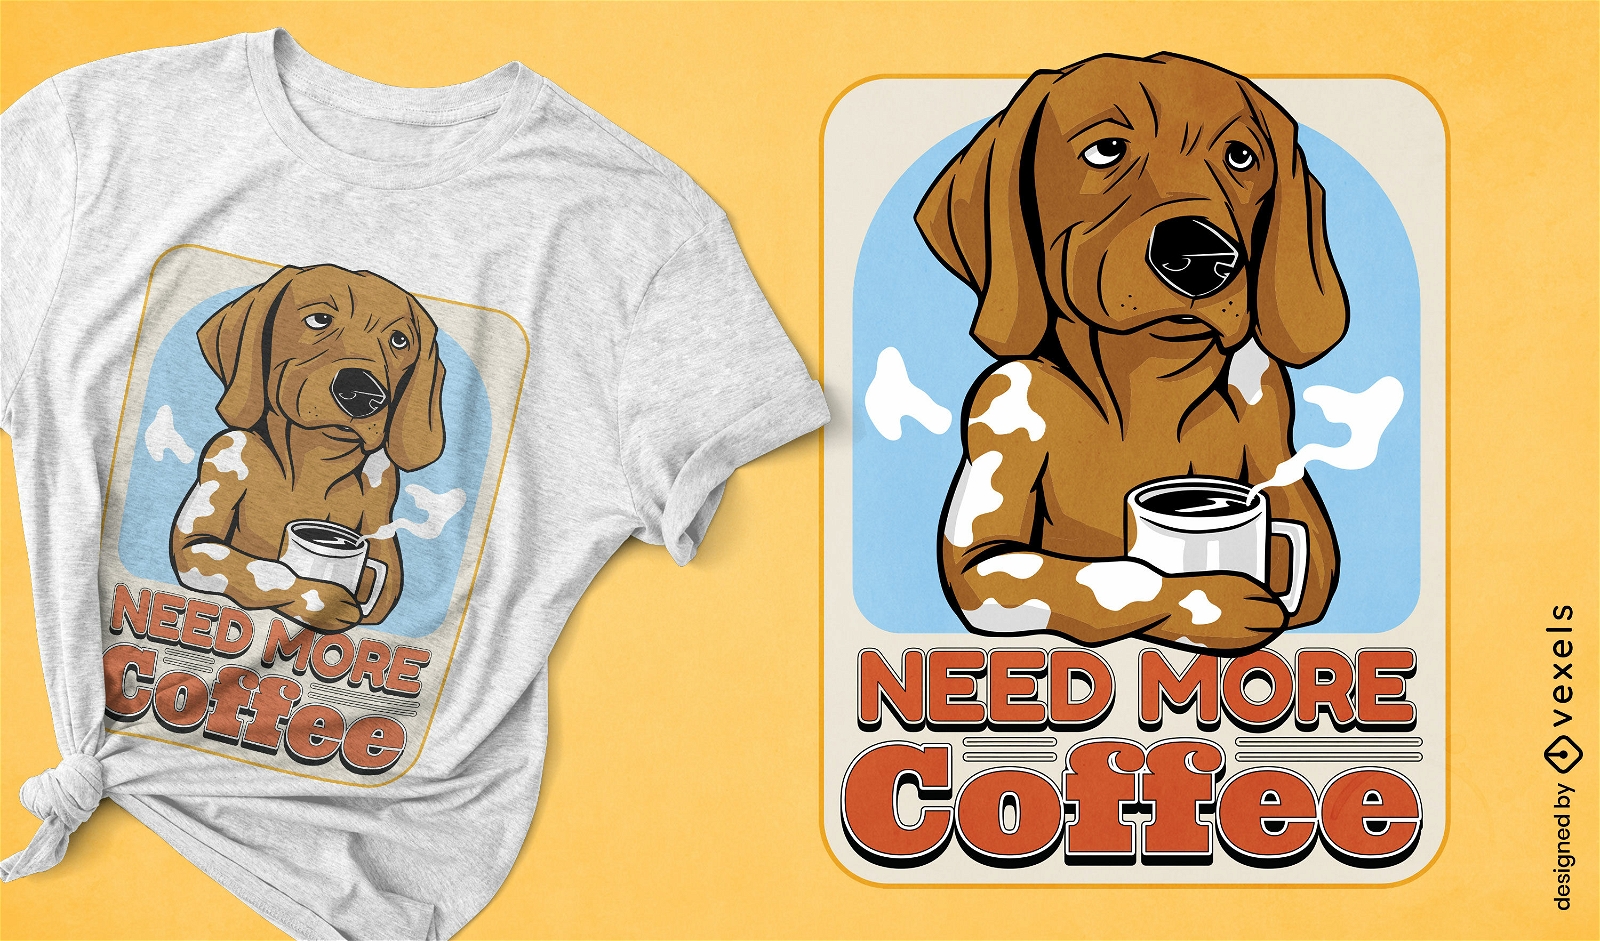
Need more coffee dog t-shirt design
Choose a folder
All favorites
Create new
Save
Need more coffee dog t-shirt design
Print ready
for Merch
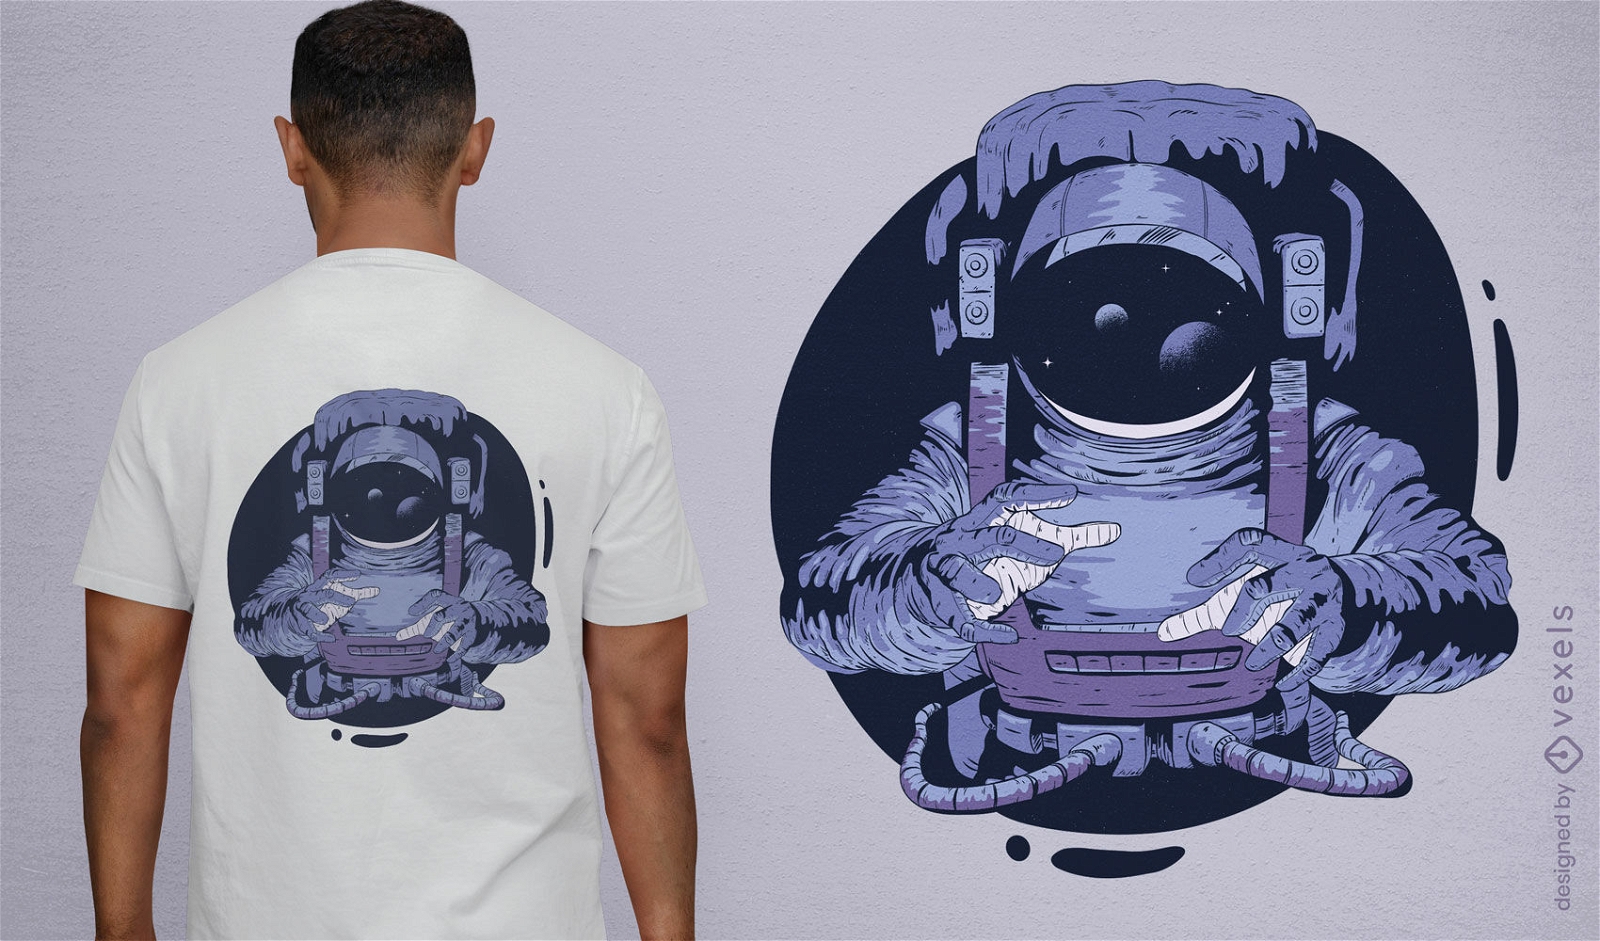
Astronaut in suit floating in space t-shirt design
Choose a folder
All favorites
Create new
Save
Astronaut in suit floating in space t-shirt design
Print ready
for Merch
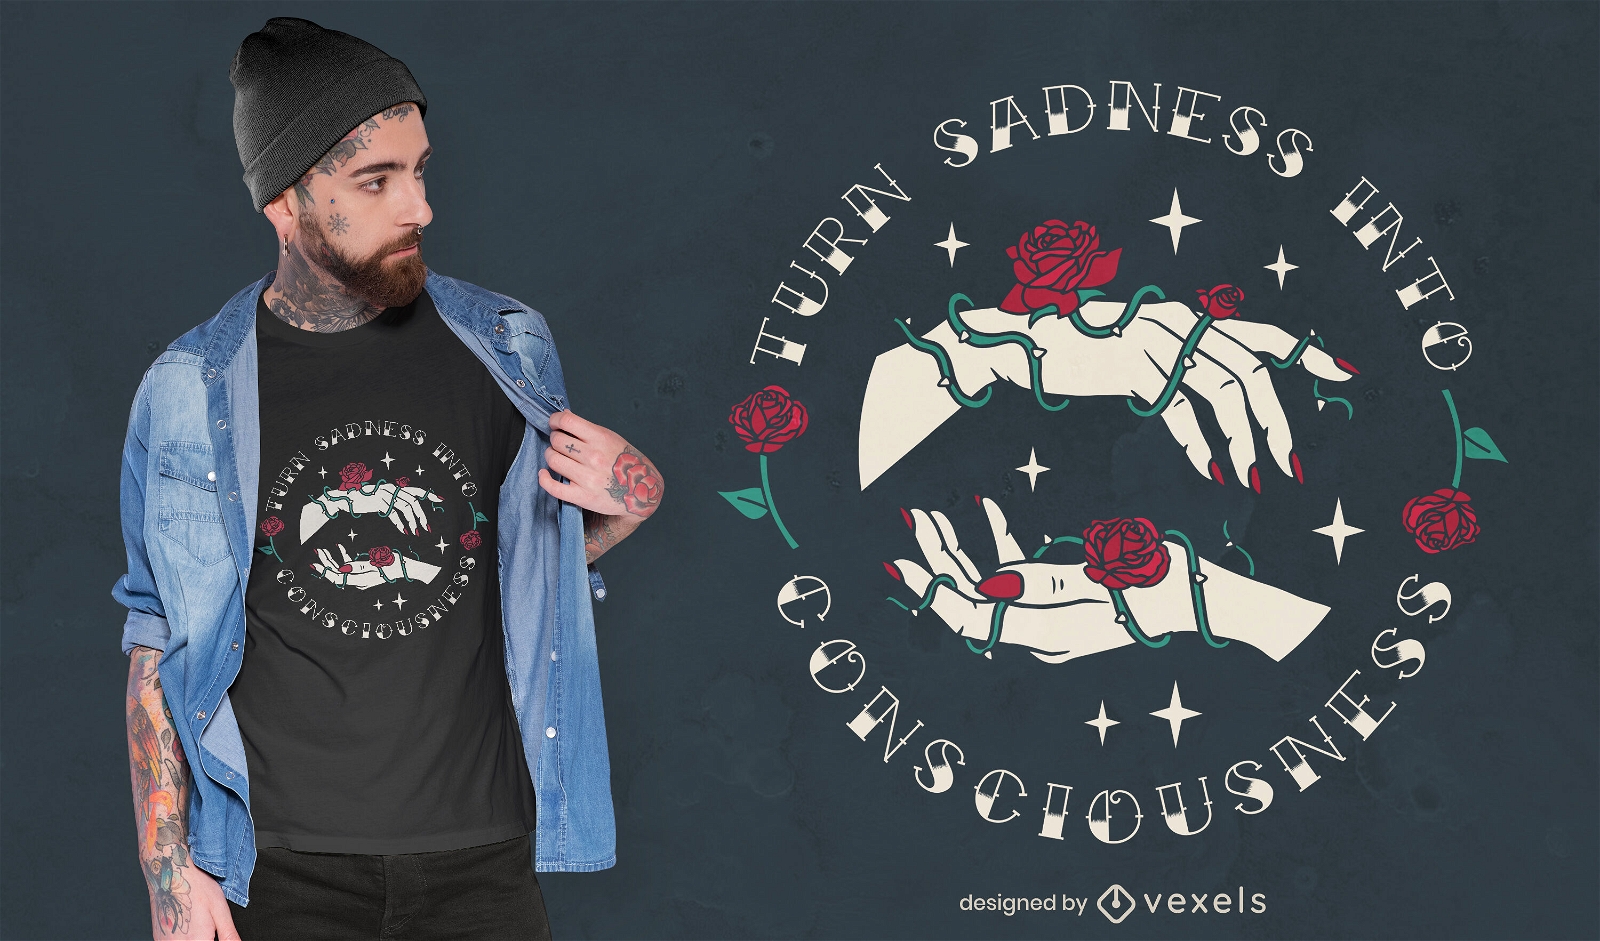
Hands with roses tattoo t-shirt design
Choose a folder
All favorites
Create new
Save
Hands with roses tattoo t-shirt design
Print ready
for Merch
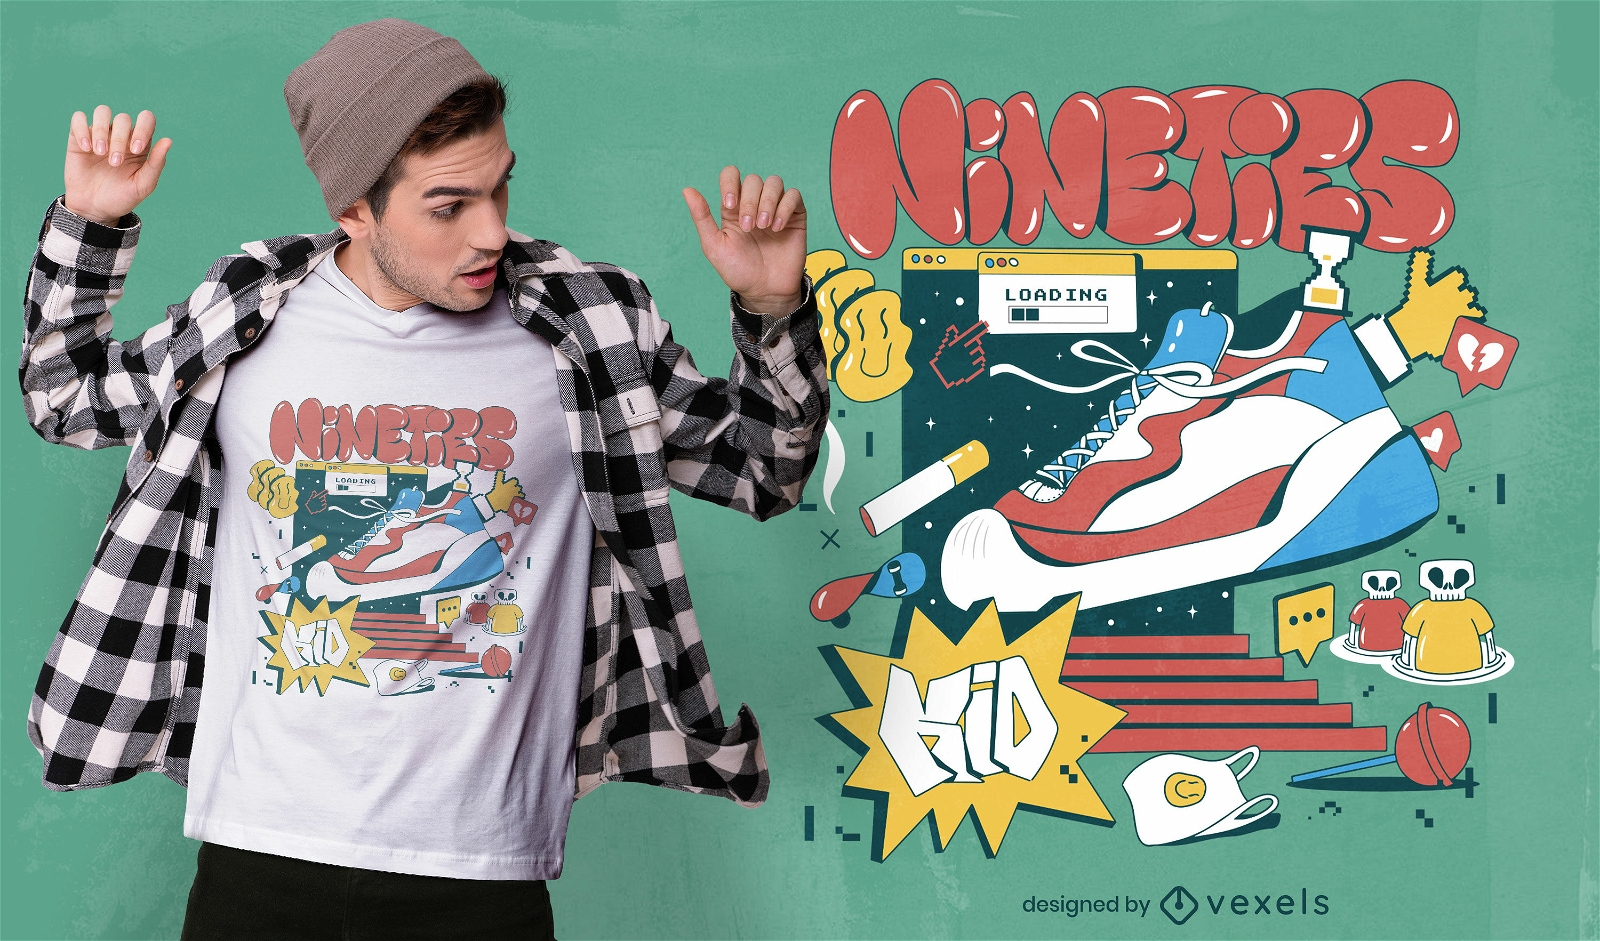
Nineties 90s kid retro t-shirt design
Choose a folder
All favorites
Create new
Save
Nineties 90s kid retro t-shirt design
Print ready
for Merch
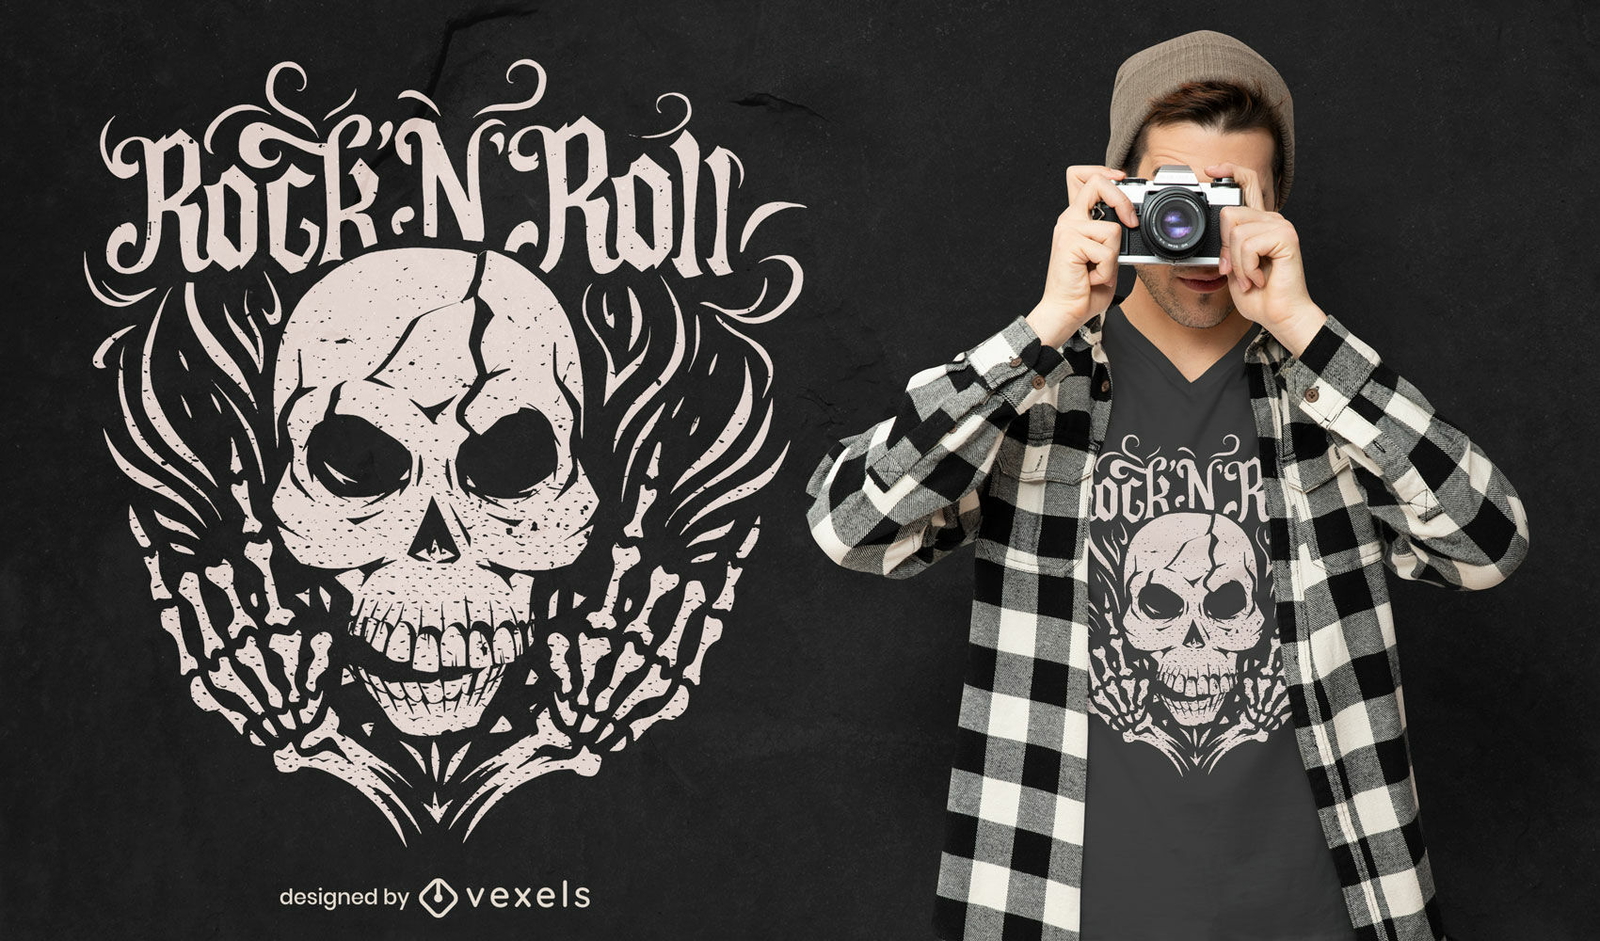
Rock and roll skull t-shirt design
Choose a folder
All favorites
Create new
Save
Rock and roll skull t-shirt design
Print ready
for Merch
Retrowave mountains t-shirt design
Choose a folder
All favorites
Create new
Save
Retrowave mountains t-shirt design
Print ready
for Merch
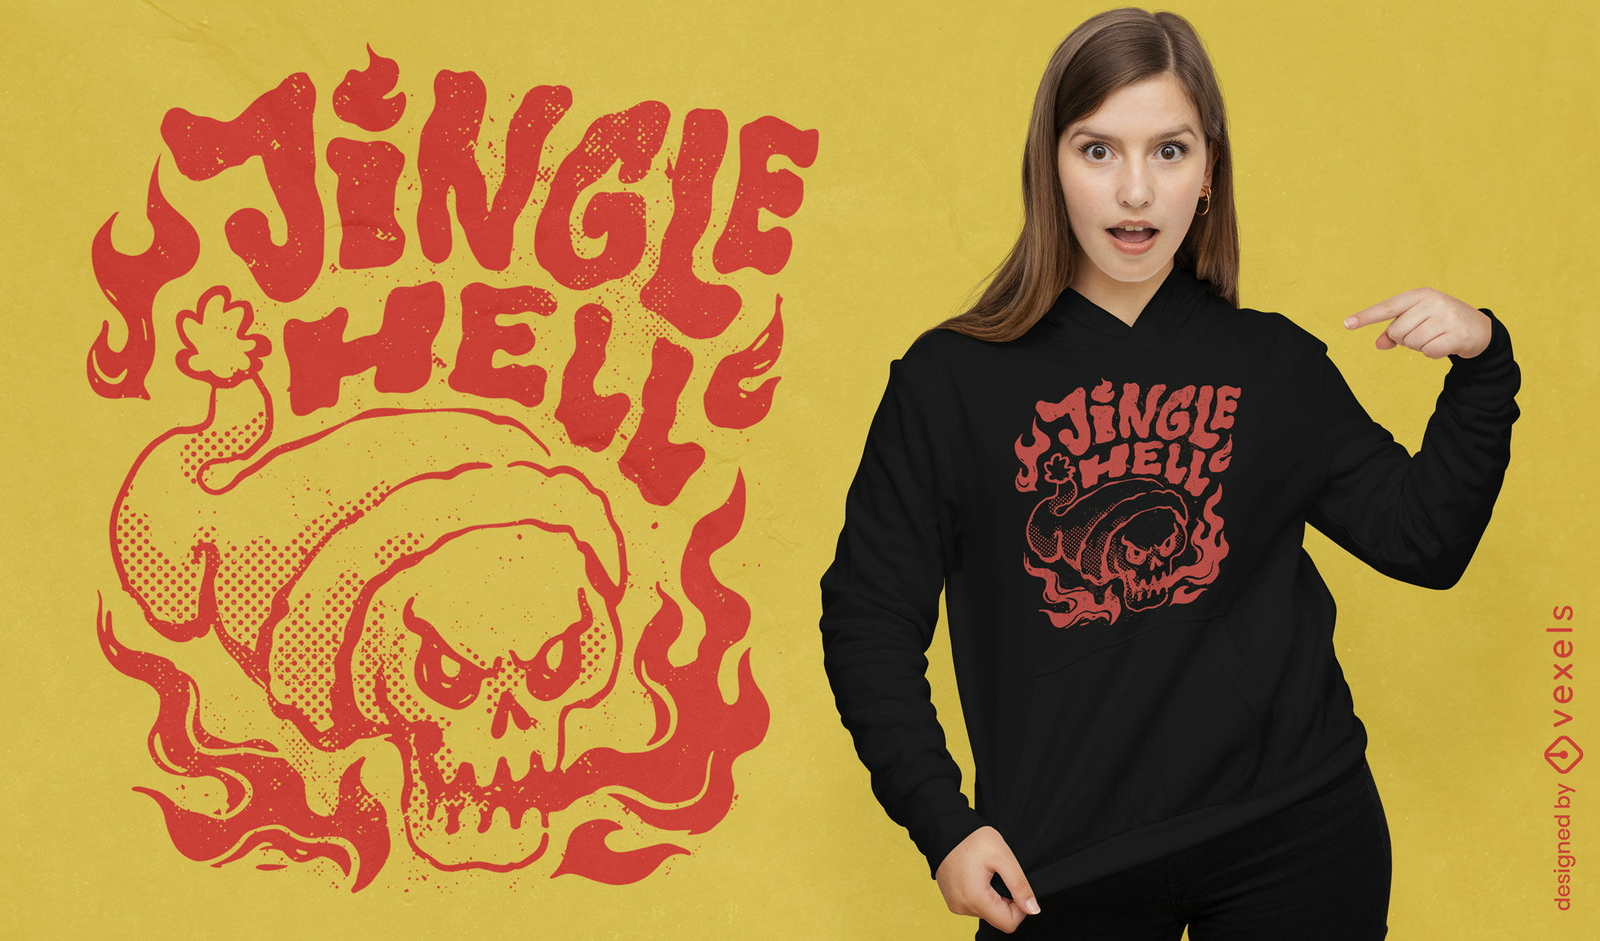
Jingle hell skull t-shirt design
Choose a folder
All favorites
Create new
Save
Jingle hell skull t-shirt design
Print ready
for Merch
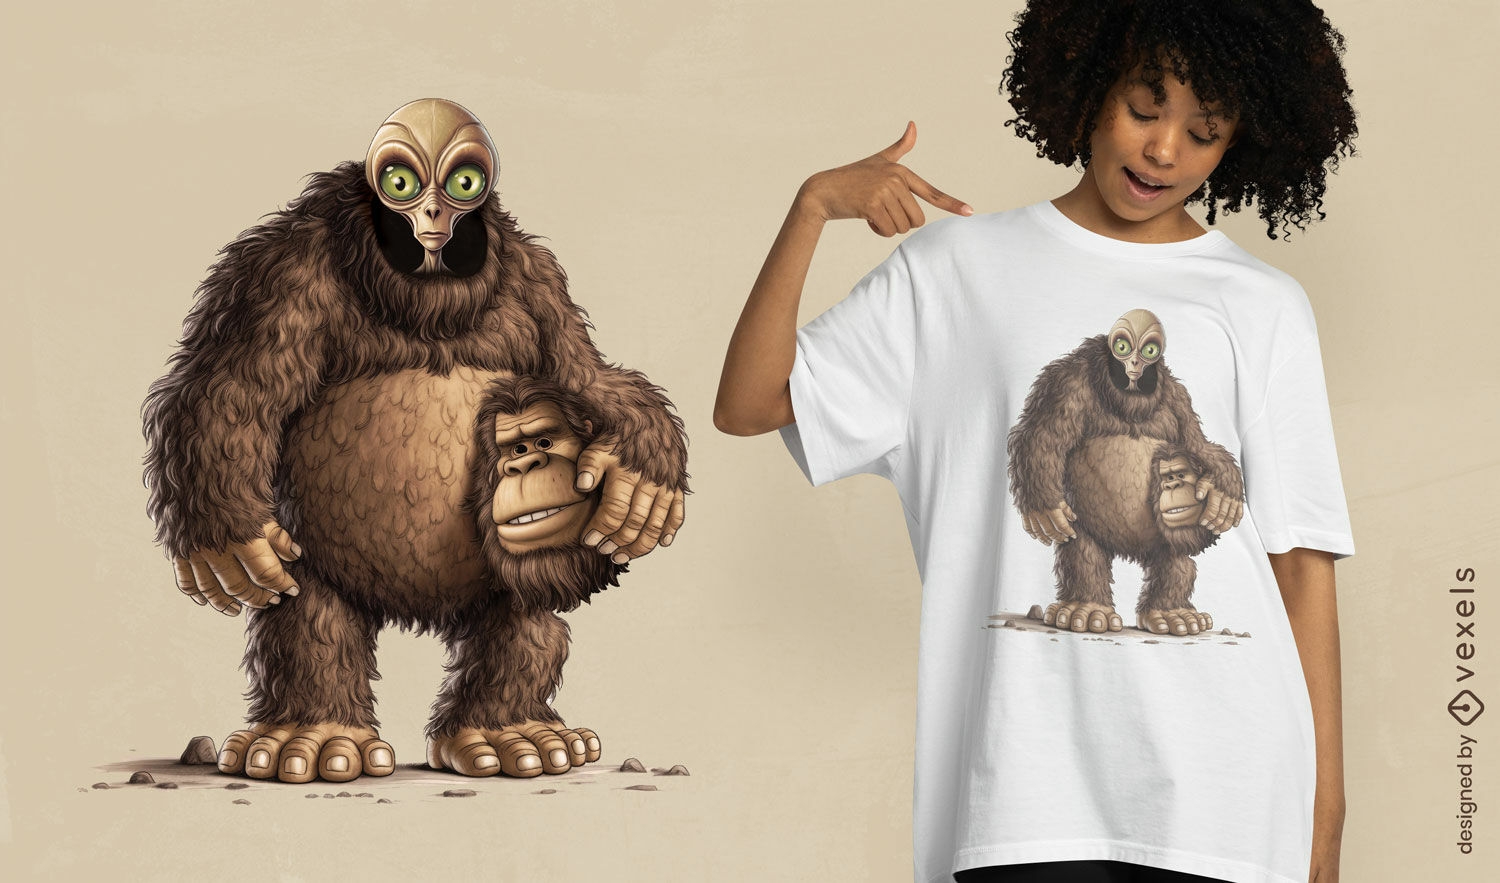
Alien with Bigfoot costume t-shirt design
Choose a folder
All favorites
Create new
Save
Alien with Bigfoot costume t-shirt design
Print ready
for Merch
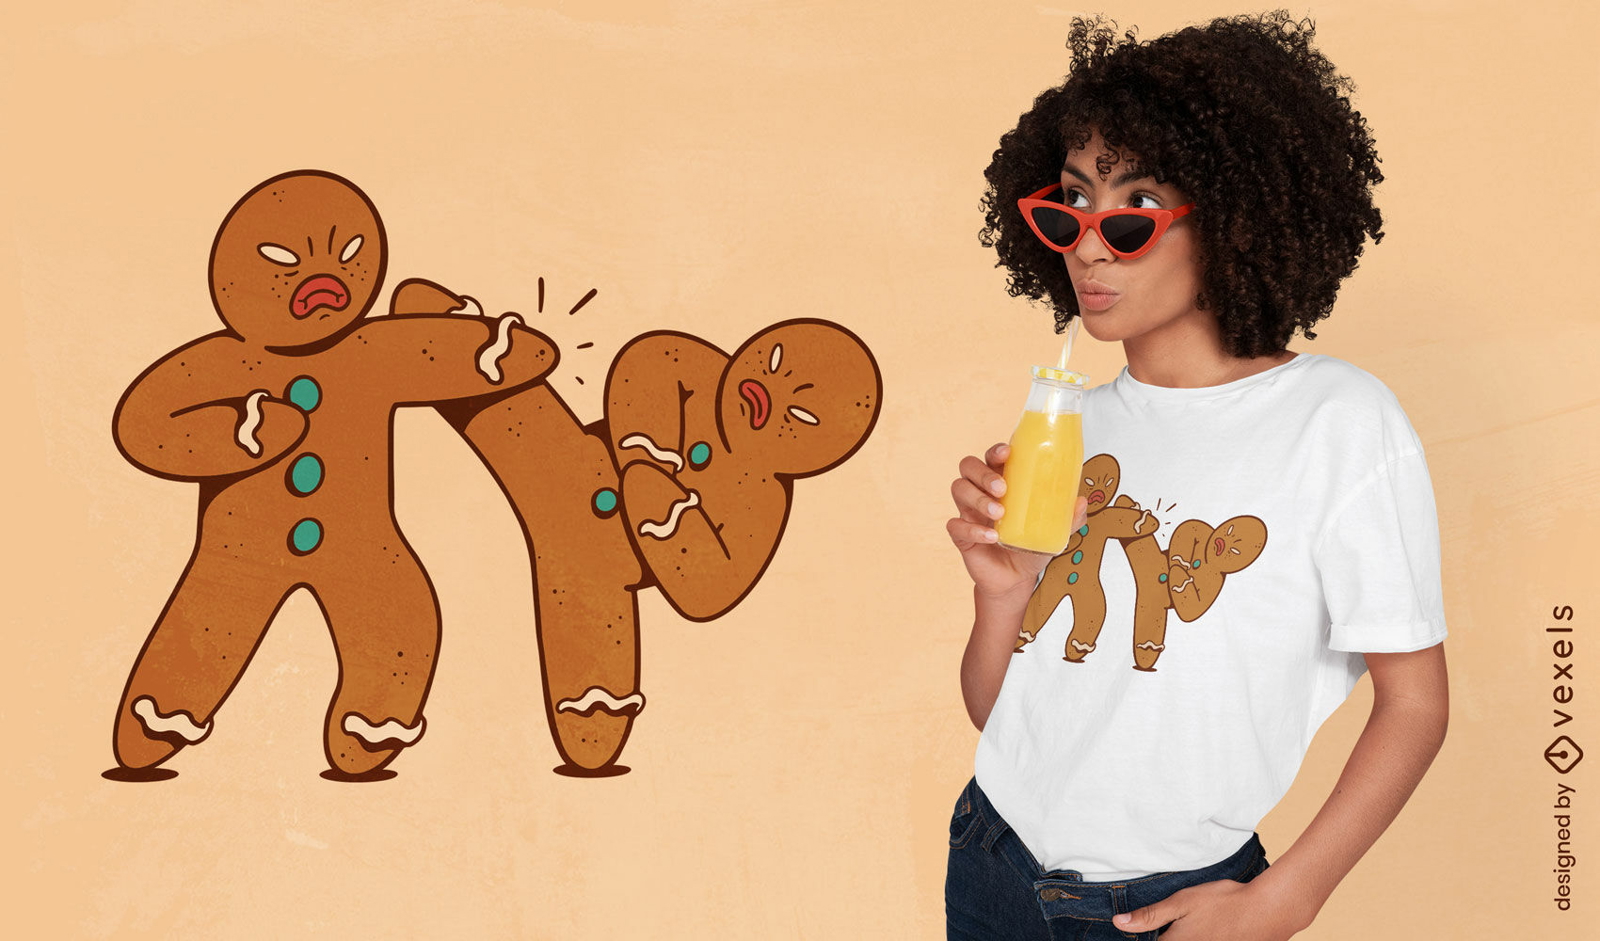
Gingerbread men fight t-shirt design
Choose a folder
All favorites
Create new
Save
Gingerbread men fight t-shirt design
Print ready
for Merch
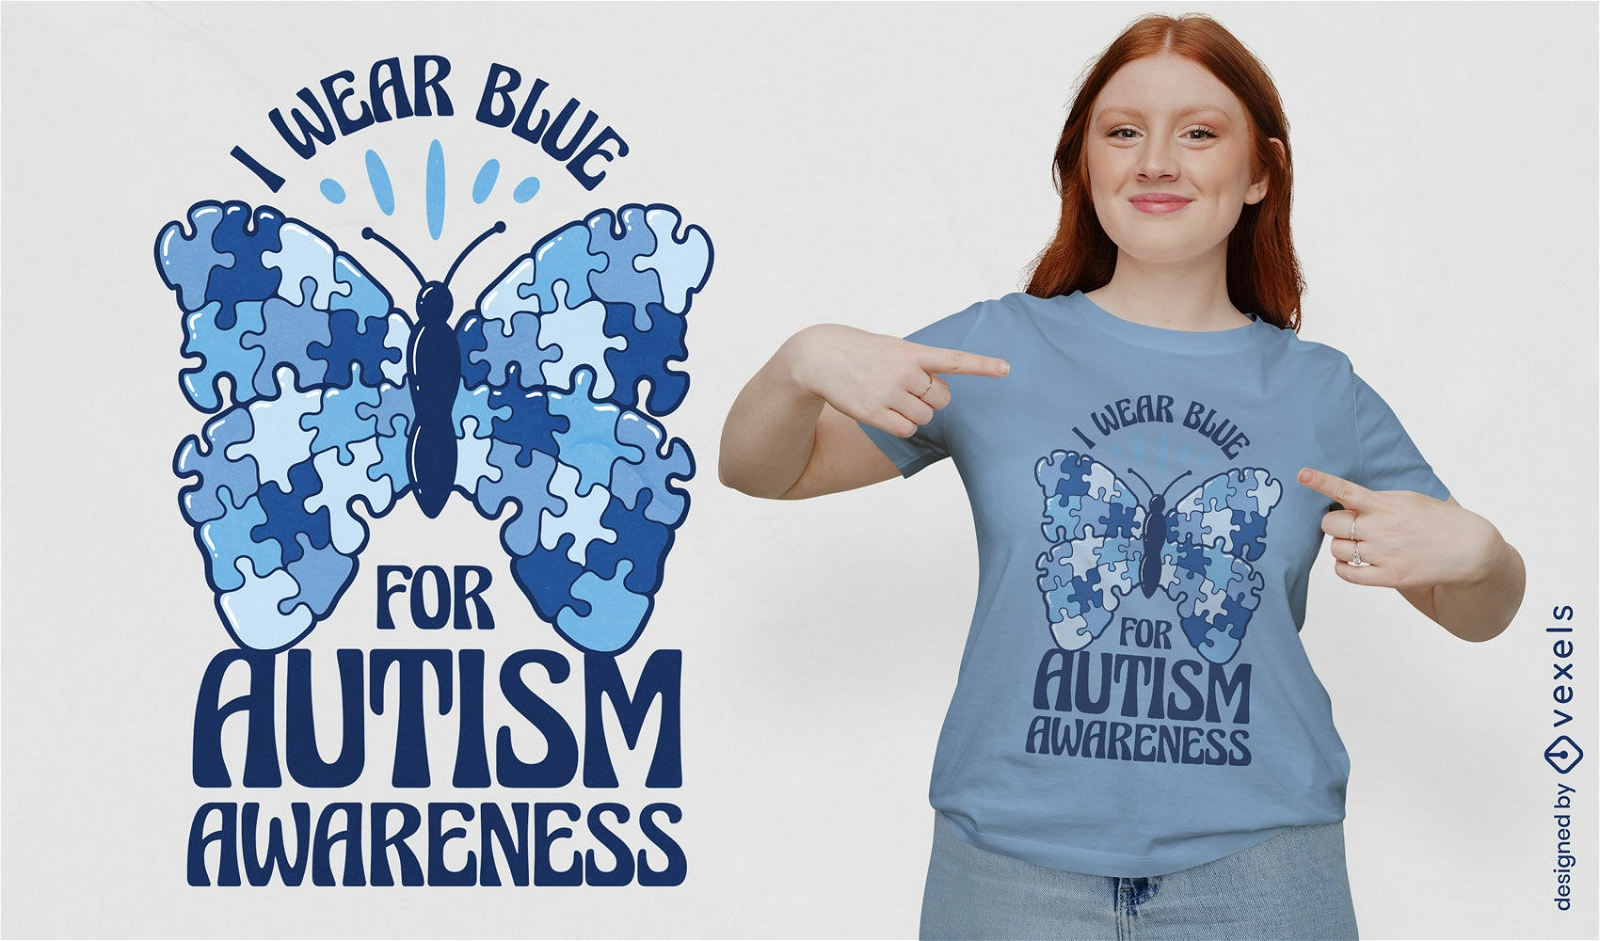
Autism awareness puzzle butterfly t-shirt design
Choose a folder
All favorites
Create new
Save
Autism awareness puzzle butterfly t-shirt design
Print ready
for Merch
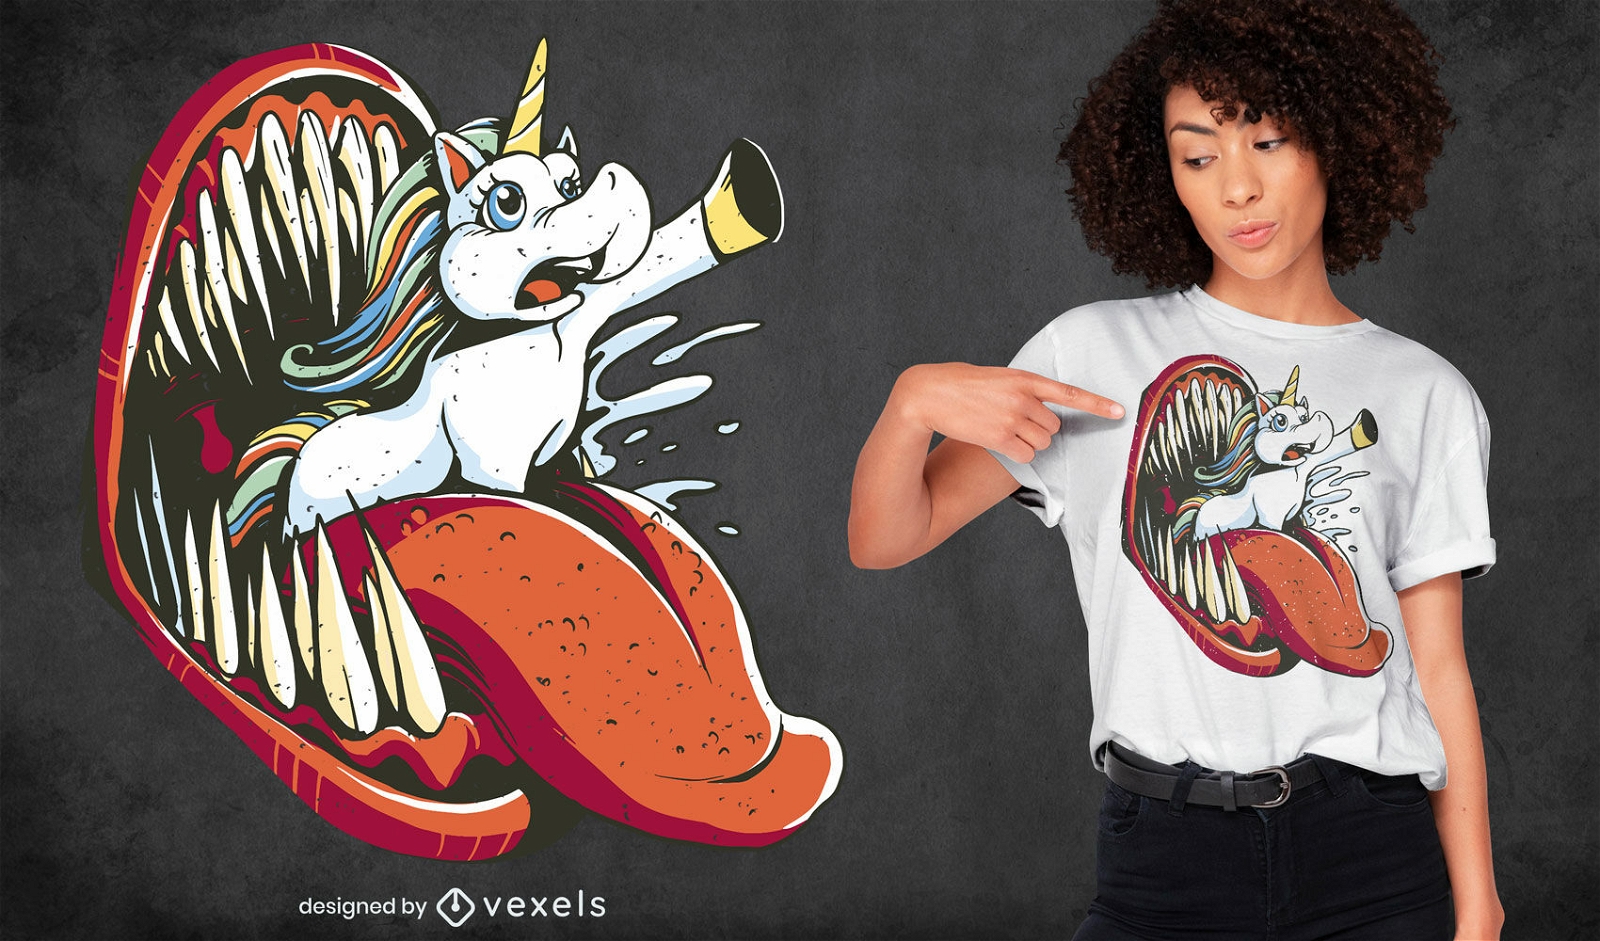
Unicorn and monster mouth t-shirt design
Choose a folder
All favorites
Create new
Save
Unicorn and monster mouth t-shirt design
Editable text
Print ready
for Merch
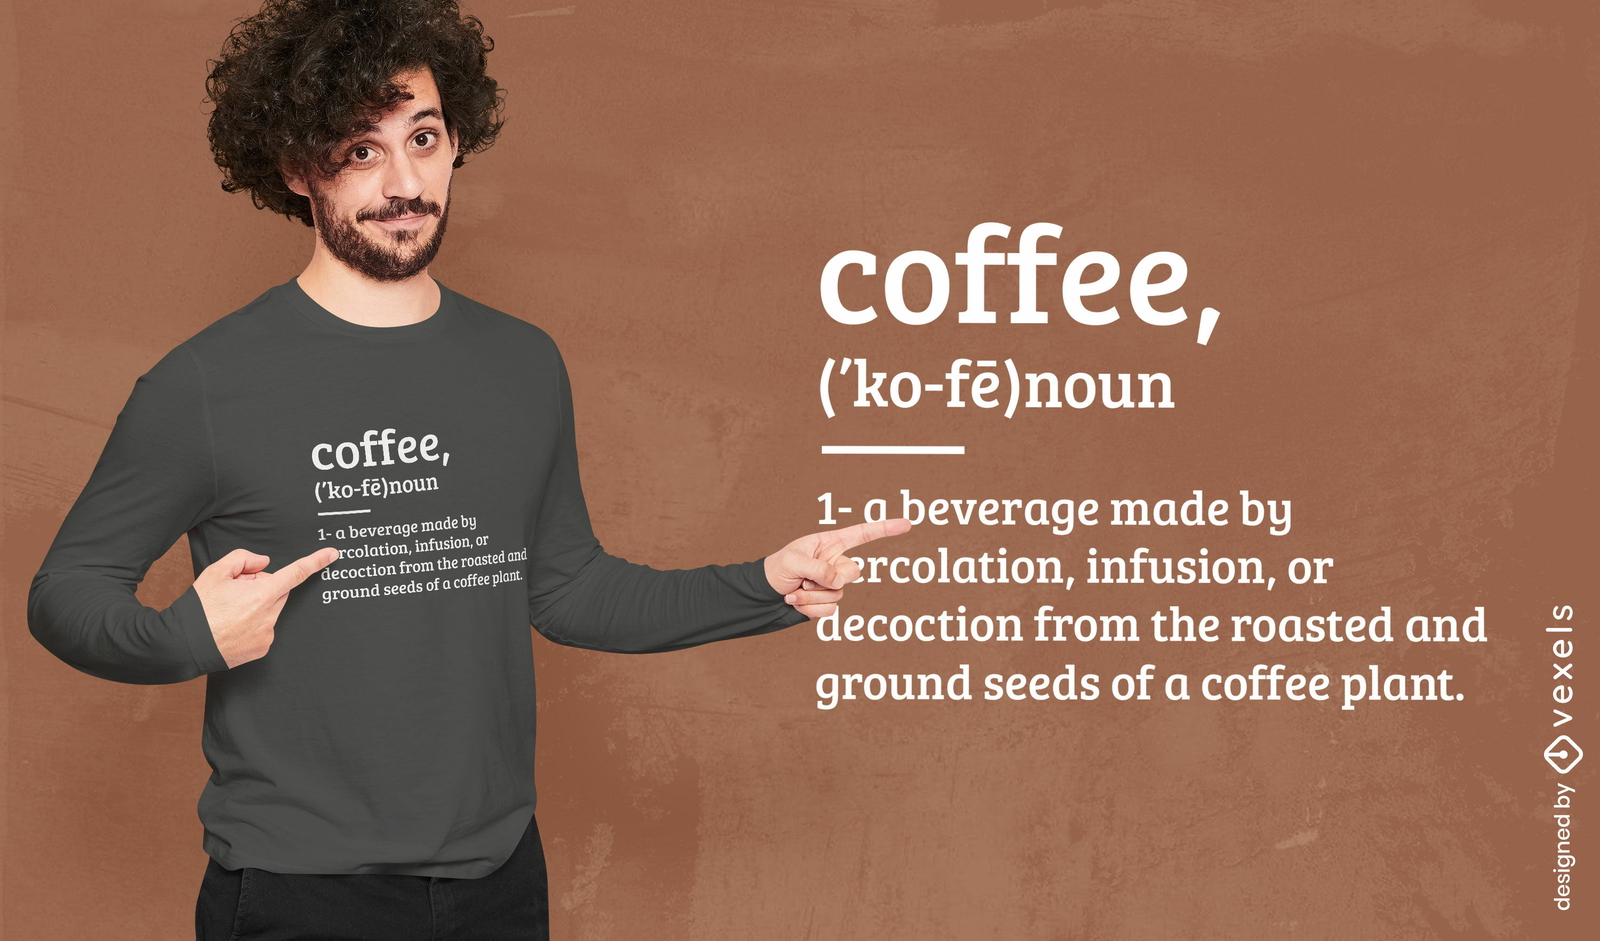
Coffee dictionary definition t-shirt design
Choose a folder
All favorites
Create new
Save
Coffee dictionary definition t-shirt design
Print ready
for Merch
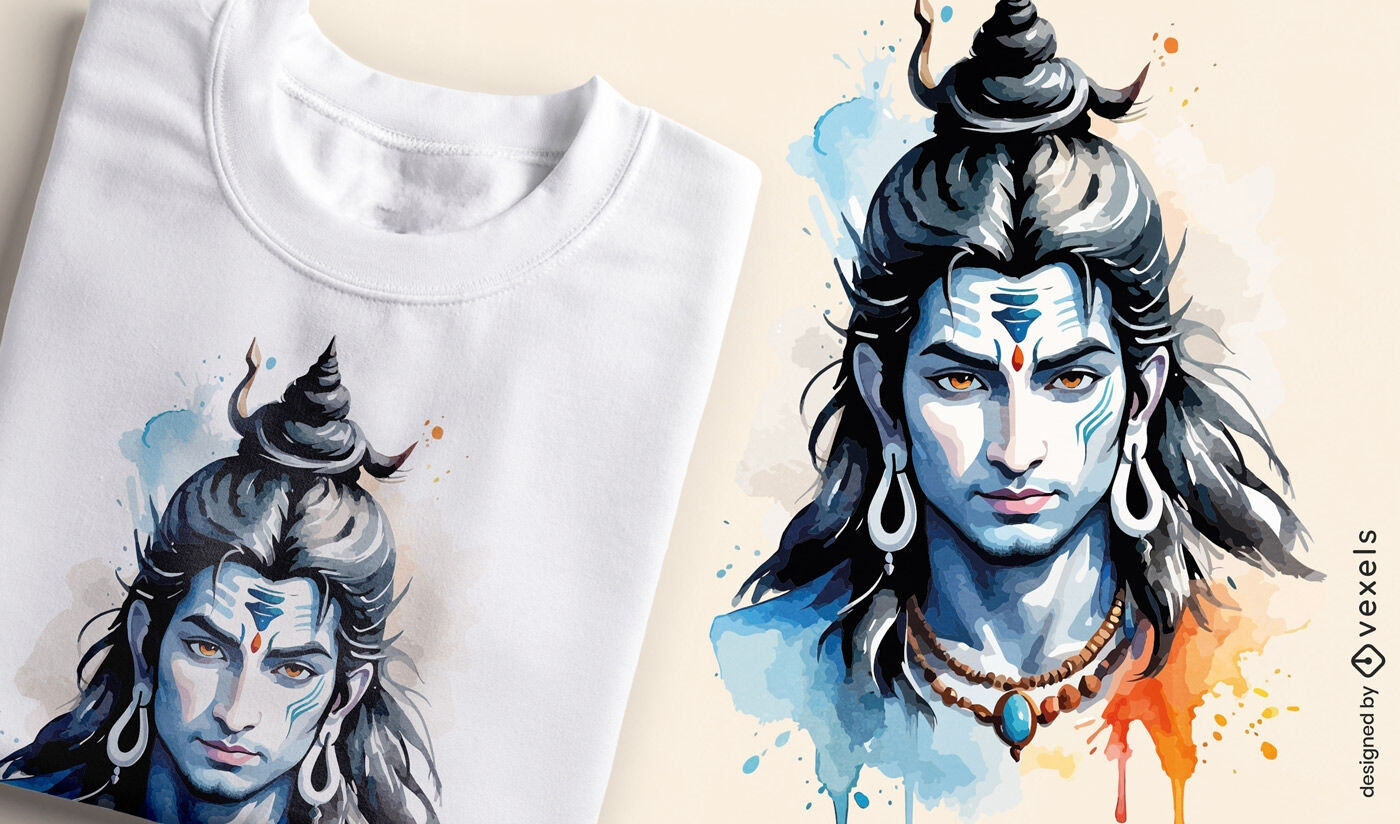
Watercolor Shiva portrait t-shirt design
Choose a folder
All favorites
Create new
Save
Watercolor Shiva portrait t-shirt design
Print ready
for Merch
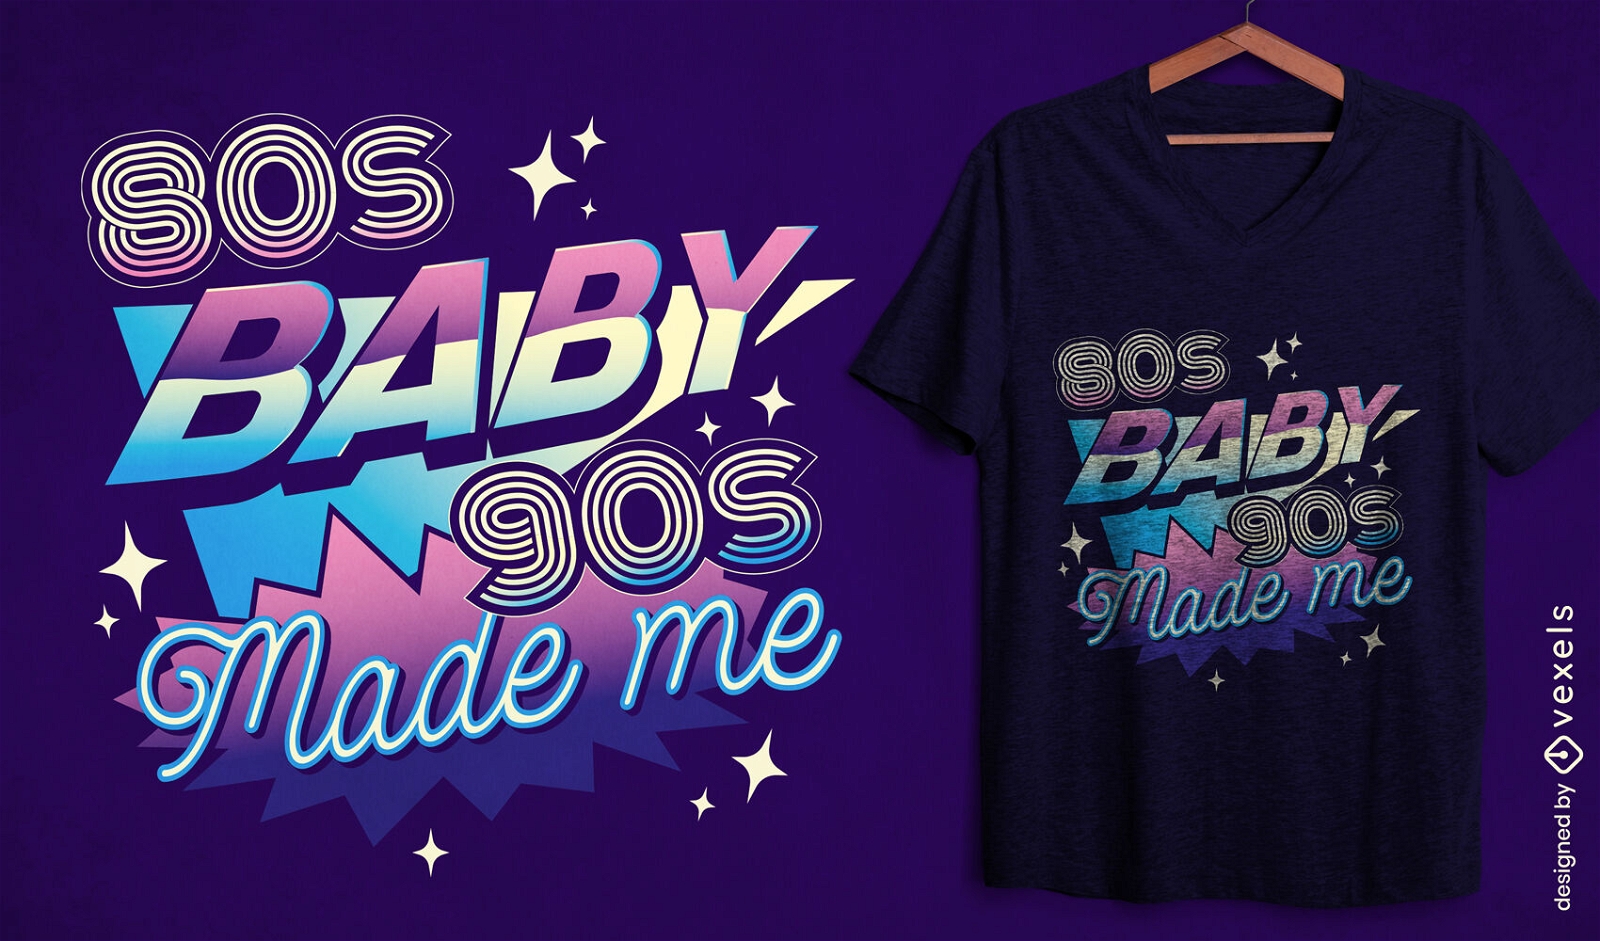
80s and 90s retro quote t-shirt design
Choose a folder
All favorites
Create new
Save
80s and 90s retro quote t-shirt design
Print ready
for Merch
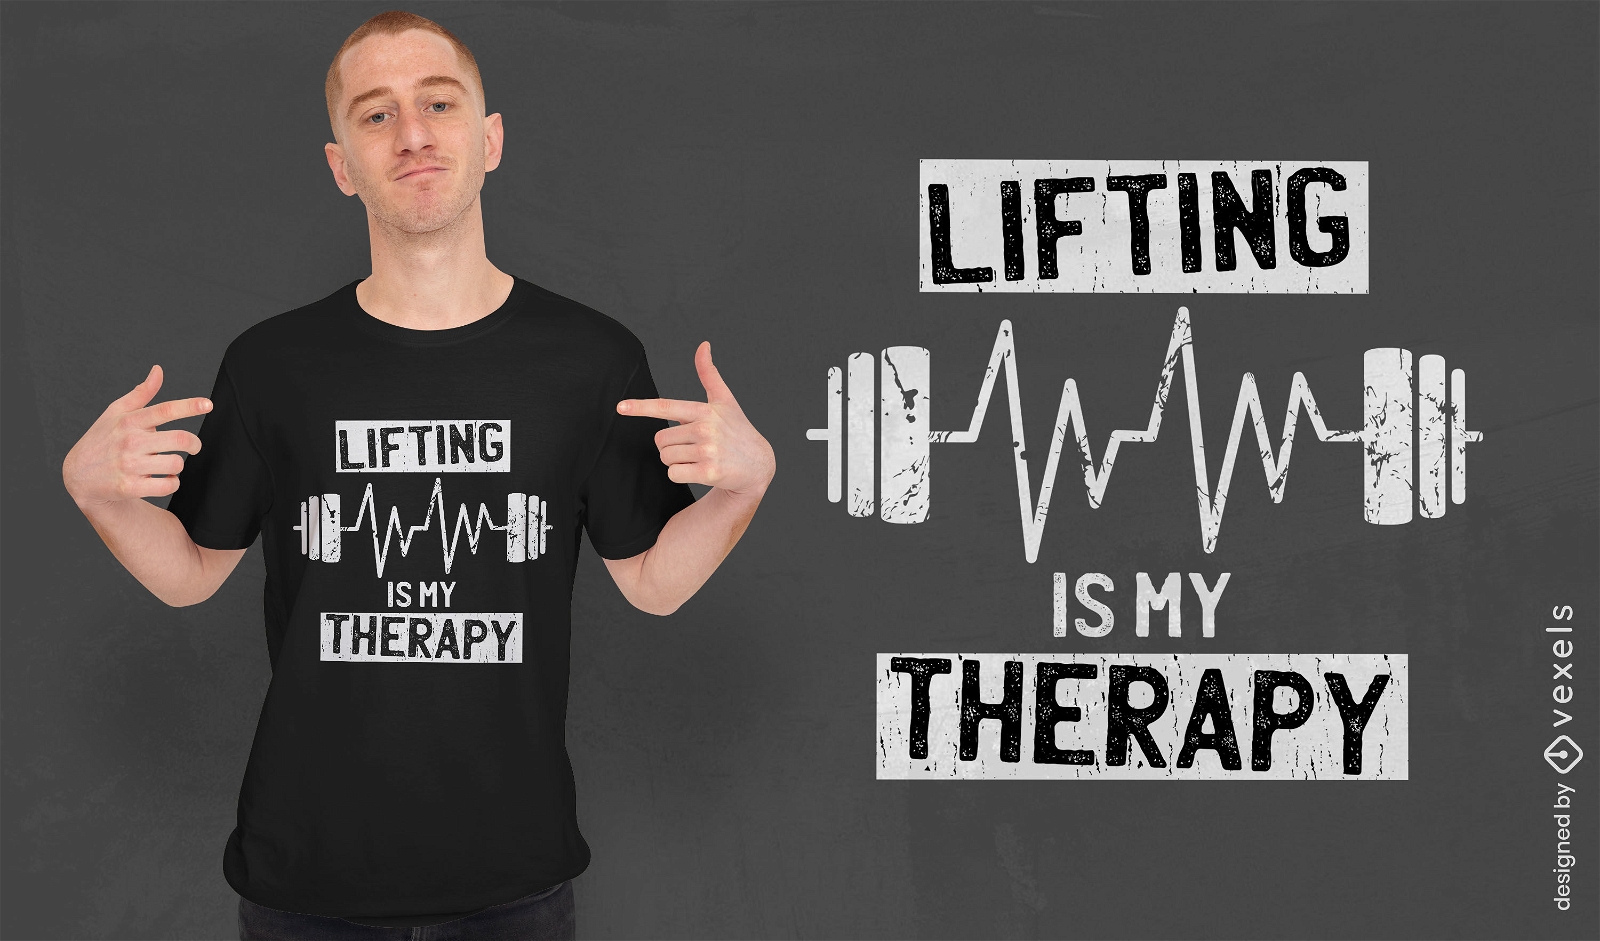
Weightlifting therapy t-shirt design
Choose a folder
All favorites
Create new
Save
Weightlifting therapy t-shirt design
Print ready
for Merch
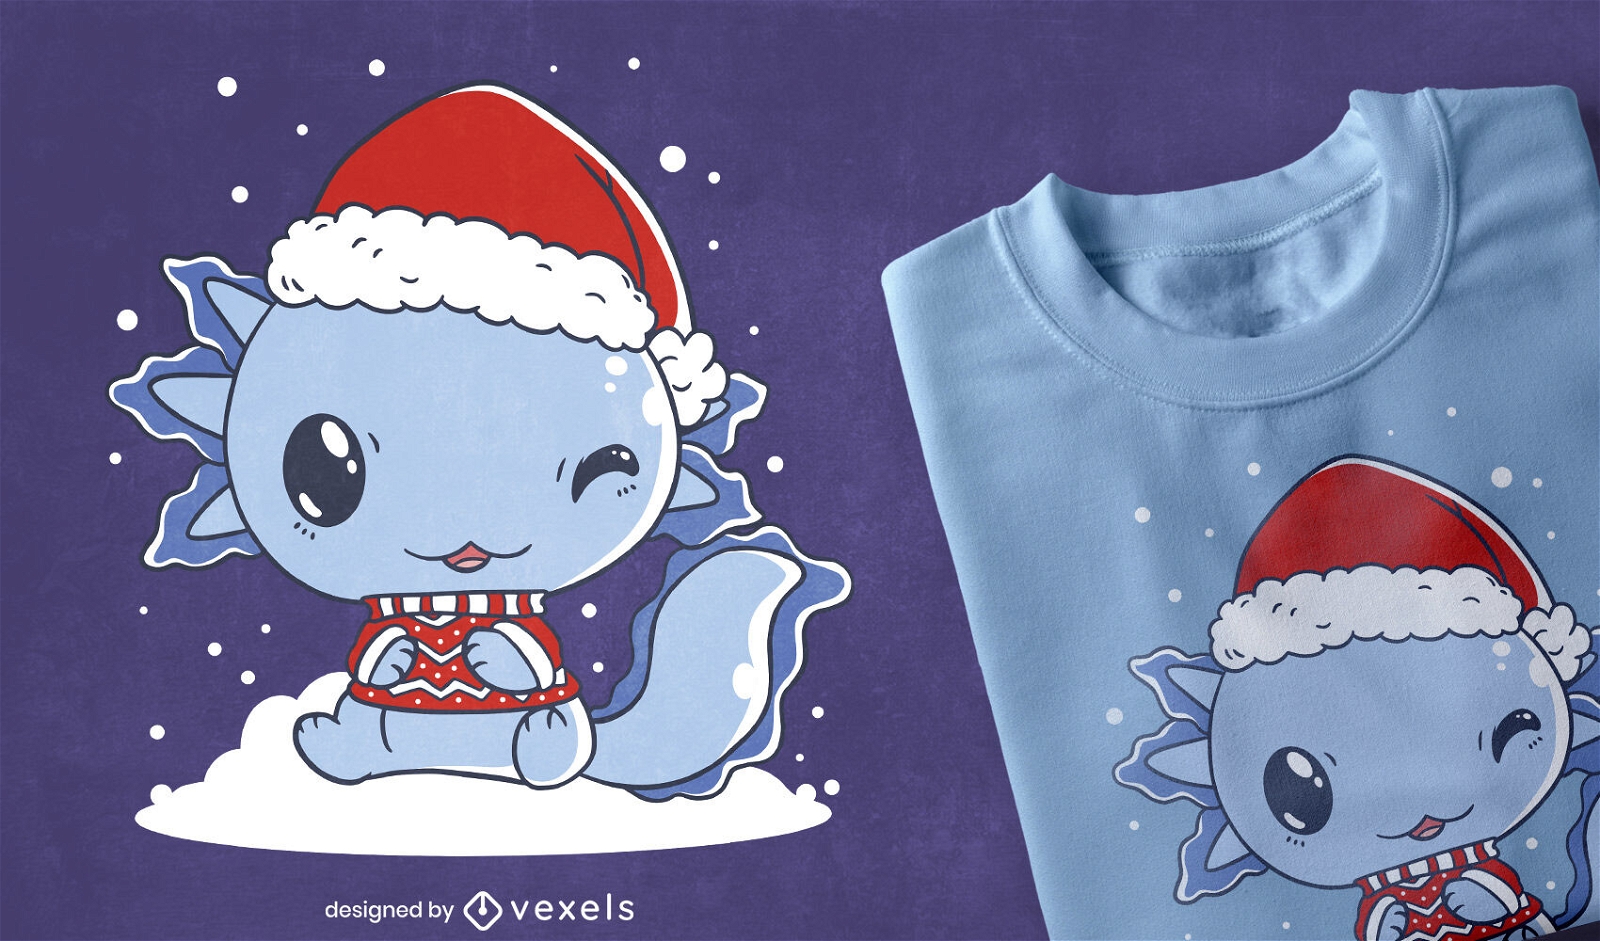
Kawaii axolotl in Christmas t-shirt design
Choose a folder
All favorites
Create new
Save
Kawaii axolotl in Christmas t-shirt design
Print ready
for Merch
Snownicorn Christmas unicorn t-shirt design
Choose a folder
All favorites
Create new
Save
Snownicorn Christmas unicorn t-shirt design
Print ready
for Merch
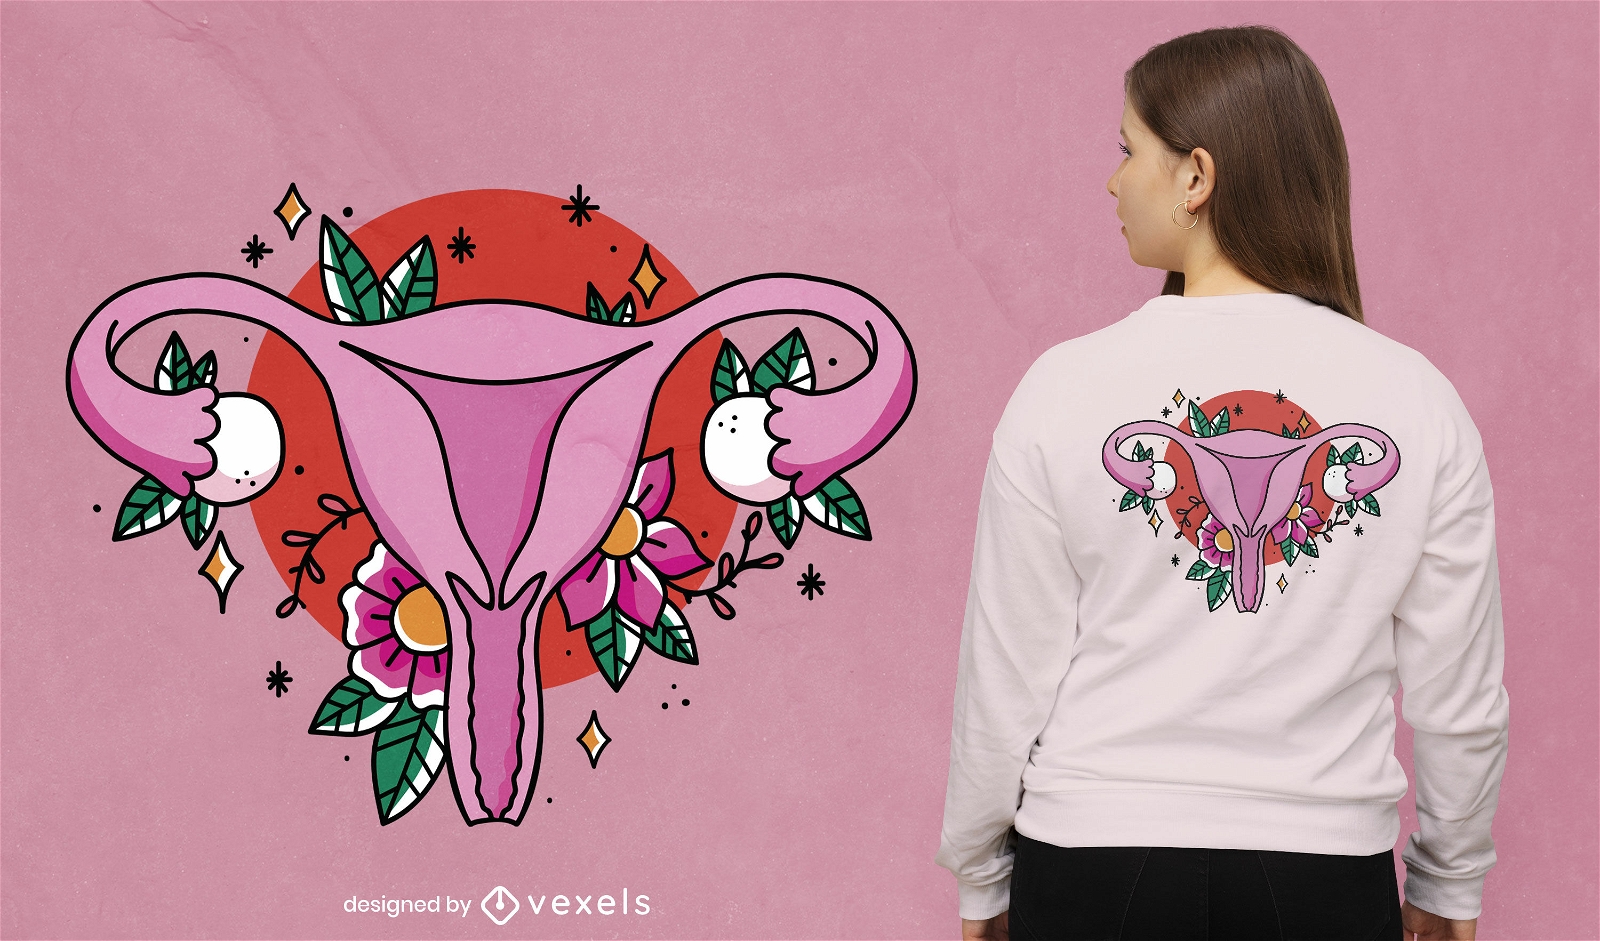
Floral uterus t-shirt design
Choose a folder
All favorites
Create new
Save
Floral uterus t-shirt design
Print ready
for Merch
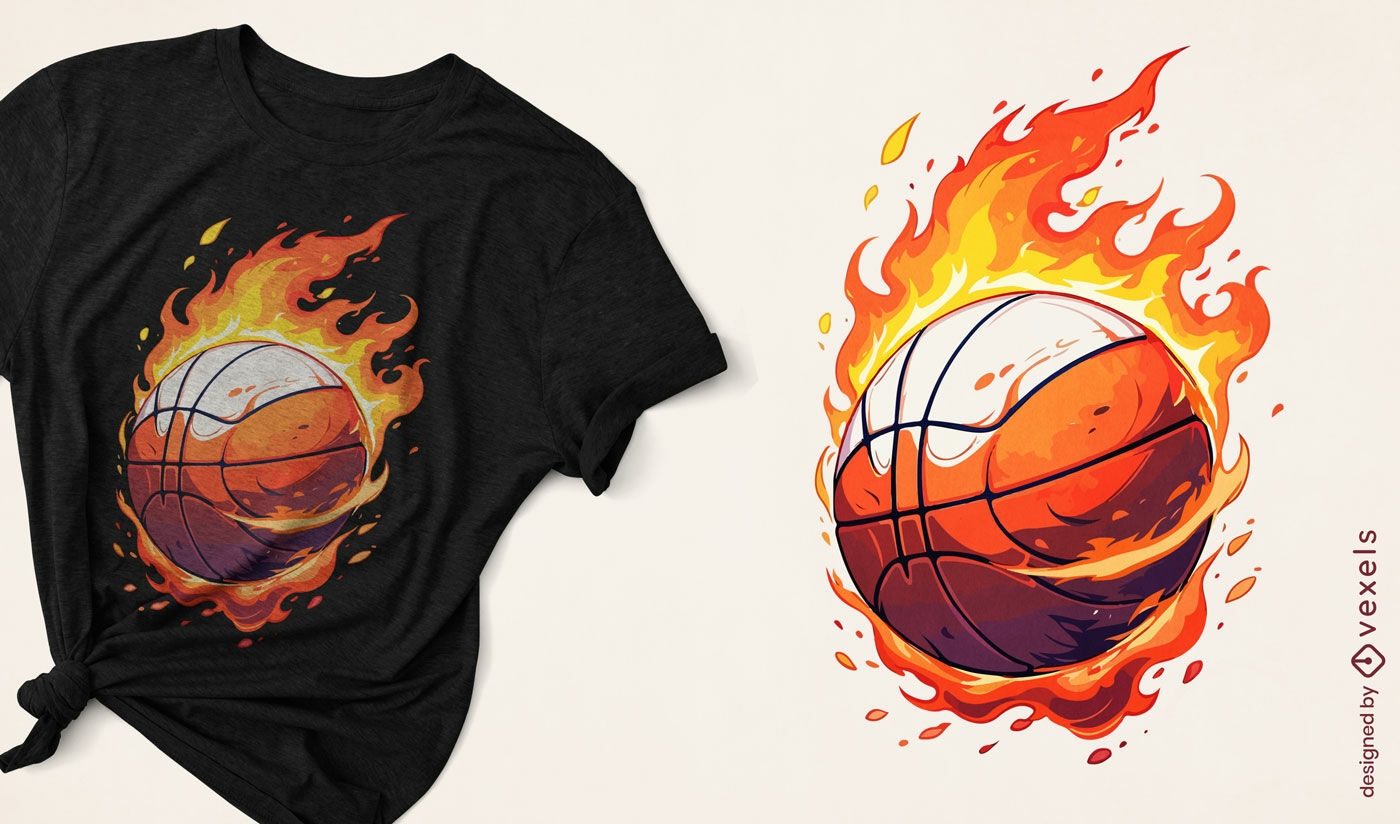
Flaming basketball t-shirt design
Choose a folder
All favorites
Create new
Save
Flaming basketball t-shirt design
Editable text
Print ready
for Merch
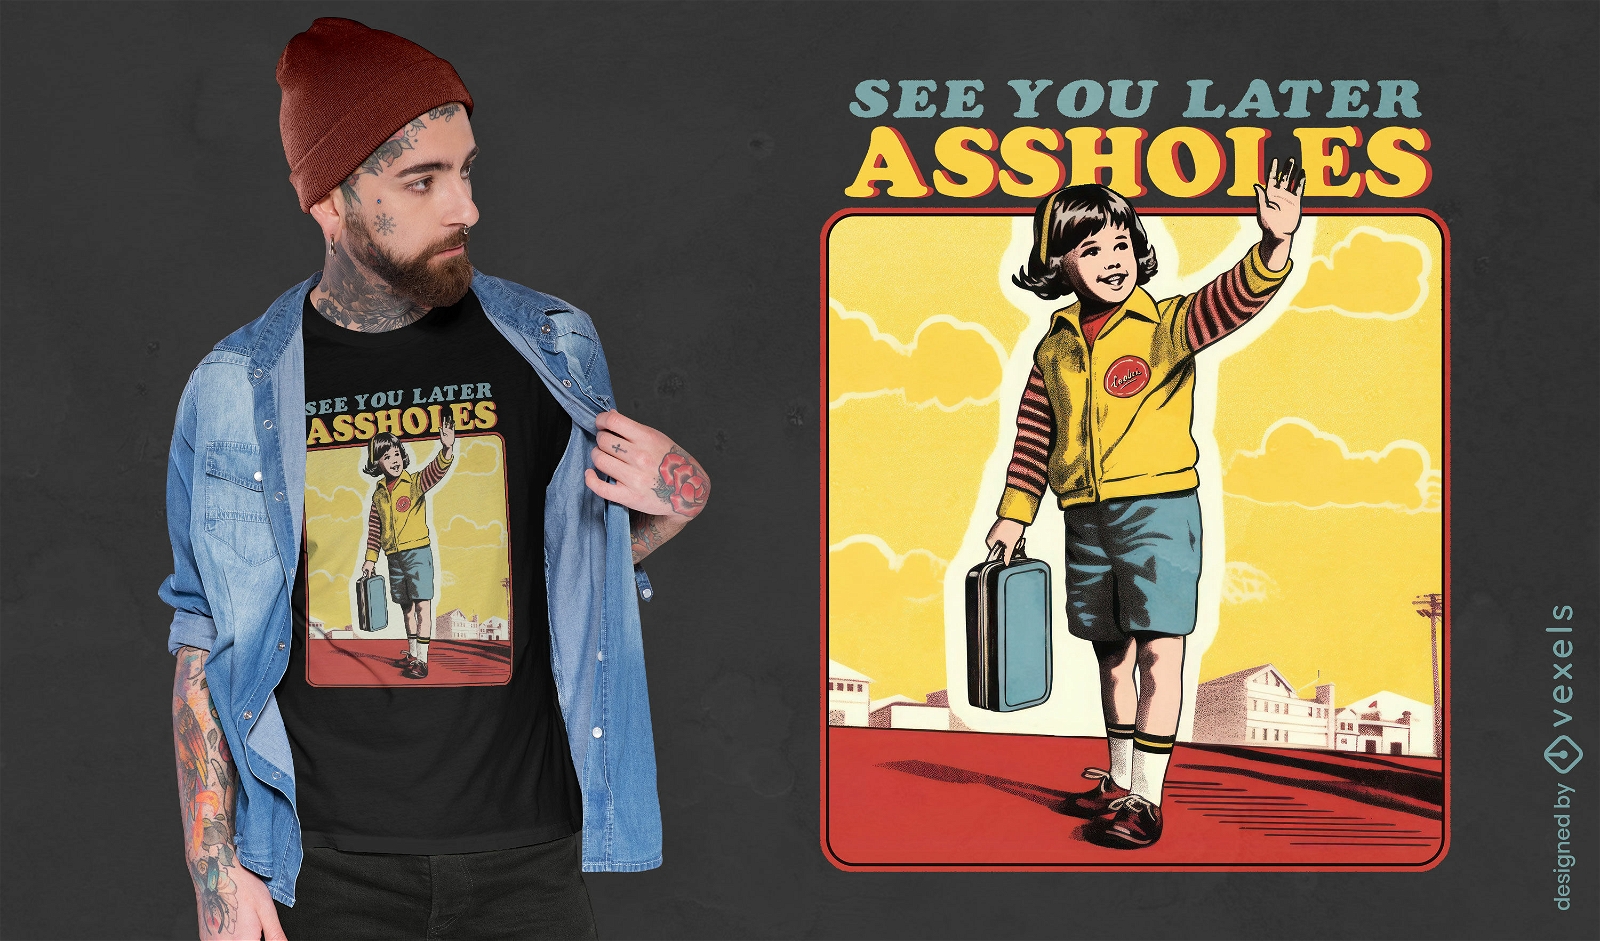
Farewell humor t-shirt design
Choose a folder
All favorites
Create new
Save
Farewell humor t-shirt design
Print ready
for Merch
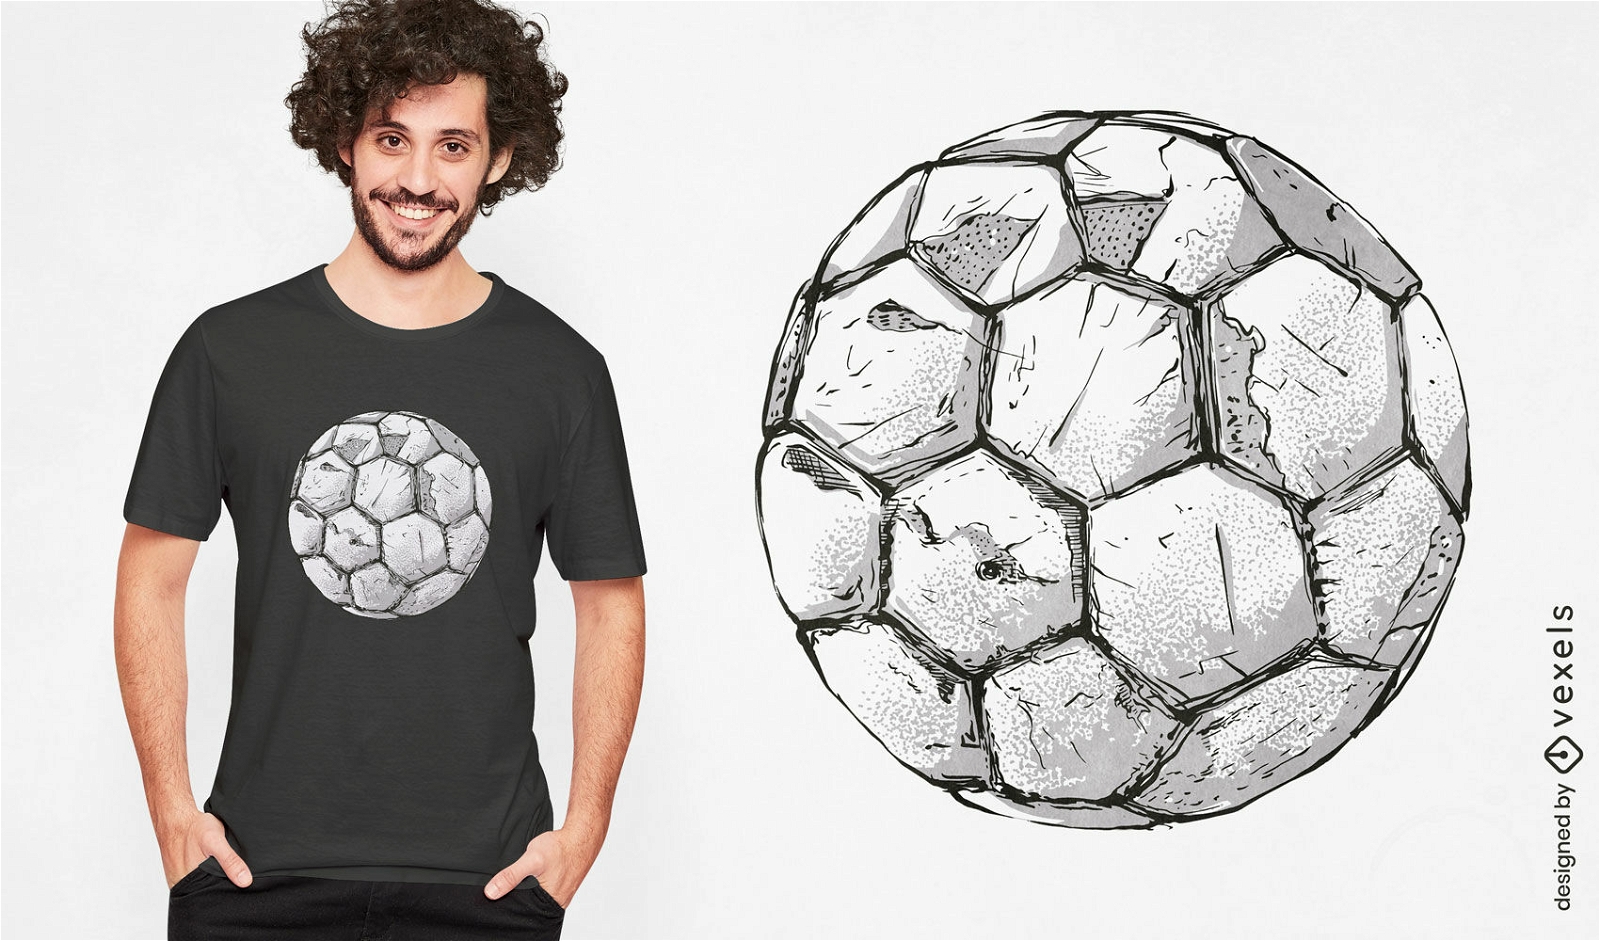
Realistic soccer ball sport t-shirt design
Choose a folder
All favorites
Create new
Save
Realistic soccer ball sport t-shirt design
Print ready
for Merch
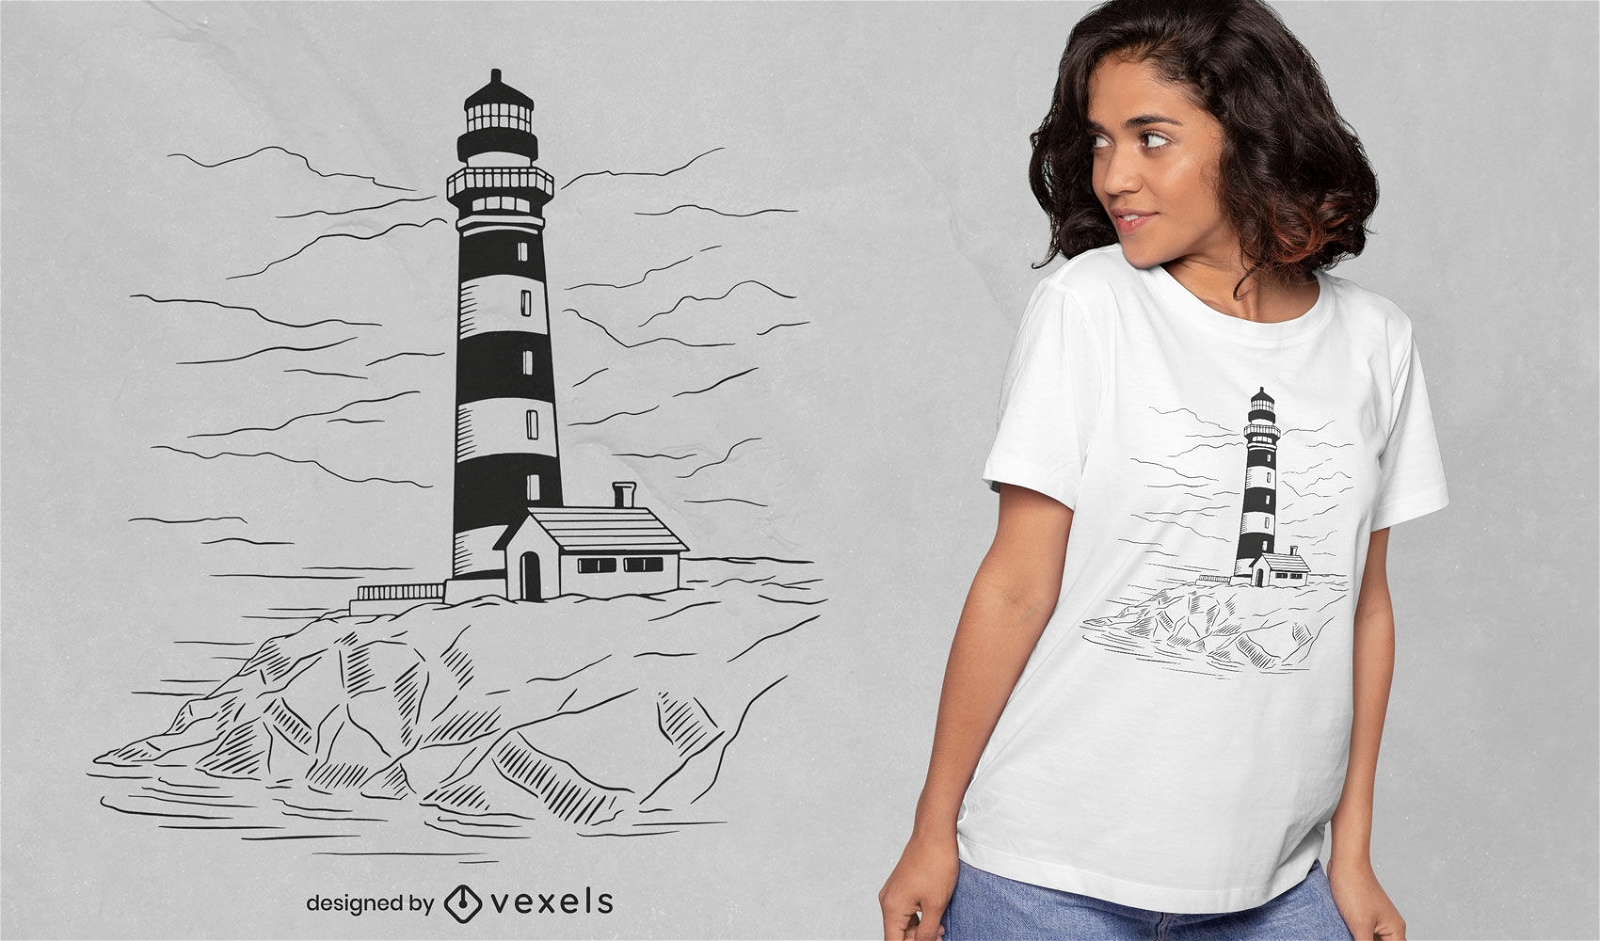
Lighthouse on ocean coast t-shirt design
Choose a folder
All favorites
Create new
Save
Lighthouse on ocean coast t-shirt design
German Content
Print ready
for Merch
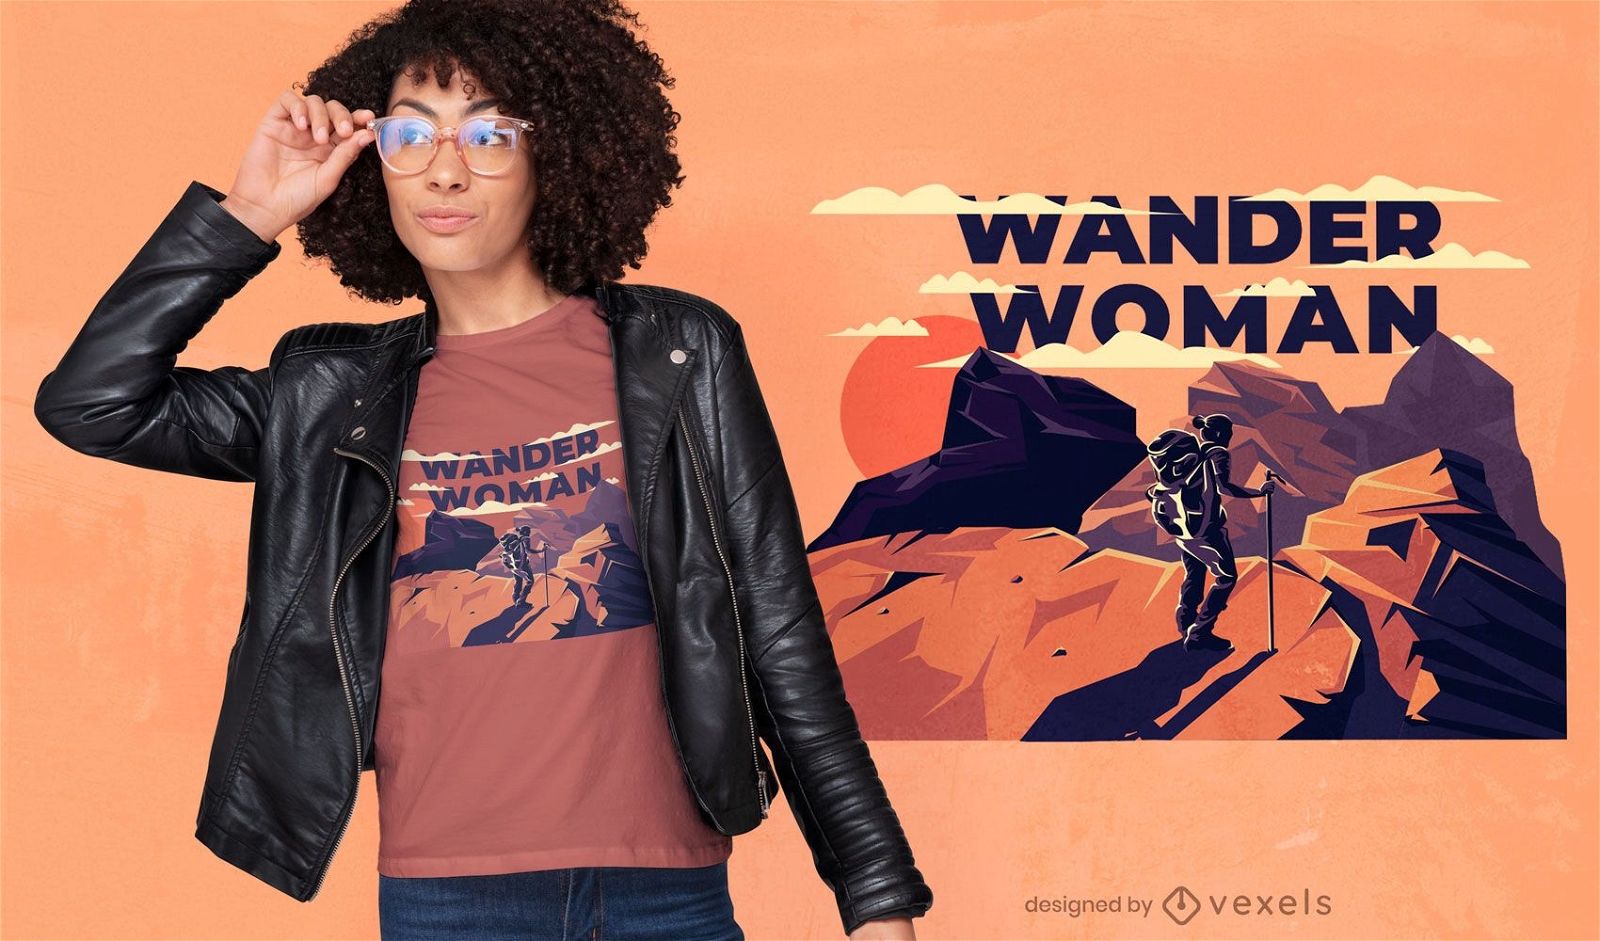
Woman hiking mountains t-shirt design
Choose a folder
All favorites
Create new
Save
Woman hiking mountains t-shirt design
Print ready
for Merch
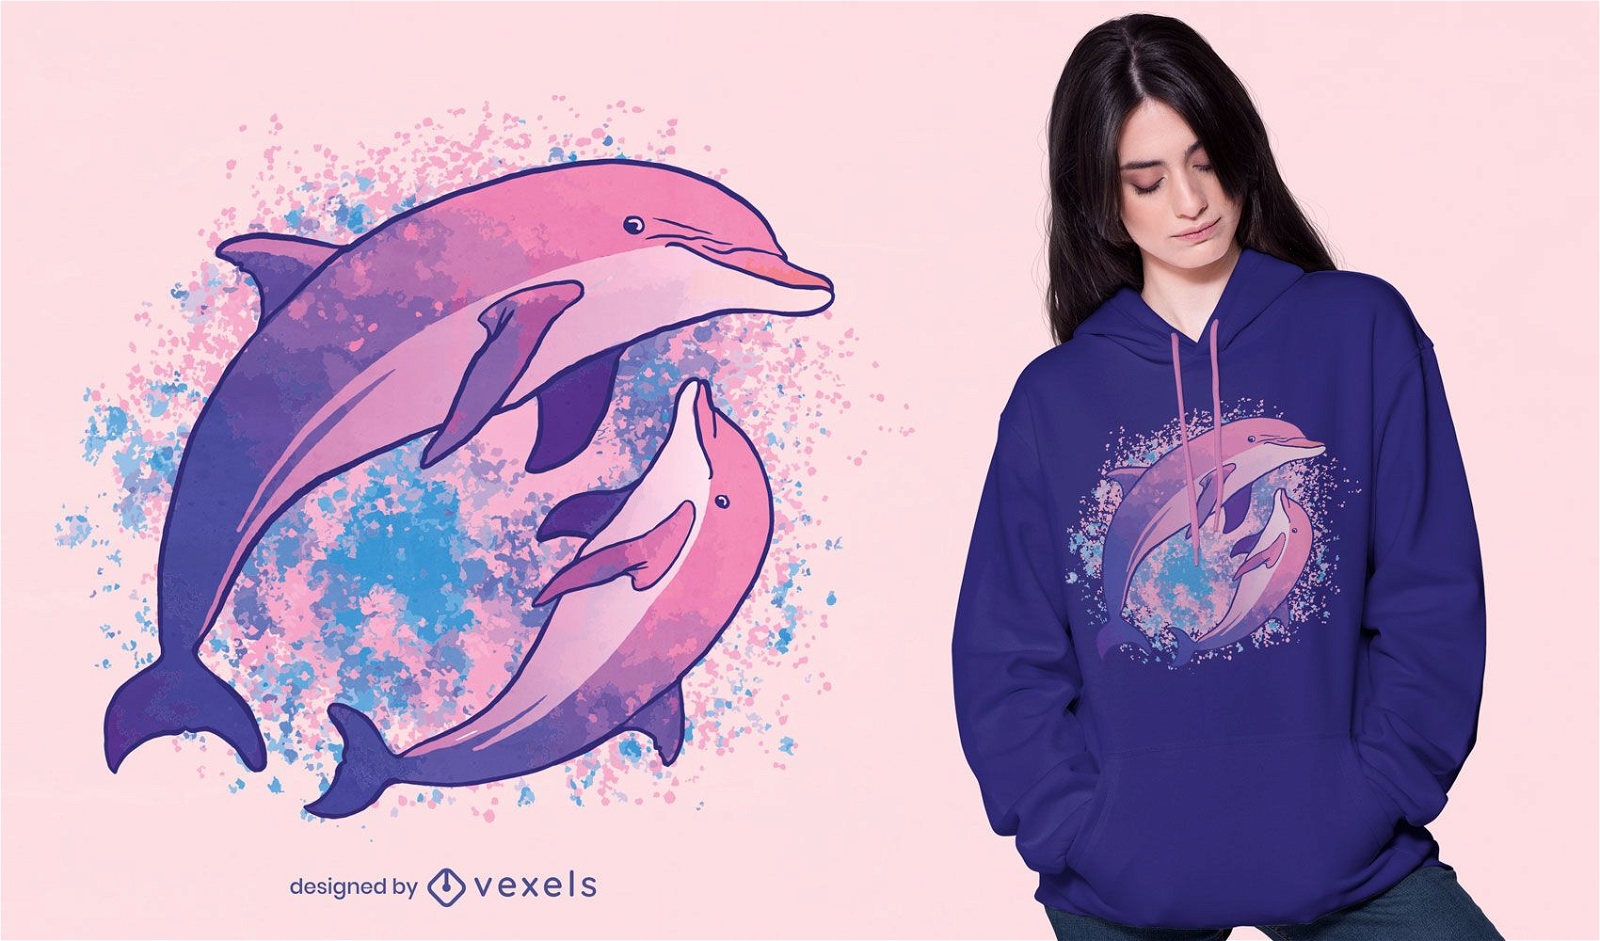
Dolphin watercolor composition t-shirt design
Choose a folder
All favorites
Create new
Save
Dolphin watercolor composition t-shirt design
Print ready
for Merch
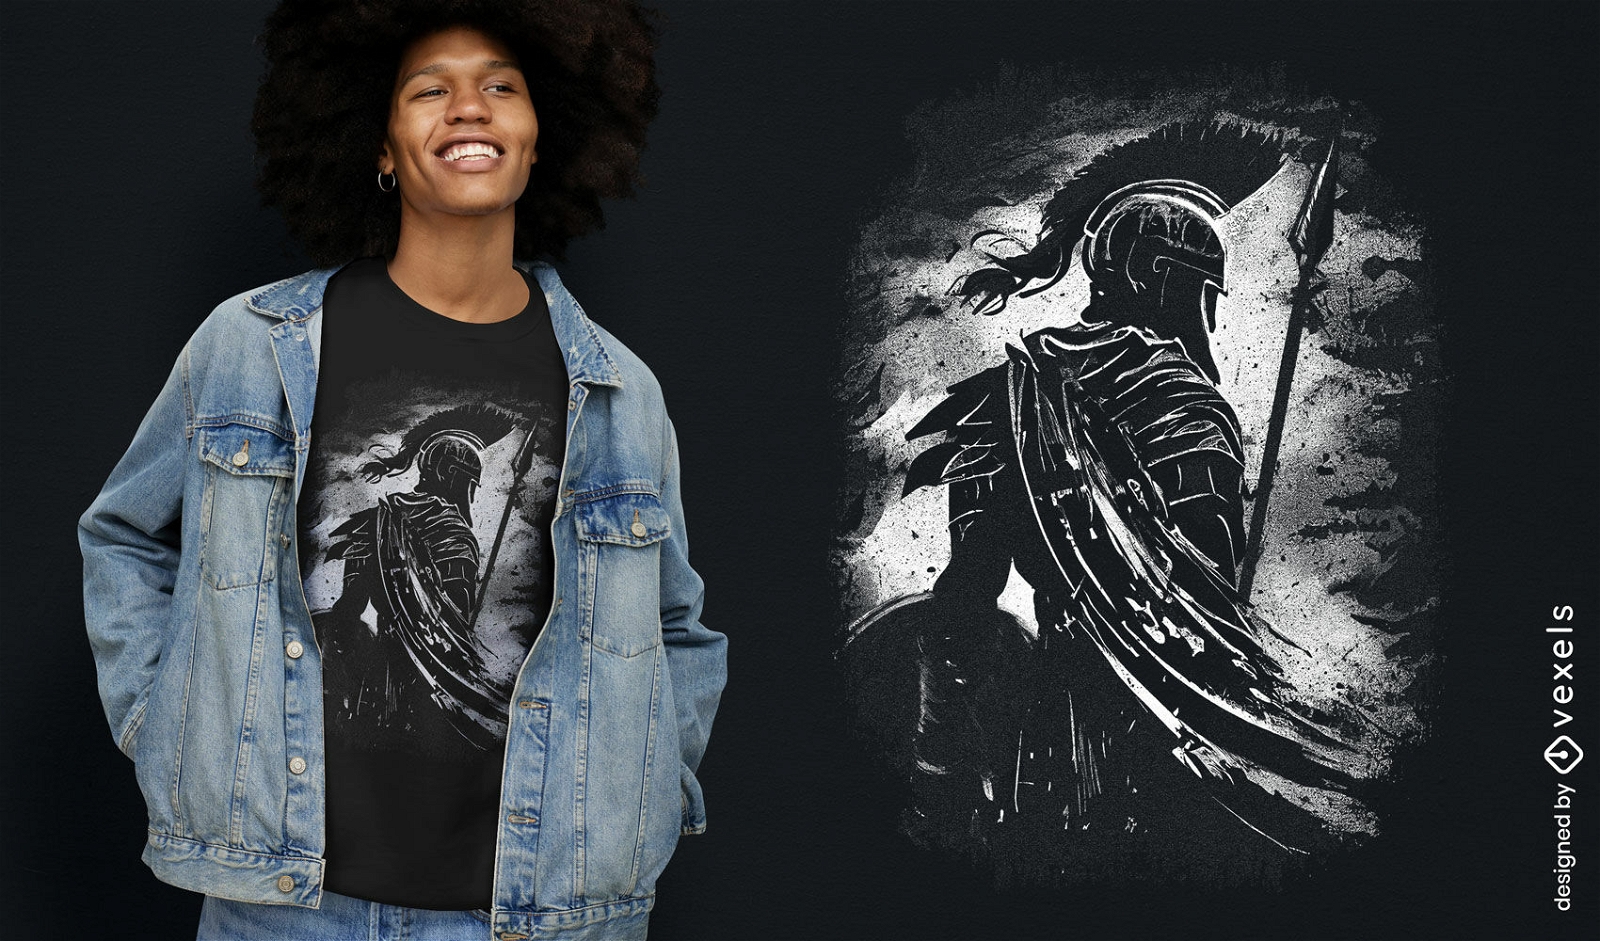
Achilles warrior t-shirt design
Choose a folder
All favorites
Create new
Save
Achilles warrior t-shirt design
Editable text
Print ready
for Merch
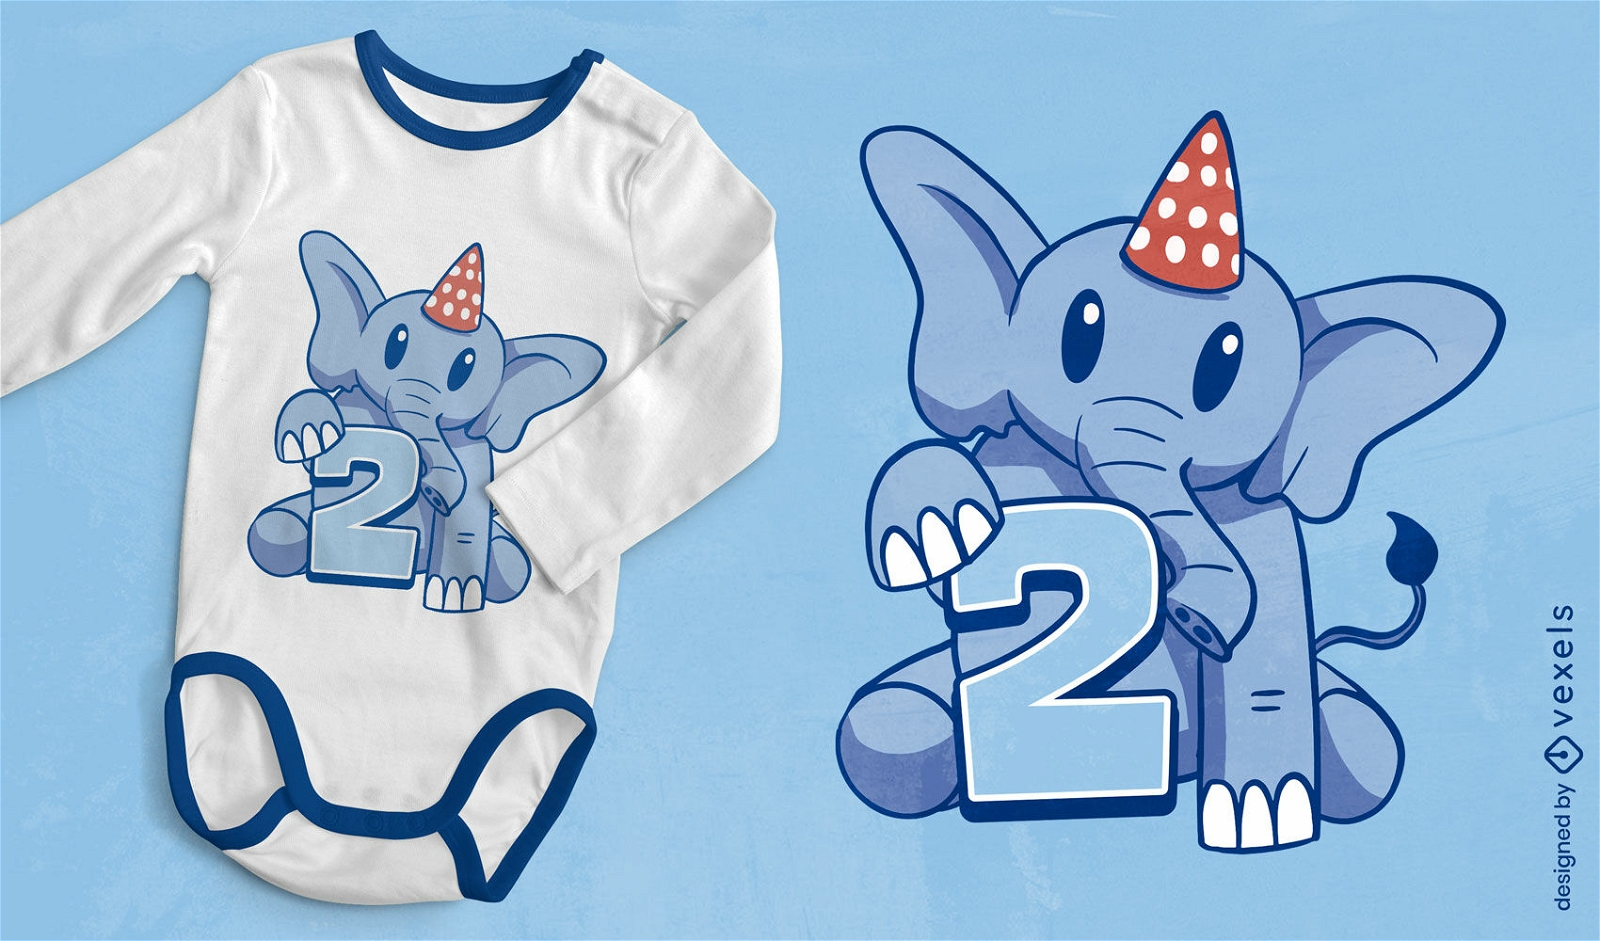
Birthday elephant kids t-shirt design
Choose a folder
All favorites
Create new
Save
Birthday elephant kids t-shirt design
Boost Your Business
With The Leading Graphic Platform For Merch.
SEE PLANS
Next
of 817
prev page
next page