Design Library
Explore Designs
New Merch Designs
Trending Merch Designs
Vectors
PNGs & SVGs
Mockups
T-Shirts
T-Shirt PSD Templates
KDP Designs
Phone Cases
Pillows
Tote Bags
Posters
Mugs
Design Tools
Designer
New!
T-shirt Maker
Mockup Generator
Quote Generator
Logo Maker
Resources
Merch Digest
Blog
Help Center
Creators Program
Learn About Merch
Changelog
API Access
Pricing
Loading...
Sign Up
Login
All
grafico
Design Library
Explore Designs
New Merch Designs
Trending Merch Designs
Vectors
PNGs & SVGs
Mockups
T-Shirts
T-Shirt PSD Templates
KDP Designs
Phone Cases
Pillows
Tote Bags
Posters
Mugs
Design Tools
Designer
New!
T-shirt Maker
Mockup Generator
Quote Generator
Logo Maker
Resources
Merch Digest
Blog
Help Center
Creators Program
Learn About Merch
Changelog
API Access
PLANS
All
grafico
40815 grafico designs graphics for t-shirt and print on demand merch
Download grafico t-shirt designs and other merch graphics like book covers, phone cases, tote bags and more.
Sort by
Most relevant
Sponsored results by
Get 15% off with code: VEXELS15
Show more
Editable text
Print ready
for Merch
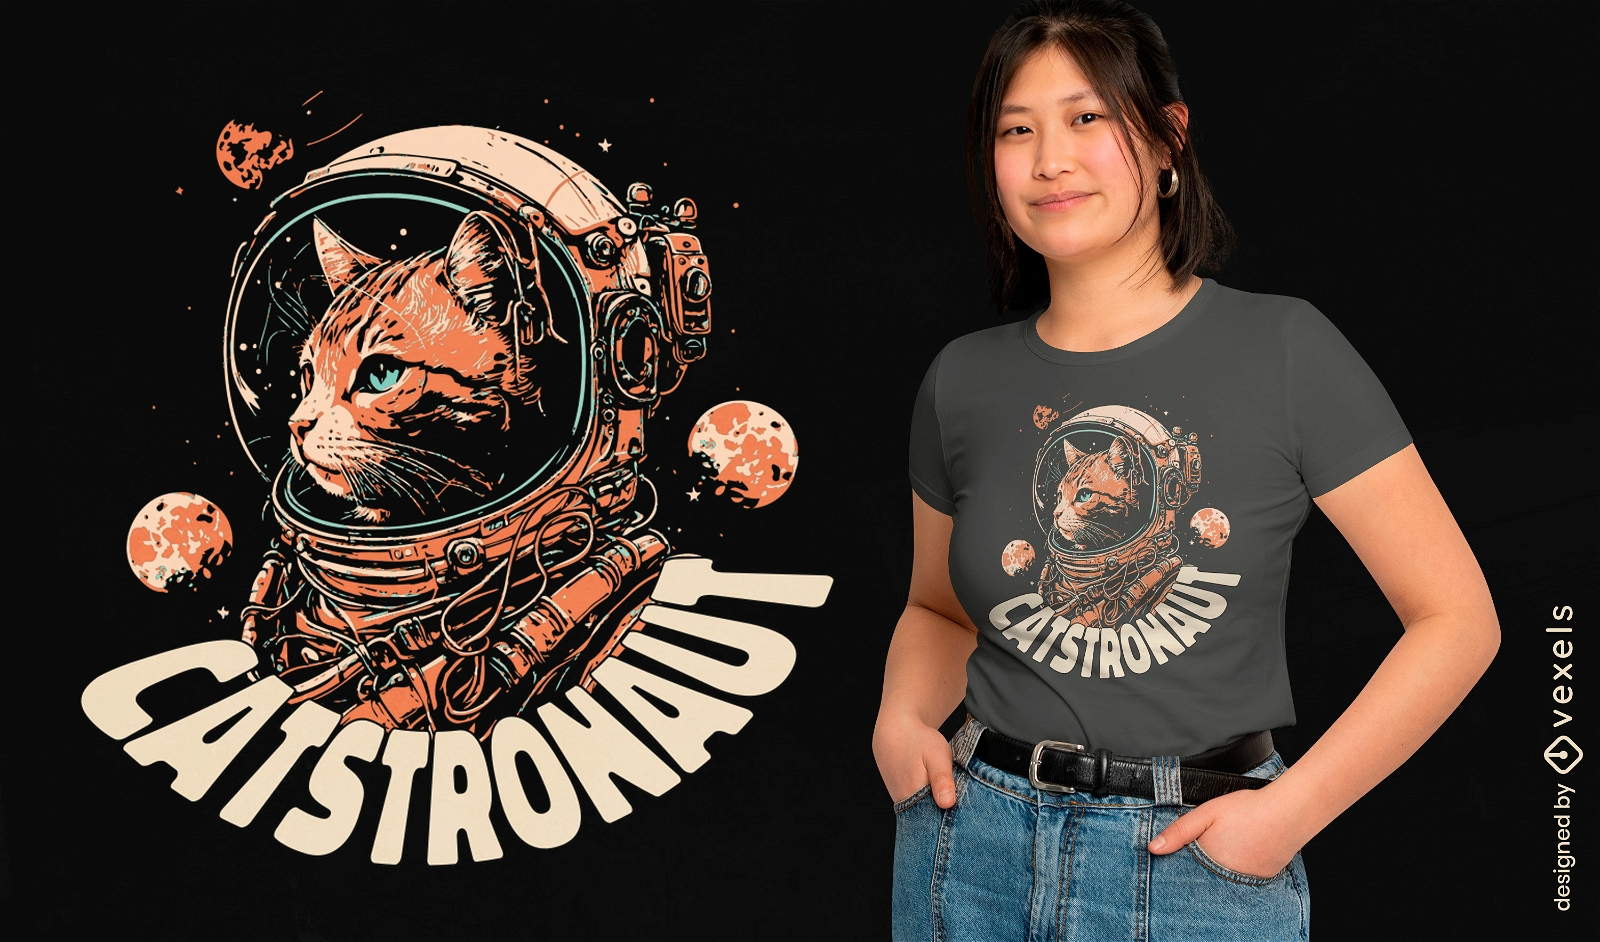
Cat animal astronaut t-shirt design
Choose a folder
All favorites
Create new
Save
Cat animal astronaut t-shirt design
Editable text
Print ready
for Merch
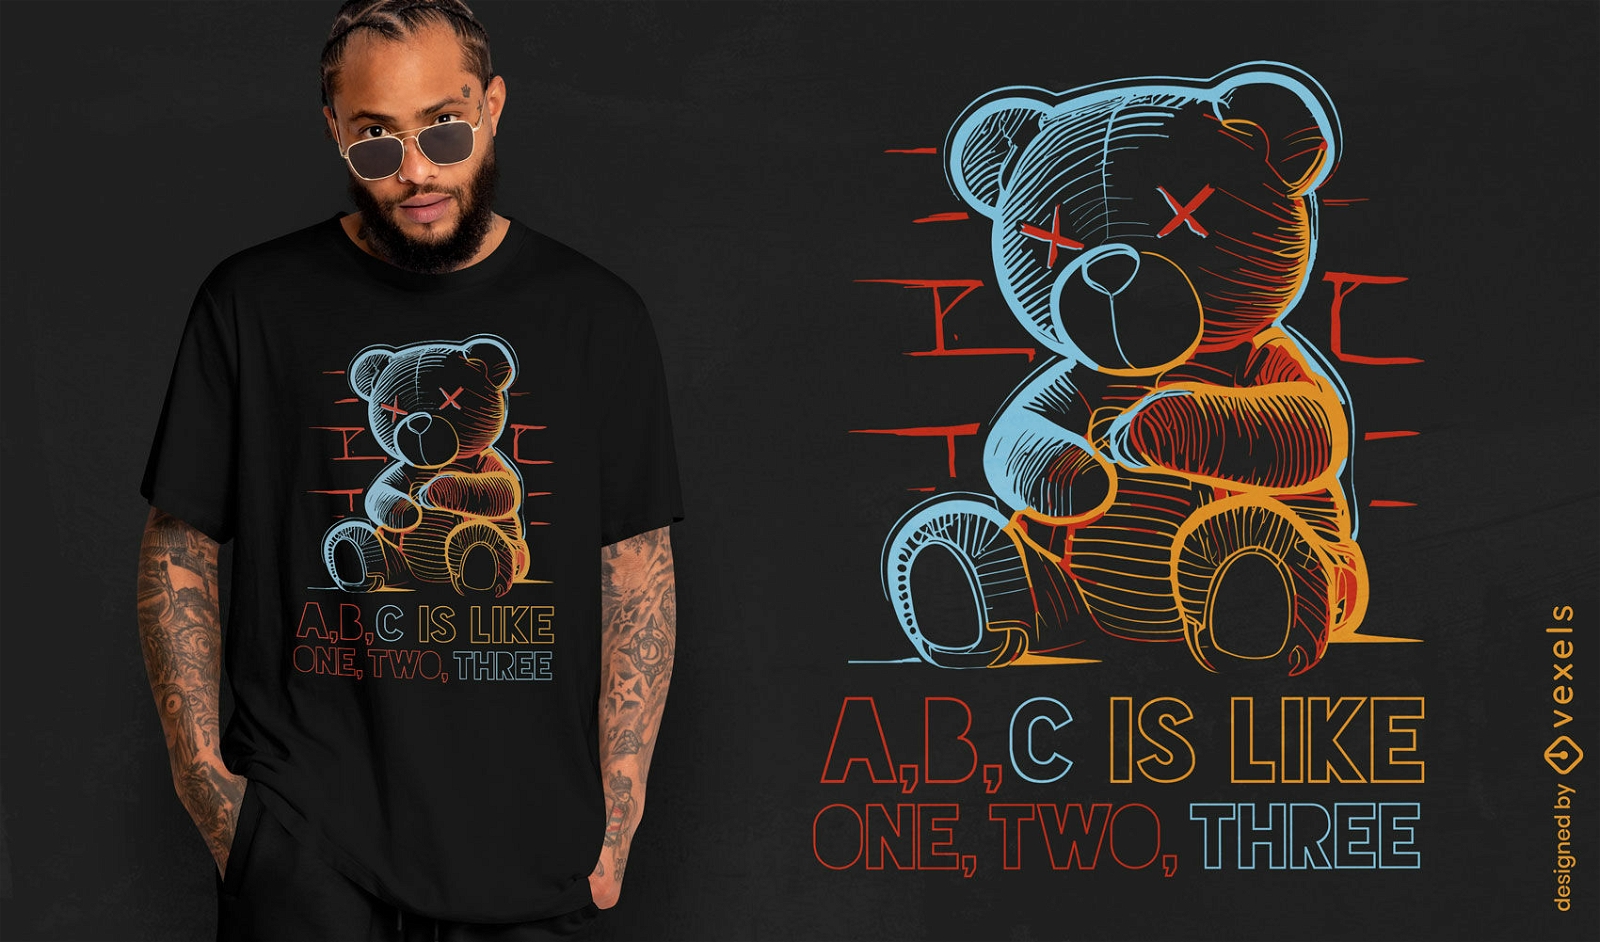
Neon teddy bear toy t-shirt design
Choose a folder
All favorites
Create new
Save
Neon teddy bear toy t-shirt design
Print ready
for Merch
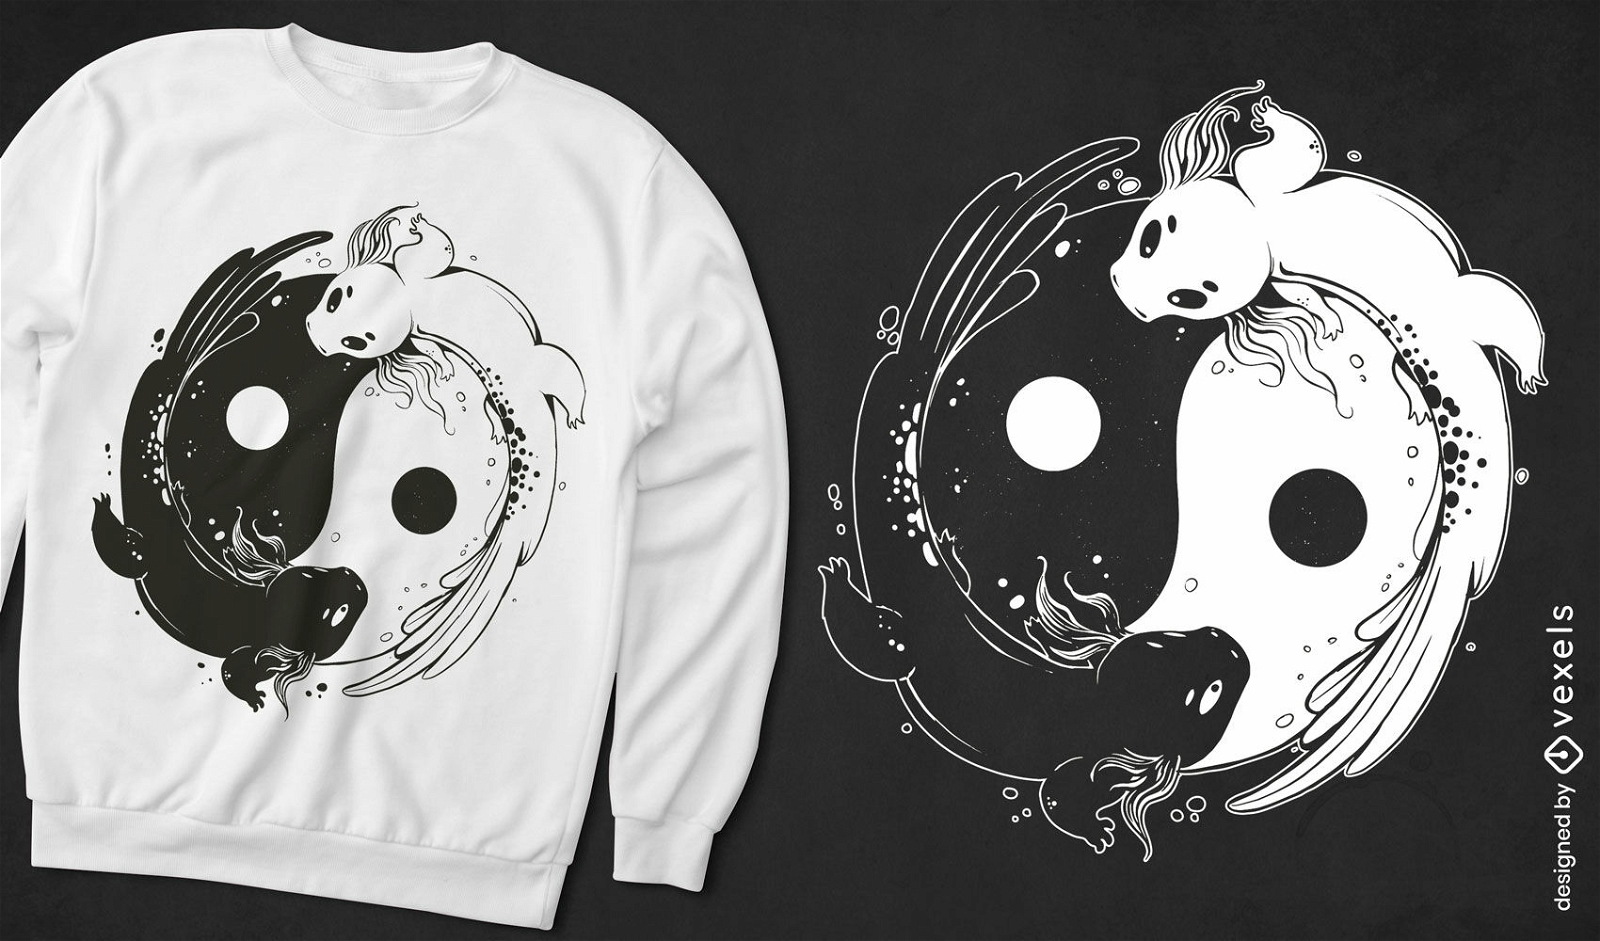
Yin yang axolotl animals t-shirt design
Choose a folder
All favorites
Create new
Save
Yin yang axolotl animals t-shirt design
Print ready
for Merch
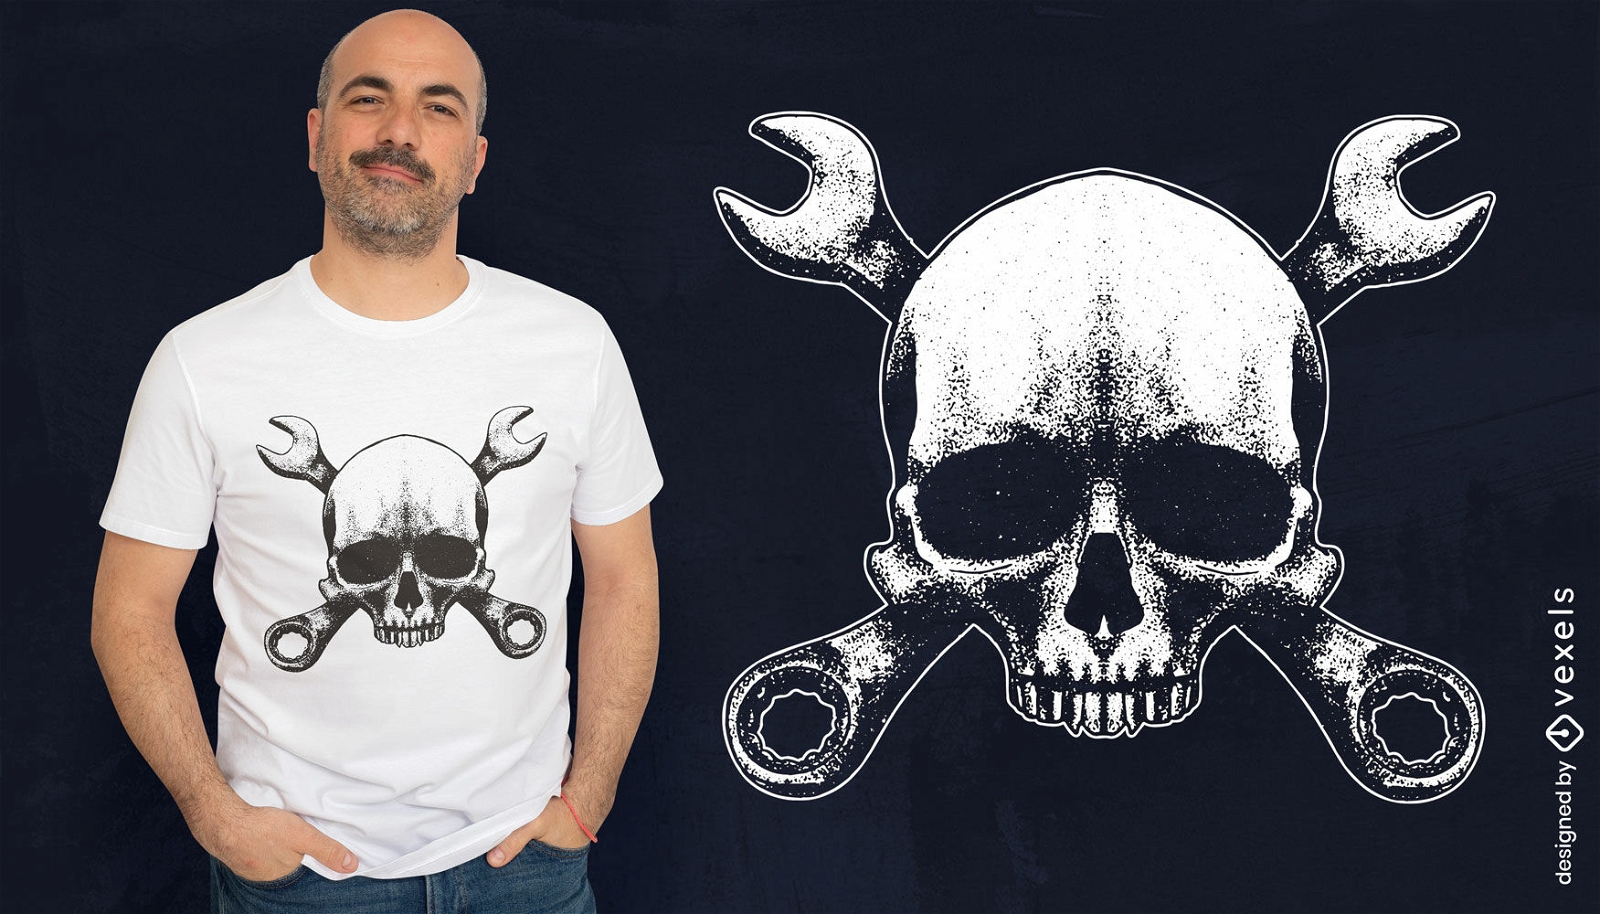
Skull and mechanic tools t-shirt design
Choose a folder
All favorites
Create new
Save
Skull and mechanic tools t-shirt design
Print ready
for Merch
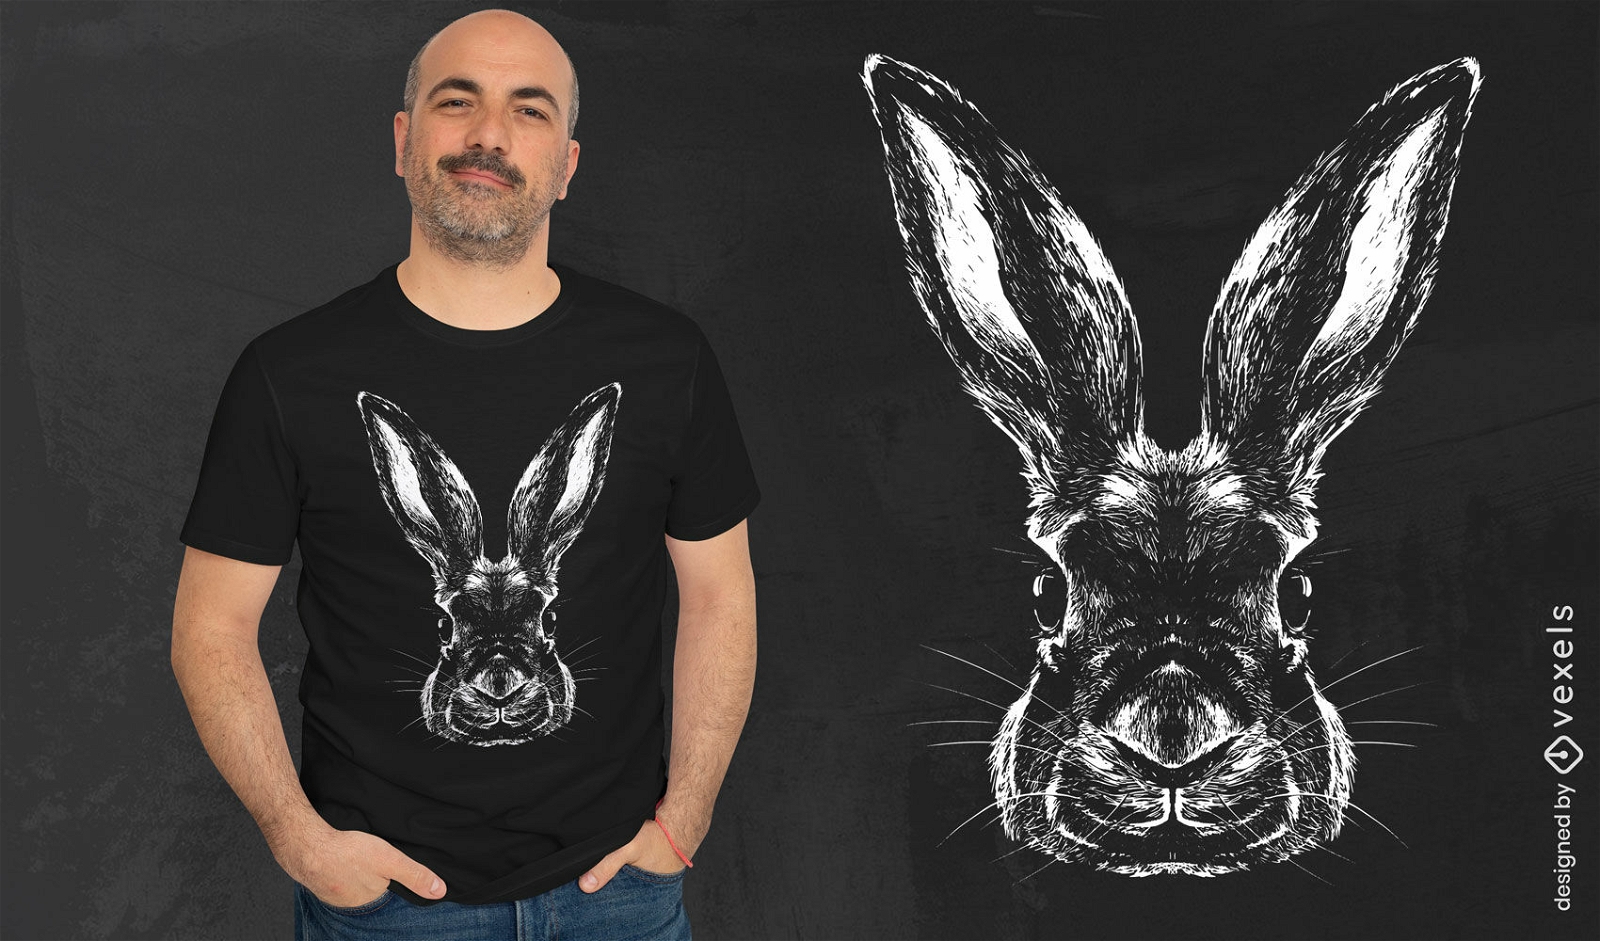
Rabbit animal head realistic t-shirt design
Choose a folder
All favorites
Create new
Save
Rabbit animal head realistic t-shirt design
Print ready
for Merch
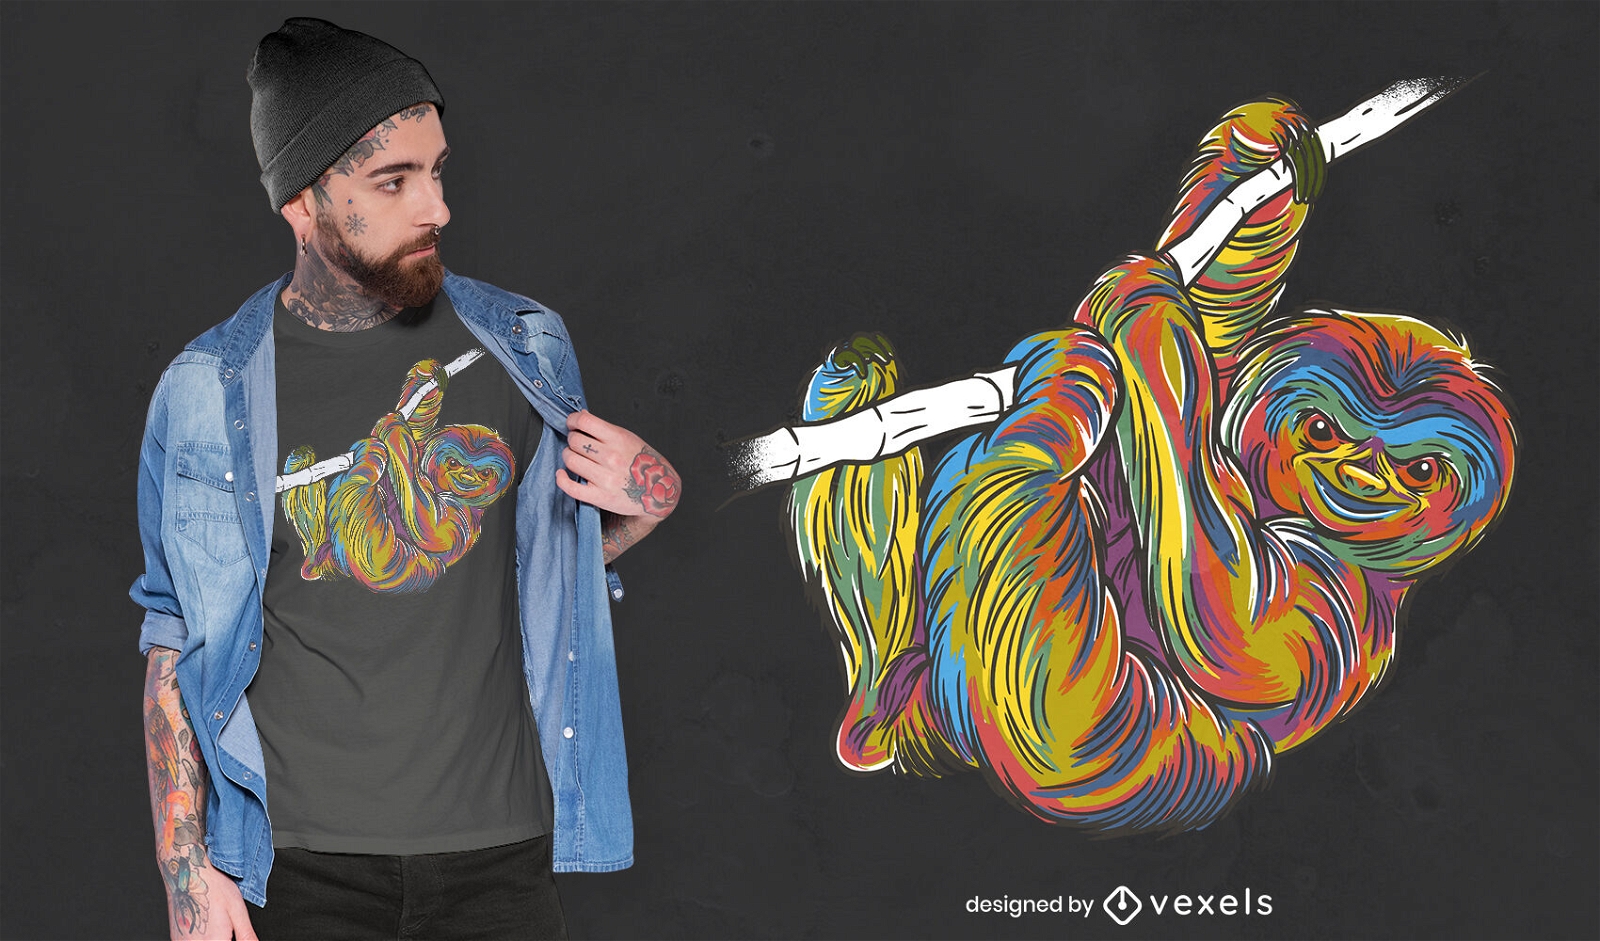
Colorful sloth animal t-shirt design
Choose a folder
All favorites
Create new
Save
Colorful sloth animal t-shirt design
Print ready
for Merch
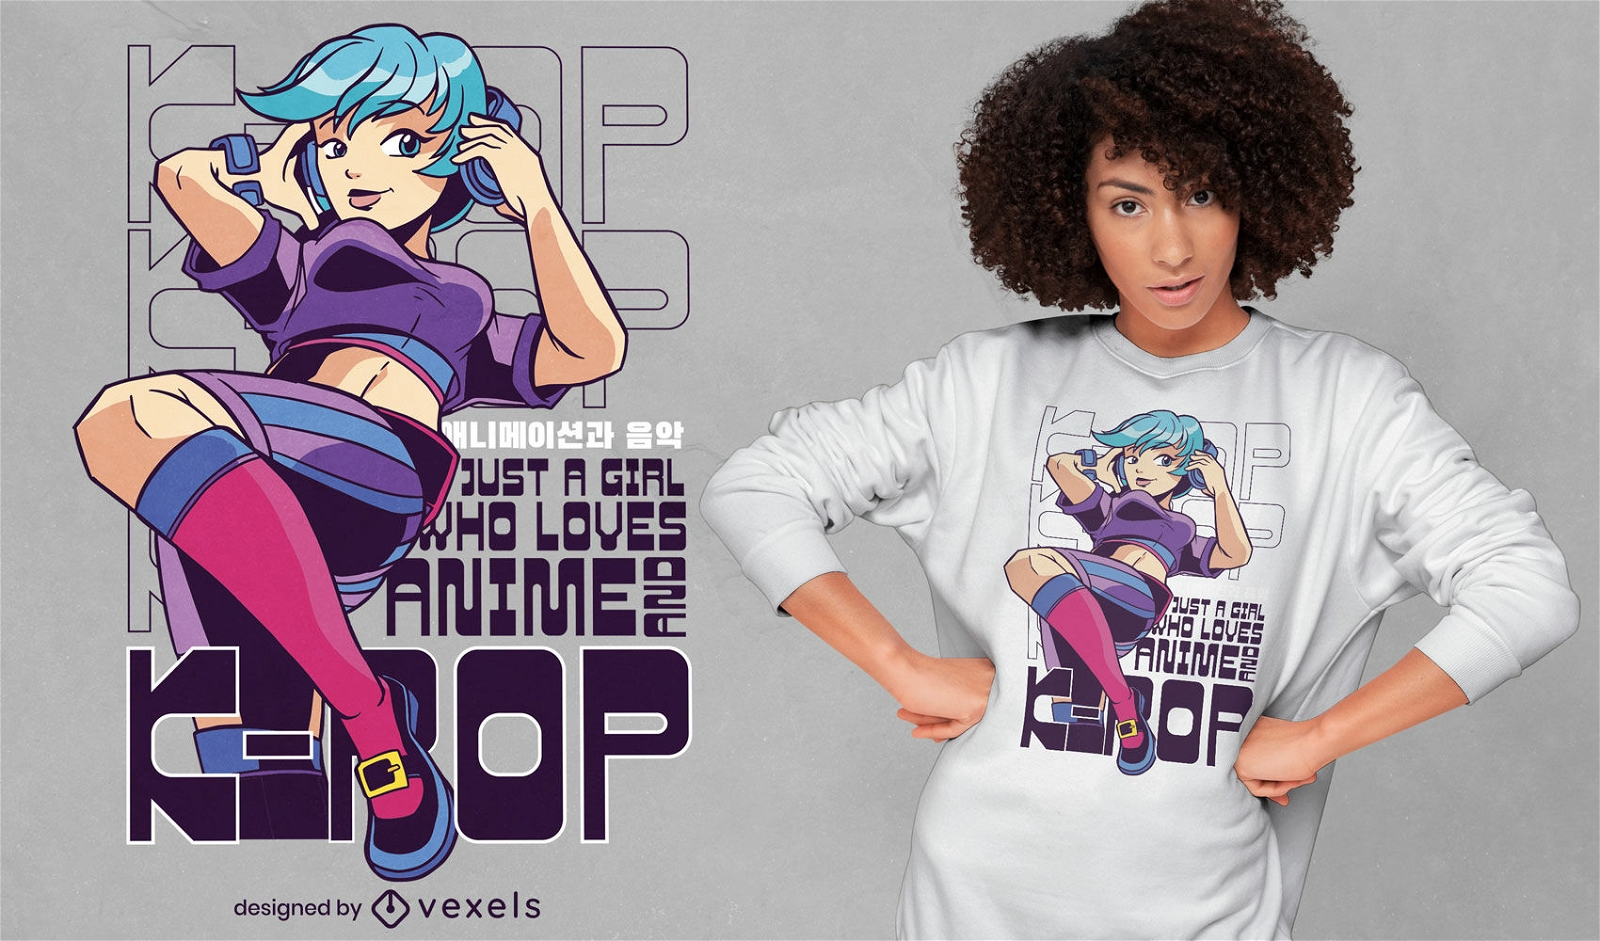
K-pop and anime girl quote t-shirt design
Choose a folder
All favorites
Create new
Save
K-pop and anime girl quote t-shirt design
Print ready
for Merch
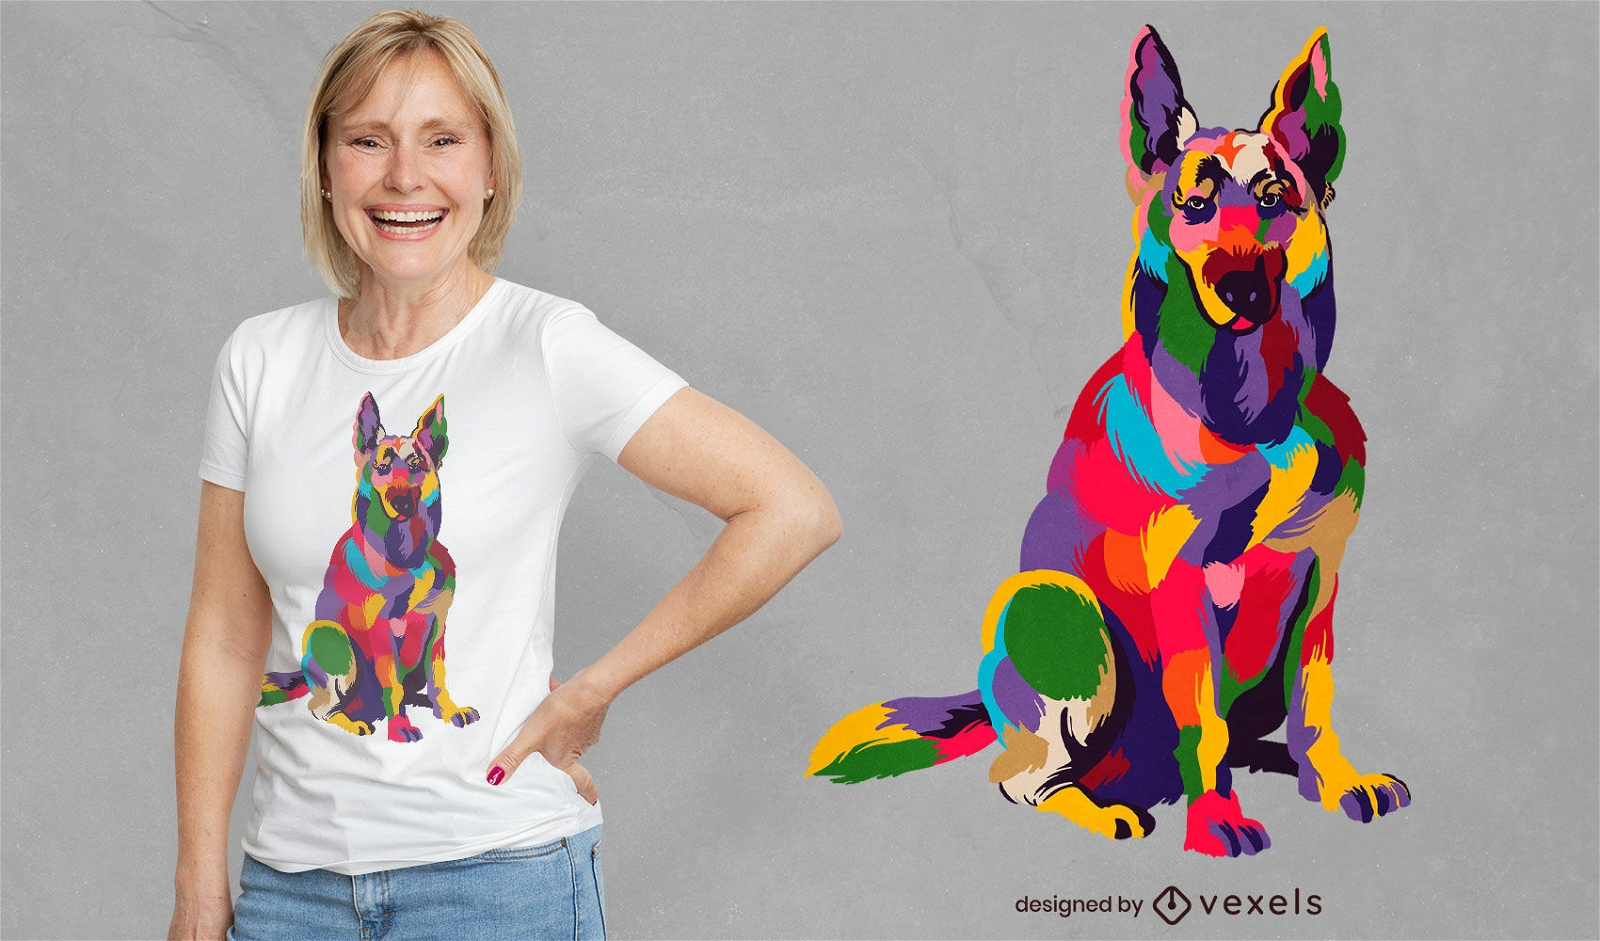
Colorful german shepherd dog t-shirt design
Choose a folder
All favorites
Create new
Save
Colorful german shepherd dog t-shirt design
Editable text
Print ready
for Merch
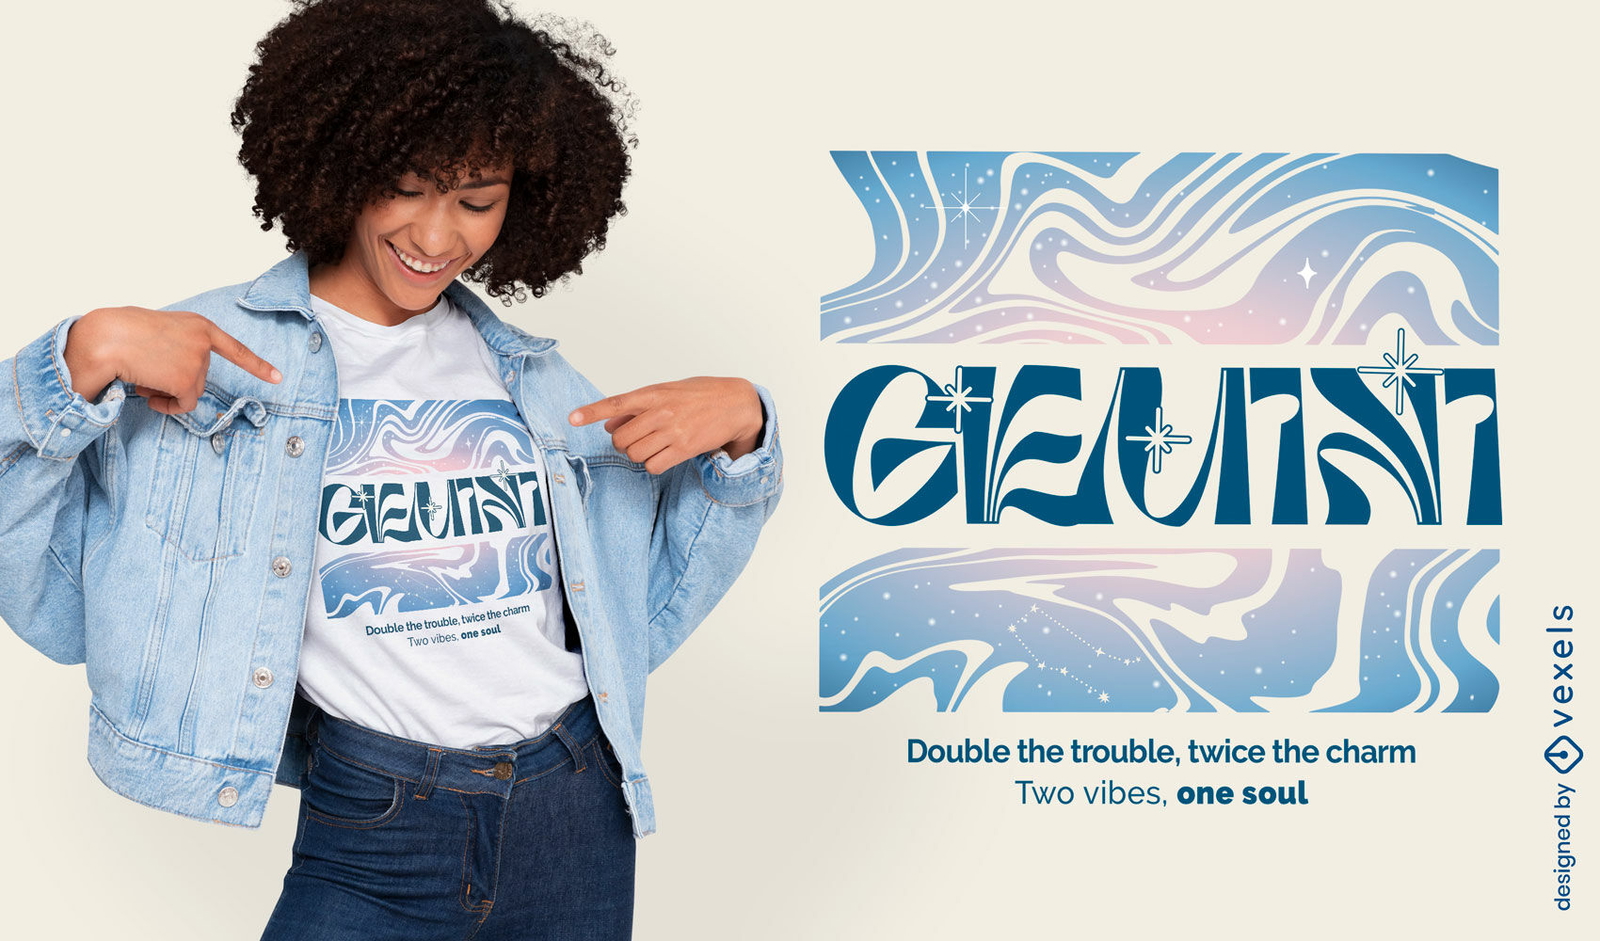
Gemini abstract t-shirt design
Choose a folder
All favorites
Create new
Save
Gemini abstract t-shirt design
Editable text
Print ready
for Merch
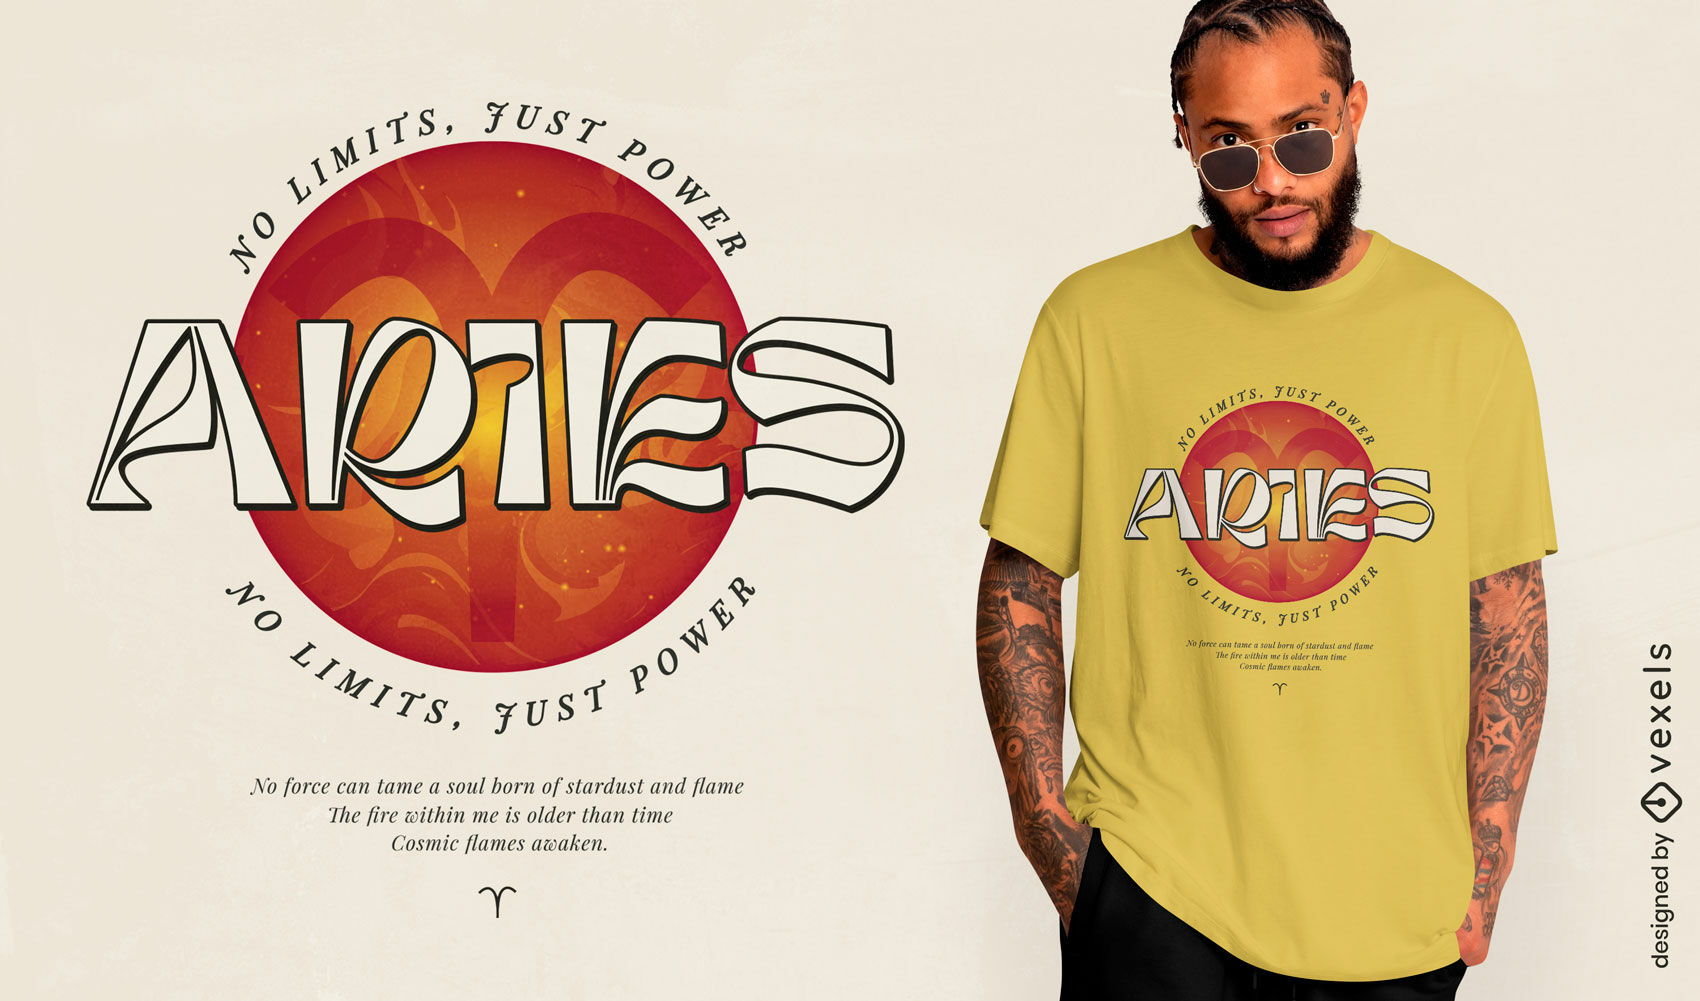
Aries no limits just power t-shirt design
Choose a folder
All favorites
Create new
Save
Aries no limits just power t-shirt design
Premium
Cute smiling toaster graphic design for kitchen decor PNG Design
Choose a folder
All favorites
Create new
Save
Cute smiling toaster graphic design for kitchen decor PNG Design
Premium
Playful spray can character illustration PNG Design
Choose a folder
All favorites
Create new
Save
Playful spray can character illustration PNG Design
Premium
Cheerful smiling basketball graphic design for apparel PNG Design
Choose a folder
All favorites
Create new
Save
Cheerful smiling basketball graphic design for apparel PNG Design
Premium
Playful cartoon frog graphic design PNG Design
Choose a folder
All favorites
Create new
Save
Playful cartoon frog graphic design PNG Design
Premium
Playful cleaning graphic design PNG Design
Choose a folder
All favorites
Create new
Save
Playful cleaning graphic design PNG Design
Premium
Minimalist cleaning service graphic design PNG Design
Choose a folder
All favorites
Create new
Save
Minimalist cleaning service graphic design PNG Design
Premium
Stylized splash of water graphic design for apparel PNG Design
Choose a folder
All favorites
Create new
Save
Stylized splash of water graphic design for apparel PNG Design
Premium
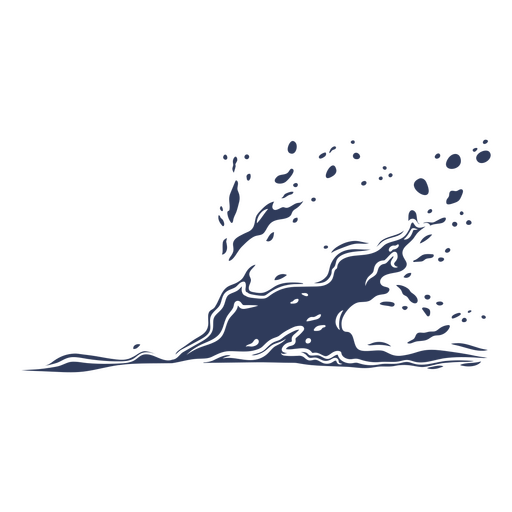
Dynamic blue ocean wave graphic design PNG Design
Choose a folder
All favorites
Create new
Save
Dynamic blue ocean wave graphic design PNG Design
Premium
Minimalist magazine illustration with vibrant background PNG Design
Choose a folder
All favorites
Create new
Save
Minimalist magazine illustration with vibrant background PNG Design
Premium
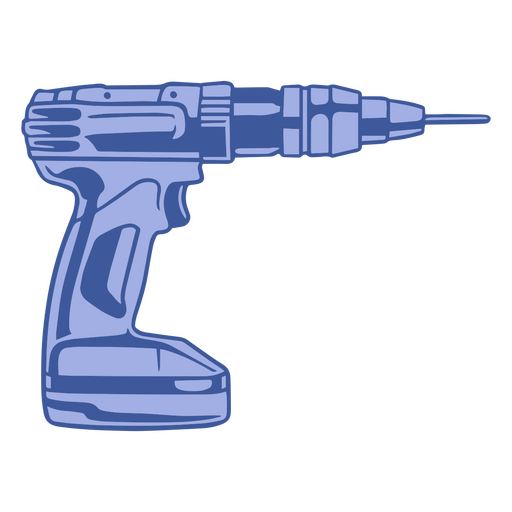
Stylish drill graphic design for diy enthusiasts PNG Design
Choose a folder
All favorites
Create new
Save
Stylish drill graphic design for diy enthusiasts PNG Design
Premium
Stylish music control panel graphic design PNG Design
Choose a folder
All favorites
Create new
Save
Stylish music control panel graphic design PNG Design
Premium
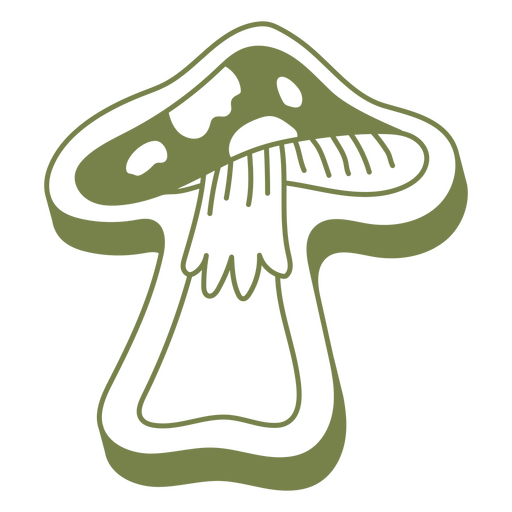
Stylized green mushroom graphic design for apparel PNG Design
Choose a folder
All favorites
Create new
Save
Stylized green mushroom graphic design for apparel PNG Design
Print ready
for Merch
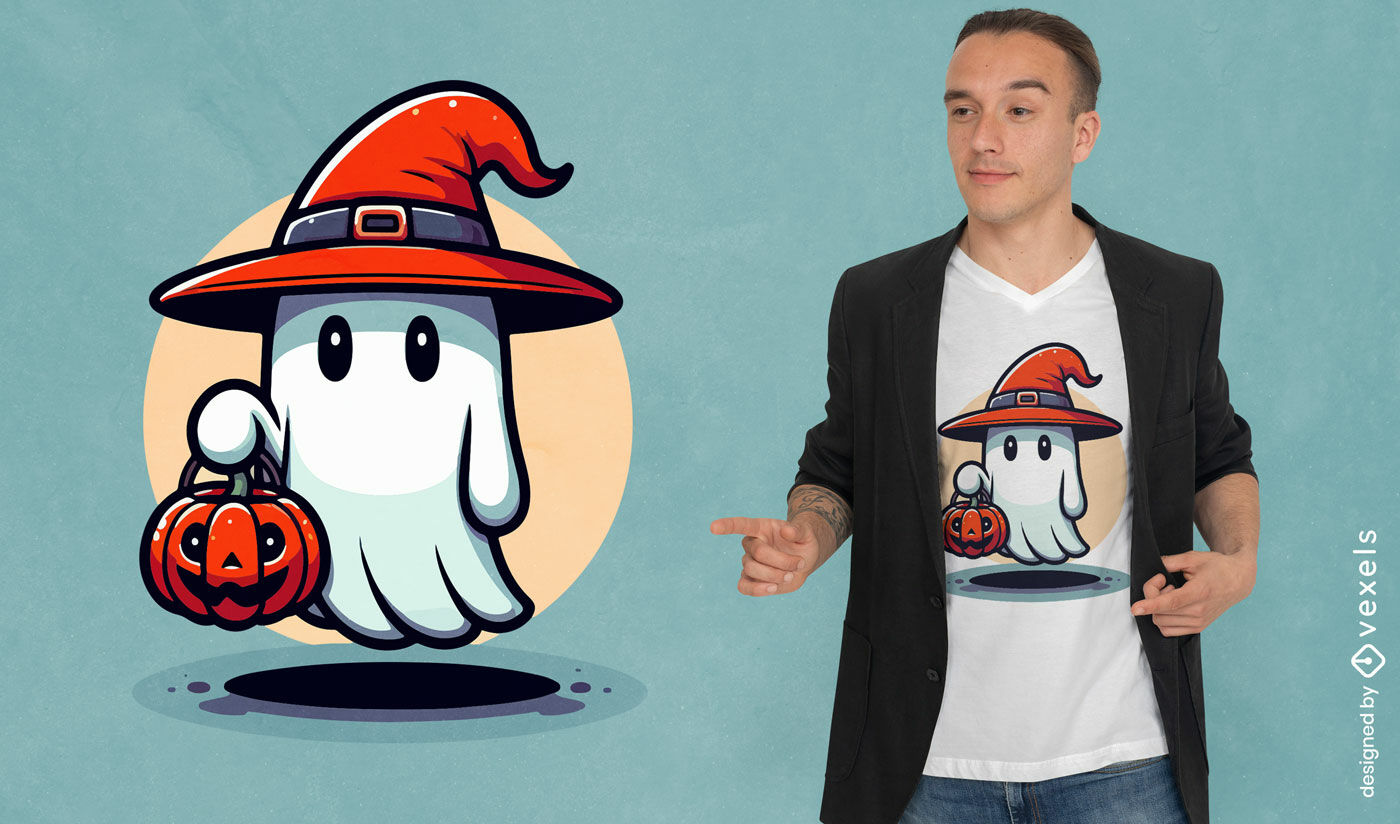
Halloween ghost with red had t-shirt design
Choose a folder
All favorites
Create new
Save
Halloween ghost with red had t-shirt design
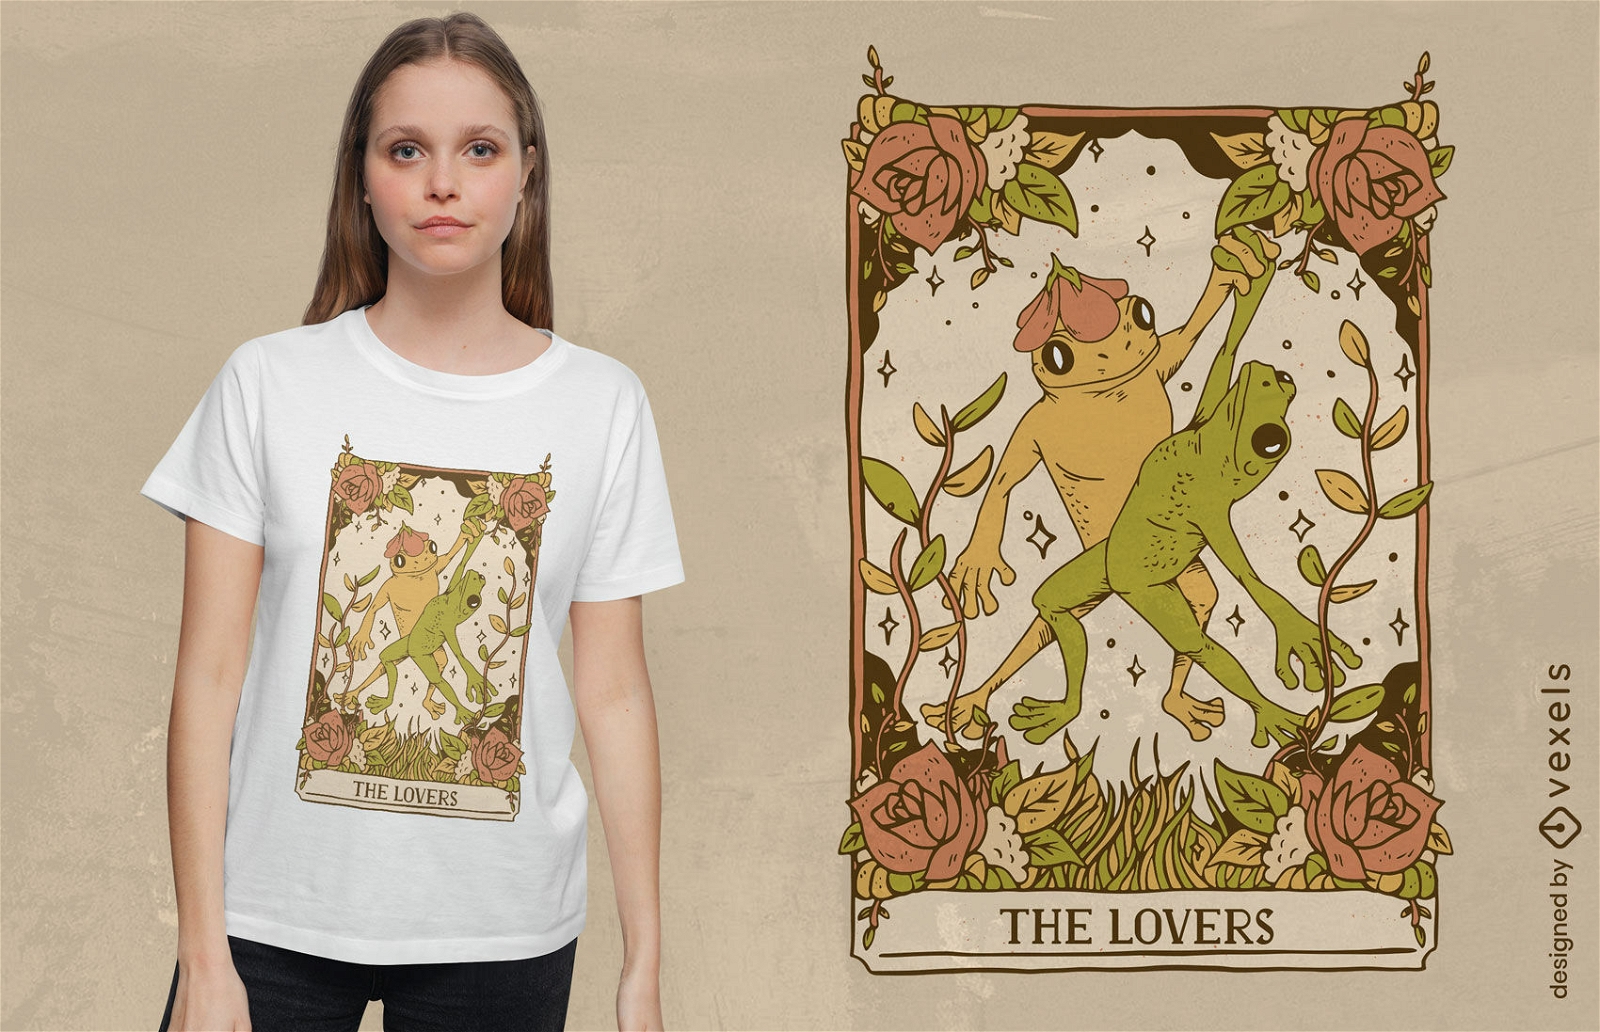
Editable text
Print ready
for Merch
Frog lovers tarot t-shirt design
Choose a folder
All favorites
Create new
Save
Frog lovers tarot t-shirt design
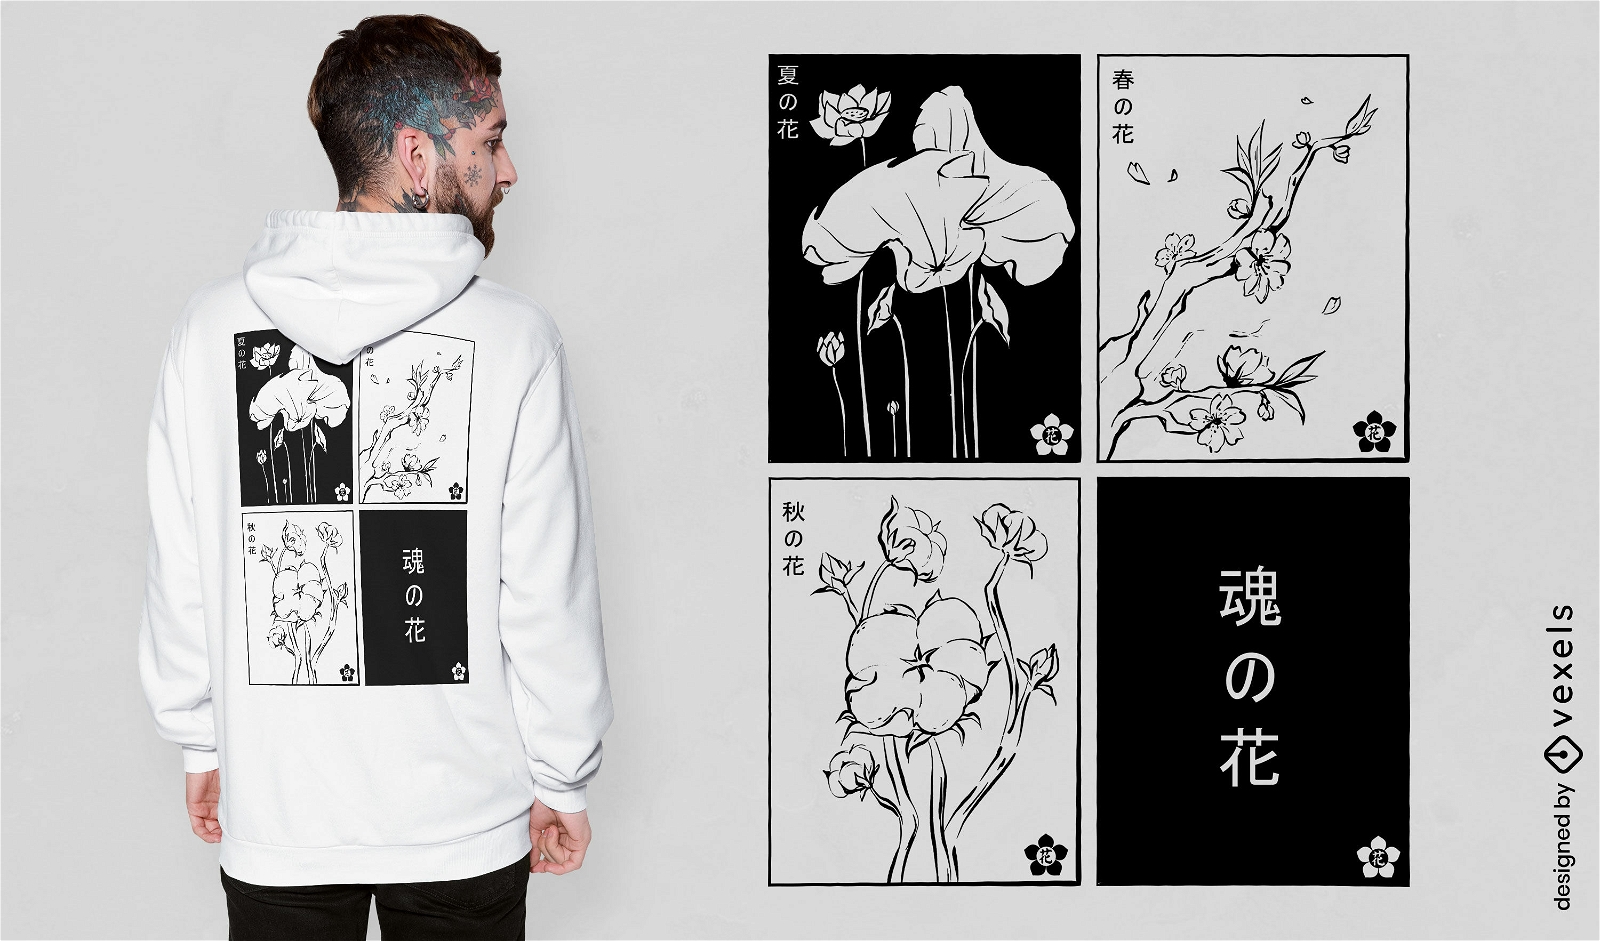
Print ready
for Merch
Japanese floral cards t-shirt design
Choose a folder
All favorites
Create new
Save
Japanese floral cards t-shirt design
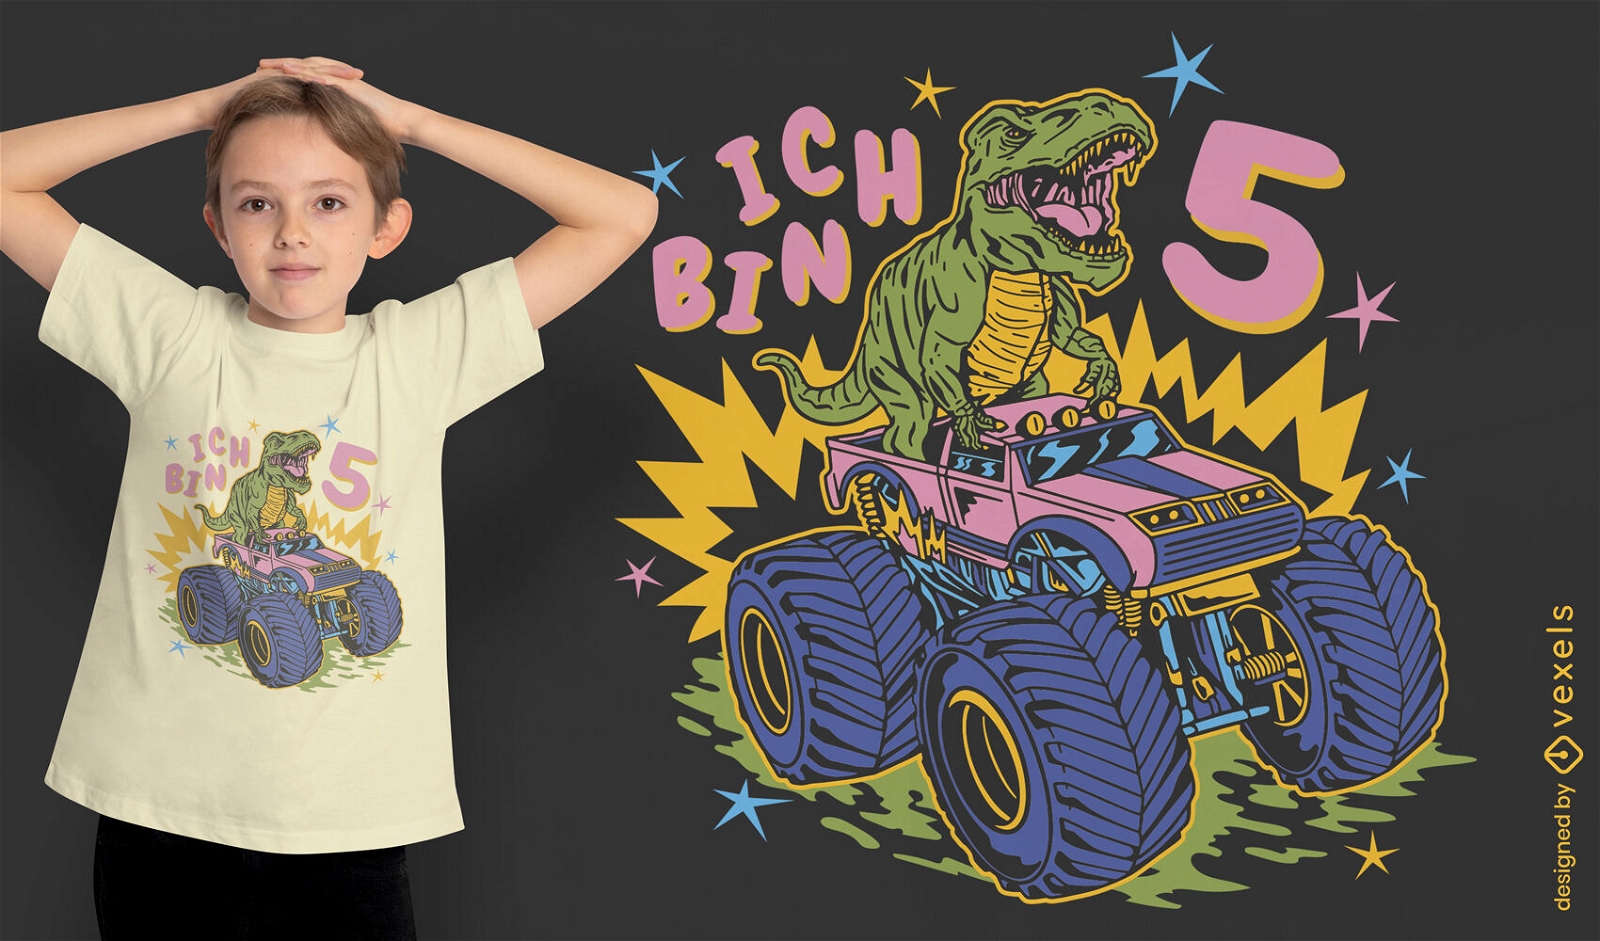
German Content
Print ready
for Merch
T-rex monster truck birthday quote t-shirt design
Choose a folder
All favorites
Create new
Save
T-rex monster truck birthday quote t-shirt design
Editable text
Print ready
for Merch
White horse with flowers t-shirt design
Choose a folder
All favorites
Create new
Save
White horse with flowers t-shirt design
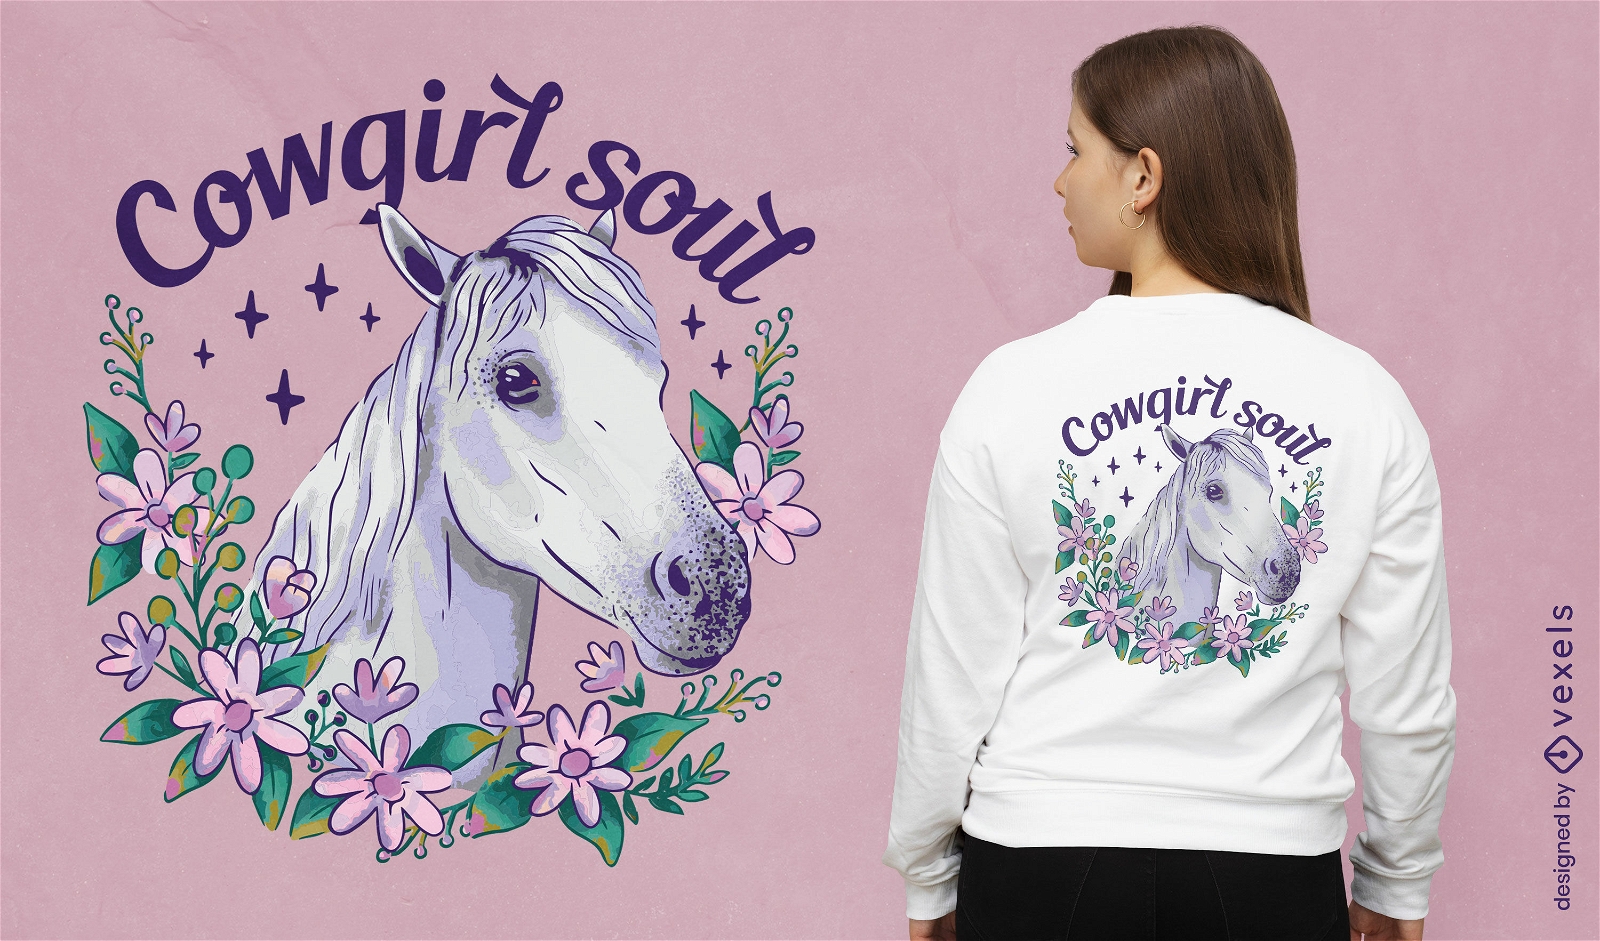
Print ready
for Merch
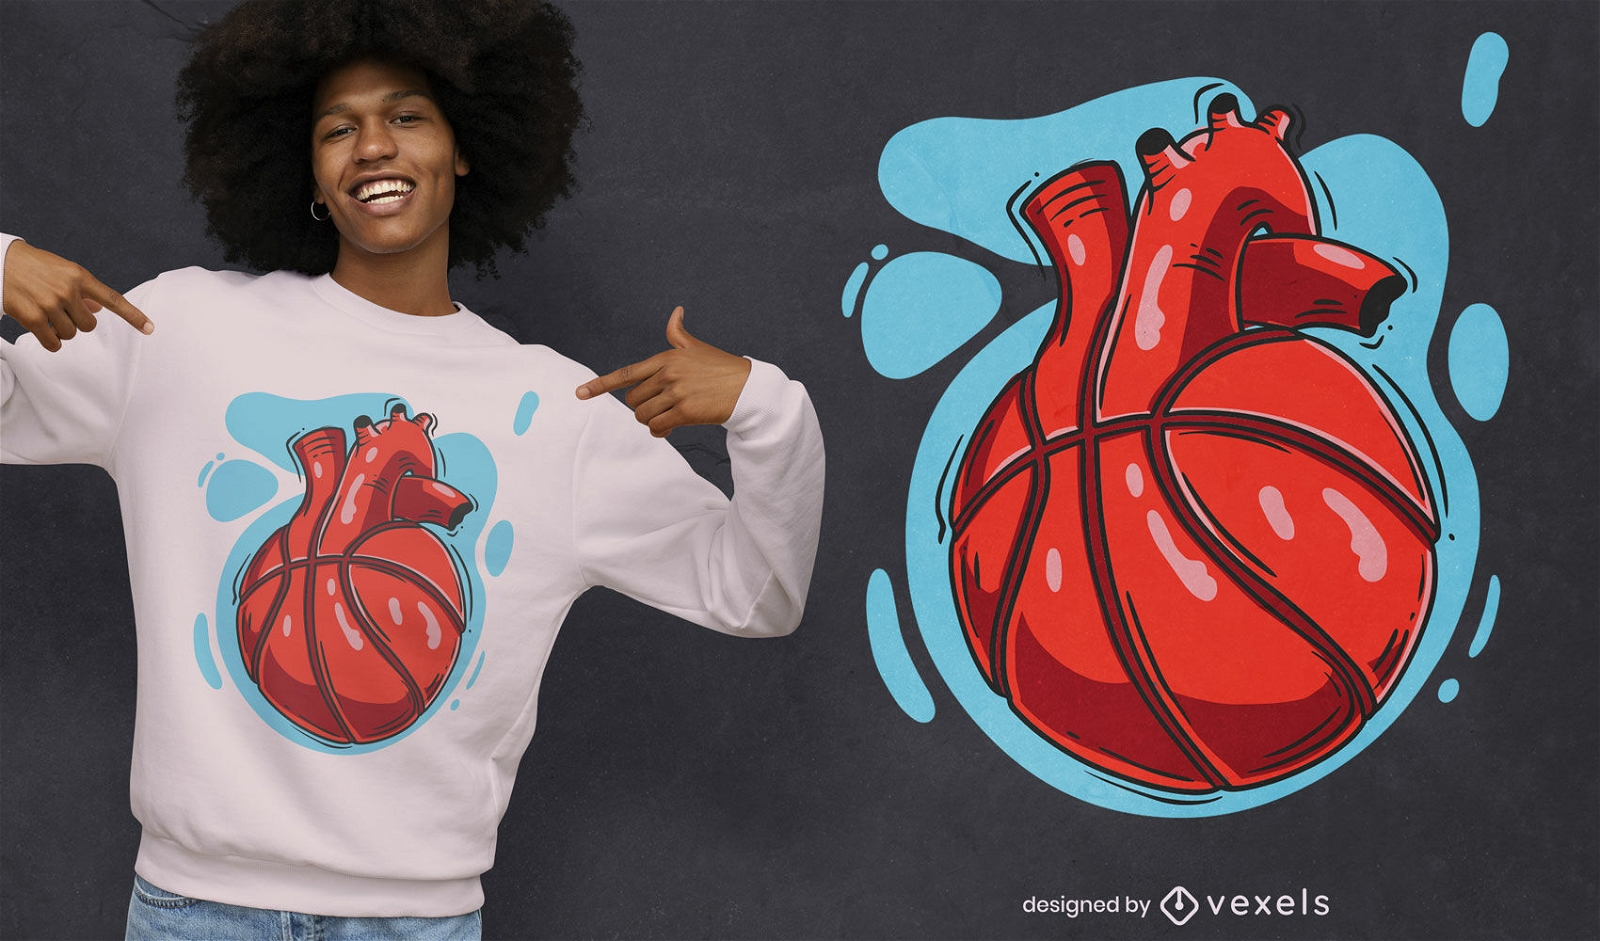
Heart shaped basketball t-shirt design
Choose a folder
All favorites
Create new
Save
Heart shaped basketball t-shirt design
Editable text
Print ready
for Merch
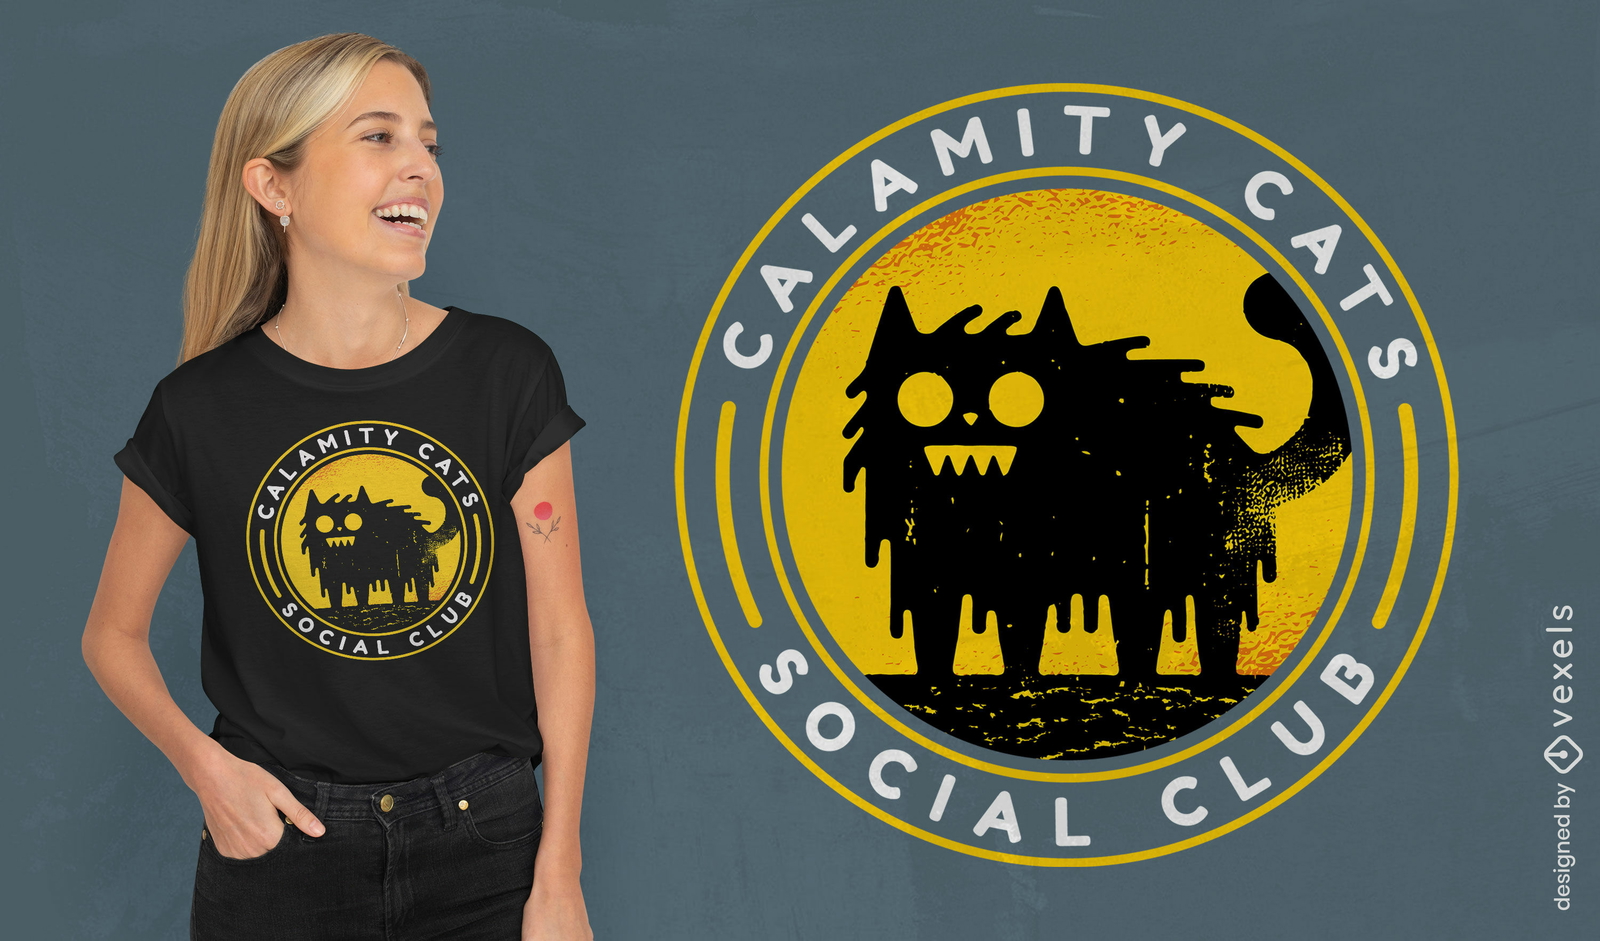
Calamity Cats social club t-shirt design
Choose a folder
All favorites
Create new
Save
Calamity Cats social club t-shirt design
Print ready
for Merch
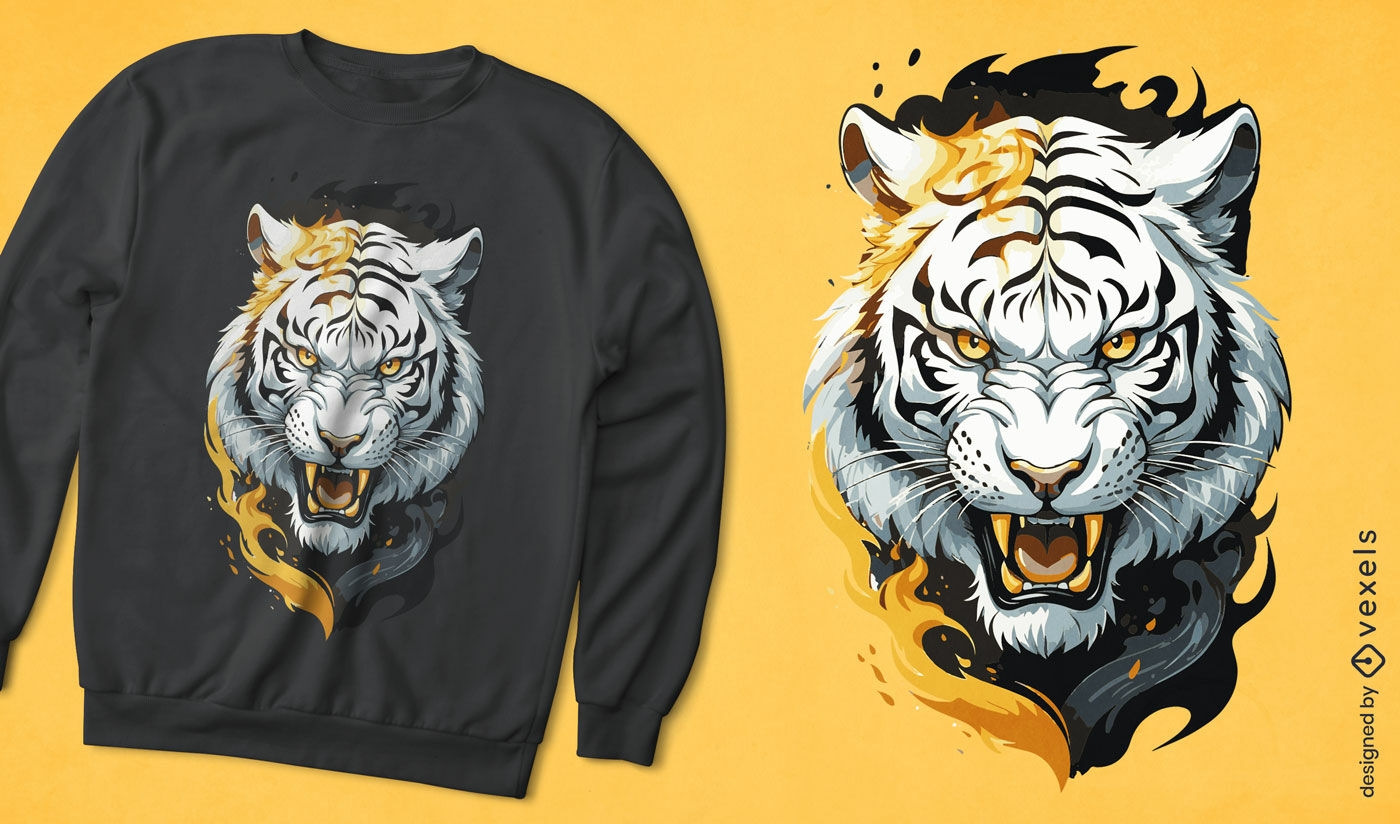
Fiery tiger t-shirt design
Choose a folder
All favorites
Create new
Save
Fiery tiger t-shirt design
Editable text
Print ready
for Merch
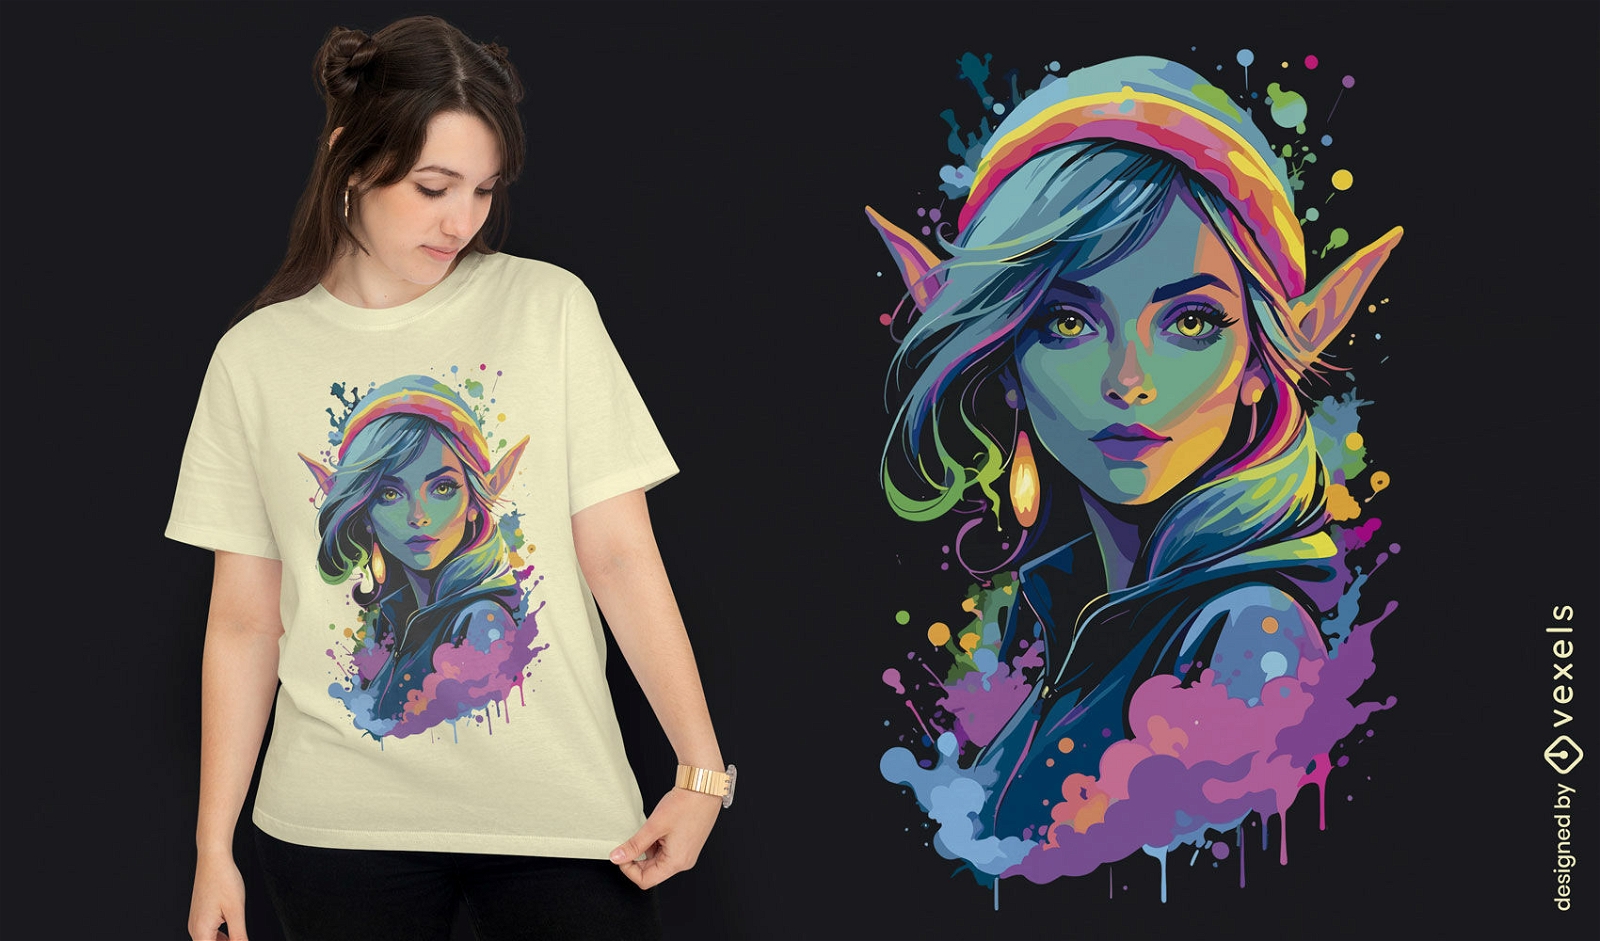
Neon elf woman t-shirt design
Choose a folder
All favorites
Create new
Save
Neon elf woman t-shirt design
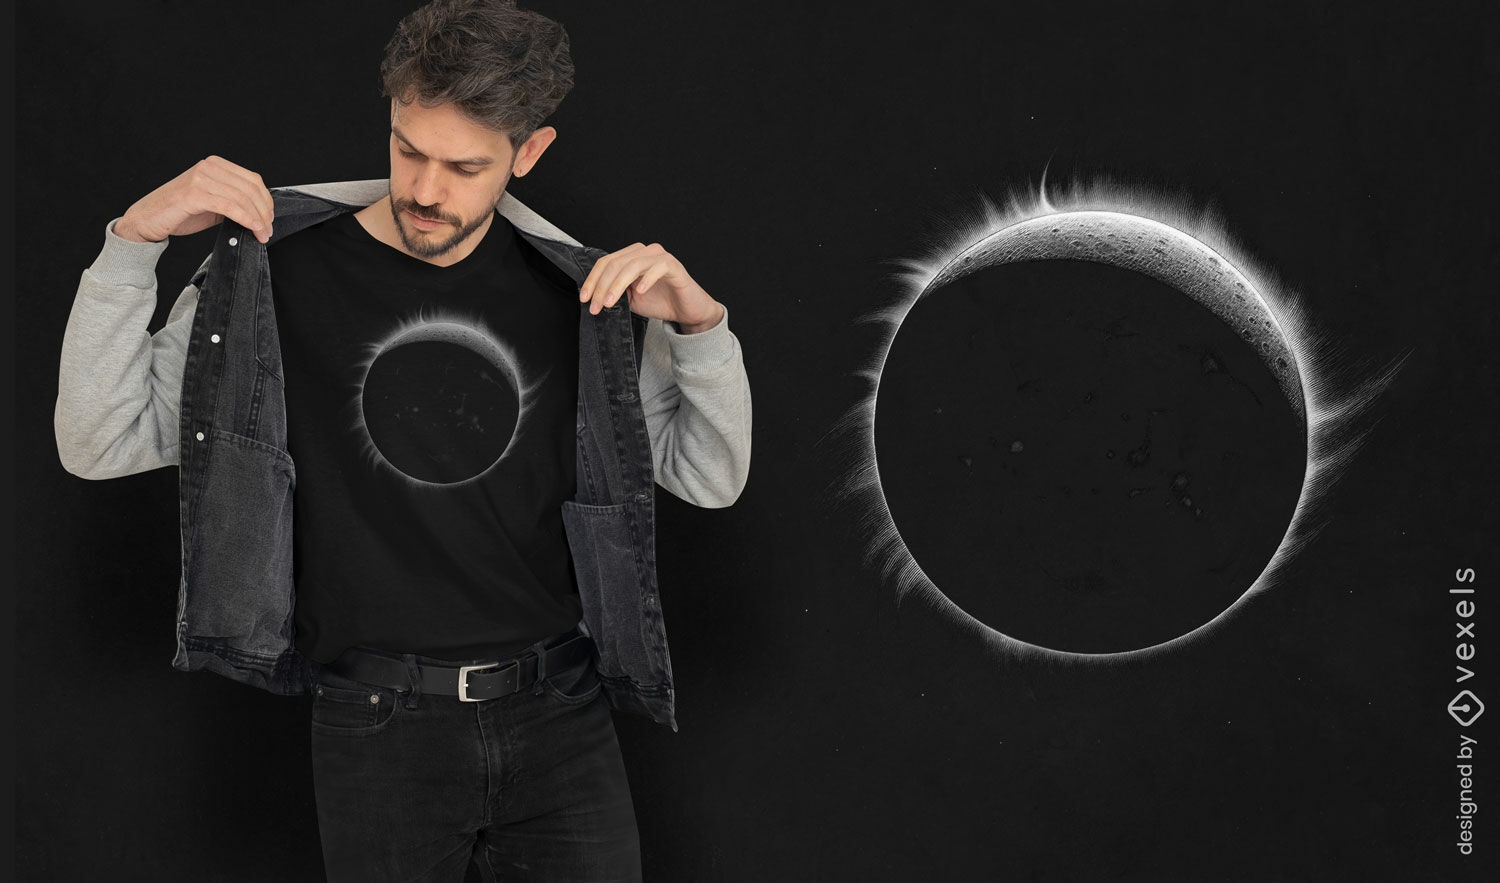
Print ready
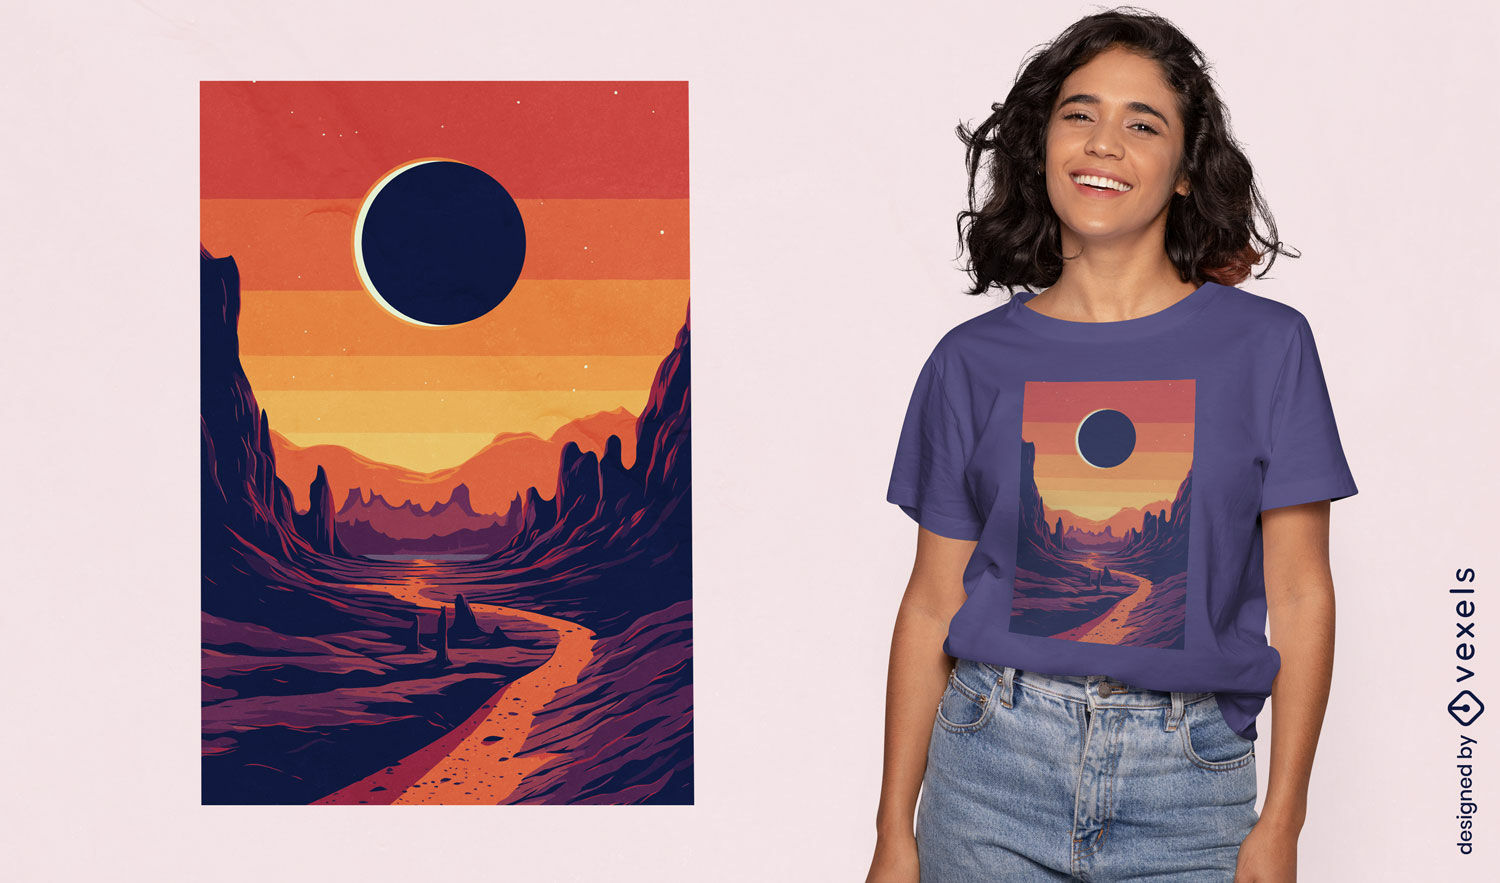
for Merch
Sunset eclipse t-shirt design
Choose a folder
All favorites
Create new
Save
Sunset eclipse t-shirt design
Print ready
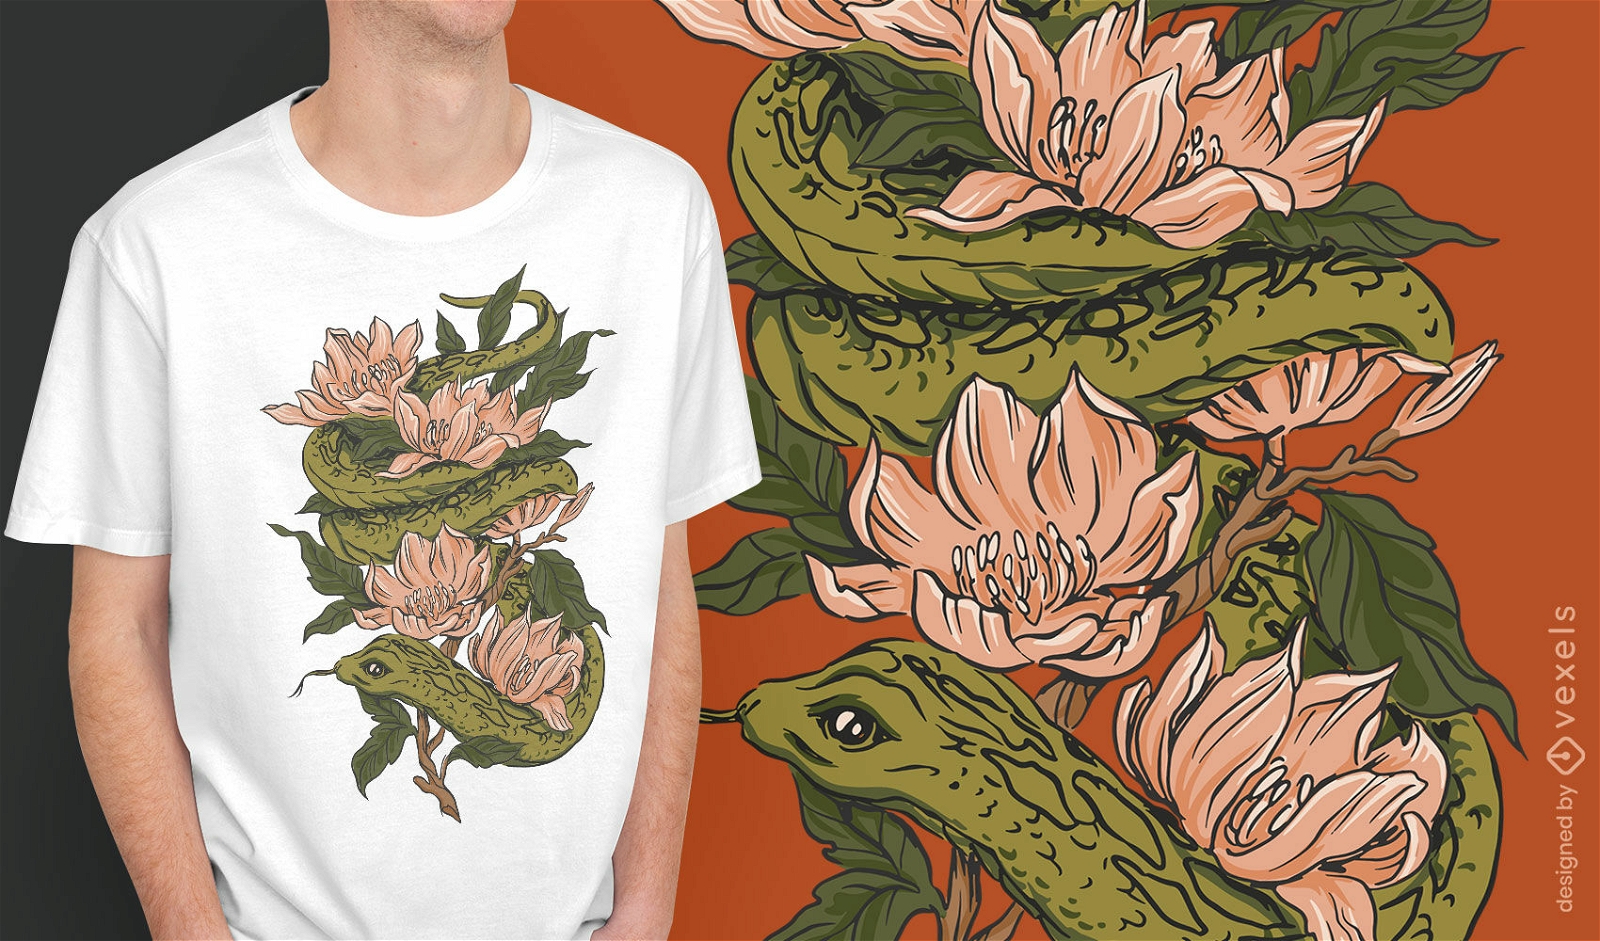
for Merch
Magnolia snake nature t-shirt design
Choose a folder
All favorites
Create new
Save
Magnolia snake nature t-shirt design
Print ready
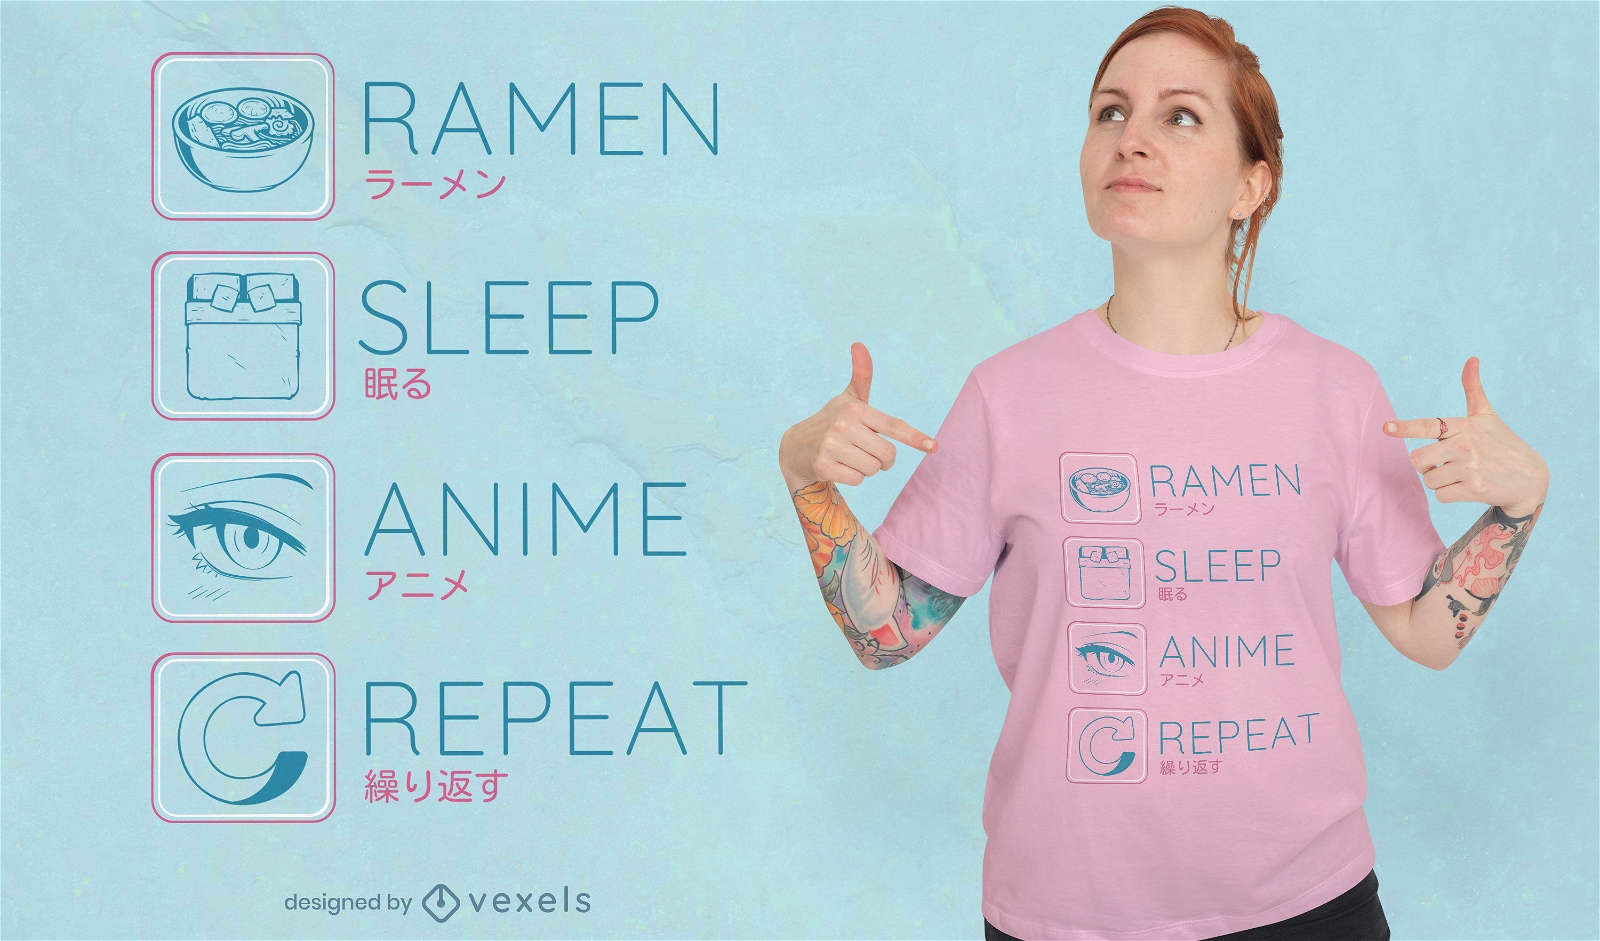
for Merch
Ramen anime routine t-shirt design
Choose a folder
All favorites
Create new
Save
Ramen anime routine t-shirt design
Print ready
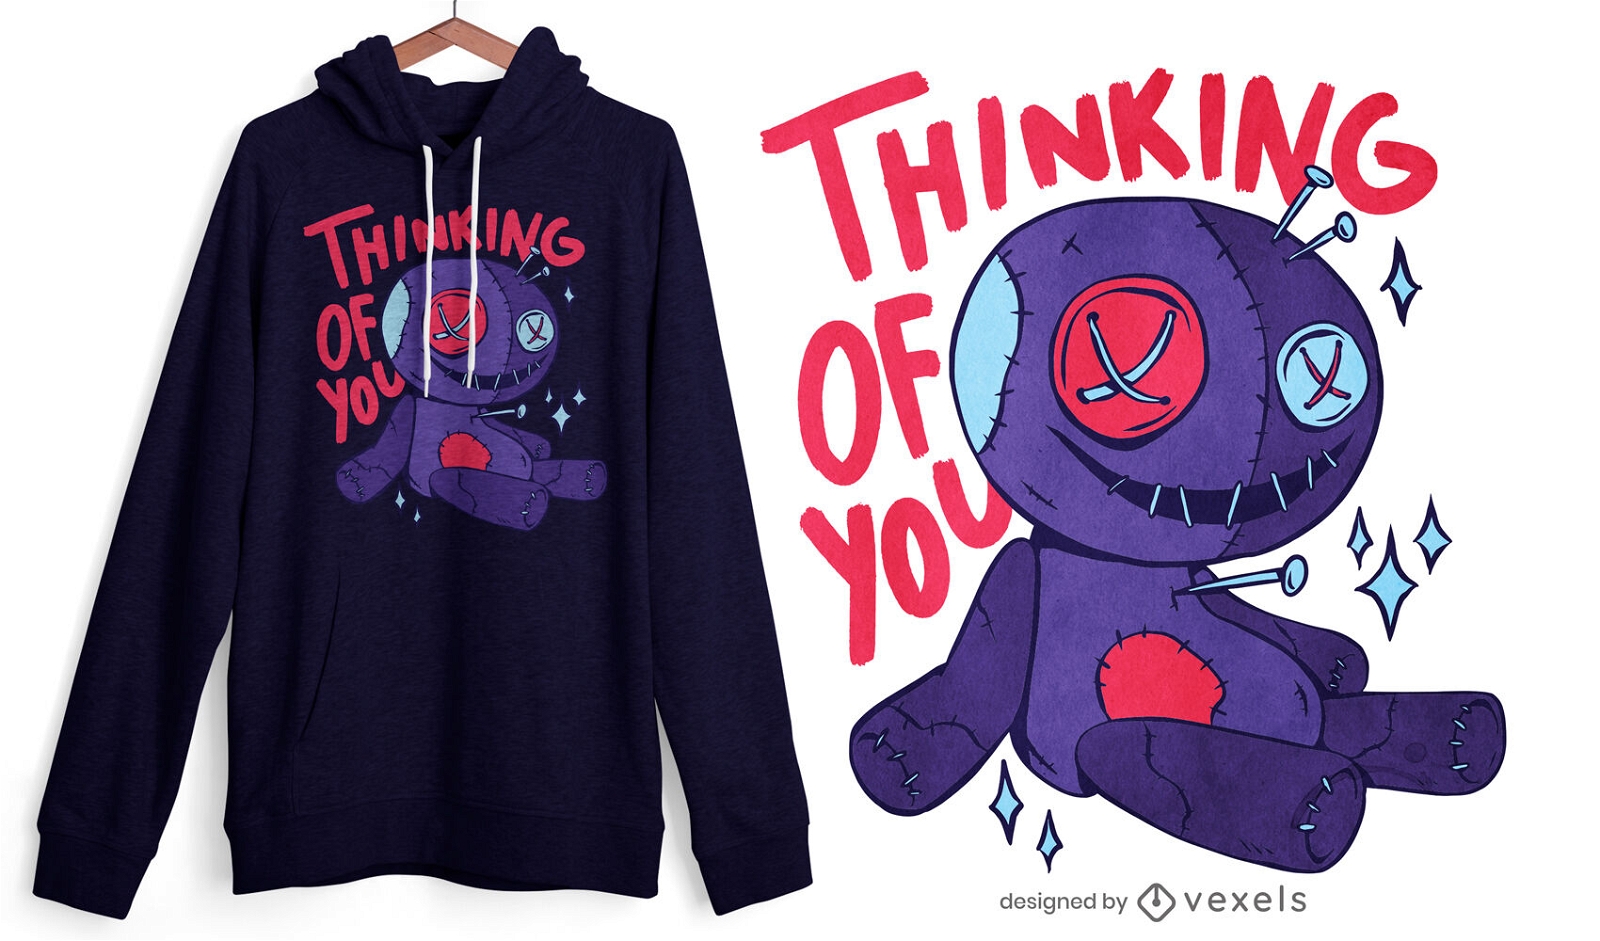
for Merch
Funny voodoo doll quote t-shirt design
Choose a folder
All favorites
Create new
Save
Funny voodoo doll quote t-shirt design
Print ready
for Merch
Solar eclipse t-shirt design
Choose a folder
All favorites
Create new
Save
Solar eclipse t-shirt design
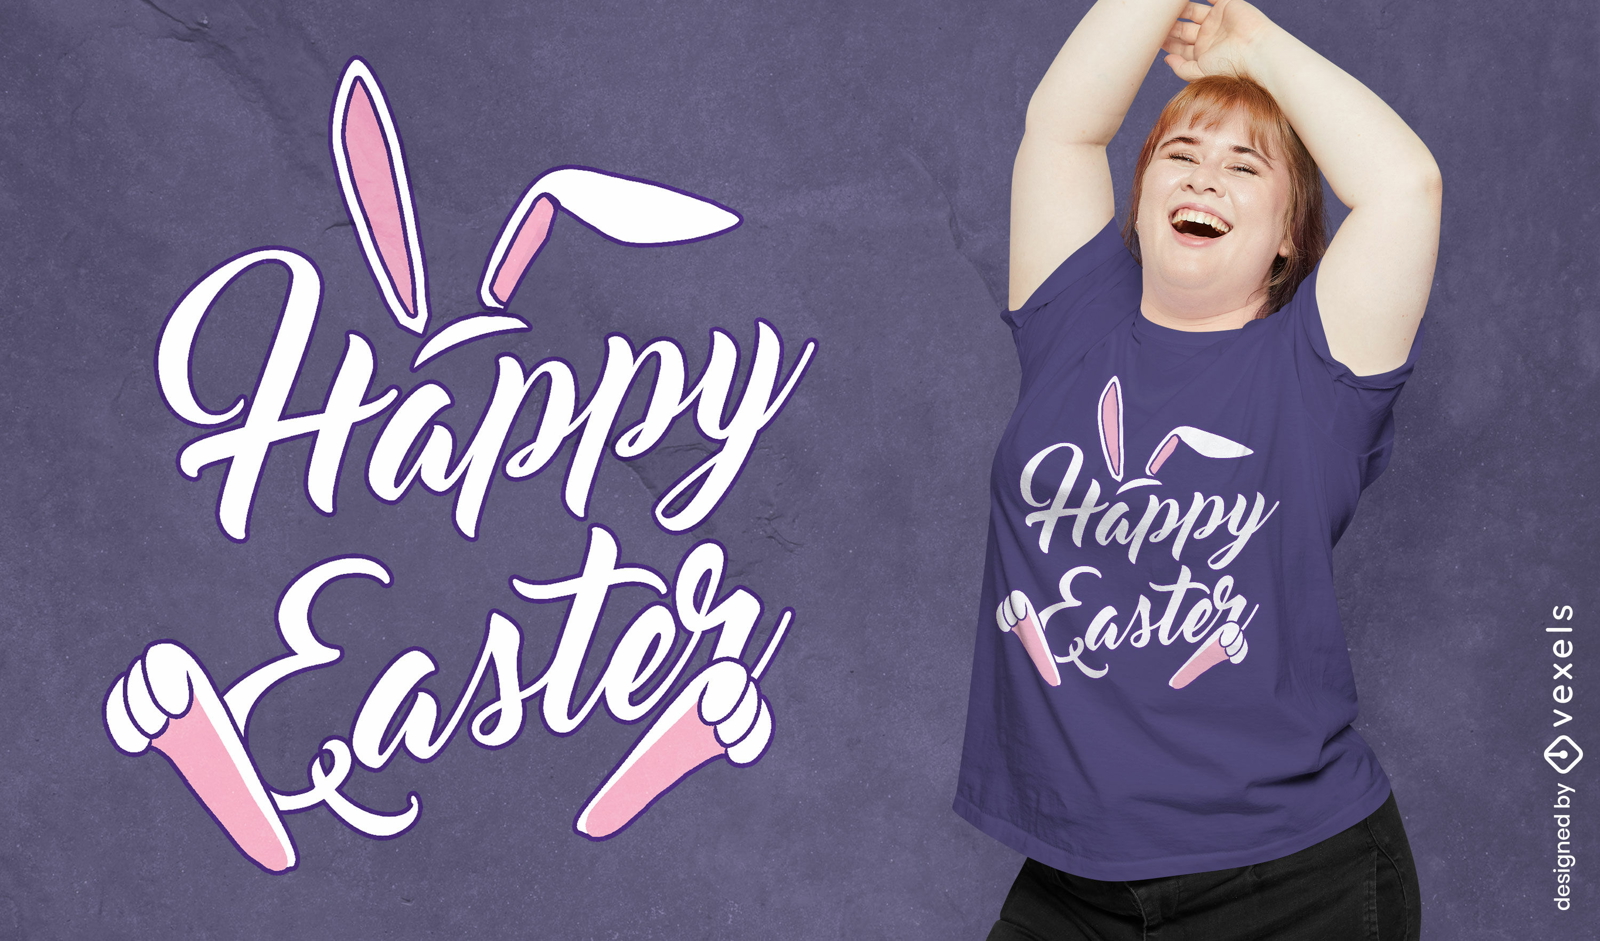
Editable text
Print ready
for Merch
Happy Easter wishes t-shirt design
Choose a folder
All favorites
Create new
Save
Happy Easter wishes t-shirt design
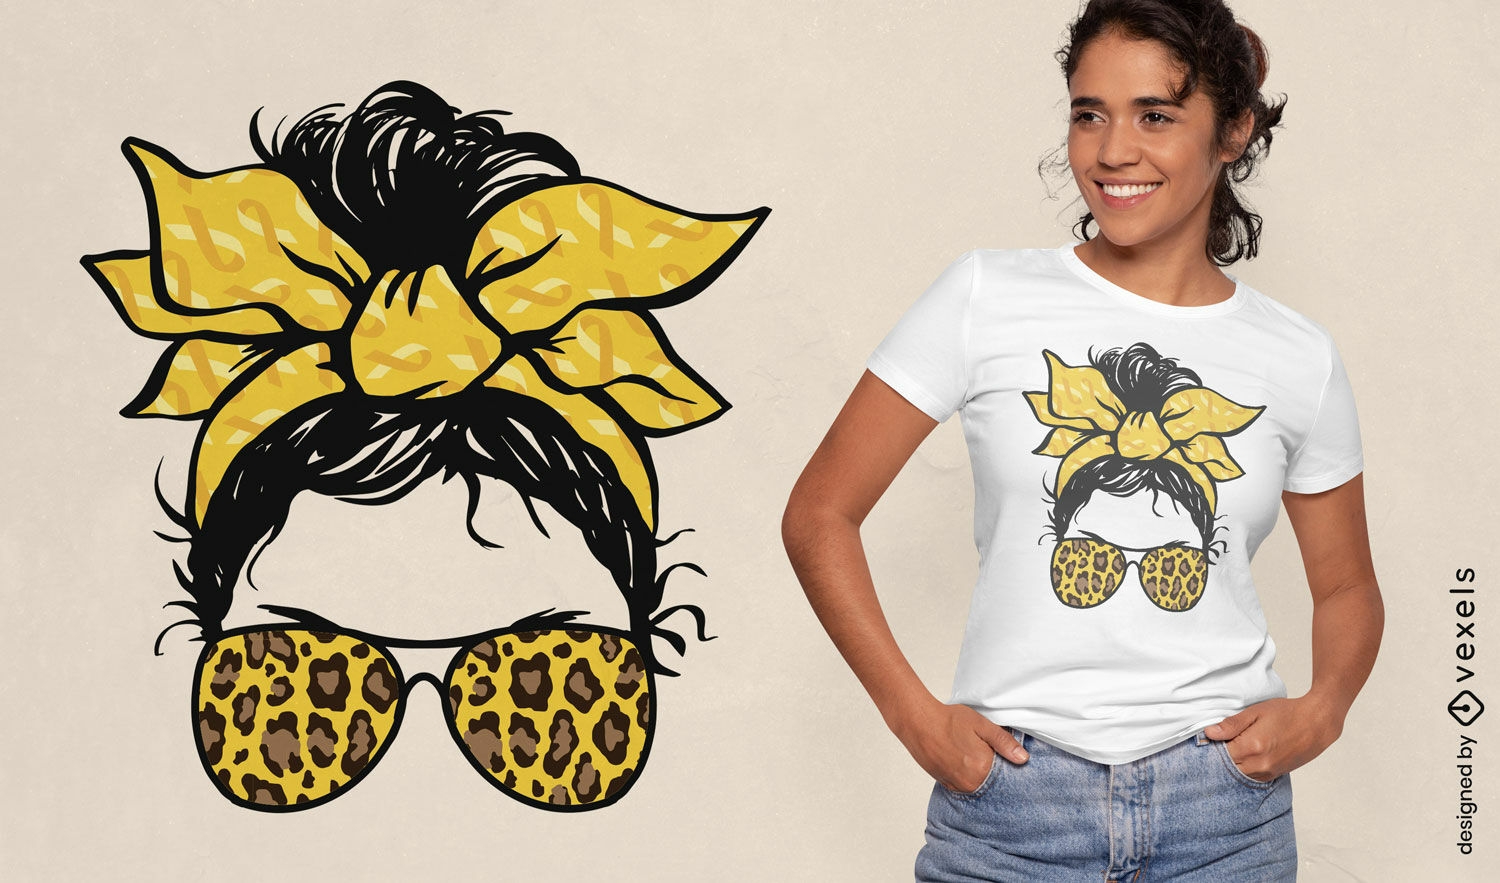
Print ready
for Merch
Sunglasses girl t-shirt design
Choose a folder
All favorites
Create new
Save
Sunglasses girl t-shirt design
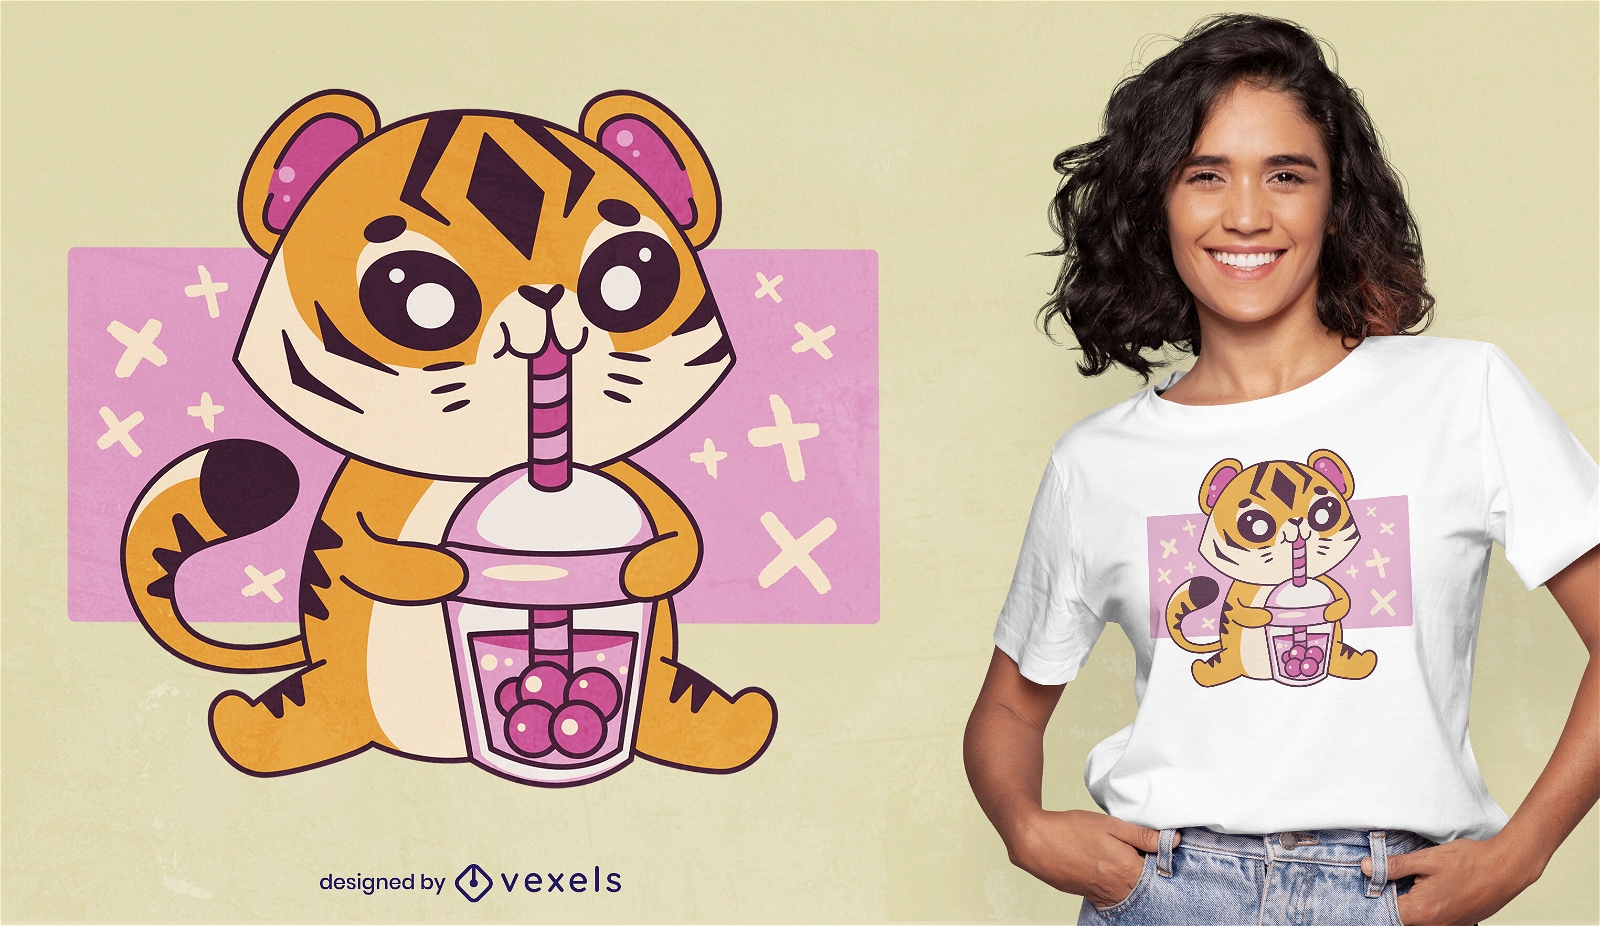
Print ready
for Merch
Kawaii tiger and boba tea t-shirt design
Choose a folder
All favorites
Create new
Save
Kawaii tiger and boba tea t-shirt design
Editable text
Print ready
for Merch
Cat taco backwards quote t-shirt design
Choose a folder
All favorites
Create new
Save
Cat taco backwards quote t-shirt design
Print ready
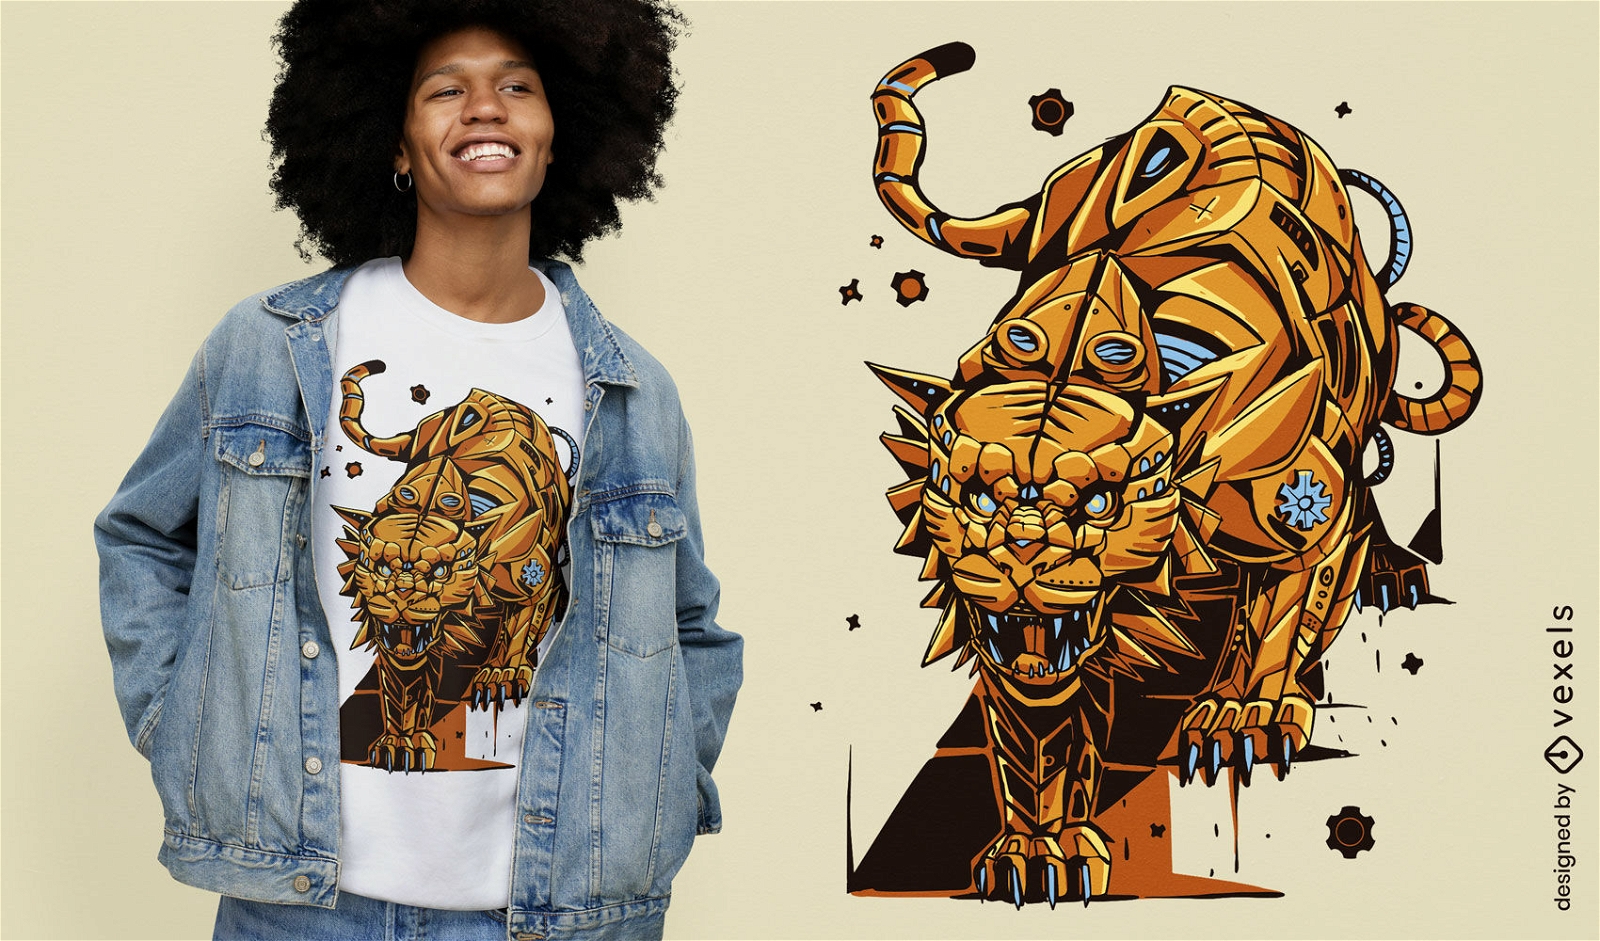
for Merch
Steampunk tiger animal t-shirt design
Choose a folder
All favorites
Create new
Save
Steampunk tiger animal t-shirt design
Print ready
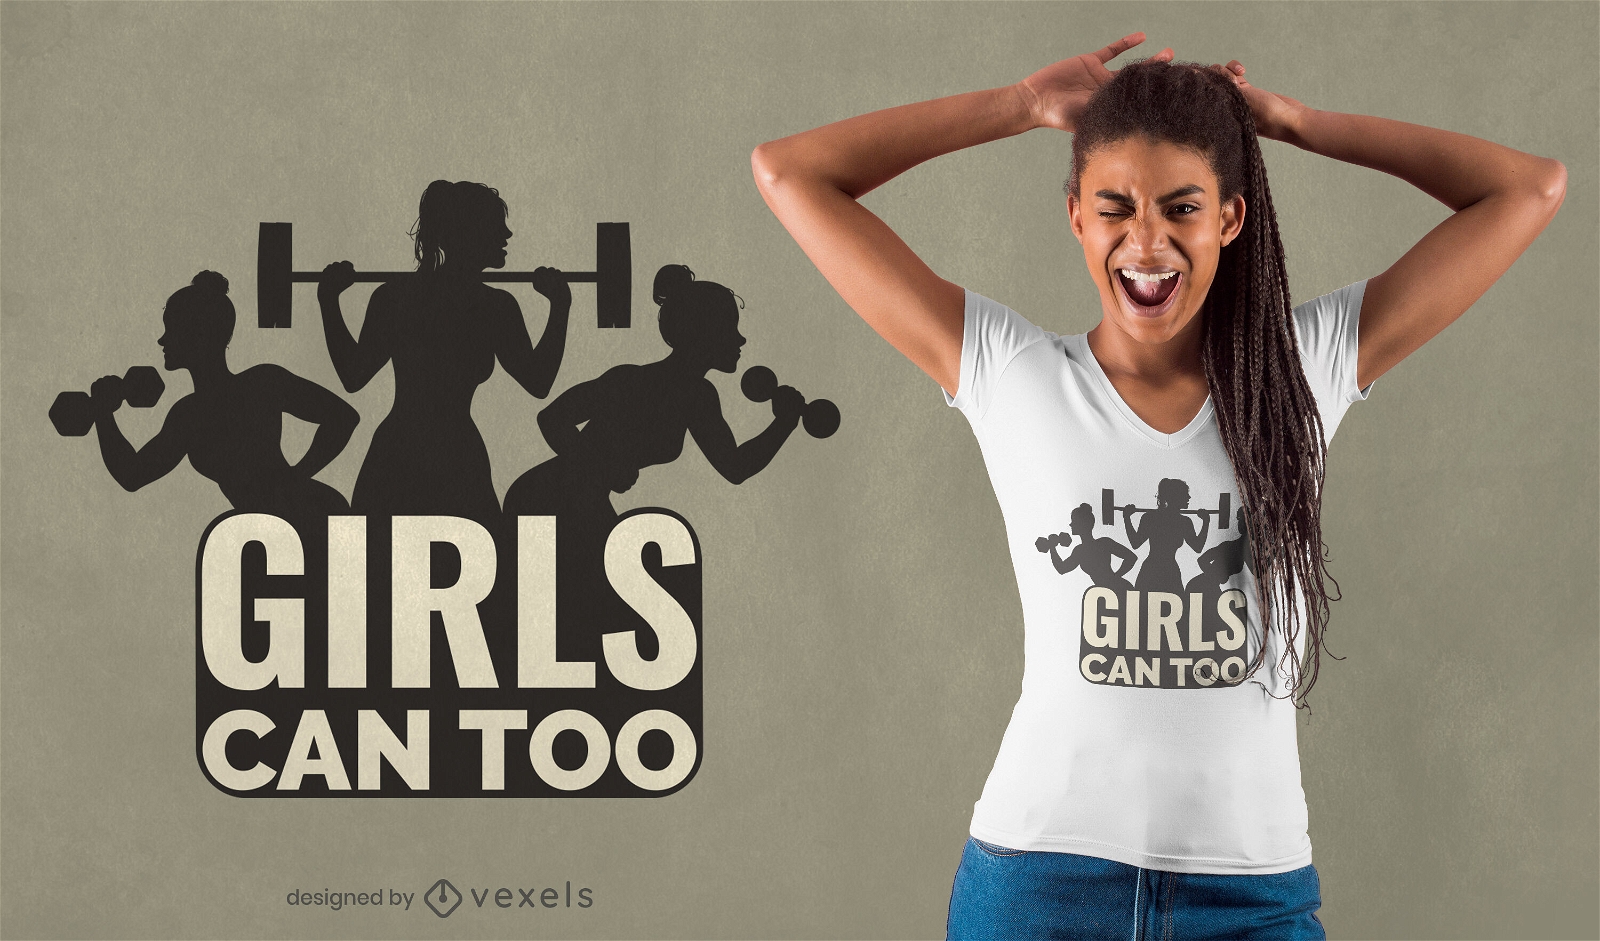
for Merch
Gym girls can too quote silhouette t-shirt design
Choose a folder
All favorites
Create new
Save
Gym girls can too quote silhouette t-shirt design
Print ready
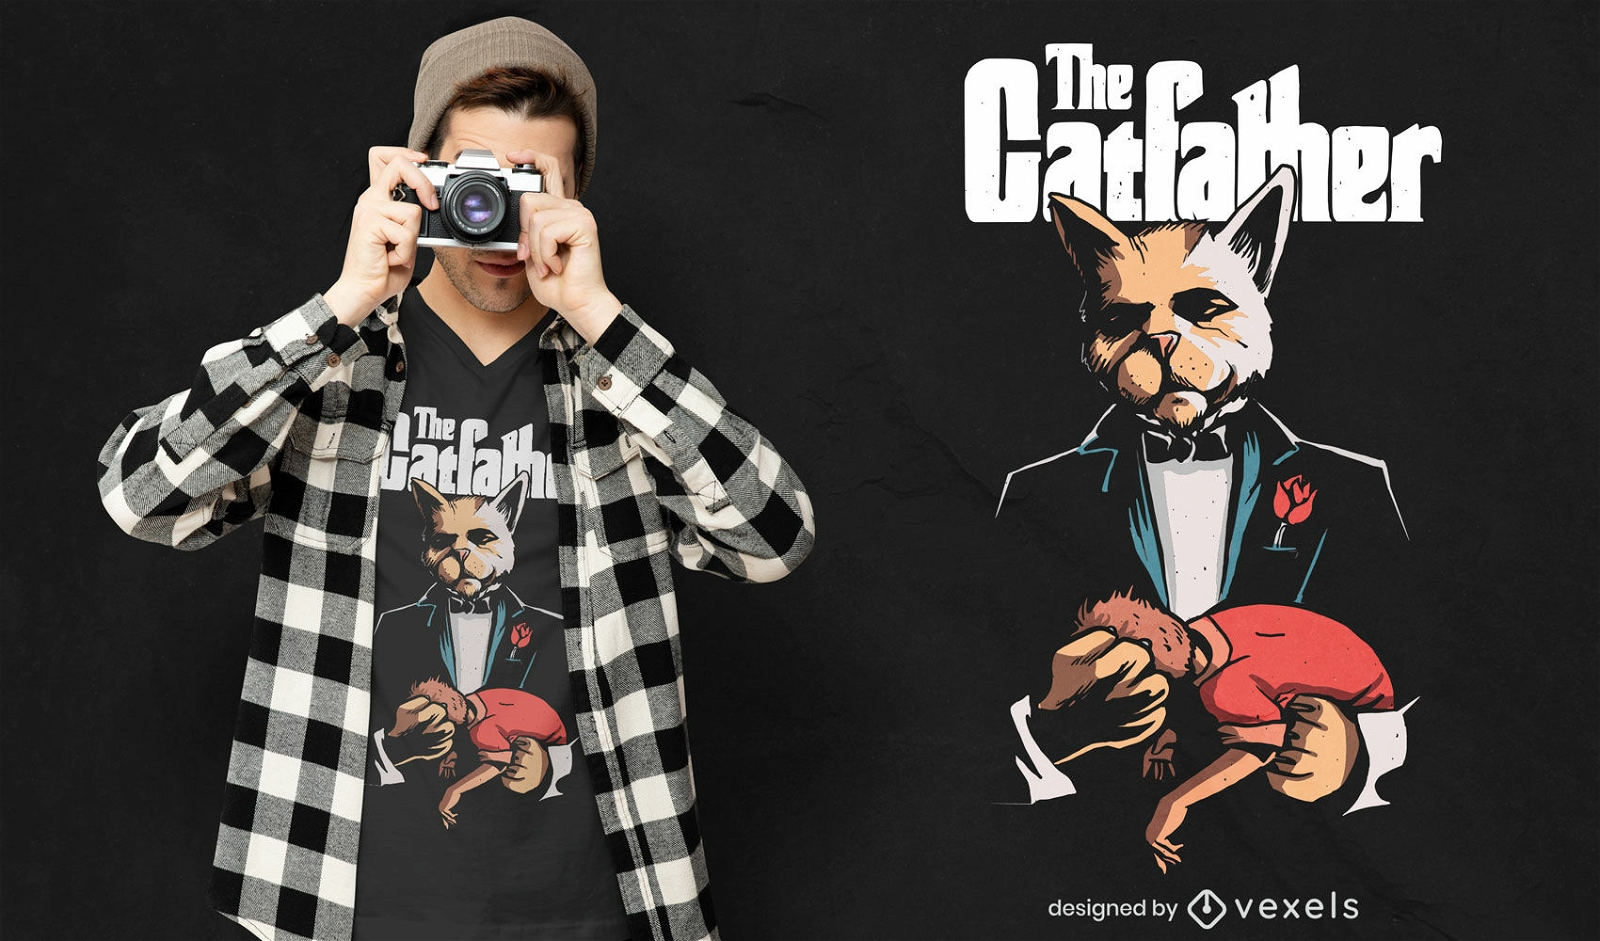
for Merch
The catfather t-shirt design
Choose a folder
All favorites
Create new
Save
The catfather t-shirt design
Print ready
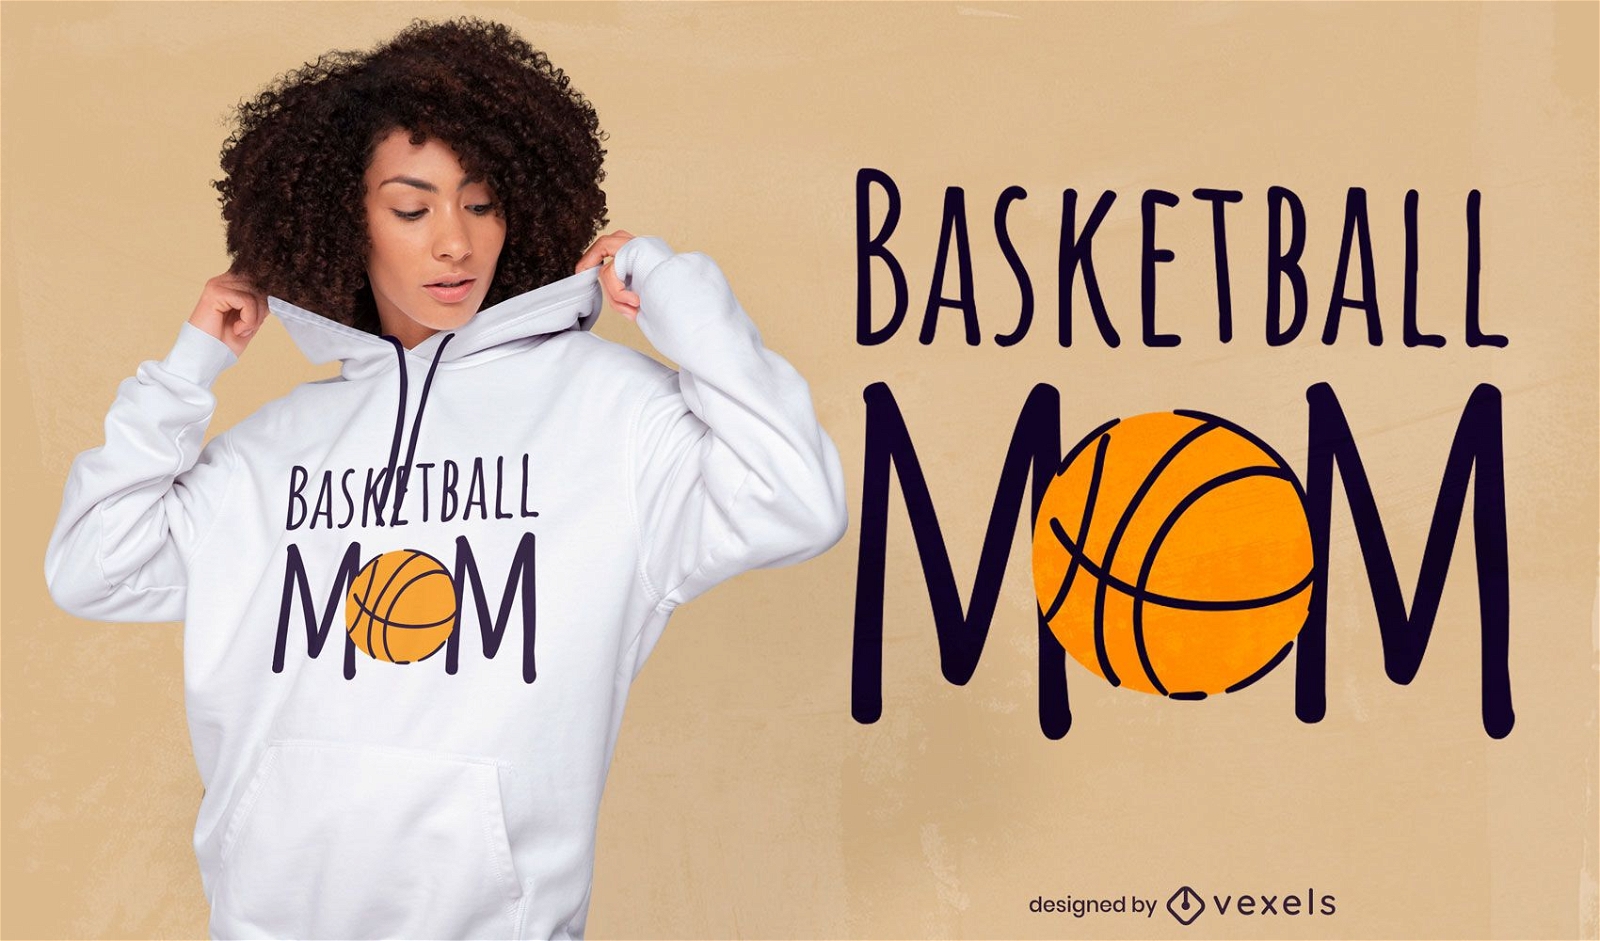
for Merch
Basketball sport mom quote t-shirt design
Choose a folder
All favorites
Create new
Save
Basketball sport mom quote t-shirt design
Print ready
for Merch
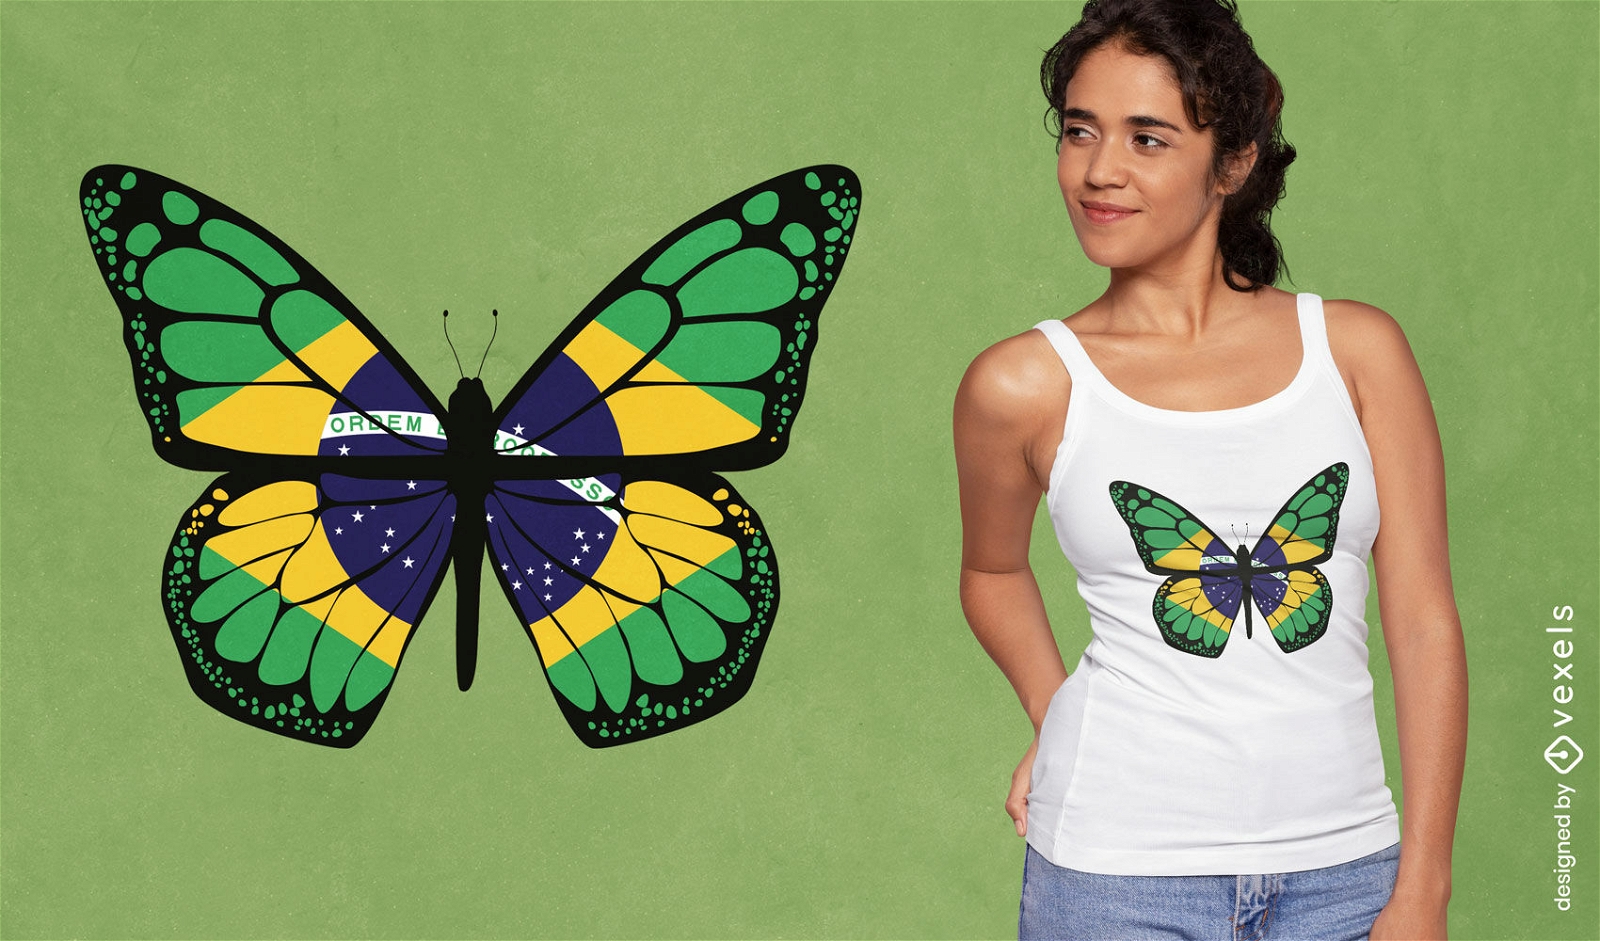
Brazilian butterfly enchantment t-shirt design
Choose a folder
All favorites
Create new
Save
Brazilian butterfly enchantment t-shirt design
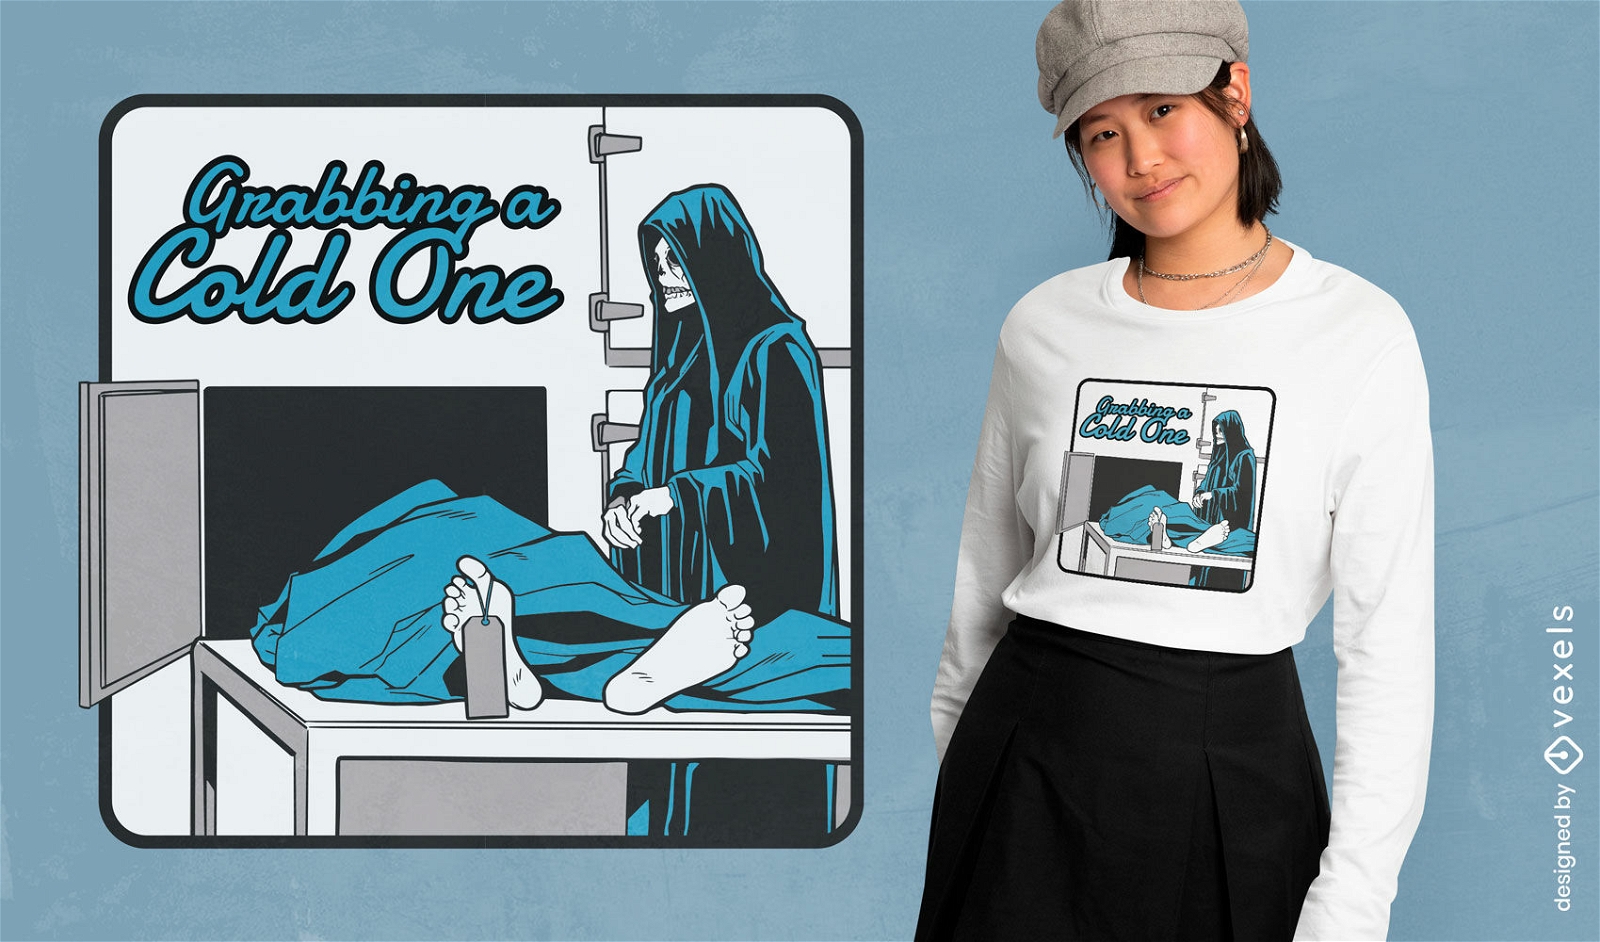
Editable text
Print ready
for Merch
Grab a cold dark humor t-shirt design
Choose a folder
All favorites
Create new
Save
Grab a cold dark humor t-shirt design
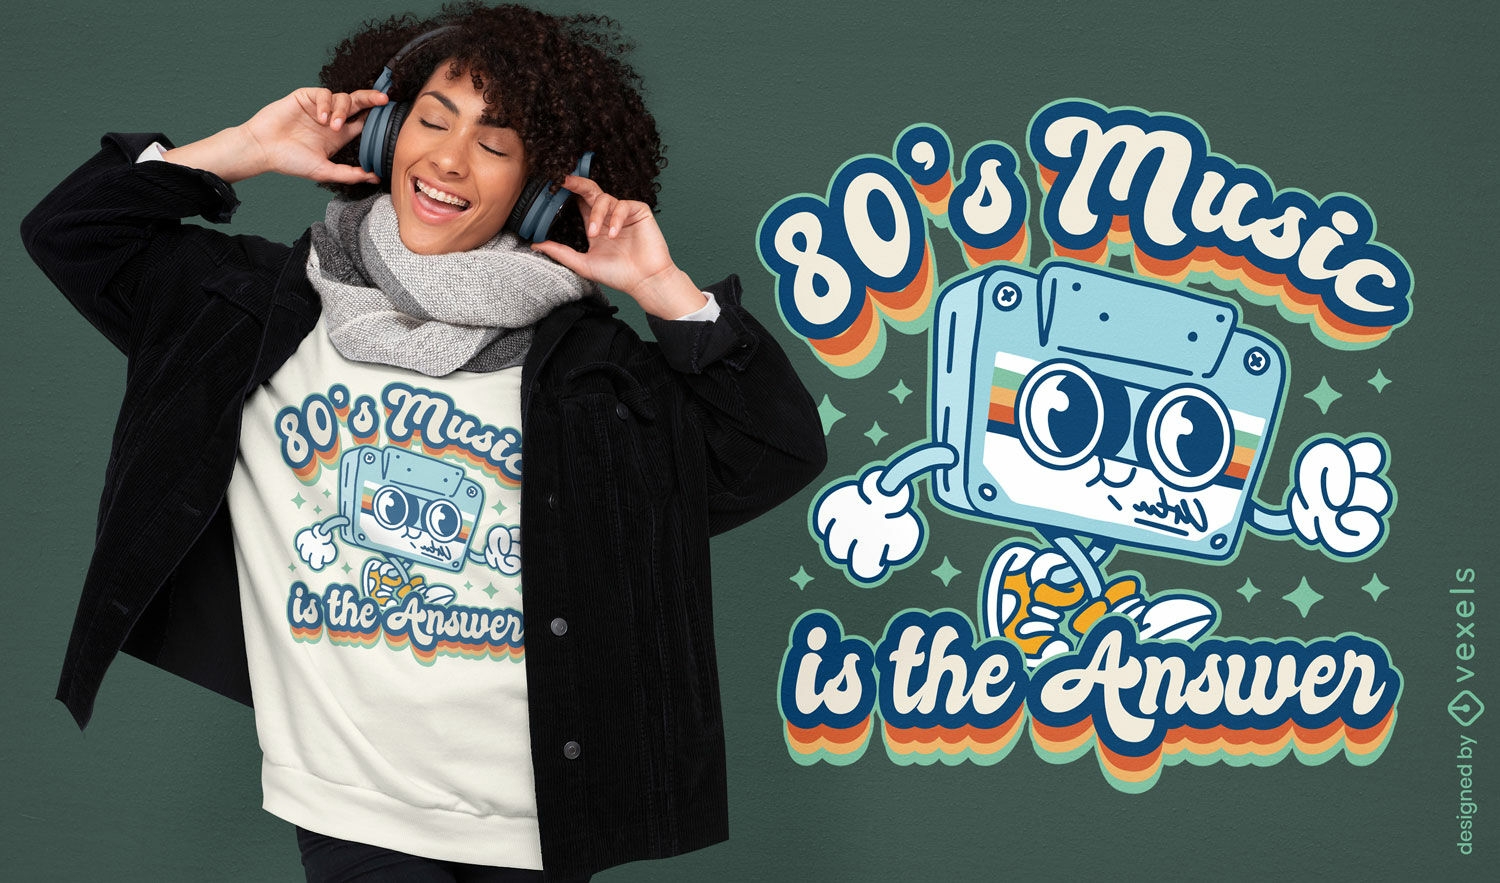
Editable text
Print ready
for Merch
Retro cartoon cassette t-shirt design
Choose a folder
All favorites
Create new
Save
Retro cartoon cassette t-shirt design
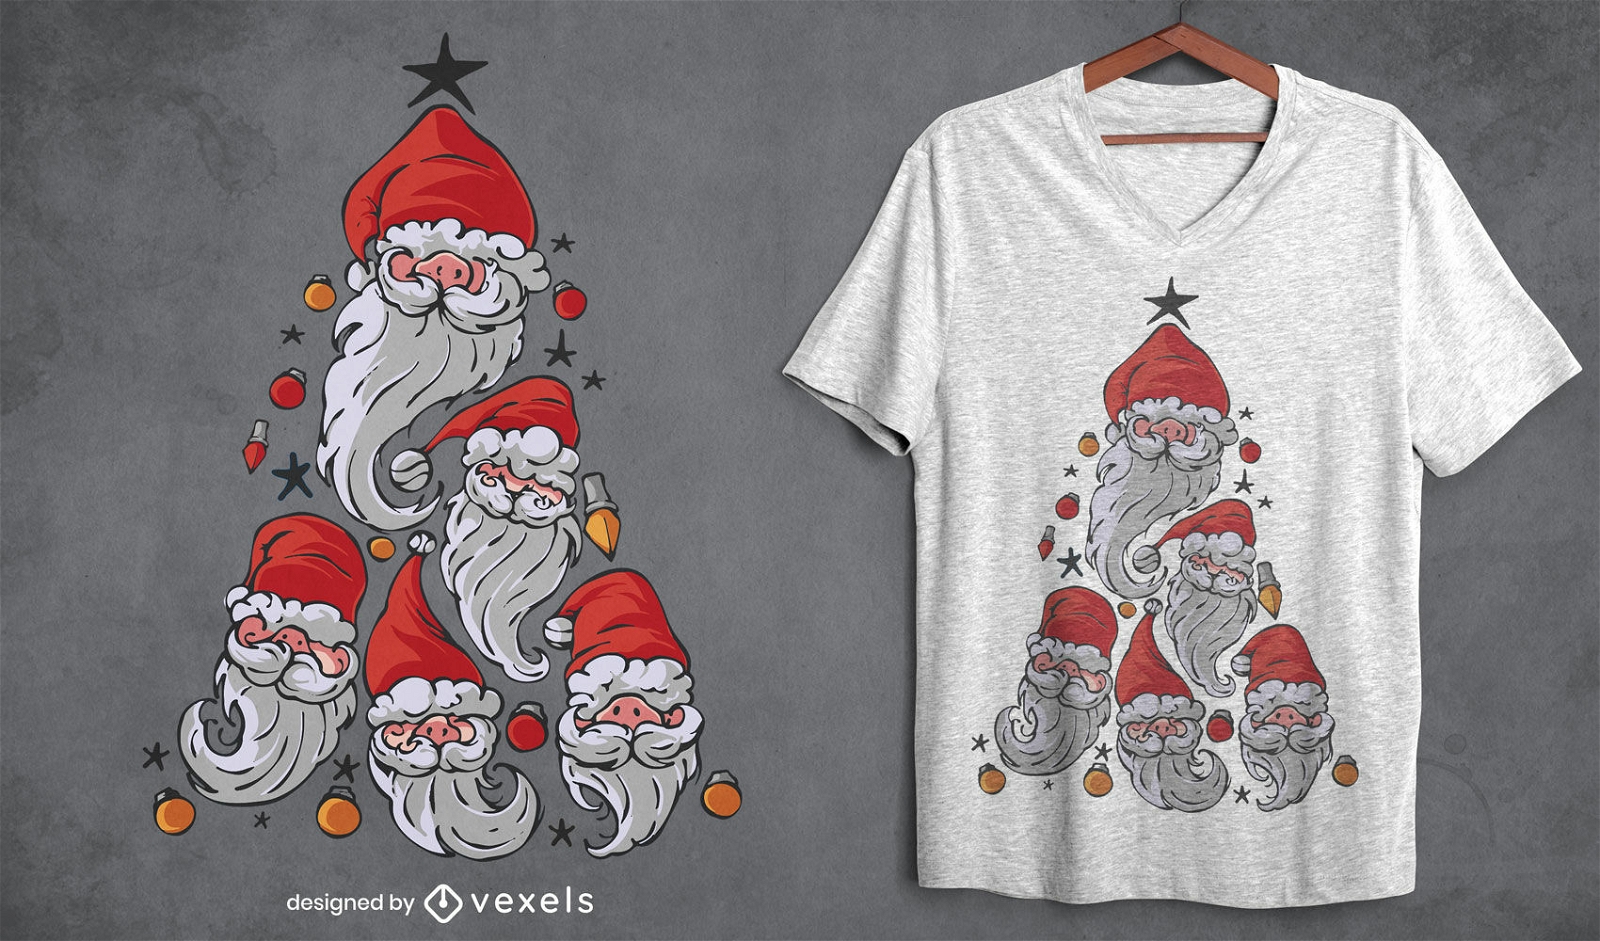
Print ready
for Merch
Gnomes Christmas tree t-shirt design
Choose a folder
All favorites
Create new
Save
Gnomes Christmas tree t-shirt design
Print ready
for Merch
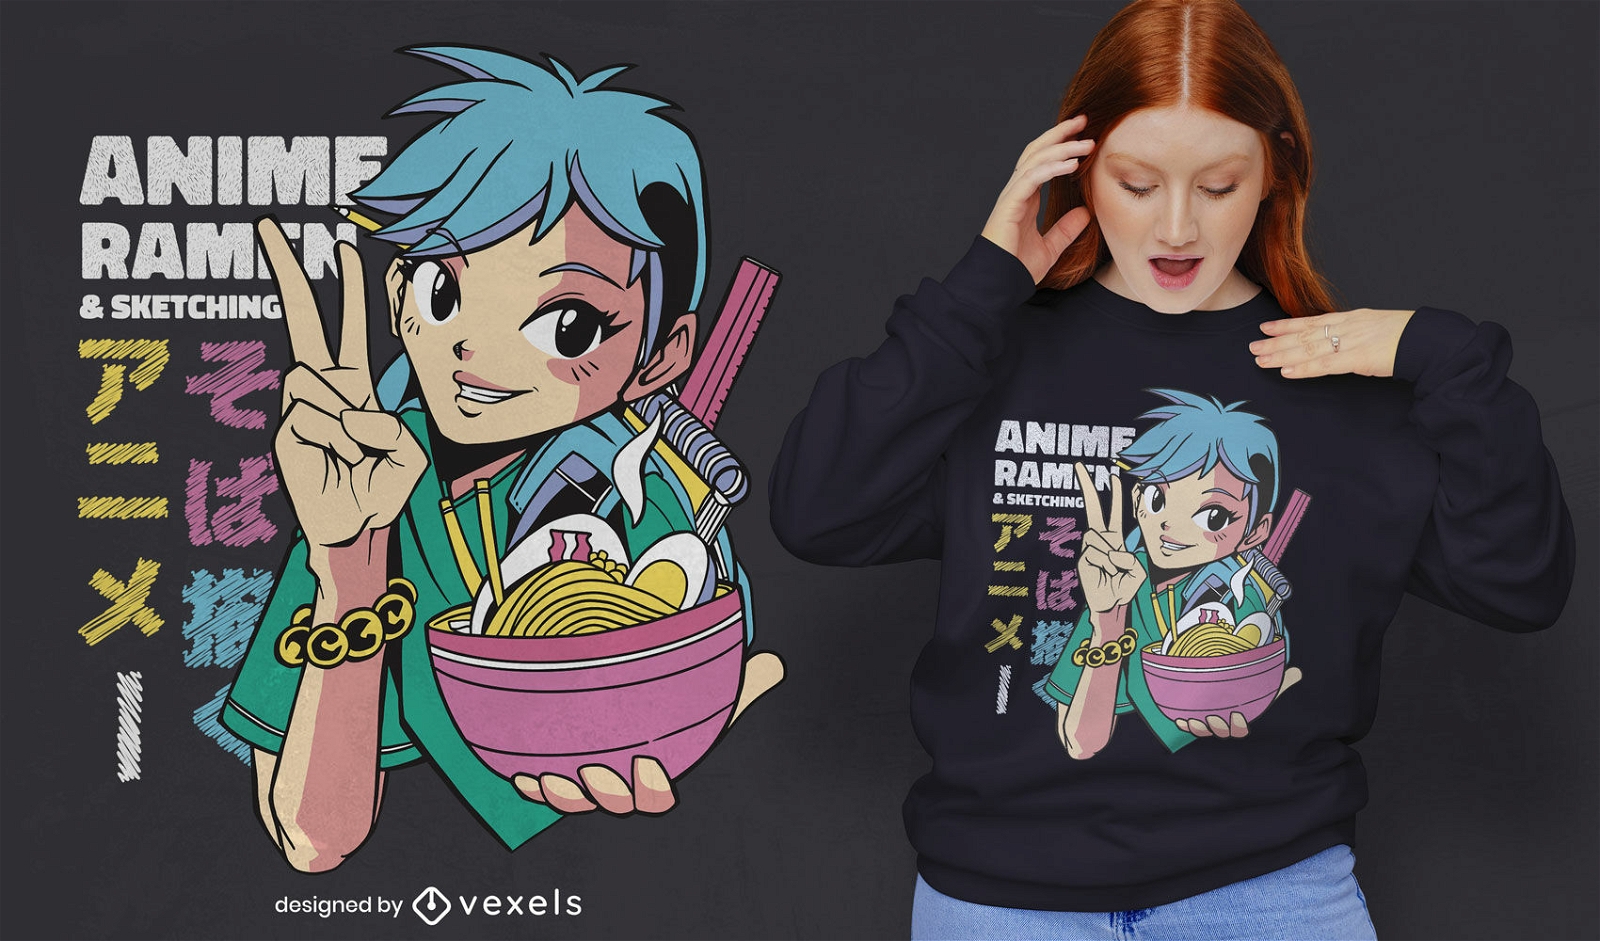
Anime girl with ramen bowl t-shirt design
Choose a folder
All favorites
Create new
Save
Anime girl with ramen bowl t-shirt design
Print ready
for Merch
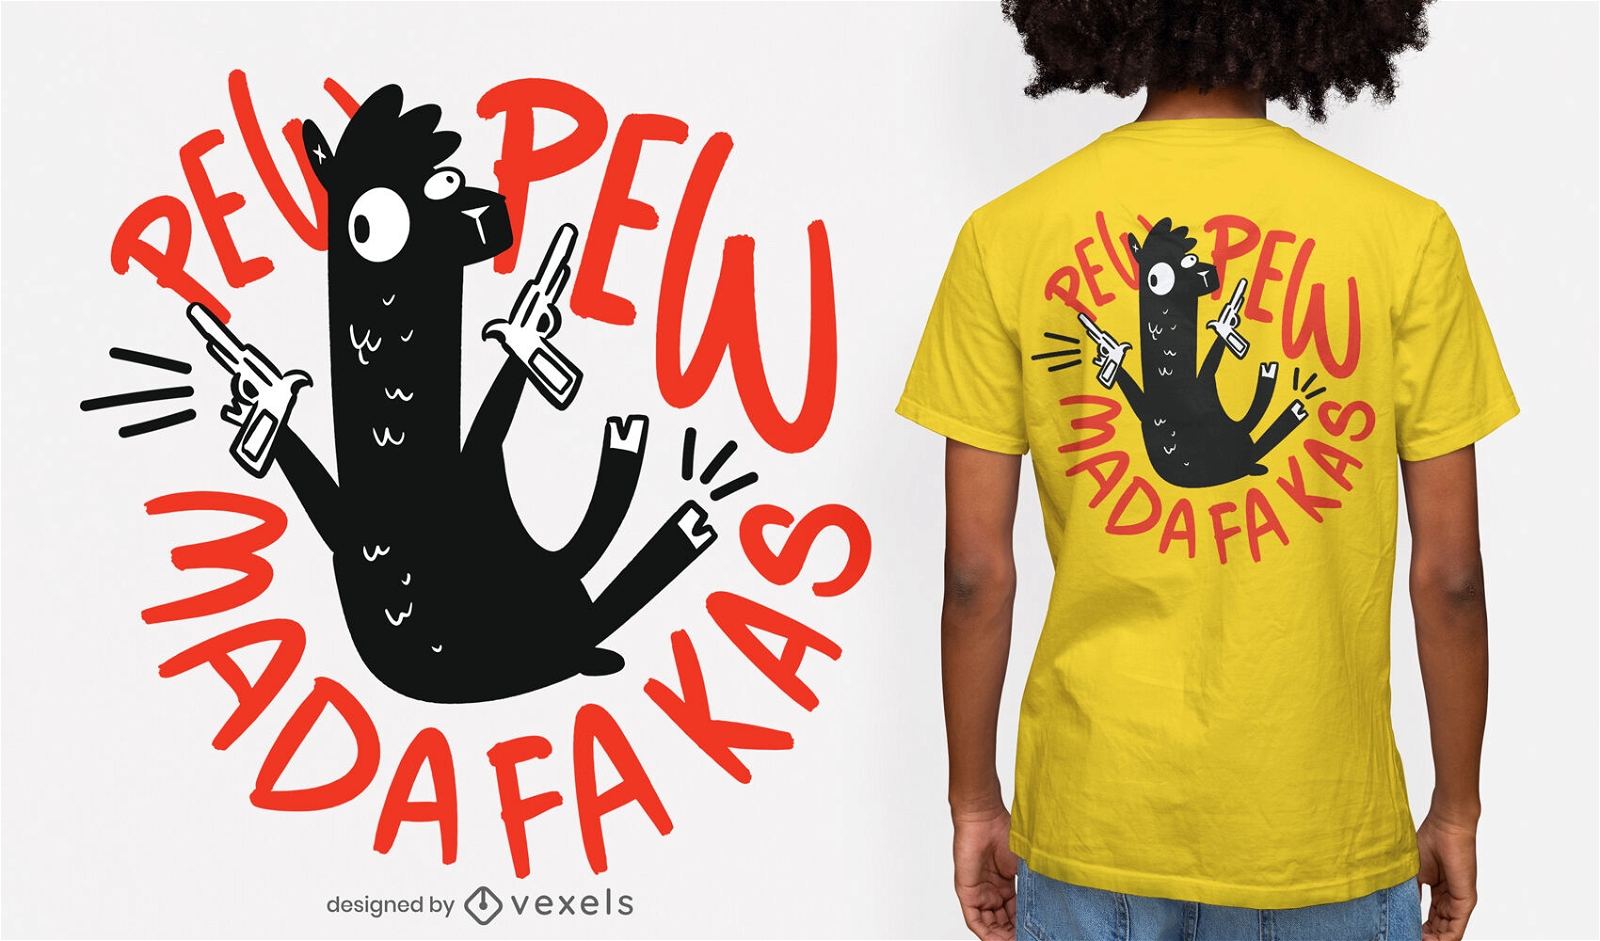
Guns llama t-shirt design
Choose a folder
All favorites
Create new
Save
Guns llama t-shirt design
Boost Your Business
With The Leading Graphic Platform For Merch.
SEE PLANS
Next
of 817
prev page
next page