Design Library
New Merch Designs
T-Shirts
Vectors
Trending Merch Designs
PNGs & SVGs
Mockups
T-Shirt PSD Templates
Explore Designs
KDP Designs
Posters
Mugs
Phone Cases
Tote Bags
Pillows
Design Tools
Merch Designer
New!
Mockup Generator
AI Design Generator
Image Vectorizer
Quote Generator
T-Shirt Maker (Old)
Resources
Merch Digest
Blog
Help Center
Learn About Merch
Feedback
Corporate Solutions
Enterprise
API Access
Design Studio
Bulk Design Production
BLACK FRIDAY 60% OFF
Loading...
Sign Up
Login
All
diagrama
Design Library
New Merch Designs
T-Shirts
Vectors
Trending Merch Designs
PNGs & SVGs
Mockups
T-Shirt PSD Templates
Explore Designs
KDP Designs
Posters
Mugs
Phone Cases
Tote Bags
Pillows
Design Tools
Merch Designer
New!
Mockup Generator
AI Design Generator
Image Vectorizer
Quote Generator
T-Shirt Maker (Old)
Resources
Merch Digest
Blog
Help Center
Learn About Merch
Feedback
Corporate Solutions
Enterprise
API Access
Design Studio
Bulk Design Production
PLANS
All
diagrama
158 diagrama designs graphics for t-shirt and print on demand merch
Download diagrama t-shirt designs and other merch graphics like book covers, phone cases, tote bags and more.
Sort by
Most relevant
Sponsored results by
Get 15% off with code: VEXELS15
Show more
Arrow direction covered van PNG Design
Choose a folder
All favorites
Create new
Save
Arrow direction covered van PNG Design
Glossy Pie Chart
Choose a folder
All favorites
Create new
Save
Glossy Pie Chart
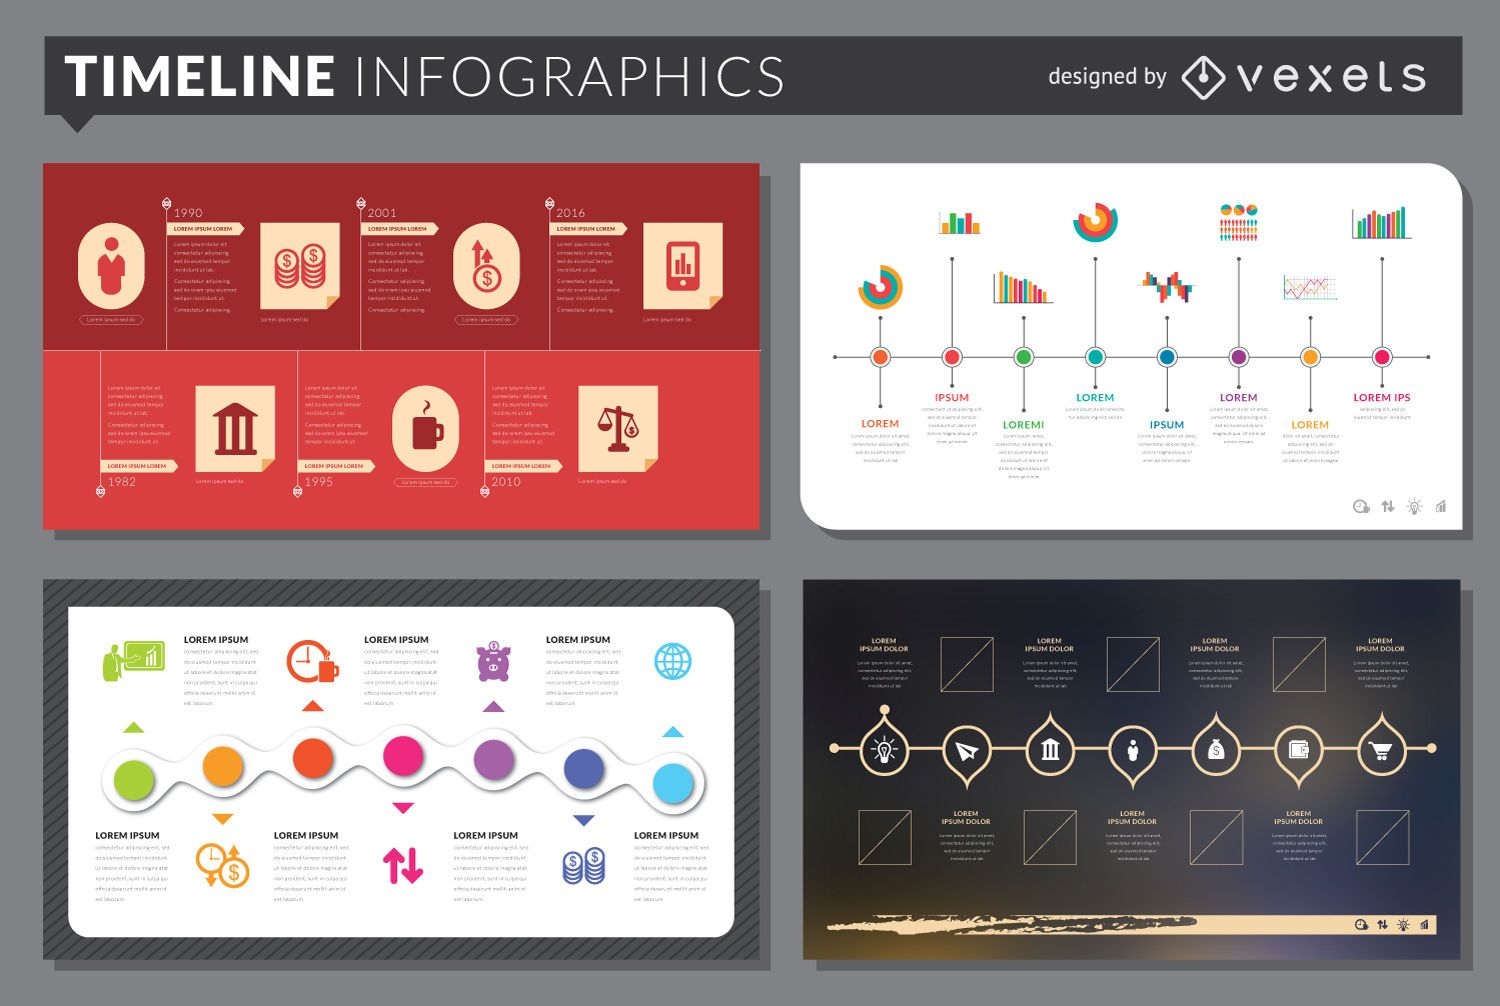
Timeline infographic template set
Choose a folder
All favorites
Create new
Save
Timeline infographic template set
Premium
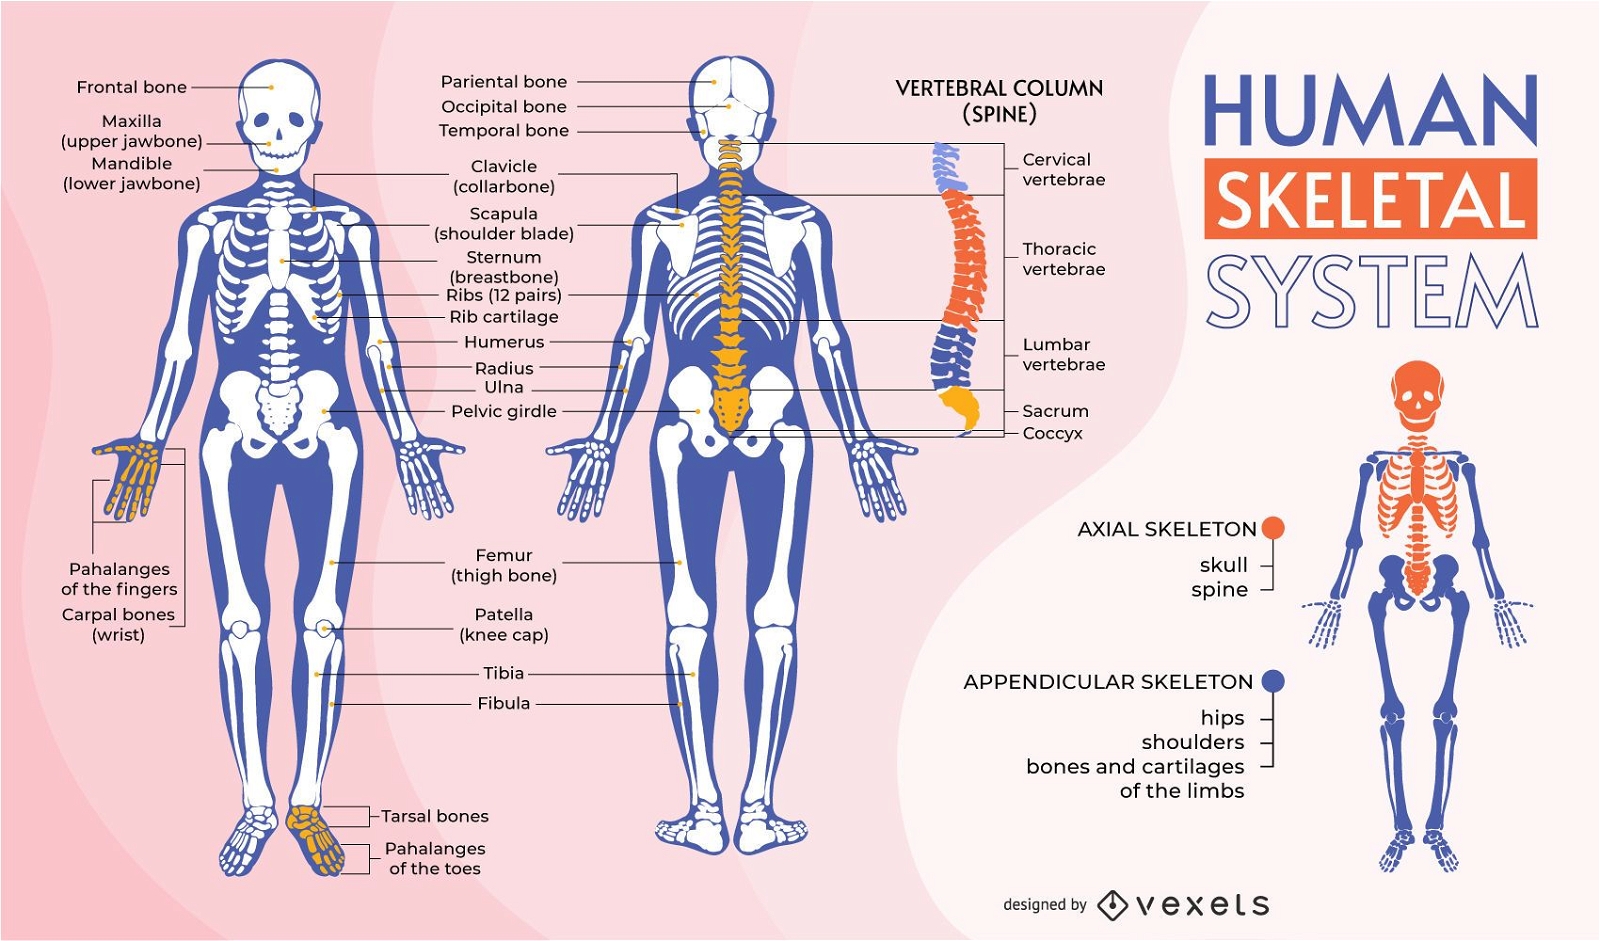
Human skeletal system infographic template
Choose a folder
All favorites
Create new
Save
Human skeletal system infographic template
Premium
Flat piechart infographic PNG Design
Choose a folder
All favorites
Create new
Save
Flat piechart infographic PNG Design
Flat Diamond Layout Colorful Squares Infographic
Choose a folder
All favorites
Create new
Save
Flat Diamond Layout Colorful Squares Infographic
Real estate chart infographic PNG Design
Choose a folder
All favorites
Create new
Save
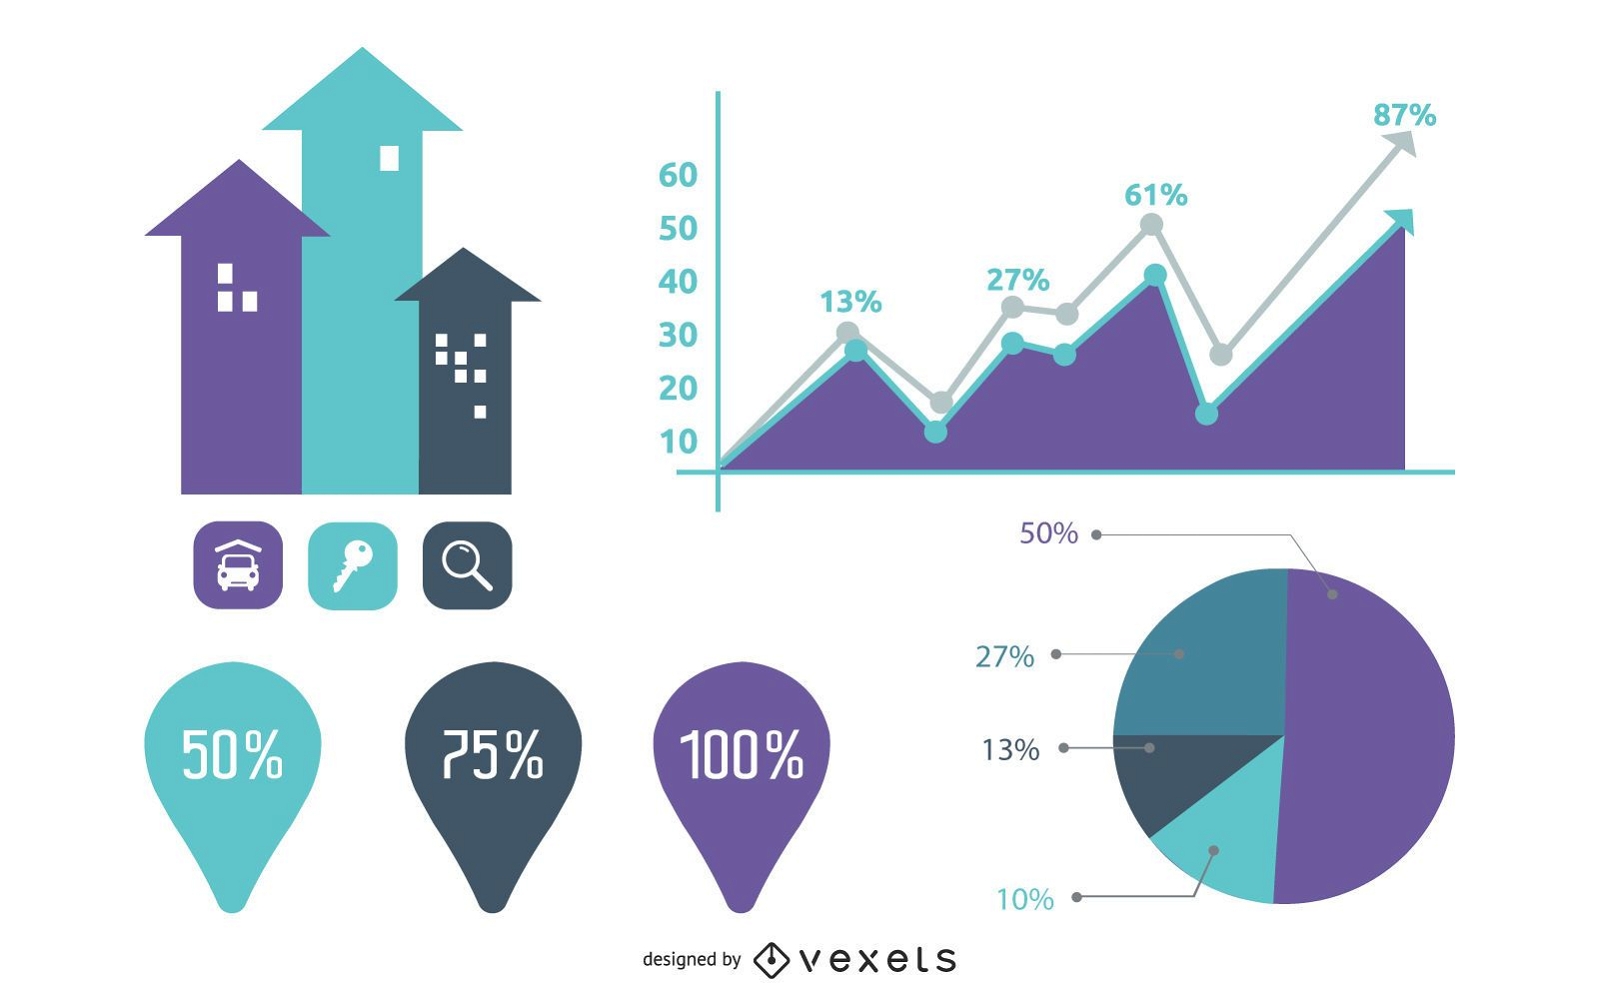
Real estate chart infographic PNG Design
Premium
3d piechart graph PNG Design
Choose a folder
All favorites
Create new
Save
3d piechart graph PNG Design
Blue grey growing linechart PNG Design
Choose a folder
All favorites
Create new
Save
Blue grey growing linechart PNG Design
Flat Minimal Infographic Element Set
Choose a folder
All favorites
Create new
Save
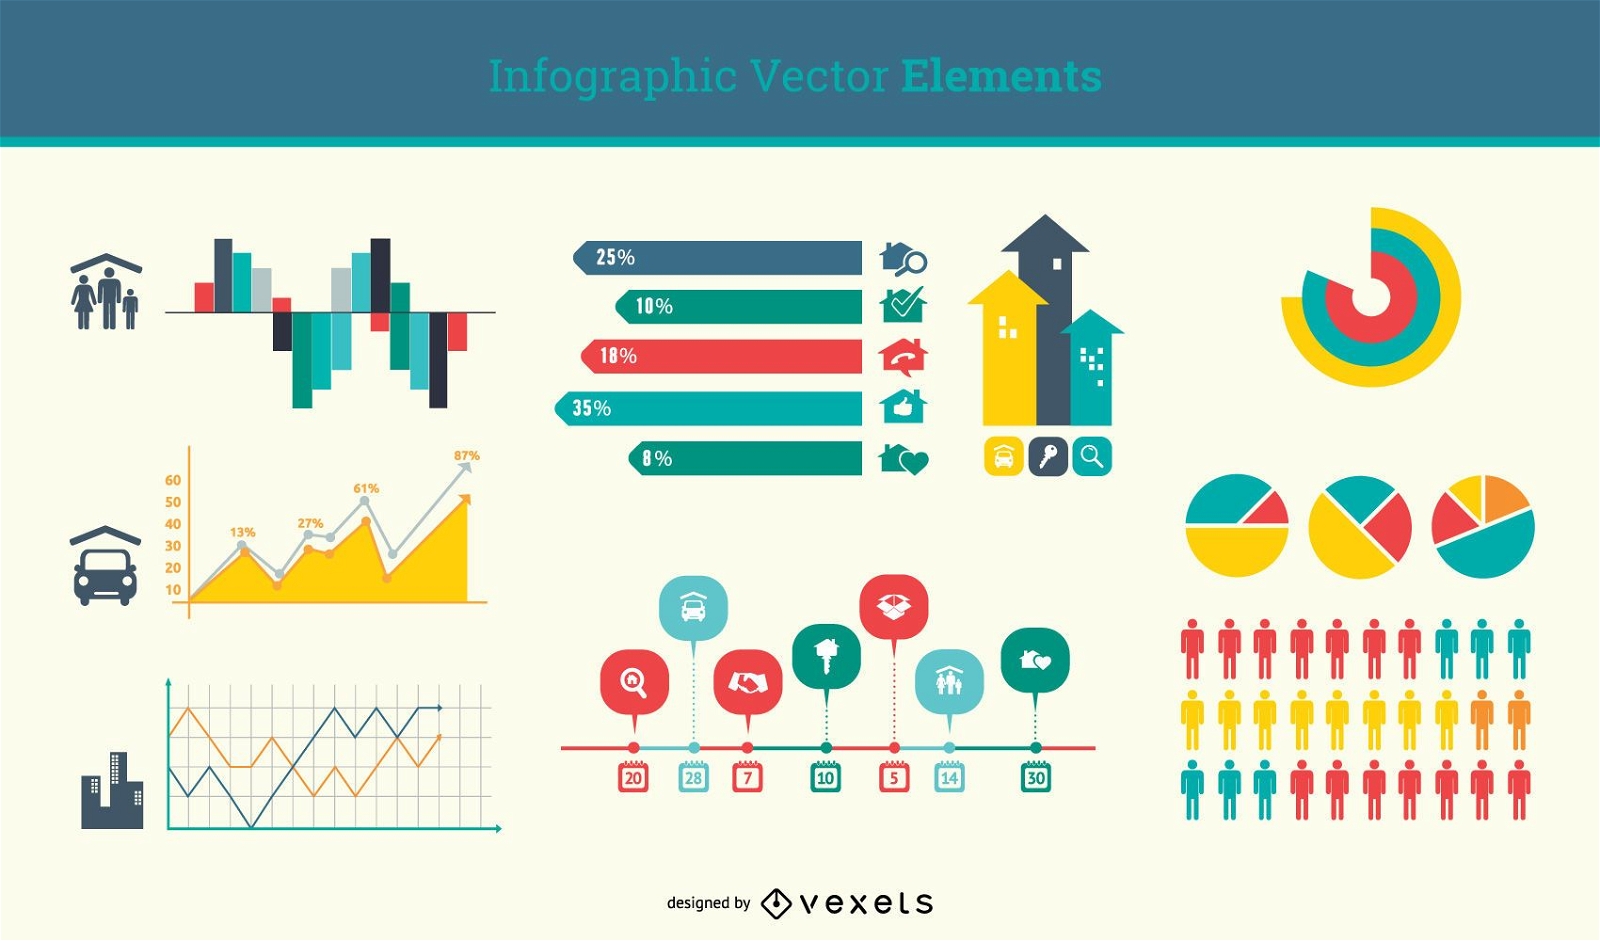
Flat Minimal Infographic Element Set
Premium
Windrose arrow south west east nord silhouette PNG Design
Choose a folder
All favorites
Create new
Save
Windrose arrow south west east nord silhouette PNG Design
Premium
Reiki benefits poster design
Choose a folder
All favorites
Create new
Save
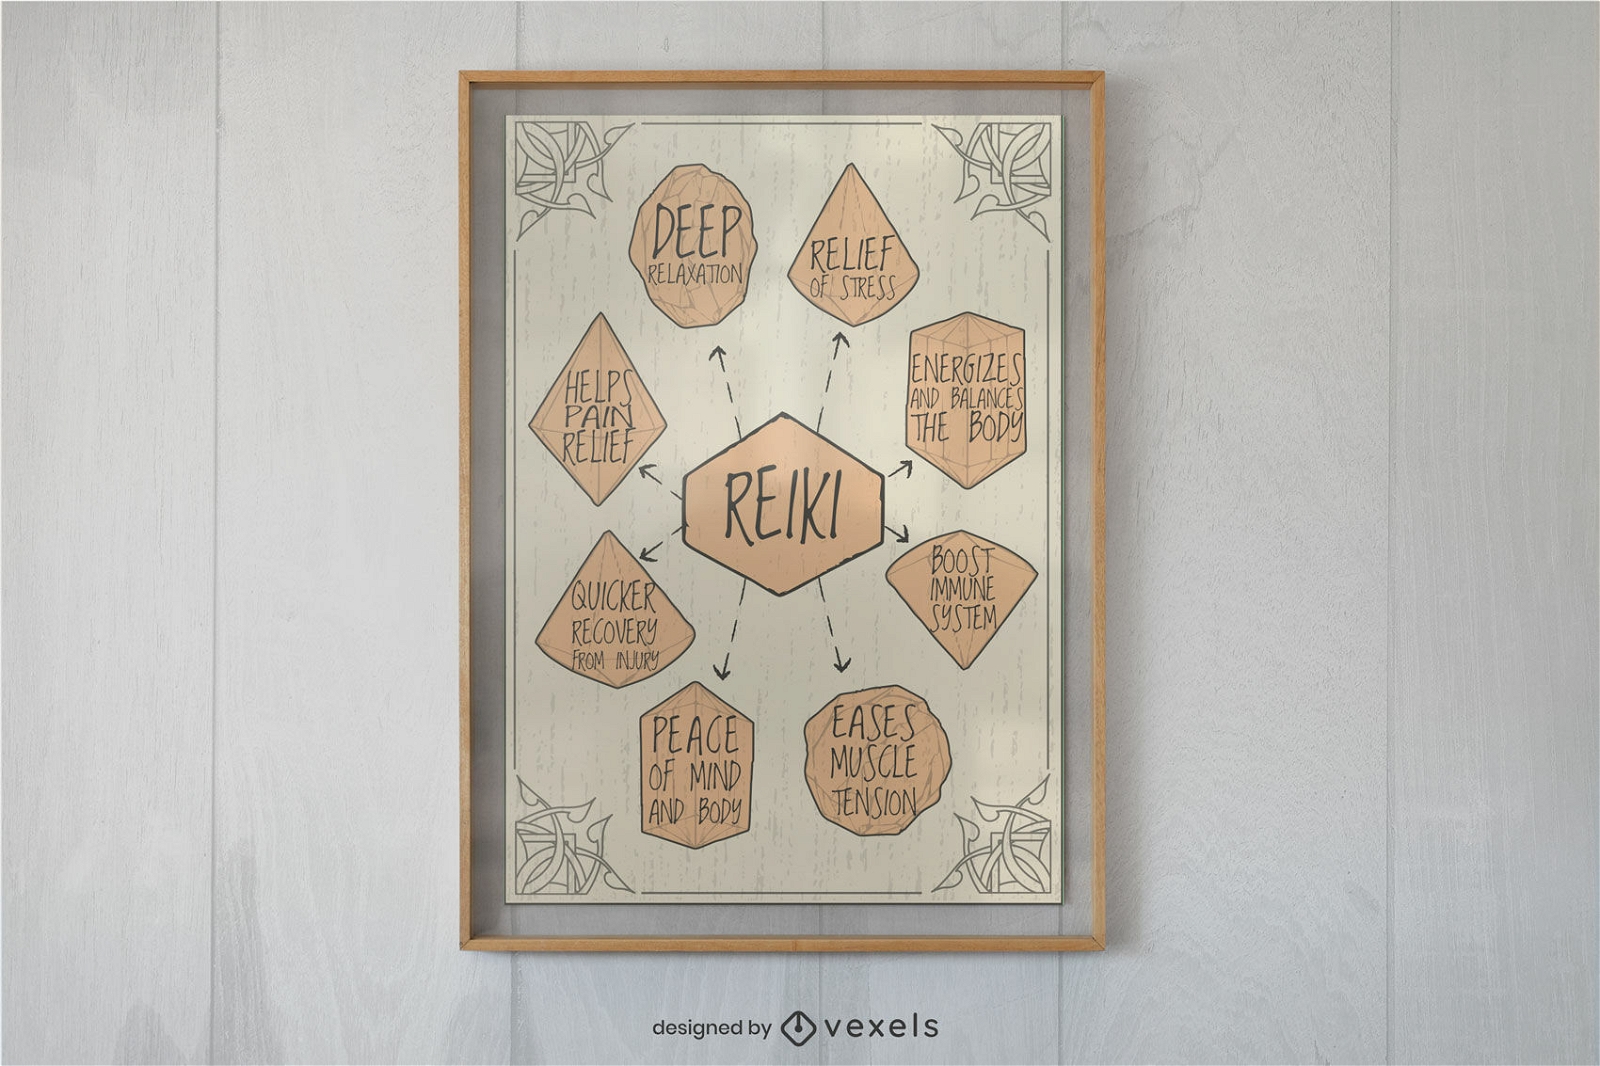
Reiki benefits poster design
Pyramid hand drawn icon PNG Design
Choose a folder
All favorites
Create new
Save
Pyramid hand drawn icon PNG Design
Bar chart infographic 4 PNG Design
Choose a folder
All favorites
Create new
Save
Bar chart infographic 4 PNG Design
Businessman in front pie icon PNG Design
Choose a folder
All favorites
Create new
Save
Businessman in front pie icon PNG Design
Businessman standing growing graph icon PNG Design
Choose a folder
All favorites
Create new
Save
Businessman standing growing graph icon PNG Design
Vintage Info-Graphic Chart
Choose a folder
All favorites
Create new
Save
Vintage Info-Graphic Chart
Premium
Windrose arrow east nord south west line PNG Design
Choose a folder
All favorites
Create new
Save
Windrose arrow east nord south west line PNG Design
Premium
Two sided colorful bar graph PNG Design
Choose a folder
All favorites
Create new
Save
Two sided colorful bar graph PNG Design
Tsunami infographic
Choose a folder
All favorites
Create new
Save
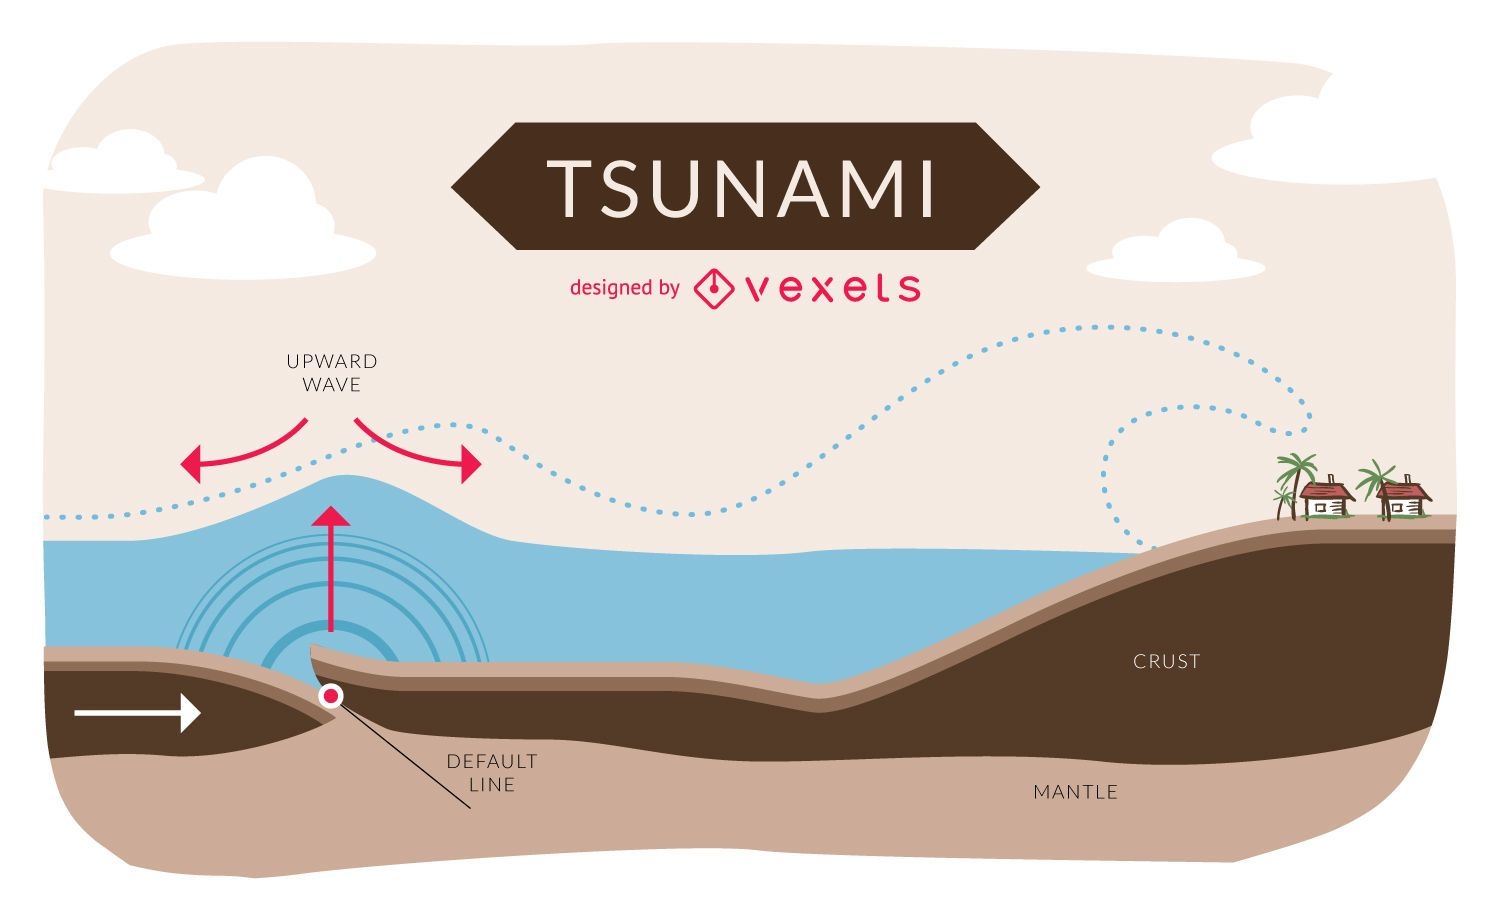
Tsunami infographic
Premium
Multicolor bar graph with icons PNG Design
Choose a folder
All favorites
Create new
Save
Multicolor bar graph with icons PNG Design
Premium
Splitted pie chart icon PNG Design
Choose a folder
All favorites
Create new
Save
Splitted pie chart icon PNG Design
Atom icon hand drawn PNG Design
Choose a folder
All favorites
Create new
Save
Atom icon hand drawn PNG Design
Premium
Windrose arrow nord west south east flat PNG Design
Choose a folder
All favorites
Create new
Save
Windrose arrow nord west south east flat PNG Design
Premium
Two sided colorful bar plot PNG Design
Choose a folder
All favorites
Create new
Save
Two sided colorful bar plot PNG Design
Premium
Windrose arrow west east nord south silhouette PNG Design
Choose a folder
All favorites
Create new
Save
Windrose arrow west east nord south silhouette PNG Design
Premium
Multicolor rounded edge bar chart PNG Design
Choose a folder
All favorites
Create new
Save
Multicolor rounded edge bar chart PNG Design
Premium
Purple star constellation PNG Design
Choose a folder
All favorites
Create new
Save
Purple star constellation PNG Design
Blue green brown vertical bars PNG Design
Choose a folder
All favorites
Create new
Save
Blue green brown vertical bars PNG Design
Premium
Flat pie chart icon PNG Design
Choose a folder
All favorites
Create new
Save
Flat pie chart icon PNG Design
Editable text
Print ready
for Merch
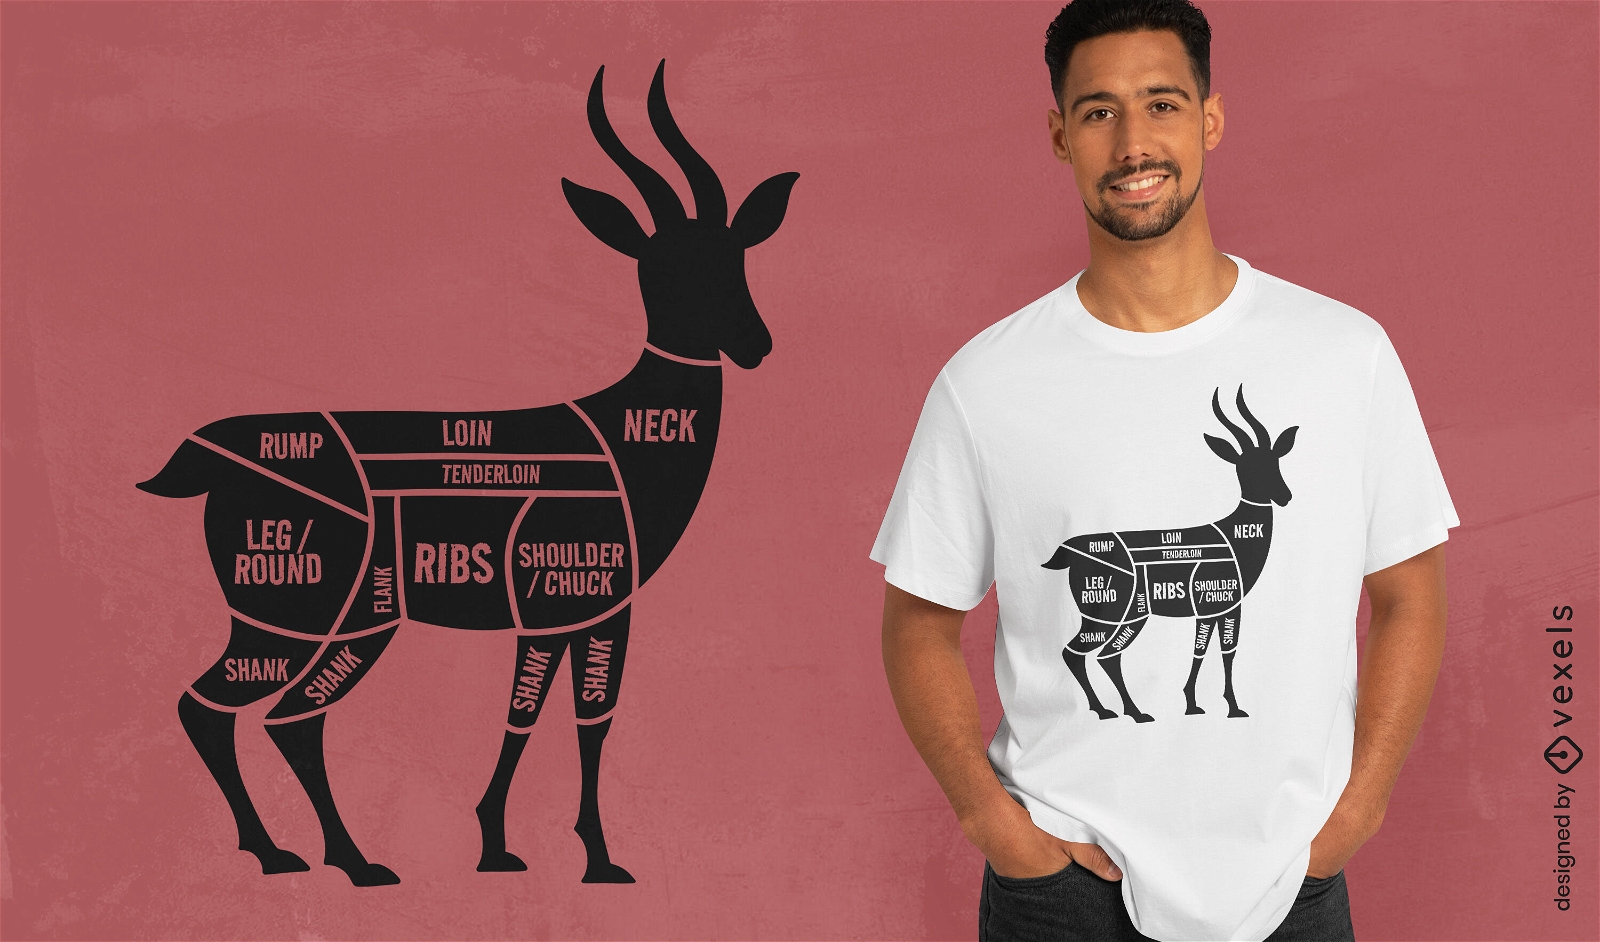
Venison butcher cuts t-shirt design
Choose a folder
All favorites
Create new
Save
Venison butcher cuts t-shirt design
3 part pie chart PNG Design
Choose a folder
All favorites
Create new
Save
3 part pie chart PNG Design
Premium
Windrose arrow west nord south east flat PNG Design
Choose a folder
All favorites
Create new
Save
Windrose arrow west nord south east flat PNG Design
Premium
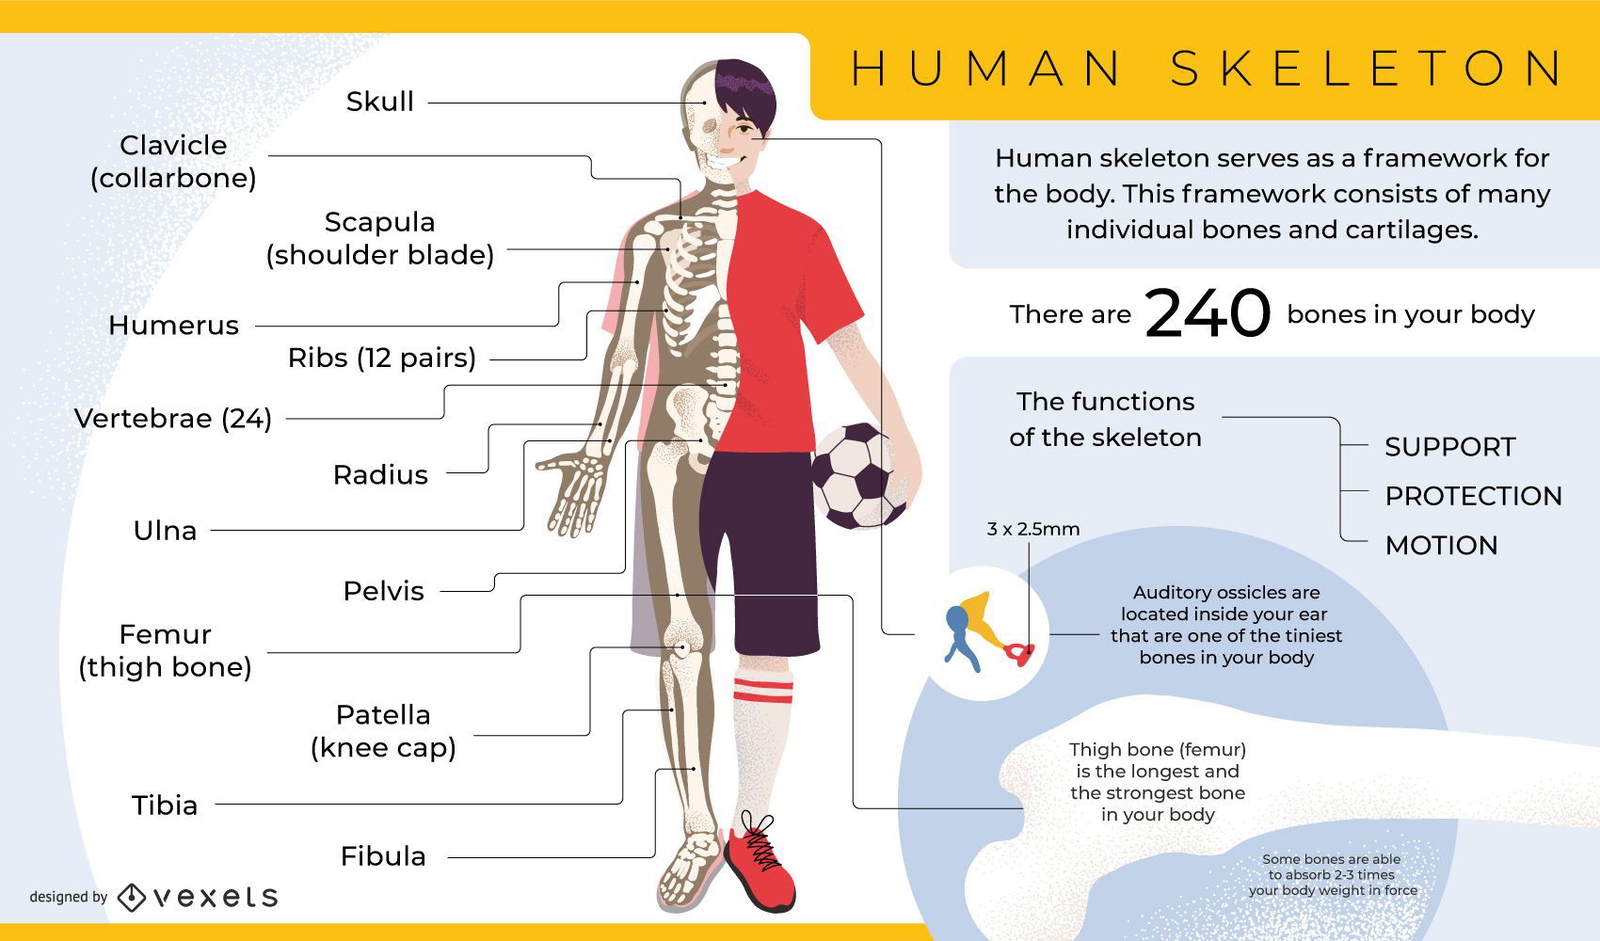
Human skeleton infographic template
Choose a folder
All favorites
Create new
Save
Human skeleton infographic template
Premium
Human respiratory system infographic template
Choose a folder
All favorites
Create new
Save
Human respiratory system infographic template
Pie chart hand drawn PNG Design
Choose a folder
All favorites
Create new
Save
Pie chart hand drawn PNG Design
Premium
Windrose arrow south nord east west line PNG Design
Choose a folder
All favorites
Create new
Save
Windrose arrow south nord east west line PNG Design
Premium
Respiratory system infographic template
Choose a folder
All favorites
Create new
Save
Respiratory system infographic template
Premium
Windrose arrow nord east west south silhouette PNG Design
Choose a folder
All favorites
Create new
Save
Windrose arrow nord east west south silhouette PNG Design
Premium
Windrose arrow west nord south east silhouette PNG Design
Choose a folder
All favorites
Create new
Save
Windrose arrow west nord south east silhouette PNG Design
Simple electric circuit illustration PNG Design
Choose a folder
All favorites
Create new
Save
Simple electric circuit illustration PNG Design
Premium
Windrose arrow east nord west south silhouette PNG Design
Choose a folder
All favorites
Create new
Save
Windrose arrow east nord west south silhouette PNG Design
Premium
Windrose arrow east south nord west flat PNG Design
Choose a folder
All favorites
Create new
Save
Windrose arrow east south nord west flat PNG Design
Premium
Windrose arrow east nord south west flat PNG Design
Choose a folder
All favorites
Create new
Save
Windrose arrow east nord south west flat PNG Design
Premium
Windrose arrow south nord west east flat PNG Design
Choose a folder
All favorites
Create new
Save
Windrose arrow south nord west east flat PNG Design
Editable Template
Premium
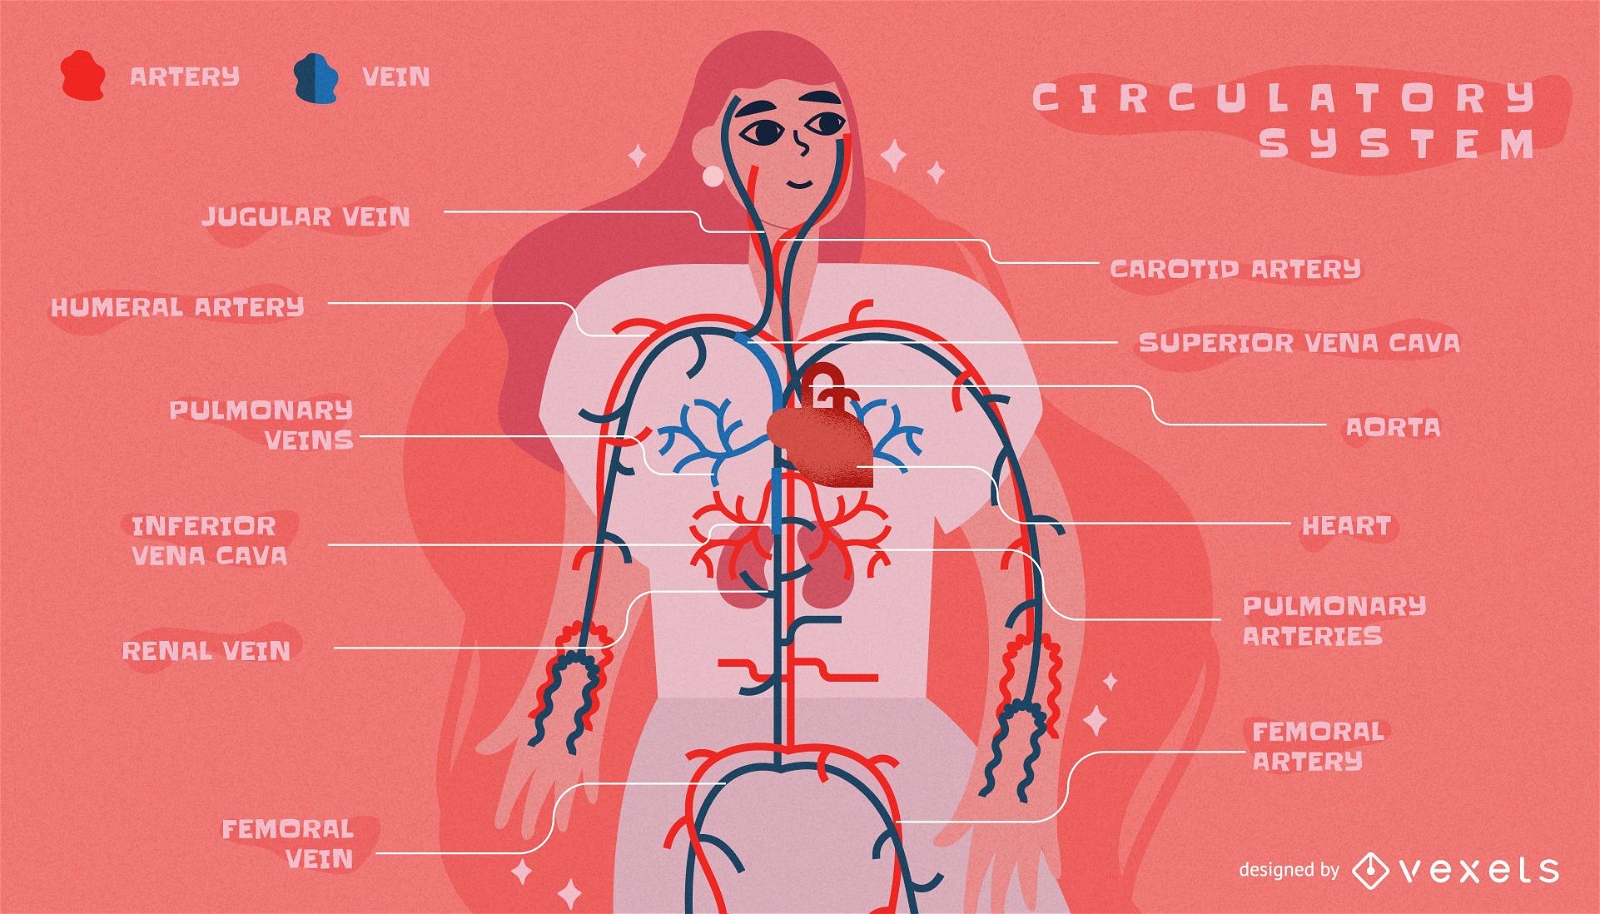
Circulatory system infographic template
Choose a folder
All favorites
Create new
Save
Circulatory system infographic template
Print ready
for Merch
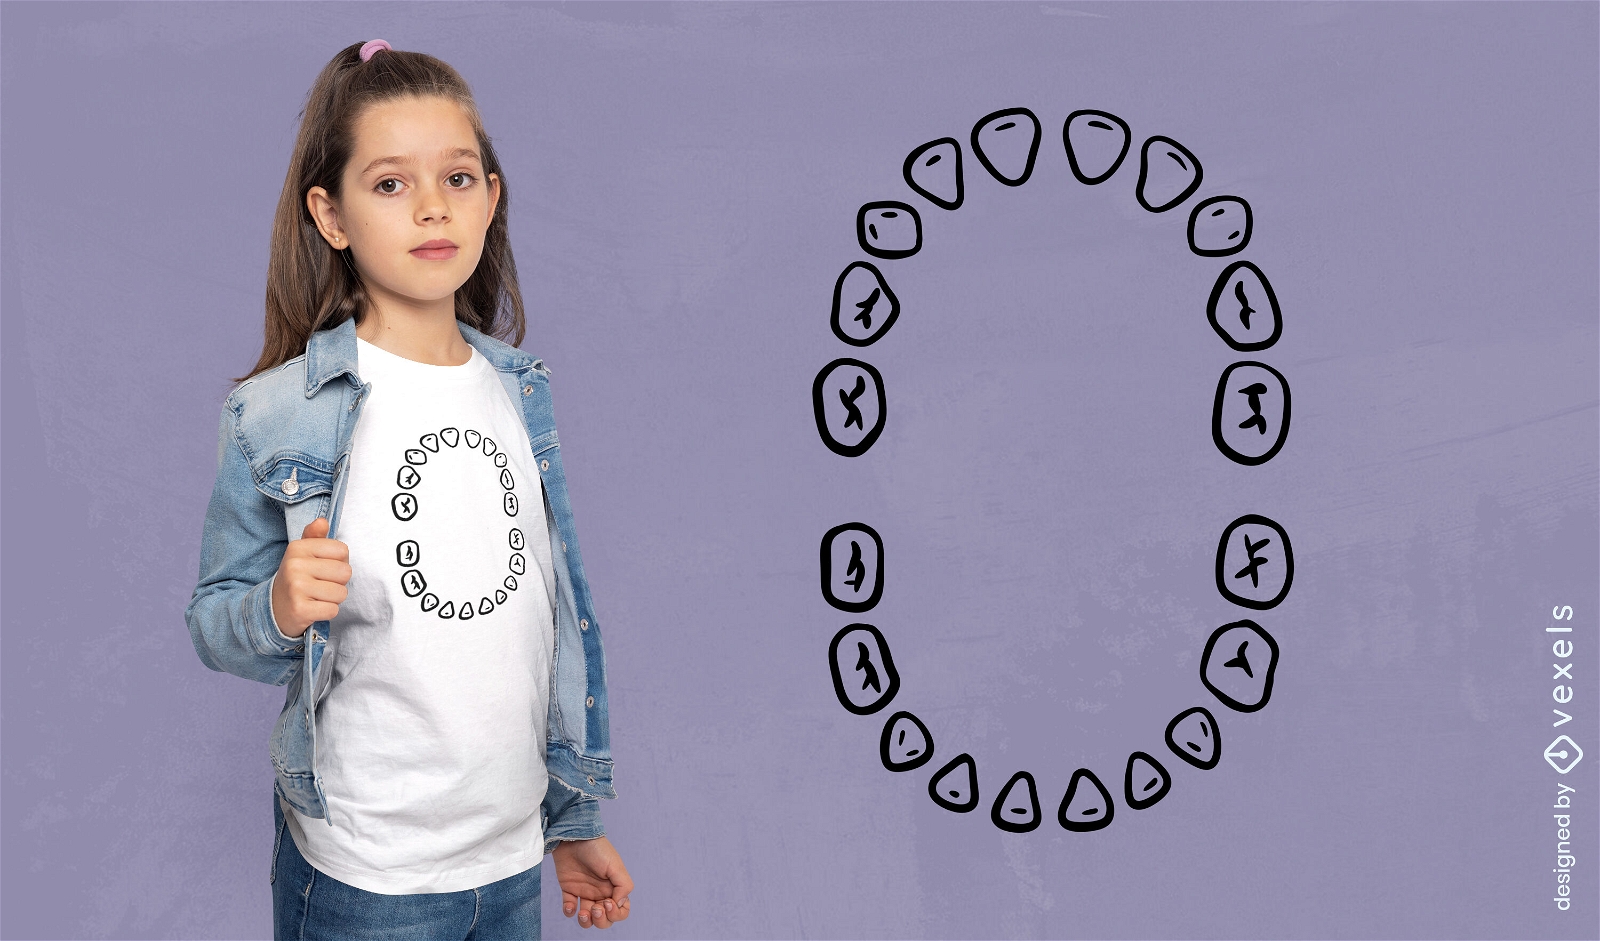
Baby teeth chart t-shirt design
Choose a folder
All favorites
Create new
Save
Baby teeth chart t-shirt design
Premium
Illustration of a tooth PNG Design
Choose a folder
All favorites
Create new
Save
Illustration of a tooth PNG Design
Print ready
for Merch
Scientific formula education t-shirt design
Choose a folder
All favorites
Create new
Save
Scientific formula education t-shirt design
Tibetan Buddhist Symbols And Objects Figure Of Twelve Handheld Objects For Identification And Etiquette Vector
Choose a folder
All favorites
Create new
Save
Tibetan Buddhist Symbols And Objects Figure Of Twelve Handheld Objects For Identification And Etiquette Vector
BLACK FRIDAY
ANNUAL & LIFETIME DEALS
UP TO 60% OFF
Get offer
Next
of 4
prev page
next page


 ANNUAL & LIFETIME DEALS UP TO 60% OFF